Sample Category Title
EUR/AUD Daily Outlook
Daily Pivots: (S1) 1.4870; (P) 1.4910; (R1) 1.4947; More...
Intraday bias in EUR/AUD is turned neutral first, but further rise is in favor as long as 1.4663 minor support holds. On the upside, break of 1.4965 will resume the rise from 1.4281 towards 1.5396 resistance. On the downside, however, break of 1.4663 minor support will turn bias back to the downside for retesting 1.4281 low.
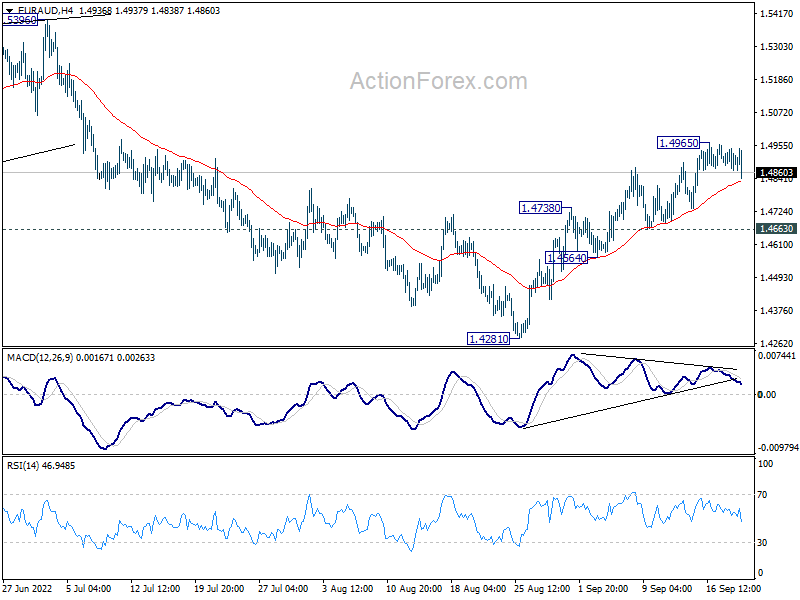
In the bigger picture, down trend from 1.9799 is still in progress. Break of 1.4318 low will target 61.8% projection of 1.9799 to 1.5250 from 1.6434 at 1.3623, which is close to 1.3624 long term support (2017 low). This will remain the favored case now as long as 1.5396 resistance holds.
EUR/JPY Daily Outlook
Daily Pivots: (S1) 142.89; (P) 143.46; (R1) 143.91; More....
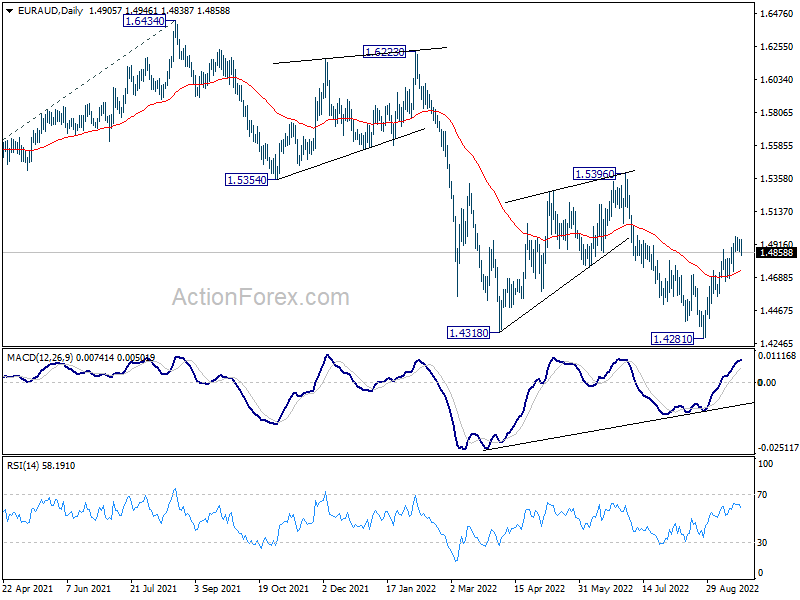
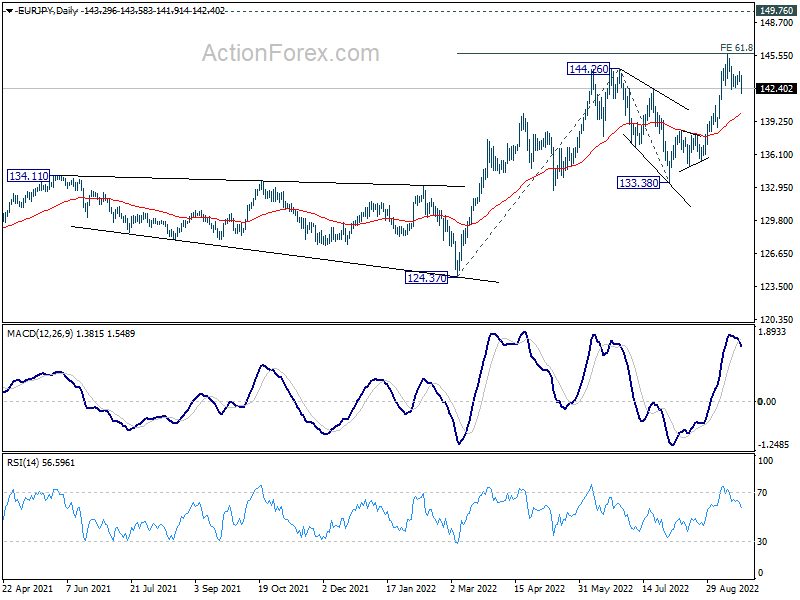
EUR/JPY dips notably as correction from 145.62 extends. Intraday bias stays neutral at this point. Deeper pull back cannot be ruled out. But downside should be contained above 138.38 resistance turned support bring another rally. On the upside, decisive break of 145.62 will pave the way to 149.76 long term resistance, and then 100% projection of 124.37 to 144.26 from 133.38 at 153.27.
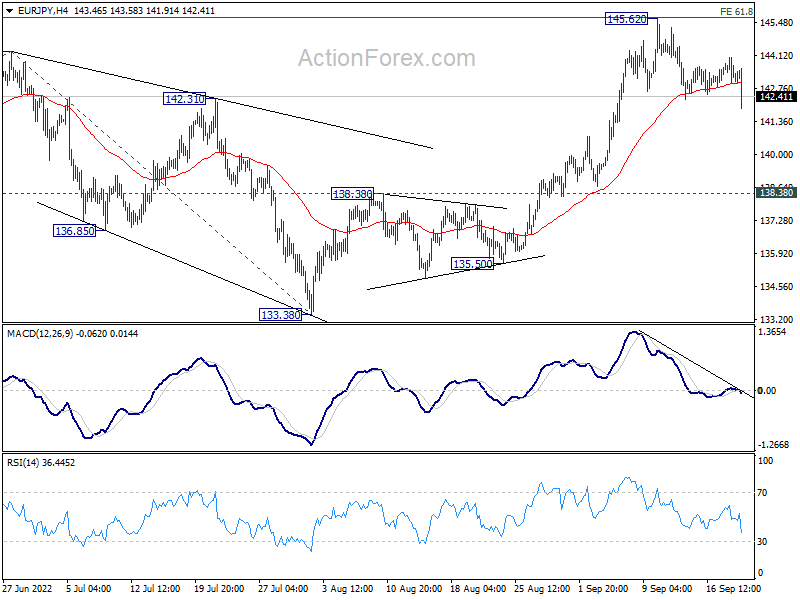
In the bigger picture, up trend from 114.42 (2020 low) is seen as the third leg of the pattern from 109.30 (2016 low). Further rally is in favor as long as 133.38 support holds. Next target is 149.76 (2015 high). However, sustained break of 133.38 will be a sign of medium term bearish reversal and turn focus to 124.37 support for confirmation.
GBP/JPY Daily Outlook
Daily Pivots: (S1) 163.03; (P) 163.73; (R1) 164.33; More...
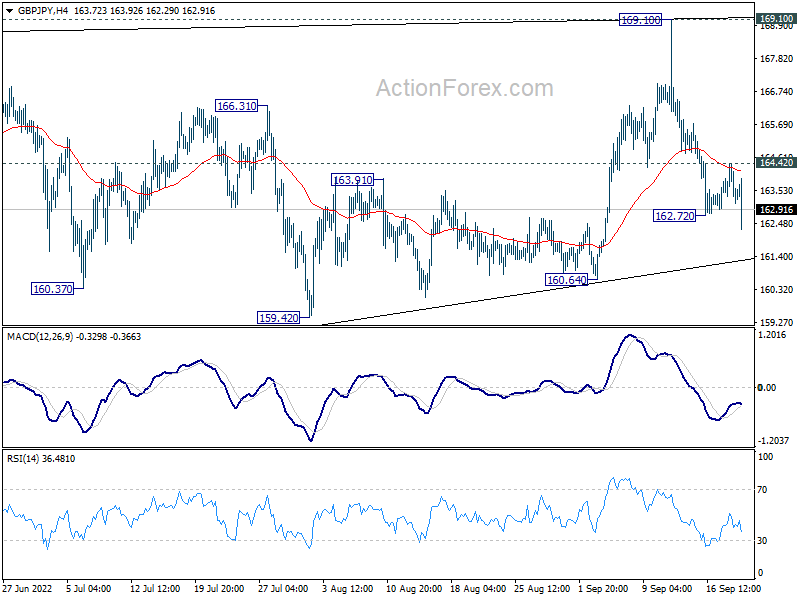
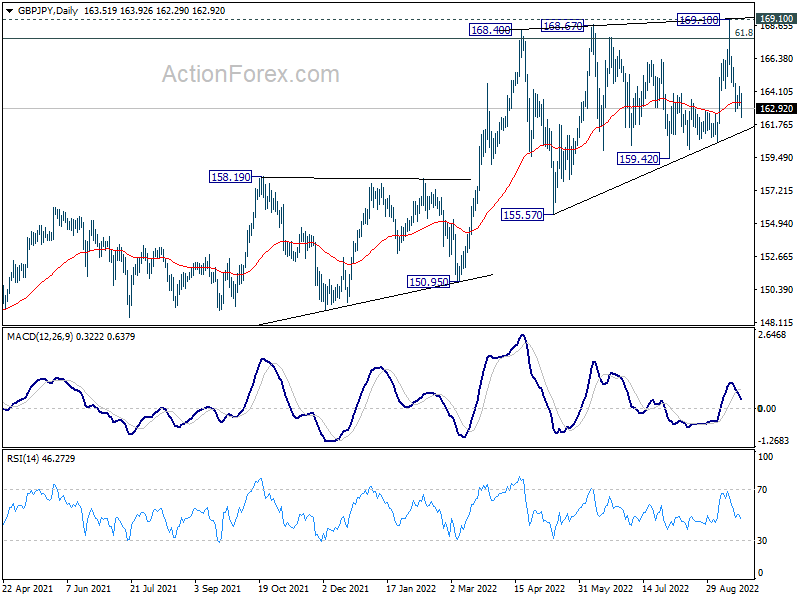
GBP/JPY's fall from 169.10 resumed after brief consolidations. Intraday bias is back on the downside for 159.42. . But downside should be contained there to bring rebound. On the upside, above 164.42 minor resistance will turn intraday bias neutral again. Overall, consolidation from 168.40 is still extending. Firm break of 169.91 will resume larger up trend. However, break of 159.42 support will now be a sign of bearish reversal and target 155.57 support next.
In the bigger picture, up trend from 123.94 (2020 low) is still in progress. Sustained break of 61.8% retracement of 195.86 (2015 high) to 122.75 (2016 low) at 167.93 will be a long term bullish signal, and could pave the way back to 195.86 high. This will remain the favored case as long as 155.57 support holds, even in case of deep pull back.
The Crypto Market Has Laid Low
Market picture
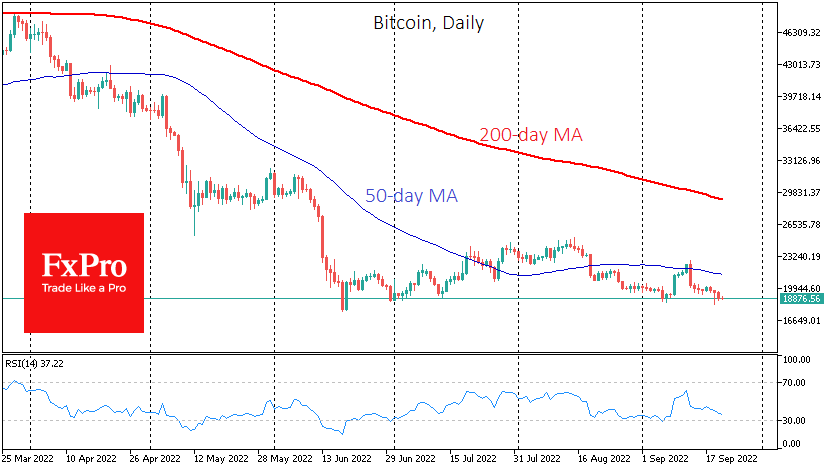
Bitcoin fell 2% to $19K in the past 24 hours as the US dollar rose and stock indices resumed their decline. Despite unfavourable market sentiment ahead of Wednesday’s Fed rate decision, BTC managed to hold off from updating the previous day’s low.
Ethereum lost 1.7% to $1335, with prices for the top altcoins ranging from -2.7% (Shiba Inu) to + 7% (XRP), while total capitalisation fell 1.2% to $927bn, according to CoinMarketCap estimates.
BTCUSD has been trading near the lower end of the trading range for the last three months. The market’s reaction to the Fed’s decision later today will determine whether we see a renewal of lows or a retreat from the bottom. The trend of the last month and a half makes a bearish scenario the main one, but still, surprises are not excluded.
News background
MicroStrategy bought an additional 301 BTC for $6 million at an average price of $19,851 in early August, according to a report filed with the SEC. MicroStrategy’s previous investment in the first cryptocurrency was in June when the firm acquired 480 BTC worth around $10m.
Famous cryptocurrency expert Willie Wu said that futures on the CME exchange are putting significant pressure on bitcoin, and this is, to a large extent, political pressure. The SEC approves cryptocurrency futures ETFs but prohibits the launch of spot funds. That said, hedge funds can short BTC with leverage.
Real Vision founder Raul Pal believes that Solana and Avalanche, cryptocurrencies with their original blockchains, will repeat the dynamics of Ethereum in the previous cycle in the next bullish cycle.
The US exchange Nasdaq is launching a cryptocurrency division that will offer customers digital asset custody services and tools to secure crypto companies.
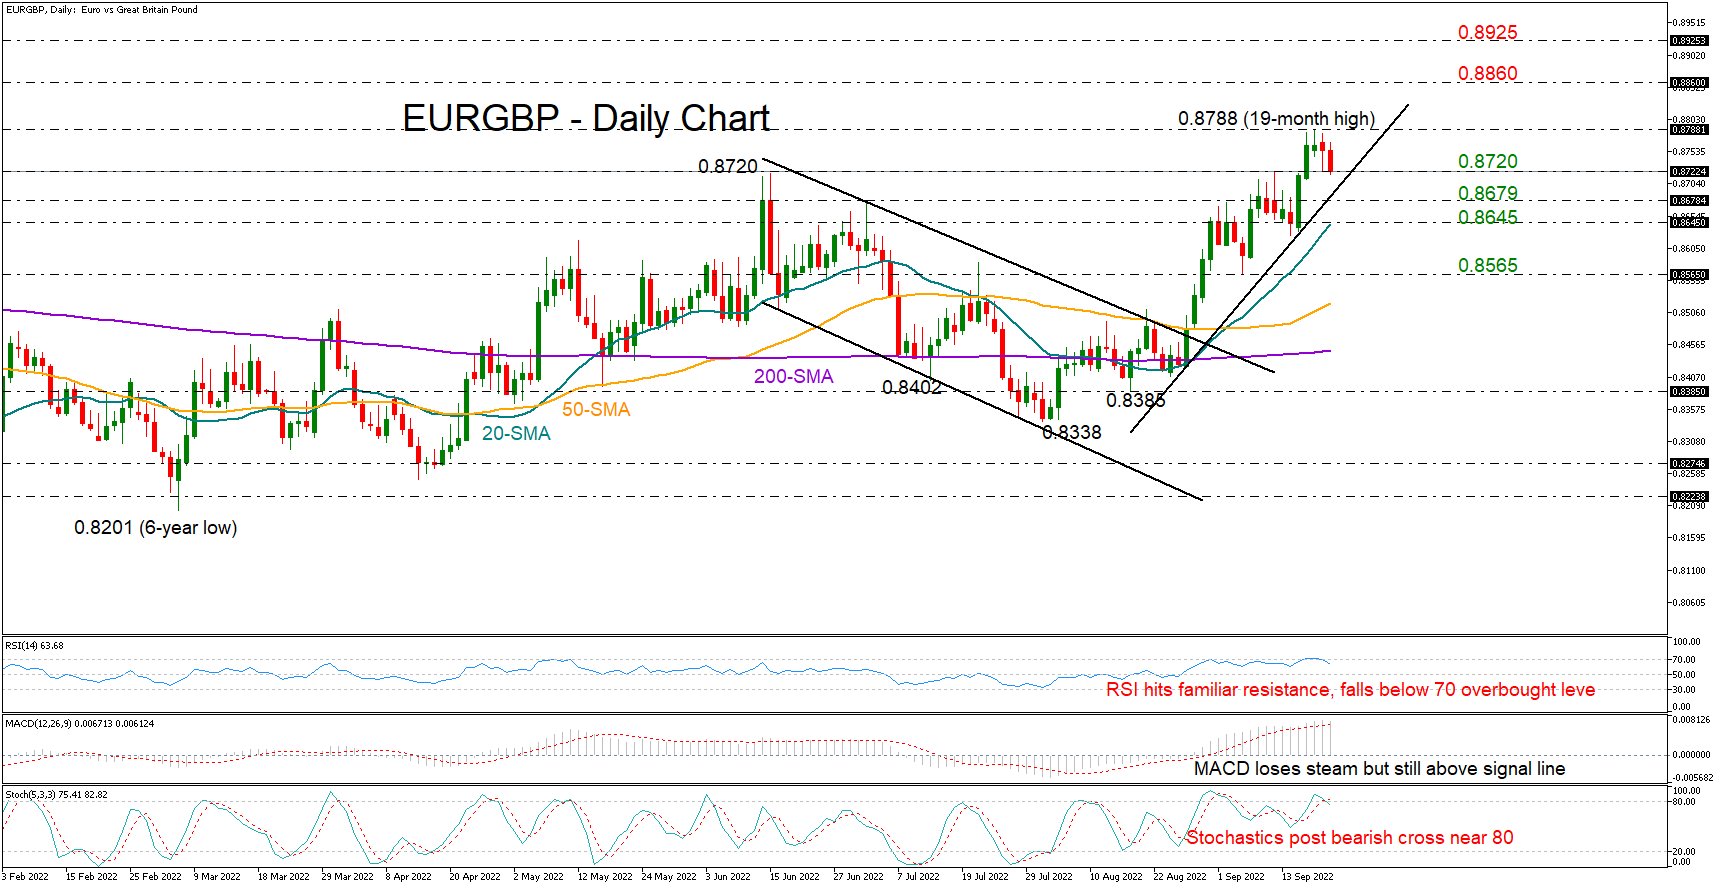
EURGBP Rally Overbought But Still Supported
EURGBP started the week on the back foot after securing seven consecutive green weeks, with the price gradually retreating from Monday's 19-month high of 0.8788.
The 0.8720 level, which switched from resistance to support on Tuesday, is currently under examination on the downside, along with the steep tentative ascending trendline. Should the bears breach that base, selling pressures could intensify towards the 0.8679 bar. Slightly lower, the 20-day simple moving average (SMA) at 0.8645 may cancel any extensions towards the intra-swing low of 0.8565.
According to the momentum indicators, the market is looking overbought and further deterioration is possible as the RSI has slipped back below 70 after hitting a wall near May’s ceiling for the third consecutive time. Meanwhile, the stochastics have posted a bearish cross above their 80 level, while the MACD, although above its red signal line, is showing some signs of weakness as well.
Nevertheless, if buyers defend the pair above 0.8720, the price may attempt to surpass the 0.8788 top and run towards the key 0.8860 constraining zone, which has been a strong barrier to upside and downside moves during April 2020 – January 2021. A decisive close above it may prompt an exciting rally up to the 0.8925 number, last active in January 2021.
Summarizing, EURGBP seems to have reached overbought conditions, backing the current selling forces in the market. However, hopes for an upturn will remain in place as long as the 0.8720 floor stands firm.
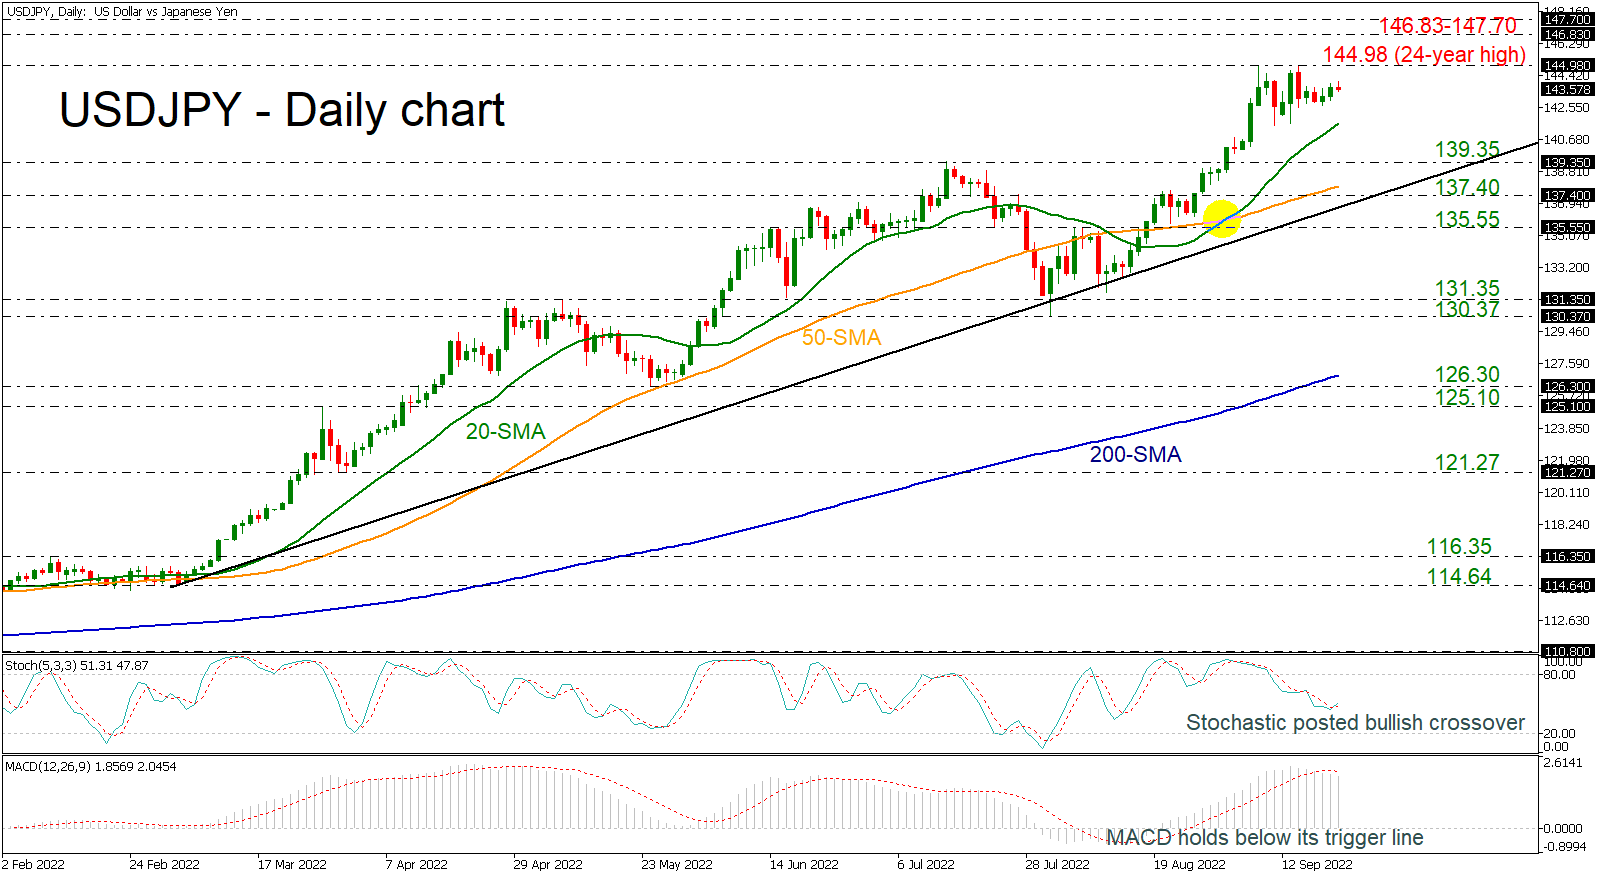
USDJPY Struggles to Surpass 145.00; Consolidates in Short-Term
USDJPY is moving sideways below the 24-year high of 144.98 but remains well above the bullish crossover within the 20- and 50-day simple moving averages (SMAs) and the long-term uptrend line.
Technically, the stochastic oscillator is heading north after the positive cross of the %K and %D lines; however, the MACD oscillator is holding beneath its trigger line in the bullish region.
Immediate resistance to further gains would likely come from the multi-year high of 144.98 that is proved to be a potentially difficult hurdle for the pair to overcome. If there is a successful break above this area, further resistance could be met around the 146.83-147.70, which was a congested region during 1998.
If, however, the strong upside momentum was to lose steam and the pair reversed lower, support would initially come from the 20-day SMA at 141.50. Slipping below this level could take prices towards the 139.35 barrier ahead of the 50-day SMA at 137.90. Failure to hold above the 137.40 support and the uptrend line would switch the focus back to the downside and attention would increasingly turn to the 135.55 barrier.
In the short-term picture, the price is currently moving sideways and is likely to stay as long as prices remains close to the 24-year peak. Any advances above this hurdle would endorse the bullish outlook.
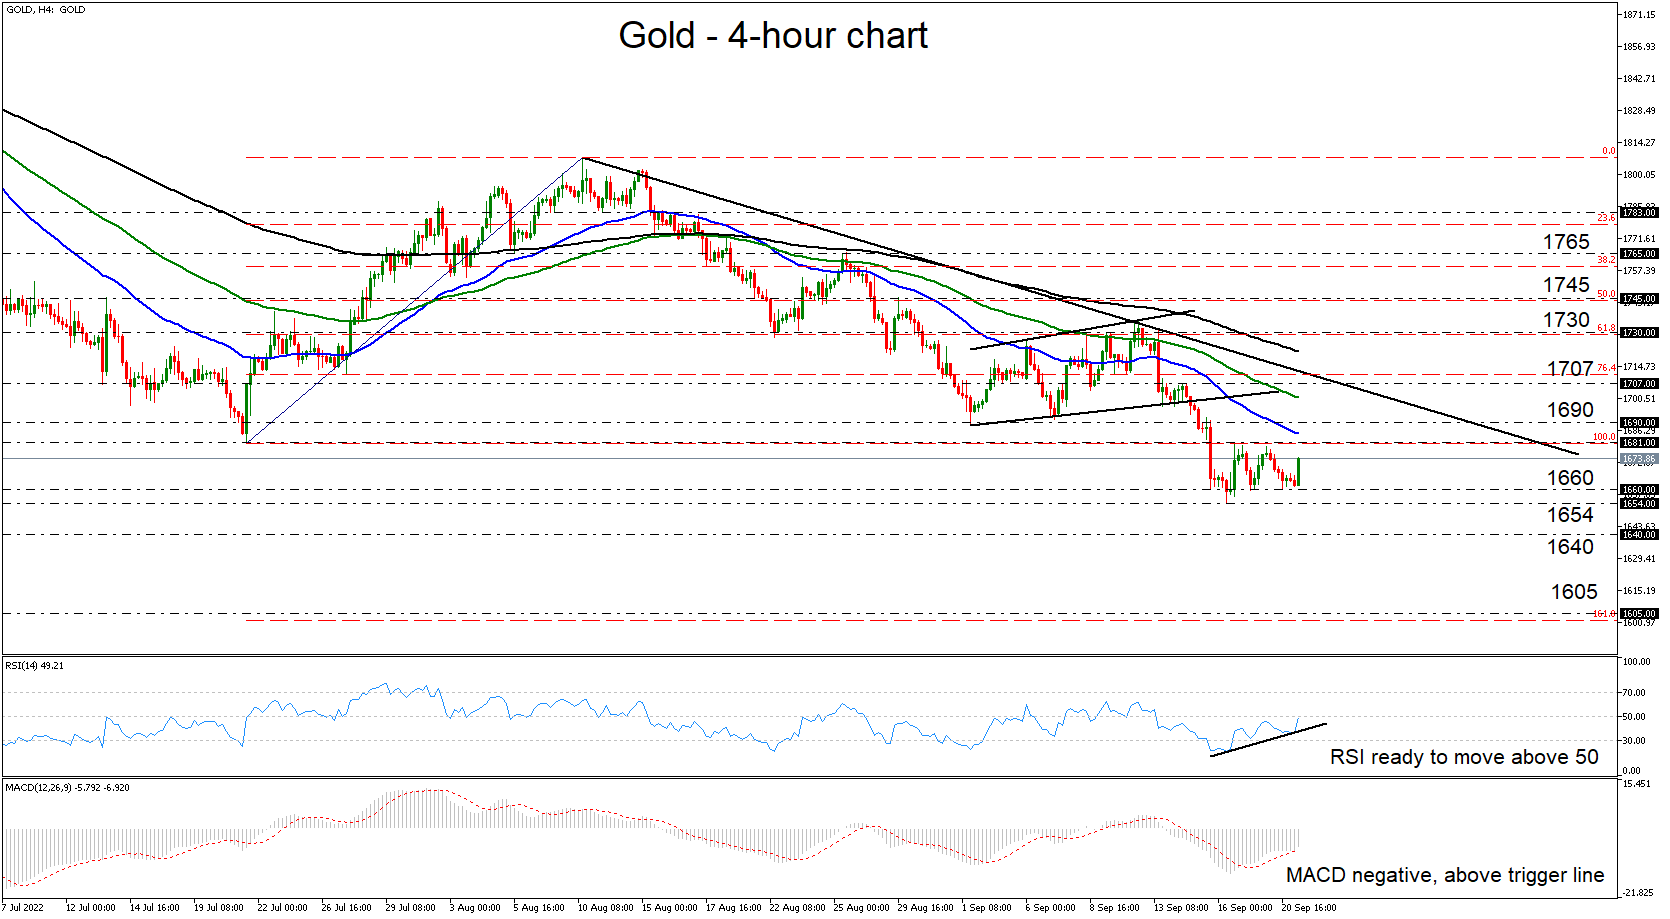
Gold Rebounds from 1,660 Again But Stays in Downtrend
Gold spiked up today, after finding support once again near the 1,660 zone yesterday. Although some further recovery may be on the cards, the precious metal remains in a downtrend and this is supported by the fact that it is trading below a downside line drawn from the high of August 10, as well as below all three of the plotted moving averages.
The short-term oscillators detect diminishing downside speed and add to the idea of some further recovery before the next leg south. The RSI appears ready to poke its nose above its equilibrium 50 line, while the MACD, although negative, has crossed above its trigger line.
The bears may recharge from near the 1681 barrier or from slightly higher at 1,690, a resistance marked by the inside swing low of September 1. If so, a slide and a break below 1,660 may occur, which could result in another test at the 29-month low of 1,654 hit on Friday, or near the 1,640 hurdle. If the latter zone doesn’t hold, then a larger slide may be on the cards, perhaps towards the low of April 6, 2020, at 1,605, which coincides with the 161.8% Fibonacci extension level of the July 21 – August 10 recovery.
On the upside, the move signaling that the bulls have stolen all the bears’ weapons may be a break above 1,707, the September 14 high. This could validate the break above the downside line and may pave the way towards the 1,730 territory, the break of which could see scope for extensions towards the August 29 high at 1,745.
Wrapping up, gold rebounded again from the 1,660 key support but even if it continues a bit higher, as long as it is trading below a downtrend line and all the moving averages, the broader picture remains negative.
Daily Technical Analysis
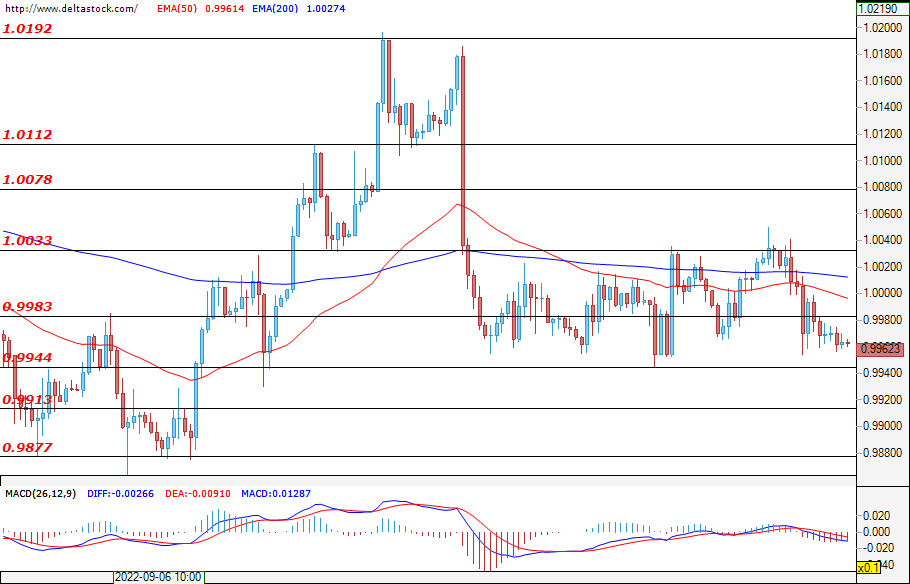
EUR/USD
The support at 0.9988 was overcome in the past session. Afterwards, the movement of the currency pair remained in a narrow range, given the expected important economic data later today. The next support at 0.9944 was not tested and the price managed to hold above it. This does not mean that the downward movement is over, but it is very likely that traders will be cautious and not take any unnecessary risks until the Federal Reserve's decision on the main interest rate comes out at 18:00 GMT and the follow-up press conference at 18:30 GMT. Please note that our analysts will not be publishing technical analysis reports for the rest of the week due to some well-deserved time off.
USD/JPY
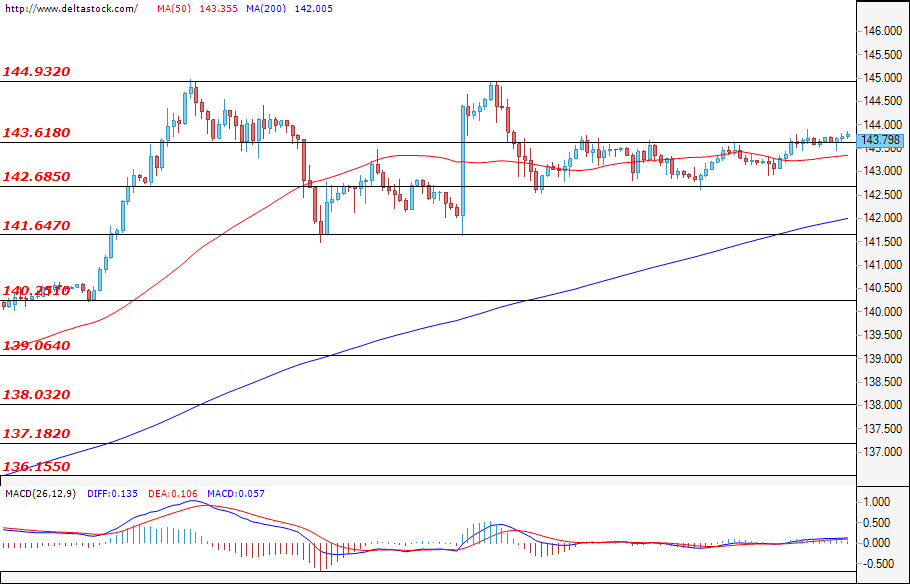
The consolidating move in the currency pair between the support at 142.68 and the resistance at 143.61, that we saw in the past trading session, continued at the start of today’s session as well. The bulls are in control of the market and so a successful breach of the 143.61 level would not be a surprise to anyone. Their next target is the resistance at 144.93. Conversely, if the level that has now become a support at 143.61 and the next target at 142.68 are both overcome, then this would open the way for the bears towards the zone at 141.64, where the bulls should intervene and stop them.
GBP/USD
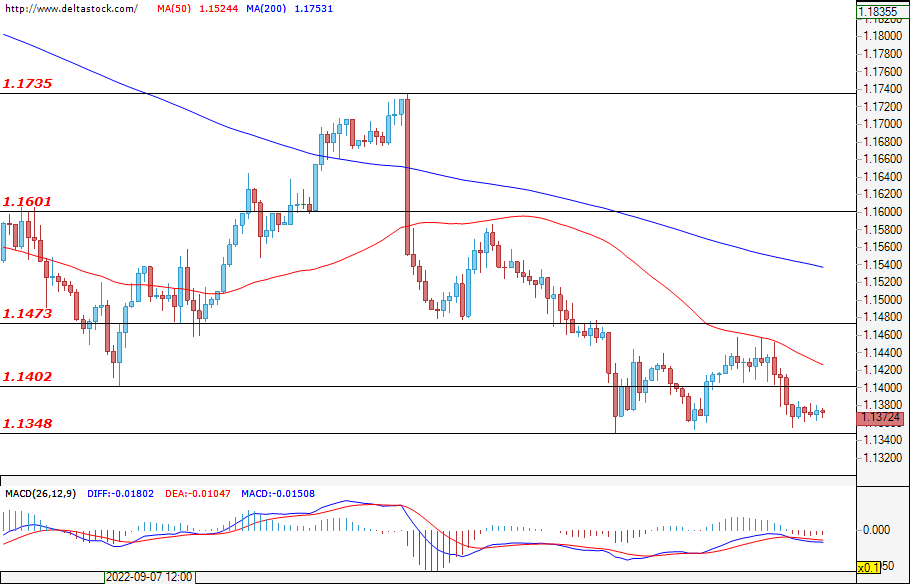
The support at 1.1348 is stopping the bears for now, but that doesn't mean they've given up hope just yet. The bulls need to break through at least three important resistances: 1.1402, 1.1474 and 1.1600, before it could be said that they have achieved any temporary success. We could also witness new record lows for the pound against the dollar.
EUGERMANY40
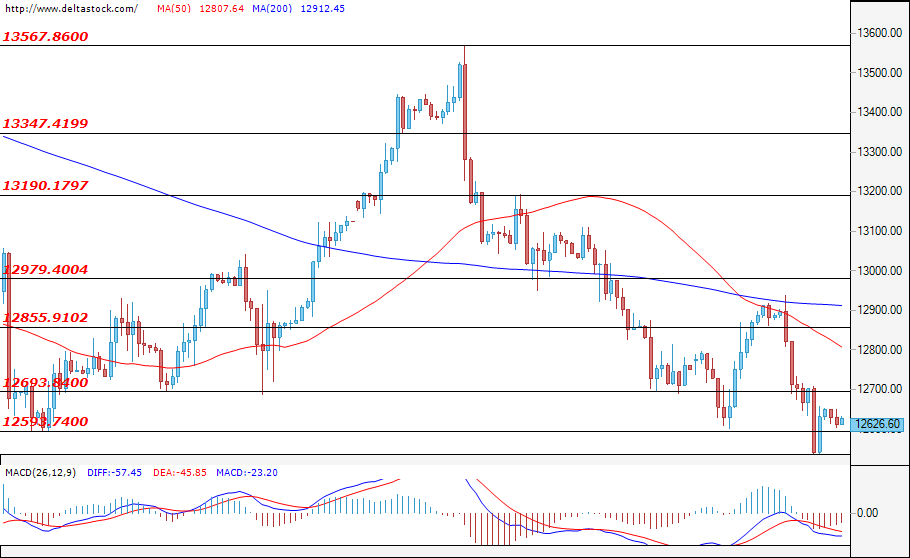
The German index's downward movement has been limited for now as the bears failed to reach the support at 12593. However, they are dominating the market at the moment. The bulls need to overcome at least three targets: the resistances at 12694, 12856, and at 12979, if their push is to be deemed successful. If this does not happen, then it is very likely that the bears will settle in the market for longer than expected.
US30
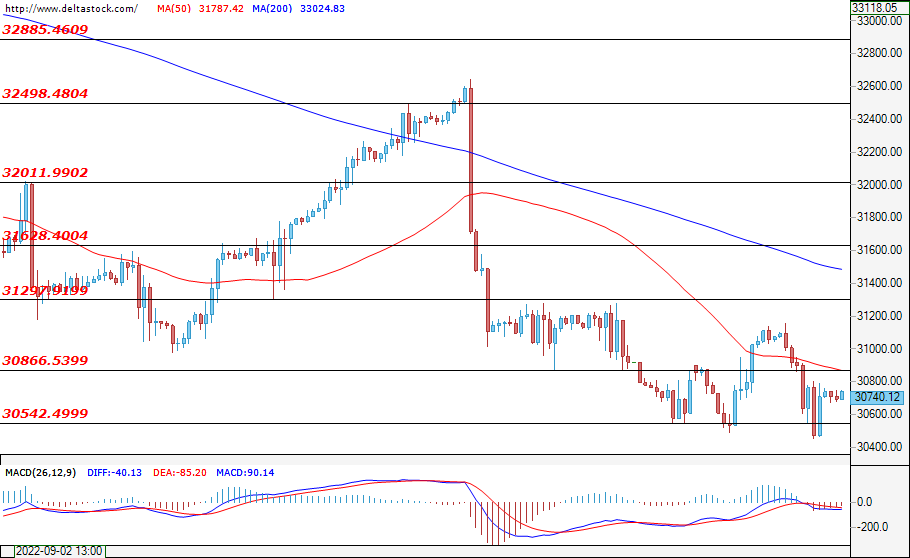
The past session was not successful for the U.S. blue-chip index. It managed to stop its fall only after the bears tested the important support at 30555. At the time of writing, the price is parked at 30725, but if it moves towards the resistance level at 31291 and overcomes it, then it would be possible for the bulls to return to the market.
UK 100 Struggles for Bids
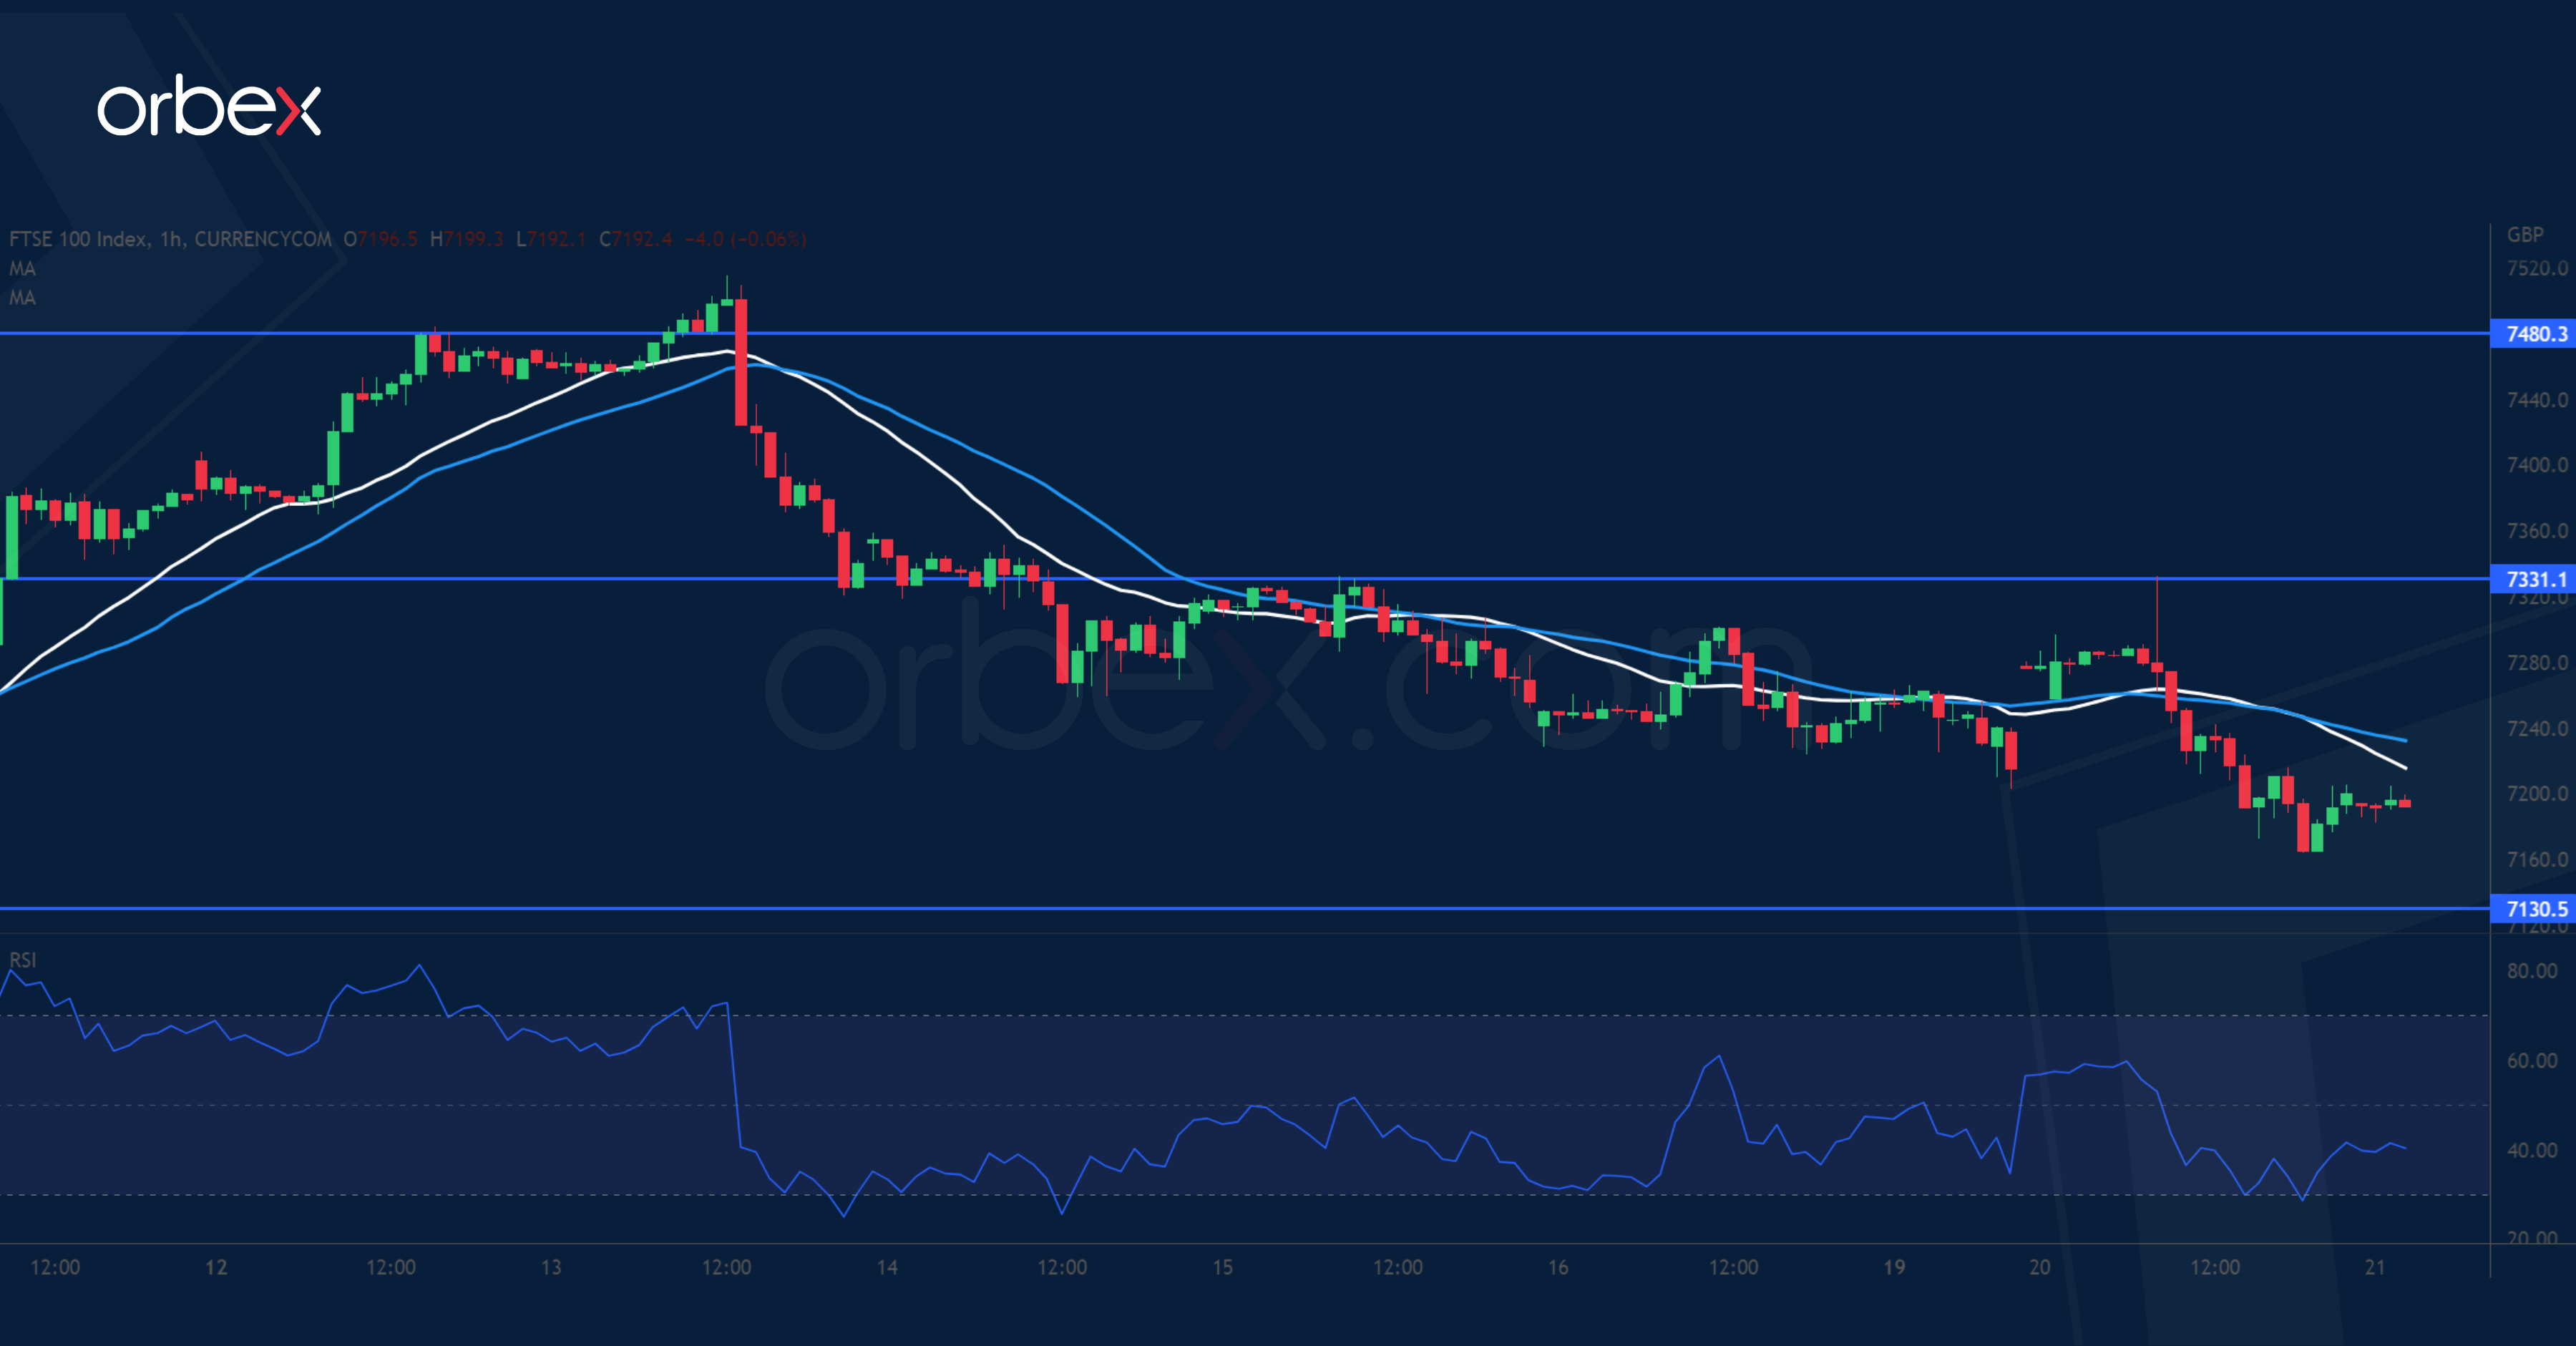
The FTSE 100 slips as expectations of a hawkish BoE weighs on the growth prospect. Buyers’ struggle to hold onto their recent gains above 7230 weighs on sentiment. The latest optimism has waned after a bounce failed to secure 7330, leaving the index vulnerable to another round of sell-off if the bulls start to pull out. 7130 is an important support and its breach could attract momentum sellers and extend losses to July’s lows around 7020. There the FTSE would face the risk of a bearish reversal in the medium-term.
USD/CAD Tests Key Resistance
The Canadian dollar retreated as August’s inflation data fell short of expectations. The rally has gained traction after the pair cleared the double top at 1.3200. Diverging moving averages on the daily chart indicates an acceleration to the upside. As the pair hovers under November 2020’s high at 1.3390, the RSI’s overbought condition may trigger some profit taking, driving the greenback lower momentarily. Buying interest could be expected around 1.3200 from the base of the bullish breakout.