Sample Category Title
USD/CAD Daily Outlook
Daily Pivots: (S1) 1.3272; (P) 1.3324; (R1) 1.3419; More...
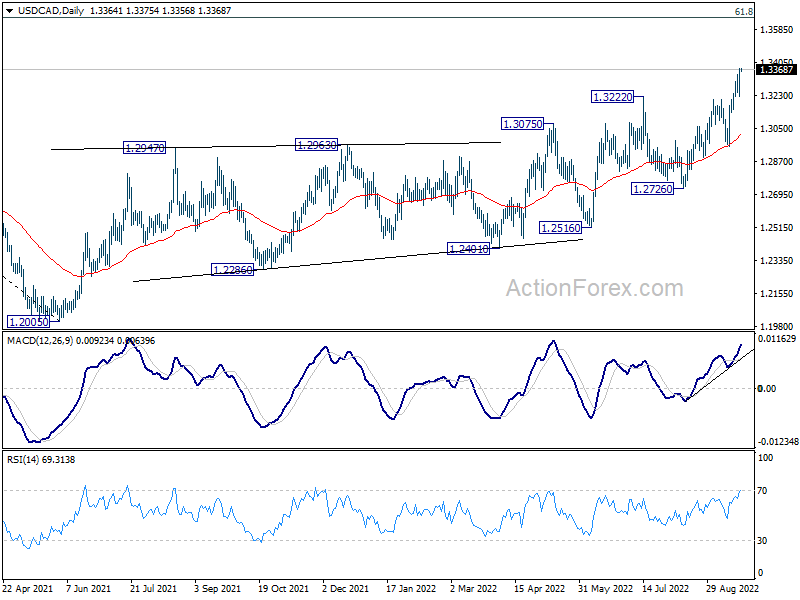
USD/CAD's rally resumed after brief consolidations and intraday bias is back on the upside. Current up trend should target medium term fibonacci level at 1.3650. On the downside, break of 1.3225 minor support is needed to indicate short term topping. Otherwise, outlook will stay bullish in case of retreat.
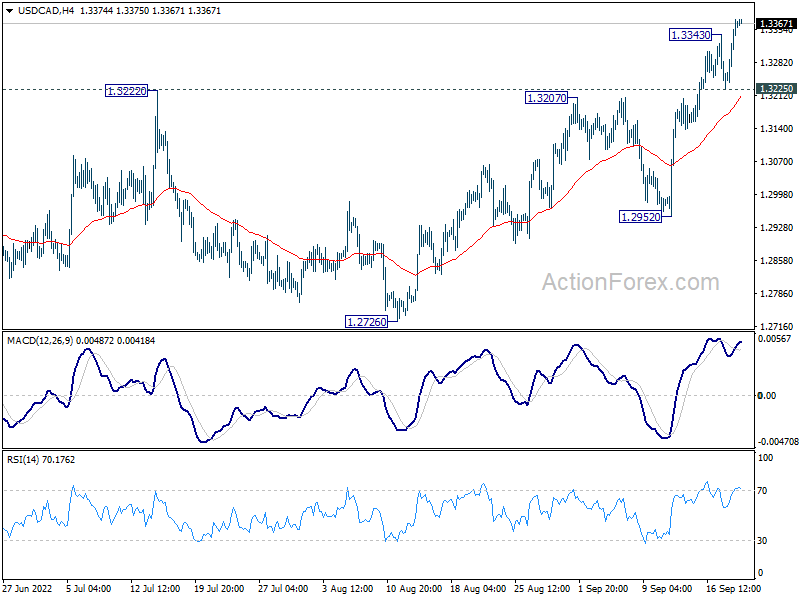
In the bigger picture, down trend from 1.4667 (2020 high) should have completed at 1.2005, after defending 1.2061 long term cluster support. Rise from there should target 61.8% retracement of 1.4667 to 1.2005 (2021 low) at 1.3650. This will remain the favored case now as long as 1.2716 support holds.
Dollar Firm But Lacks Momentum, FOMC Hike Awaited
Dollar is staying as the strongest one for the week as markets await FOMC rate hike. Yet, the greenback is still held below last week's high against most counter parts except Loonie and Kiwi. Swiss Franc is also resilient while markets are speculation a larger than expected hike by SNB later on Thursday. Commodity currencies are generally weak on risk aversion while Yen is pressured by rising major yields. Euro and Sterling are mixed for now.
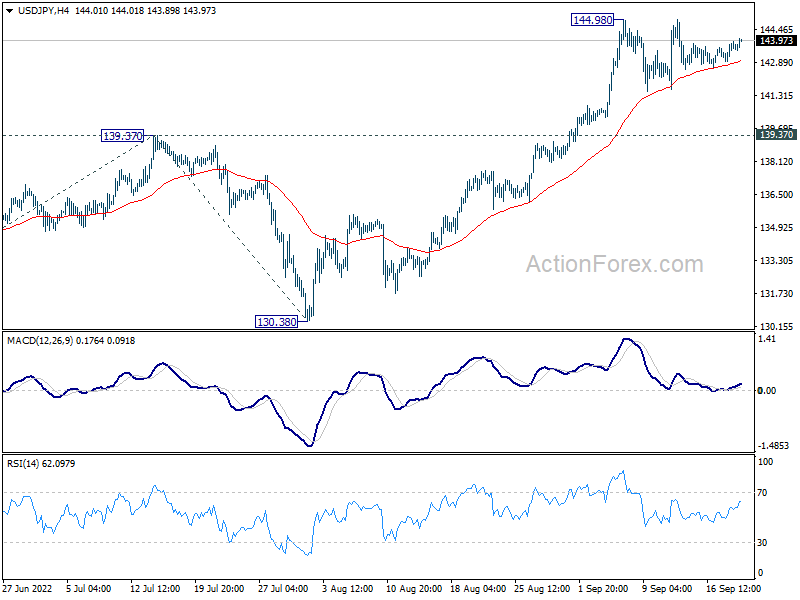
Technically, USD/CAD's break of 1.3343 temporary top overnight was a sign of rally resumption in Dollar. But more breakouts are needed to confirm the greenback's strength. The immediate levels to watch are 144.98 resistance in USD/JPY, and 1.1349 temporary low in GBP/USD, and 0.6680 support in AUD/USD. A more distant level is 0.9863 low in EUR/USD.
In Asia, at the time of writing, Nikkei is down -1.17%. Hong Kong HSI is down -1.24%. China Shanghai SSE is down -0.04%. Singapore Strait Times is up 0.06%. Japan 10-year JGB yield is down -0.0042 at 0.256. Overnight, DOW dropped -1.01%. S&P 500 dropped -1.13%. NASDAQ dropped -0.95%. 10-year yield rose 0.081 to 3.571.
ADB slashes developing Asia growth forecast to 4.3%, China to 3.3%
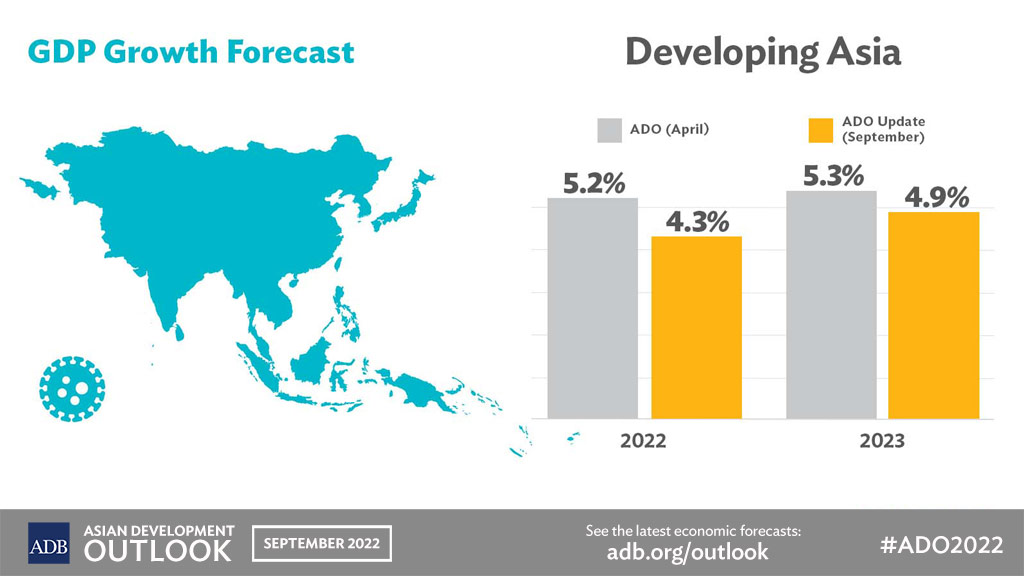
The Asian Development Bank slashed growth forecasts for developing Asia from 5.2% (April forecast) to 4.3% in 2022, and 5.3% to 4.9% in 2023. It said, "The revised outlook is shaped by a slowing global economy, the fallout from Russia's protracted invasion of Ukraine, more aggressive monetary tightening in advanced economies, and lockdowns resulting from the People's Republic of China's zero-COVID policy."
As for China, growth forecasts was downgraded sharply from 5.0% to 3.3% in 2022, and from 4.8% to 4.5% in 2023. India's growth forecast was also cut from 7.5% to 7.0% in 2022, and from 8.0% to 7.2% in 2023.
On the other hand, inflation forecast was raised from 3.7% to 4.5% in 2022, and from 3.1% to 4.0% in 2023, "due to higher energy and food prices".
ECB Lagarde: We will reassess whether a normalization strategy is sufficient
In a speech, ECB President Christine Lagarde said, discussed two considerations for monetary policy, the "destination" and the "pace" to get there.
As for the "destination", she said, "as we move forward, we will reassess whether a normalization strategy is sufficient to bring us back to 2% inflation over the medium term," hinting that interest rate could go into restrictive region.
Meanwhile, the "appropriate pace of future rate increases will be decided on a meeting-by-meeting basis."
RBA Bullock: Interest rate not yet restrictive
RBA Deputy Governor Michele Bullock said interest rate at 2.35% is not yet restrictive. But the central was already looking for opportunities to slow the pace of tightening at some point. The monthly inflation data to be released next week would have a lot of statistical noises, and would unlikely be having much impact of the deliberations at the October meeting.
Regarding the asset purchased during the pandemic bond buying program, Bullock said RBA had taken a mark-to-market valuation loss of AUD 33.9B in 2021/22. That would let the central bank in a negative net equity position of AUD 12.4B. But she added, since it has the ability to create money, the Bank can continue to meet its obligations as they become due and so it is not insolvent... The negative equity position will, therefore, not affect the ability of the Reserve Bank to do its job."
Fed to hike 75bps as 10-year yield resumed up trend
FOMC rate decision is the main focus of the day and another jumbo rate hike is expected. Based on current market pricing, there is 82% chance of a 75bps hike to 3.00-3.25%, and just 18% chance of a 100bps hike to 3.25-3.50%. Thus, there is little chance for Fed to upset the markets.
Overall rhetoric should be unchanged that tightening is set to continue while Fed is committed to bring inflation down to target. The bigger questions are on the new economic projections and the dot plot. Some hawkish surprise could be seen there, which indicates higher terminal rate for current cycle, and a longer period to stay there.
Here are some previews:
- FOMC Meeting Preview: 100bps Unlikely, But Longer Rate Hike Path in Play
- Another Fed Hike is Coming; Mind the Dots
- Is the Fed Preparing to Crash the Markets, Or Will it Give Them a Helping Hand?
- Fed Preview: Fast Pace Hiking Cycle Continues
- September Flashlight for the FOMC Blackout Period
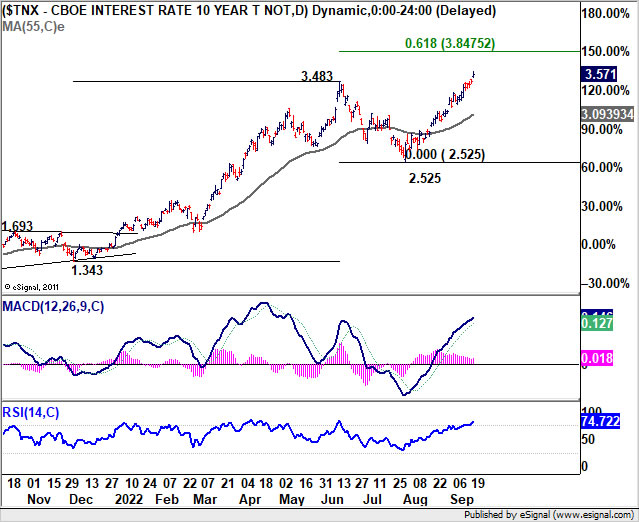
US 10 year yields rose another 0.81 to close at 3.571 overnight, break through prior high at 3.483. The development confirmed resumption of up trend from 2020 low at 0.398. Next target will be 61.8% projection of 1.343 to 3.483 from 2.525 at 3.847. Hawkish surprise in today's FOMC projections could accelerate TNX's path to this target.
Elsewhere
UK will release public sector net borrowing. US will also release existing home sales.
USD/CAD Daily Outlook
Daily Pivots: (S1) 1.3272; (P) 1.3324; (R1) 1.3419; More...
USD/CAD's rally resumed after brief consolidations and intraday bias is back on the upside. Current up trend should target medium term fibonacci level at 1.3650. On the downside, break of 1.3225 minor support is needed to indicate short term topping. Otherwise, outlook will stay bullish in case of retreat.
In the bigger picture, down trend from 1.4667 (2020 high) should have completed at 1.2005, after defending 1.2061 long term cluster support. Rise from there should target 61.8% retracement of 1.4667 to 1.2005 (2021 low) at 1.3650. This will remain the favored case now as long as 1.2716 support holds.
Economic Indicators Update
| GMT | Ccy | Events | Actual | Forecast | Previous | Revised |
|---|---|---|---|---|---|---|
| 00:30 | AUD | Westpac Leading Index M/M Aug | -0.10% | -0.15% | ||
| 06:00 | GBP | Public Sector Net Borrowing (GBP) Aug | 7.5B | 4.2B | ||
| 14:00 | USD | Existing Home Sales Aug | 4.70M | 4.81M | ||
| 14:30 | USD | Crude Oil Inventories | 2.4M | |||
| 18:00 | USD | Fed Interest Rate Decision | 3.25% | 2.50% | ||
| 18:30 | USD | FOMC Press Conference |
Fed to hike 75bps as 10-year yield resumed up trend
FOMC rate decision is the main focus of the day and another jumbo rate hike is expected. Based on current market pricing, there is 82% chance of a 75bps hike to 3.00-3.25%, and just 18% chance of a 100bps hike to 3.25-3.50%. Thus, there is little chance for Fed to upset the markets.
Overall rhetoric should be unchanged that tightening is set to continue while Fed is committed to bring inflation down to target. The bigger questions are on the new economic projections and the dot plot. Some hawkish surprise could be seen there, which indicates higher terminal rate for current cycle, and a longer period to stay there.
Here are some previews:
- FOMC Meeting Preview: 100bps Unlikely, But Longer Rate Hike Path in Play
- Another Fed Hike is Coming; Mind the Dots
- Is the Fed Preparing to Crash the Markets, Or Will it Give Them a Helping Hand?
- Fed Preview: Fast Pace Hiking Cycle Continues
- September Flashlight for the FOMC Blackout Period
US 10 year yields rose another 0.81 to close at 3.571 overnight, break through prior high at 3.483. The development confirmed resumption of up trend from 2020 low at 0.398. Next target will be 61.8% projection of 1.343 to 3.483 from 2.525 at 3.847. Hawkish surprise in today's FOMC projections could accelerate TNX's path to this target.
ADB slashes developing Asia growth forecast to 4.3%, China to 3.3%
The Asian Development Bank slashed growth forecasts for developing Asia from 5.2% (April forecast) to 4.3% in 2022, and 5.3% to 4.9% in 2023. It said, "The revised outlook is shaped by a slowing global economy, the fallout from Russia's protracted invasion of Ukraine, more aggressive monetary tightening in advanced economies, and lockdowns resulting from the People's Republic of China's zero-COVID policy."
As for China, growth forecasts was downgraded sharply from 5.0% to 3.3% in 2022, and from 4.8% to 4.5% in 2023. India's growth forecast was also cut from 7.5% to 7.0% in 2022, and from 8.0% to 7.2% in 2023.
On the other hand, inflation forecast was raised from 3.7% to 4.5% in 2022, and from 3.1% to 4.0% in 2023, "due to higher energy and food prices".
RBA Bullock: Interest rate not yet restrictive
RBA Deputy Governor Michele Bullock said interest rate at 2.35% is not yet restrictive. But the central was already looking for opportunities to slow the pace of tightening at some point. The monthly inflation data to be released next week would have a lot of statistical noises, and would unlikely be having much impact of the deliberations at the October meeting.
Regarding the asset purchased during the pandemic bond buying program, Bullock said RBA had taken a mark-to-market valuation loss of AUD 33.9B in 2021/22. That would let the central bank in a negative net equity position of AUD 12.4B. But she added, since it has the ability to create money, the Bank can continue to meet its obligations as they become due and so it is not insolvent... The negative equity position will, therefore, not affect the ability of the Reserve Bank to do its job."
ECB Lagarde: We will reassess whether a normalization strategy is sufficient
In a speech, ECB President Christine Lagarde said, discussed two considerations for monetary policy, the "destination" and the "pace" to get there.
As for the "destination", she said, "as we move forward, we will reassess whether a normalization strategy is sufficient to bring us back to 2% inflation over the medium term," hinting that interest rate could go into restrictive region.
Meanwhile, the "appropriate pace of future rate increases will be decided on a meeting-by-meeting basis."
AUD/USD At Risk of More Losses, Fed Decision Next
Key Highlights
- AUD/USD declined below the key support at 0.6780.
- It is facing resistance near 0.6750 and 0.6780 on the 4-hours chart.
- Gold and crude oil price is showing signs of bearish continuation.
- The Fed interest rate decision is scheduled today (forecast 3.25%, versus 2.5% previous).
AUD/USD Technical Analysis
The Aussie Dollar started a fresh decline from the 0.6920 zone against the US Dollar. AUD/USD declined below the 0.6840 support to move into a bearish zone.
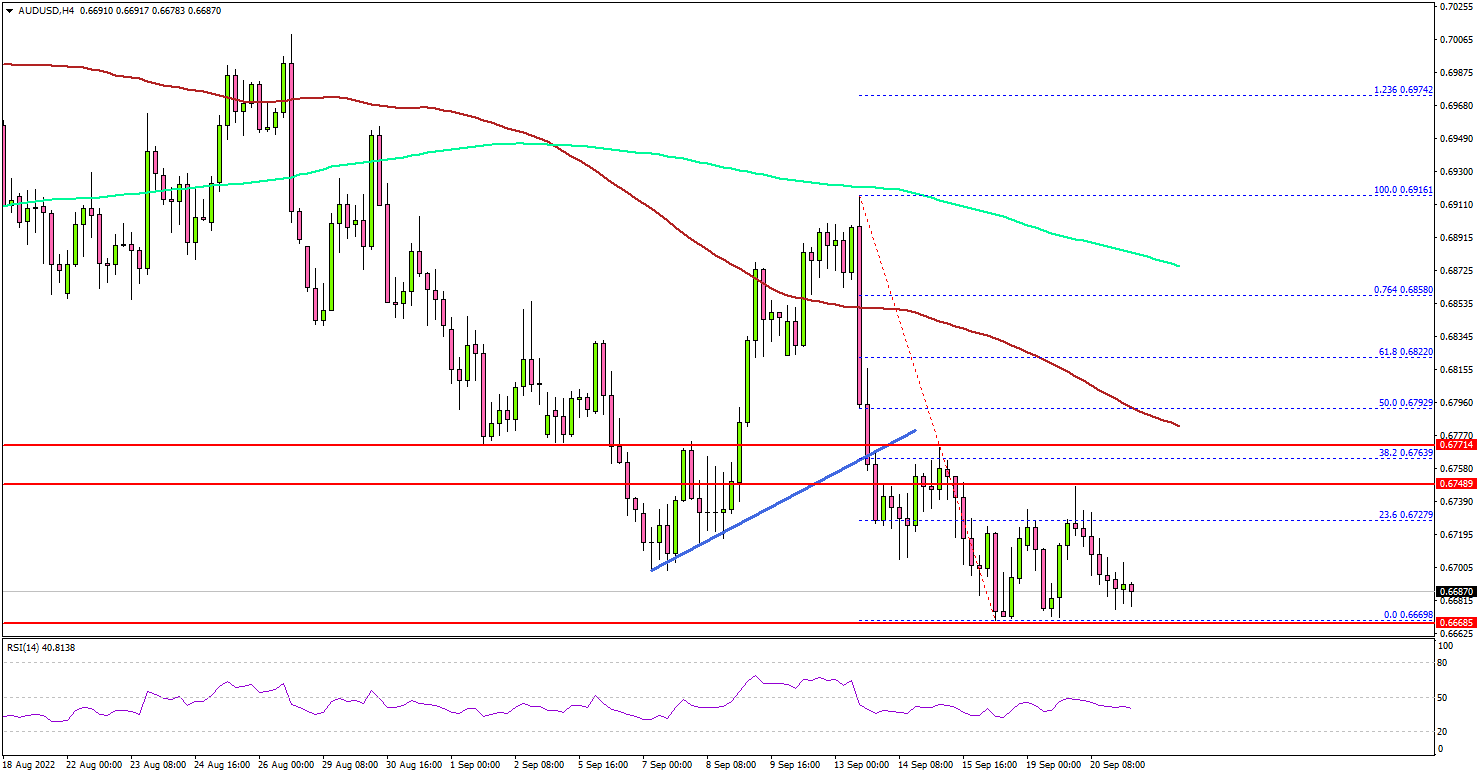
Looking at the 4-hours chart, the pair extended losses below the 0.6780 support, the 100 simple moving average (red, 4-hours), and the 200 simple moving average (green, 4-hours).
The pair even spiked below the 0.6700 level and a low was formed near 0.6669. The pair started a consolidation phase above the 0.6670 level. On the upside, an initial resistance sits near the 0.6750 zone.
The first major resistance is near the 0.6780 level and the 100 simple moving average (red, 4-hours). A clear move above the 0.6750 and 0.6780 levels could open the doors for a decent increase.
In the stated case, the pair might rise towards the 0.6820 resistance zone. Any more gains might send the pair towards the 0.6880 level and the 200 simple moving average (green, 4-hours).
On the downside, an initial support is near the 0.6670 level. A downside break below the 0.6670 support might send the pair towards the 0.6620 level. The next major support is near the 0.6580 level, below which the pair could even test the 0.6500 level in the coming days.
Looking at gold price, the price is facing an increase in selling interest and there is a risk of a move below the $1,650 support zone.
Economic Releases
- Fed Interest Rate Decision - Forecast 3.25%, versus 2.5% previous.
$USDX: The Index Structure Showing an Opportunity to Buy Commodities
The Dollar Index ($USDX) shows five waves since the low on 03.01.2008, which will provide many signals across the Marketplace. Below is a monthly chart of the Dollar Index
$USDX Monthly Elliott Wave
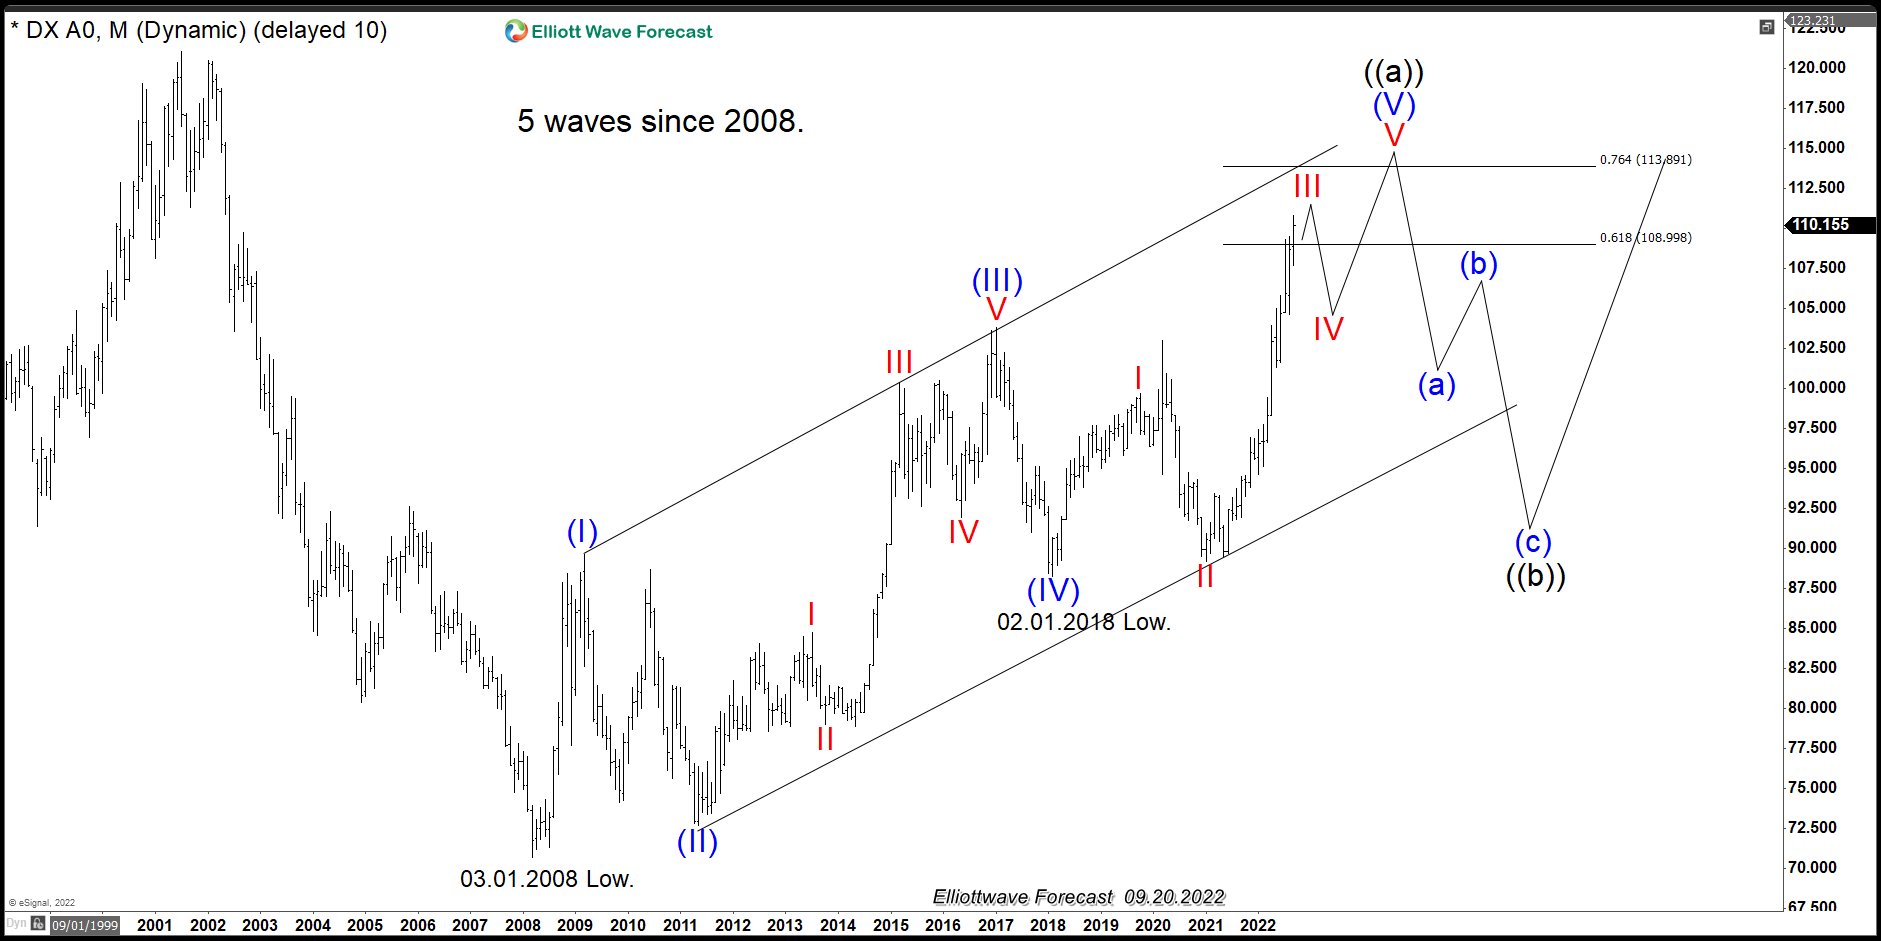
The monthly chart above shows the five waves advance from 3.1.2008 and the different degrees within the cycle. The idea is overall bullish for the USDX. However, there are two possibilities for the Dollar Index. It can make a significant correction soon and drop hard to correct the whole cycle. Alternatively, it will just correct the cycle since the lows at 02.01.2018 and continue higher.
We have found out at EWF that the most significant advantage of the Theory is the understanding of the sequence. Every time wave five appears, there is a clear right side and, consequently, opportunities. As we can see in the chart, since the lows at 03.01.2008, there are five swings in Blue. This gives a temporary warning for the $USDX buyers. It has also reached 61.8%-76.4% fiboancci extension between (I) and (II), which is usually an area where wave five can end. As we said, there are two outcomes. The first one is the classic pattern in the Elliott Wave Theory, which is presented in the following chart:
Elliott Wave Impulse and Zigzag Cycle
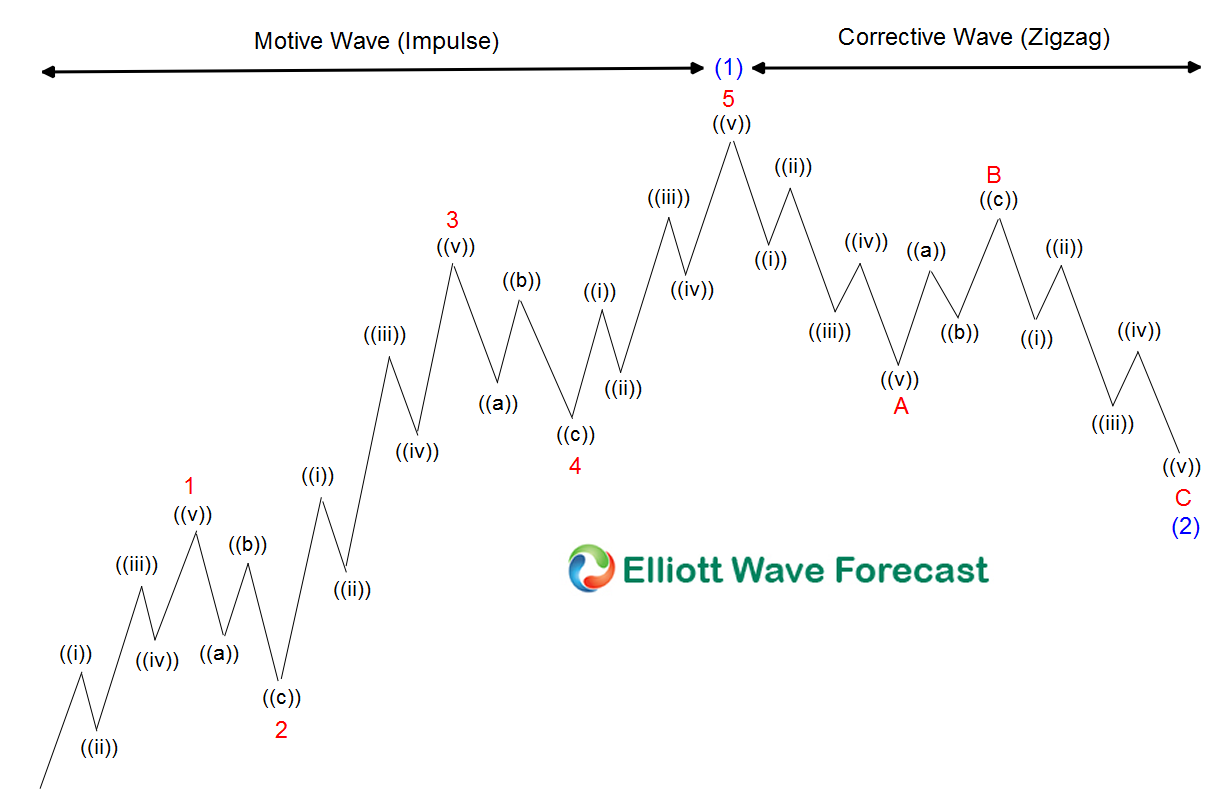
The above chart shows after five waves, a big sell-off of the Dollar can happen soon. If we downgrade the cycle since 02.01.2018 it looks to be missing wave IV and V. But this does take away the warning across the Market that Dollar can soon pullback.
The Second scenario is from the same lows at 03.01.2008, the Index is showing the same five waves. But in this case, we call them five swings, which is a huge difference. The following chart shows the structure:
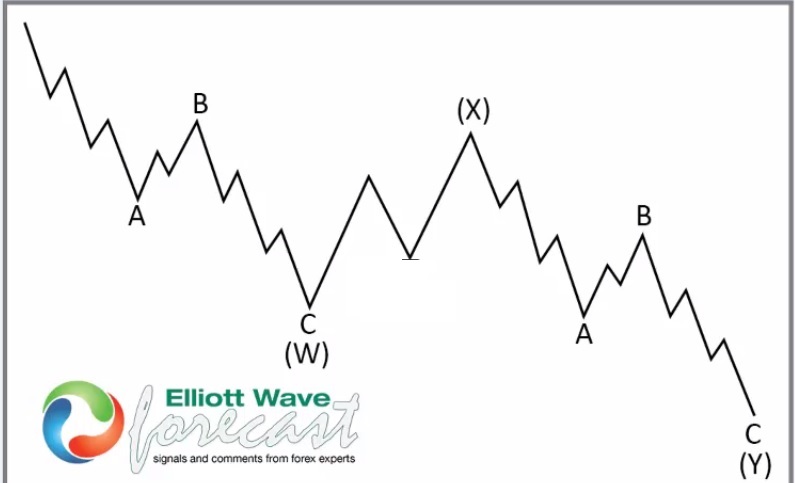
The above chart shows a WXY structure. It combines two cycles of three waves or two ABCs in the Elliott Wave Theory. In this second scenario, the Index should end swing five off the lows at 02.01.2018, but the pullback should be less than scenario one.
Professional traders understand the whole market and always look for the instrument showing clear structures. They then look for opportunities to buy/sell what we call Elliott Wave hedging, which is when both sides of the Market (i.e. buyers and sellers), agree on a reaction. Looking at the USDX structure and analyzing both scenarios, 2023 can see a pullback in the USDX. The Elliott Wave structure is however clear that the higher degree right side is bullish. The Index should be supported for a long time. Commodities lead the USDX pairs, trading in the second dimension when they agree in the swing direction but not the overall direction. It is evident in the following chart:
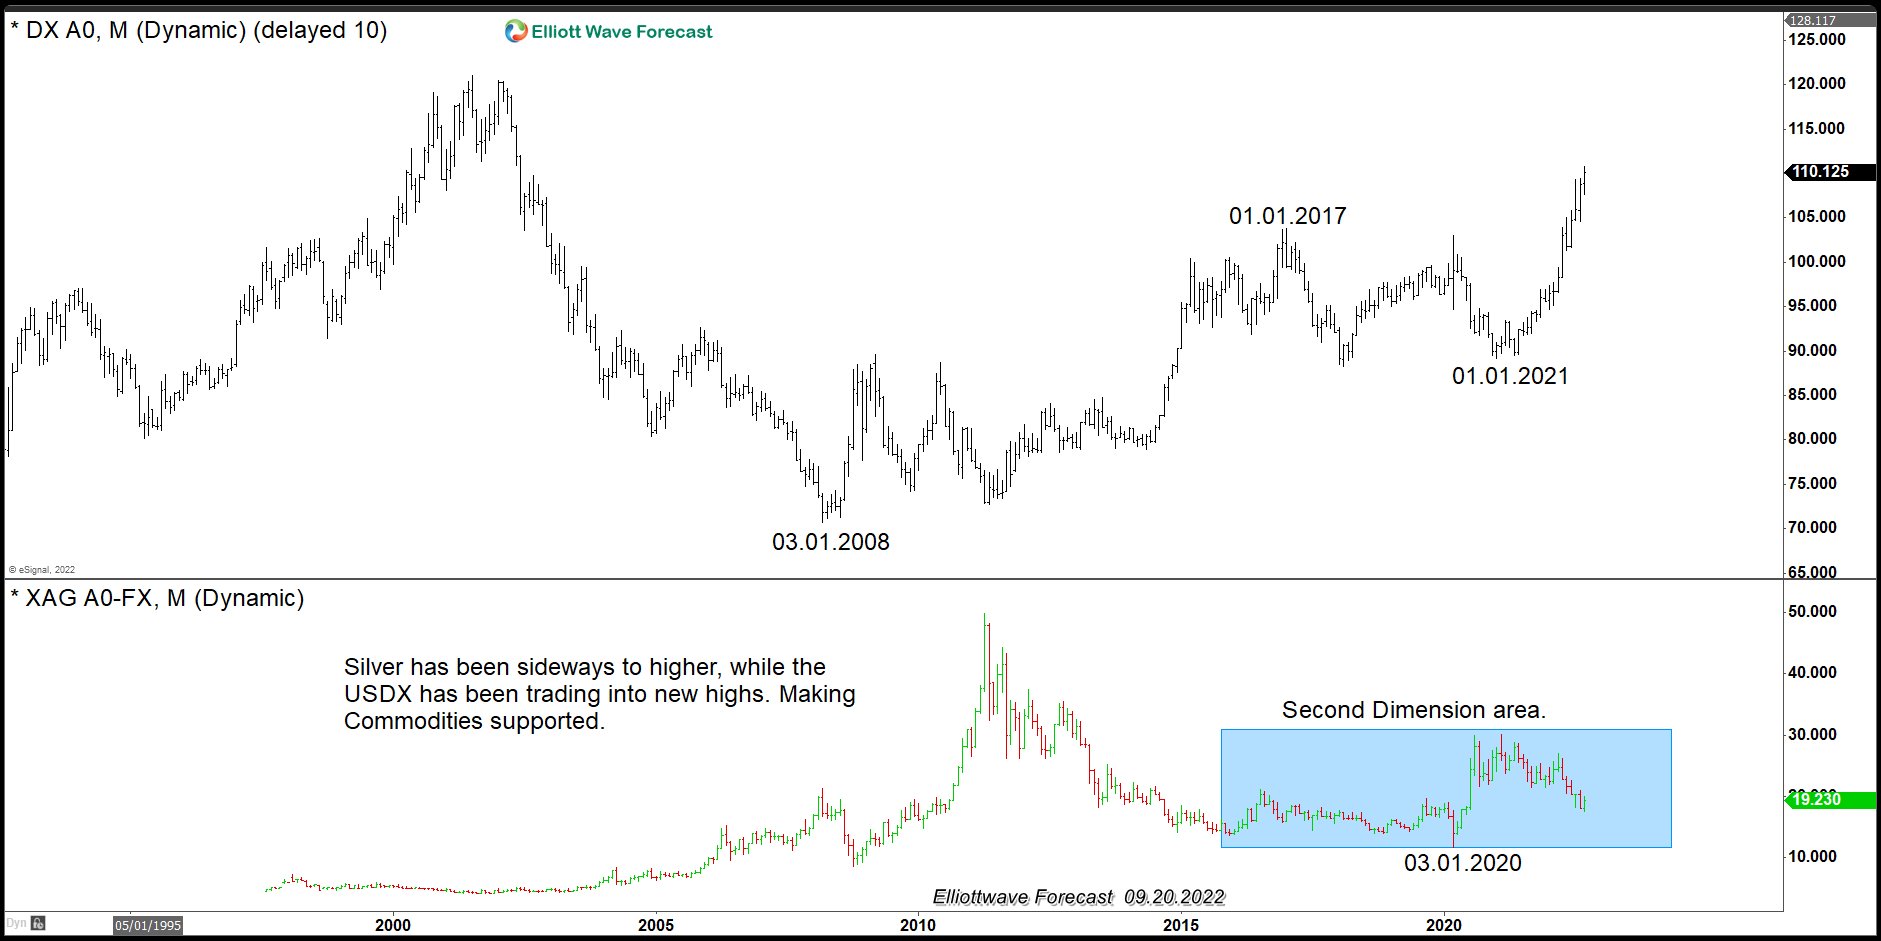
The $USDX Monthly charts overlay with $XAGUSD (Silver); as we can see, the metal should not be trading below zero and has been holding the lows, while the USDX is close to a peak. Understanding and reading the market makes a huge difference in being on the right side and knowing which instruments to trade.
In Conclusion: 2023 might provide a pullback in the USDX, which means higher $EURUSD, $AUDUSD, $NZDUSD, $GBPUSD, and higher commodities. Commodities should hold stronger against the $USDX, and provide a better buying into 2023.
Elliott Wave View: DAX Resumes Lower
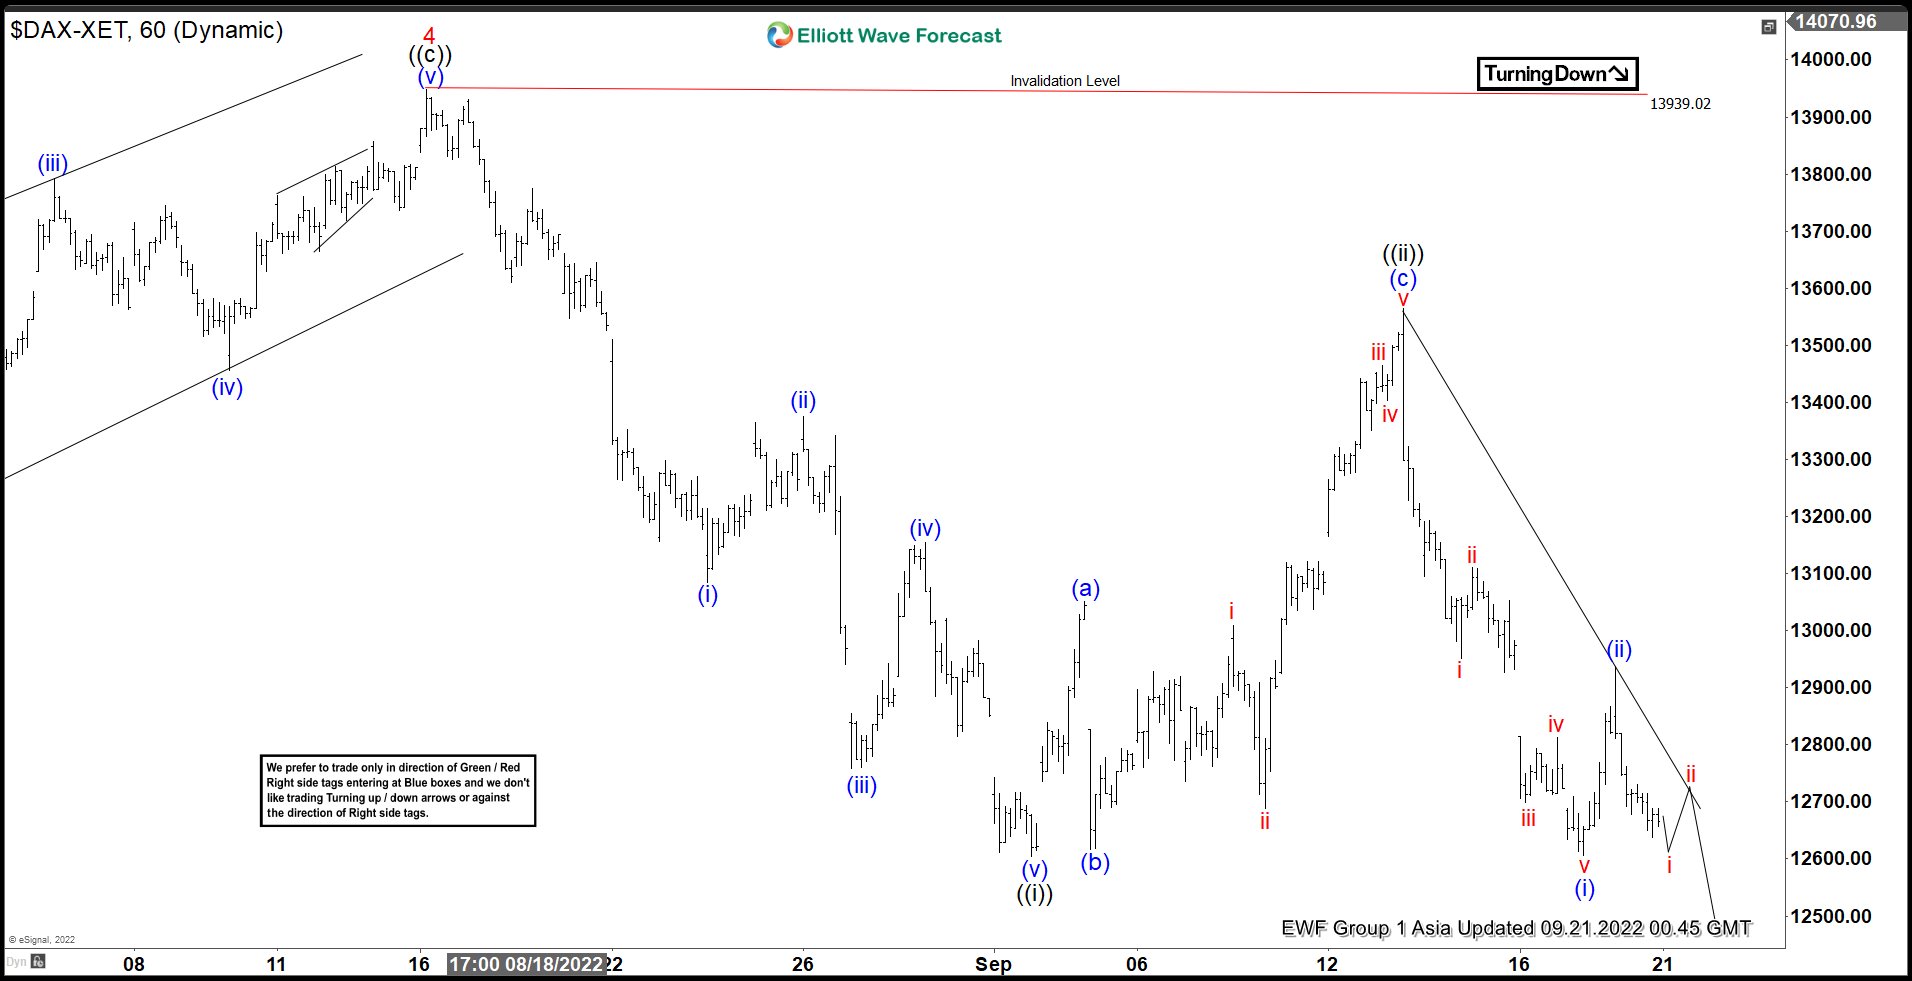
Short term Elliott Wave view on DAX suggests the decline from 3.29.2022 high is unfolding as a 5 waves diagonal. Down from 3.29 high, wave 1 ended at 13386.32 and rally in wave 2 ended at 14709.38. Index then resumes lower in wave 3 towards 12390.95, and rally in wave 4 ended at 13939.02. Wave 5 lower is currently in progress with subdivision a 5 waves impulse in lesser degree.
Down from wave 4, wave (i) ended at 13085.20 and rally in wave (ii) ended at 13375.05. Wave (iii) lower ended at 12758.44, wave (iv) rally ended at 13154.15, and final leg lower wave (v) ended at 12603.58 which completed wave ((i)). Wave ((ii)) corrective rally ended at 13564.83 with internal subdivision as a zigzag structure. Up from wave ((i)), wave (a) ended at 13051.57, wave (b) ended at 12617.40 and wave (c) ended at 13564.83. Index has turned lower again in wave ((iii)) of 5. Down from wave ((ii)), wave (i) ended at 12606.64 and wave (ii) rally ended at 12936.57. Near term, as far as pivot at 13939.02 high stays intact, expect rally to fail in 3, 7, or 11 swing for further downside.
DAX 60 Minutes Elliott Wave Chart
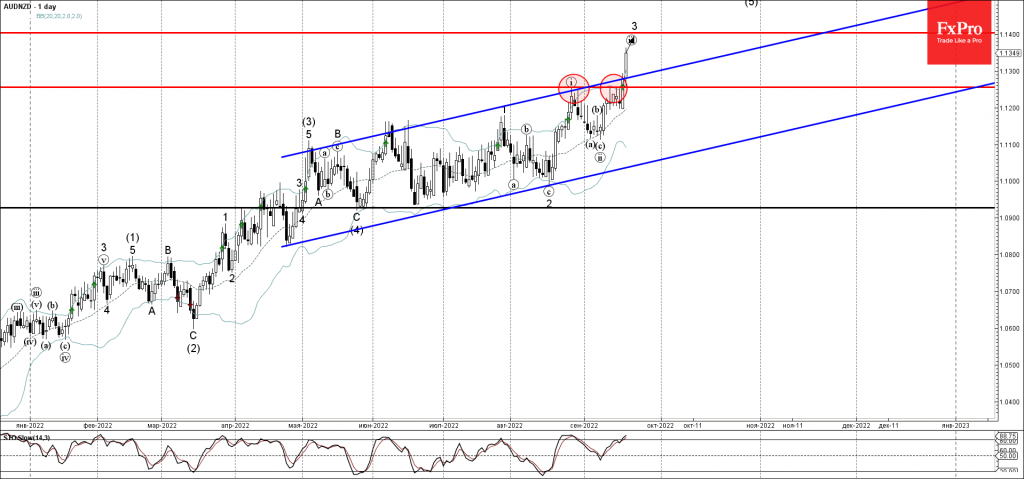
AUDNZD Analysis
- AUDNZD broke resistance level 1.3200
- Likely to rise to resistance level 1.1400
AUDNZD currency pair recently broke above the resistance level 1.3200 (which has been reversing the price from the end of April).
The breakout of the resistance level 1.3200 coincided with the breakout of the extended up channel from April, which accelerated the active impulse waves 3 and (3).
AUDNZD can be expected to rise further toward the next resistance level 1.1400 (target for the completion of the active impulse wave 3).