Sample Category Title
EUR/USD Daily Outlook
Daily Pivots: (S1) 0.9984; (P) 1.0007; (R1) 1.0047; More...
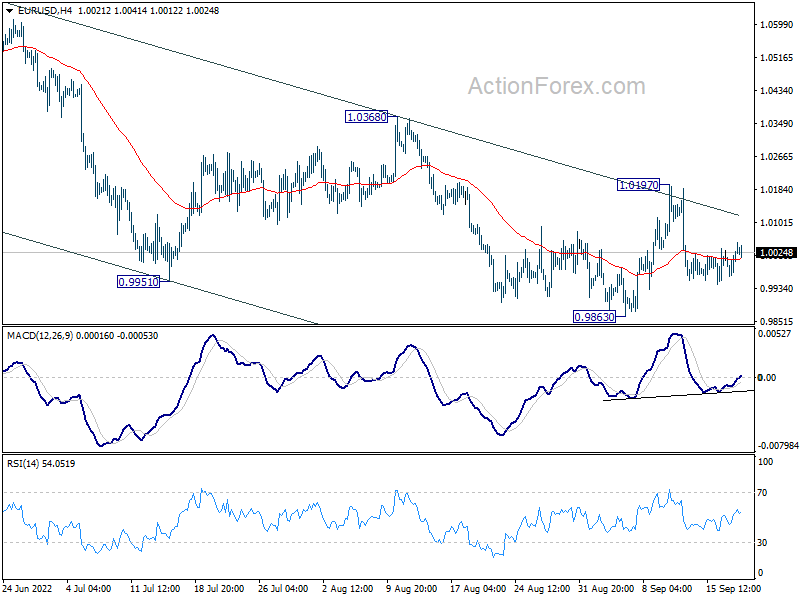
Range trading continues in EUR/USD and intraday bias stays neutral. Outlook also remains bearish. On the downside, firm break of 0.9863 support will resume larger down trend. On the upside, break of 1.0197 resistance will now raise the chance of larger trend reversal, and target 1.0368 resistance.
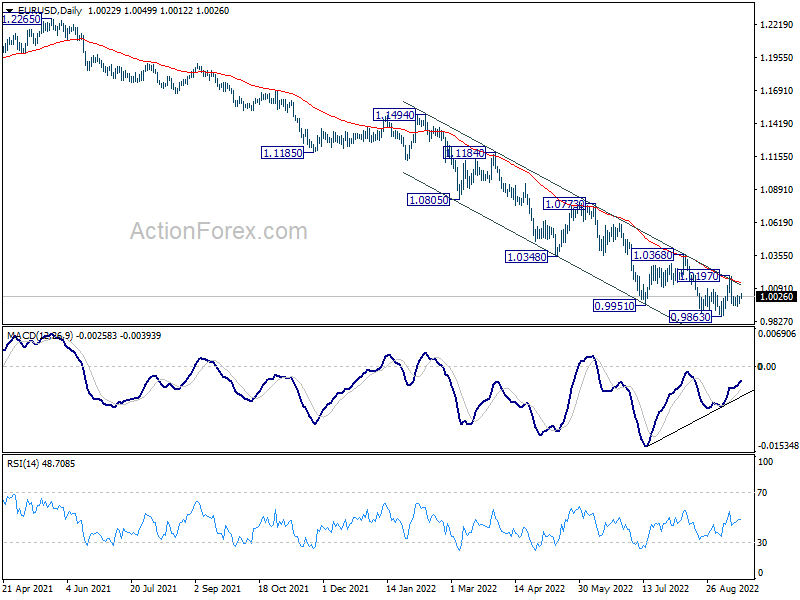
In the bigger picture, down trend from 1.6039 (2008 high) is still in progress. Next target is 100% projection of 1.3993 to 1.0339 from 1.2348 at 0.8694. In any case, outlook will stay bearish as long as 1.0368 resistance holds, in case of strong rebound.
GBP/USD Daily Outlook
Daily Pivots: (S1) 1.1380; (P) 1.1411; (R1) 1.1466; More...
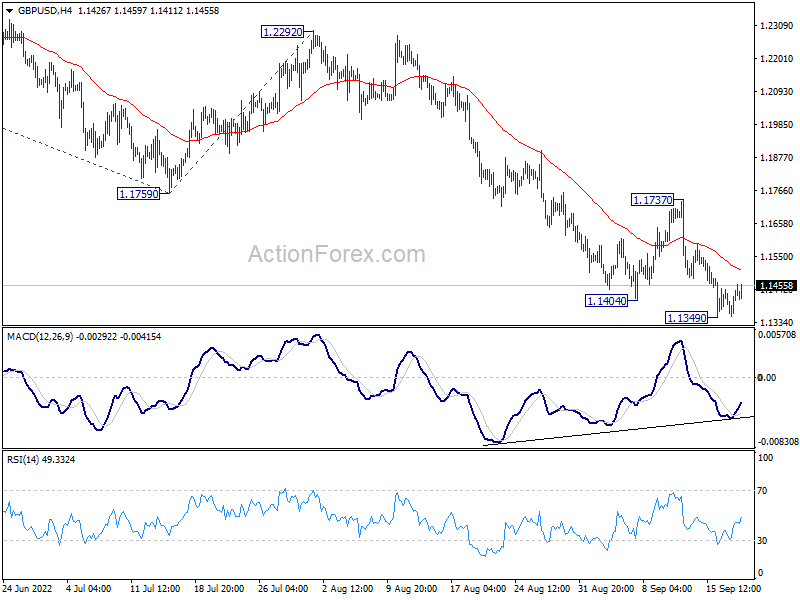
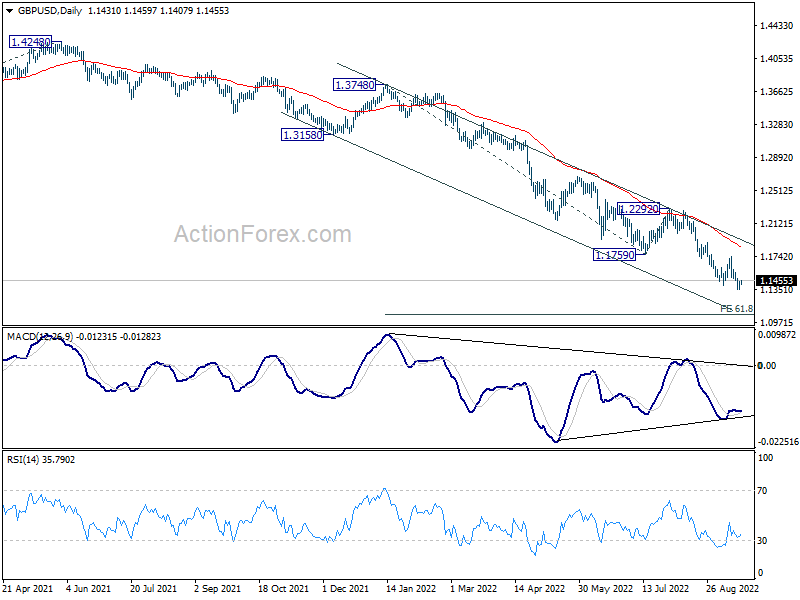
Intraday bias in GBP/USD is turned neutral with current recovery. But break of 1.1737 resistance is needed to indicate short term bottoming. Otherwise, outlook stays bearish. On the downside, break of 1.1349 will resume larger down trend to 61.8% projection of 1.3748 to 1.1759 from 1.2292 at 1.1063.
In the bigger picture, based on current momentum, fall from 1.4248 (2018 high) is probably resuming long term down trend from 2.1161 (2007 high). Sustained break of 1.1409 will target 61.8% projection of 1.7190 (2014 high) to 1.1409 (2020 low) from 1.4248 (2021 high) at 1.0675. This will remain the favored case for now as long as 1.2292 resistance holds.
USD/CHF Daily Outlook
Daily Pivots: (S1) 0.9615; (P) 0.9655; (R1) 0.9684; More
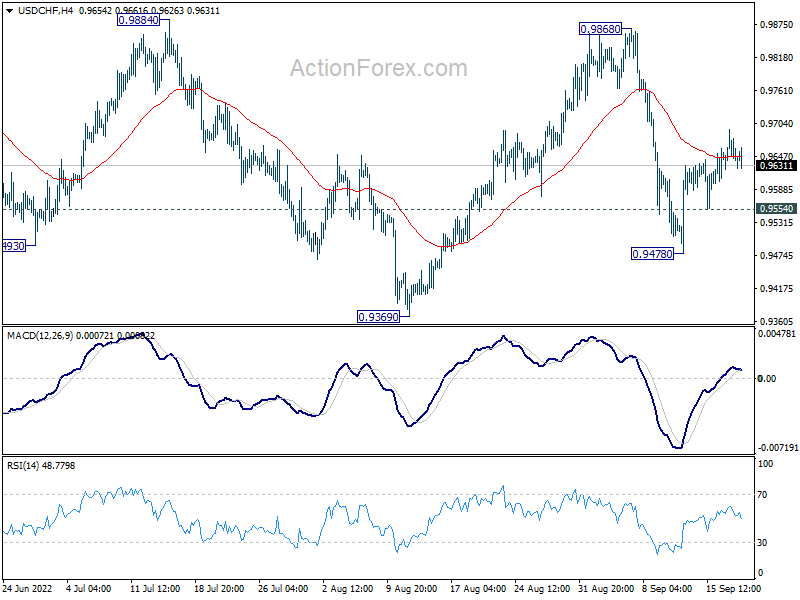
Intraday bias in USD/CHF stays mildly one the upside, and rise from 0.9478 would target 0.9868 resistance. Break there will argue that larger up trend is ready to resume through 1.0063. Overall, the corrective pattern from 1.0063 high could still extend. Below 0.9554 minor support will turn bias back to the downside for 0.9478 and below.
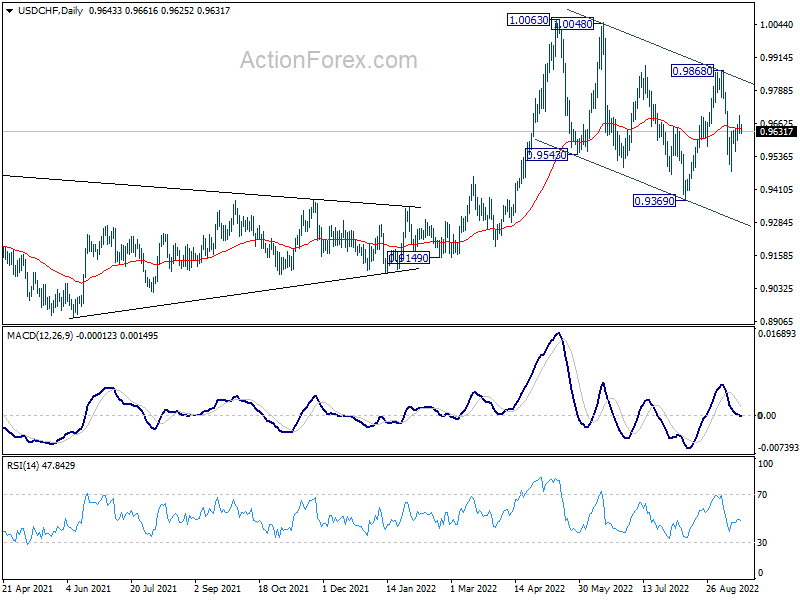
In the bigger picture, current development suggests that up trend from 0.8756 (2021 low) is still in progress. Sustained break of 1.0063 will target 100% projection of 0.9149 to 1.0063 from 0.9369 at 1.0283, and then 1.0342 (2016 high). For now, this will remain the favored case as long as 0.9369 support holds, even in case of deep pull back.
USD/JPY Daily Outlook
Daily Pivots: (S1) 142.71; (P) 143.17; (R1) 143.70; More...
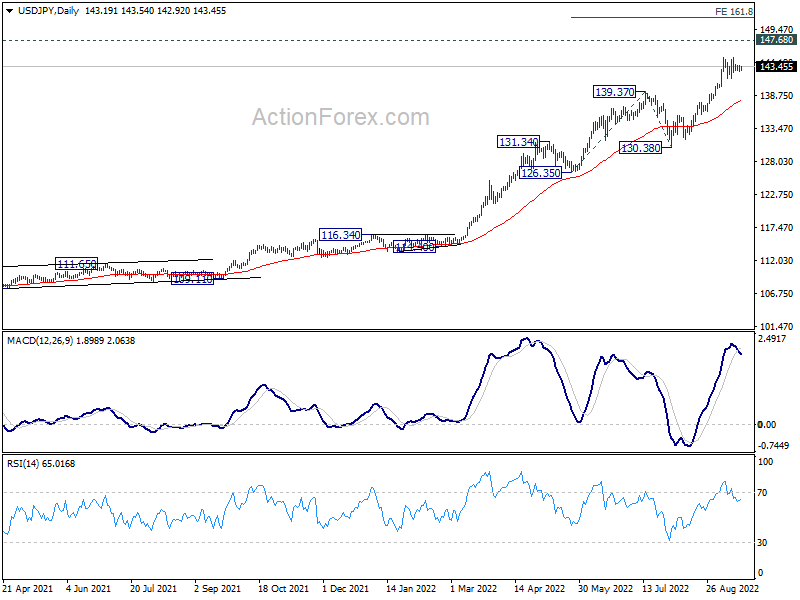
Sideway consolidation continues in USD/JPY and intraday bias remains neutral. Deeper retreat cannot be ruled out, but downside should be contained by 139.37 resistance turned support. On the upside, break of 144.98 will resume larger up trend to 147.68 long term resistance. Break there will target 161.8% projection of 126.35 to 139.37 from 130.38 at 151.44 next.
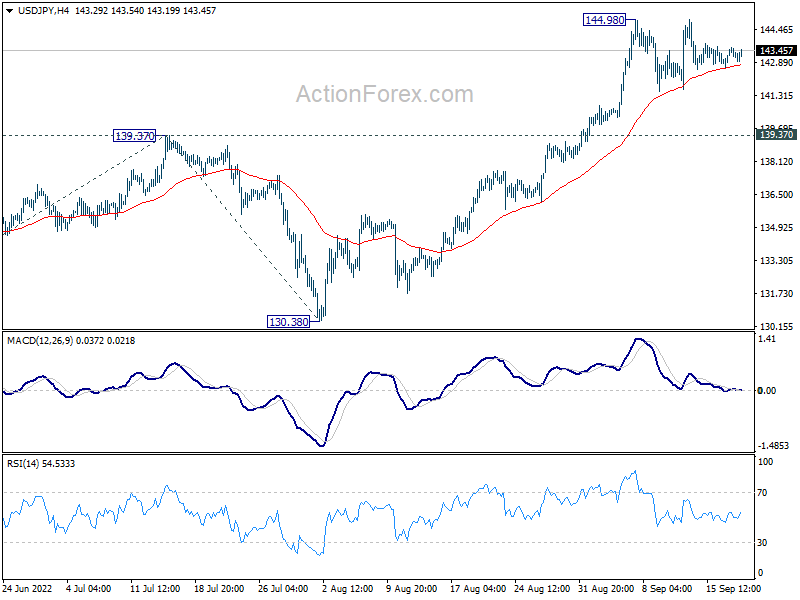
In the bigger picture, up trend from 101.18 is still in progress, as part of the whole up trend from 75.56 (2011 low). Further rise should be seen to 147.68 (1998 high). For now, break of 130.38 support is needed to be the first indication of medium term topping. Otherwise, outlook will stay bullish even in case of deep pull back.
AUD/USD Daily Report
Daily Pivots: (S1) 0.6688; (P) 0.6711; (R1) 0.6750; More...
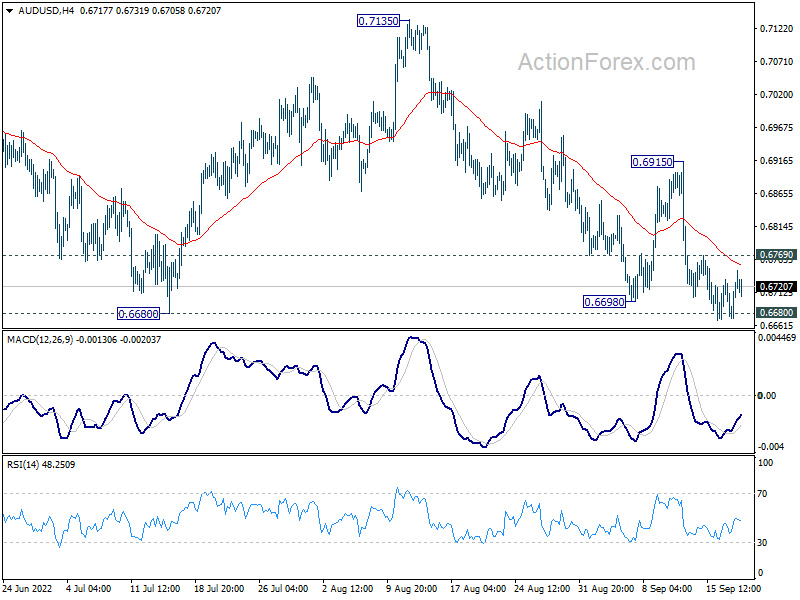
Intraday bias in AUD?USD remains neutral for the moment, and further decline is still mildly in favor. On the downside, decisive break of 0.6680 will resume larger down trend. Next target will be 0.6461 long term fibonacci level. On the upside, above 0.6769 minor resistance will turn bias back to the upside for 0.6915 resistance instead.
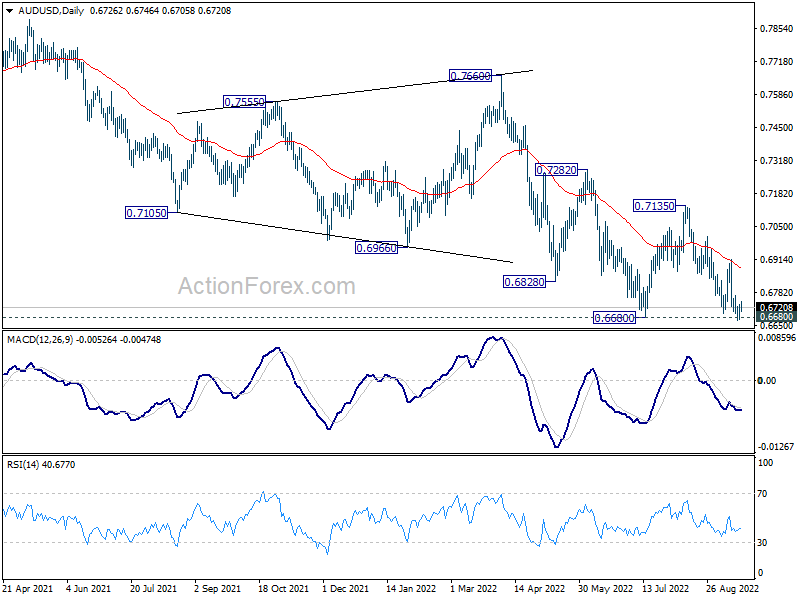
In the bigger picture, price actions from 0.8006 (2021 high) is seen more as a corrective pattern to rise from 0.5506 (2020 low). Or it could also be a bearish impulsive move. In either case, outlook will remain bearish as long as 0.7135 resistance holds. Next target is 61.8% retracement of 0.5506 to 0.8006 at 0.6461.
SECO downgrades Swiss GDP forecasts, upgrades CPI
SECO downgraded Swiss GDP growth forecasts for 2022 from 2.6% to 2.0%. For 2023, GDP growth projection was also lowered from 1.9% to 1.1%. CPI forecasts for 2022 was raised from 2.5% to 3.0%, and for 2023 up from 1.4% to 2.3%.
It said, "after a positive first half of the year 2022, the Swiss economy now faces a deteriorating outlook. A tense energy situation and sharp price increases are weighing on economic prospects, especially in Europe."
It also warned of risks from "serious gas or electricity shortages" in Europe, and "large-scale production stoppages and a marked downturn". Such a negative scenario would likely lead to "high domestic price pressures" and "downward trend in the economy economy. With rising interest rates, " risks associated with the surge in global debt are intensifying.
The Crypto Market Has Taken a Hiatus from the Sell-off
Market picture
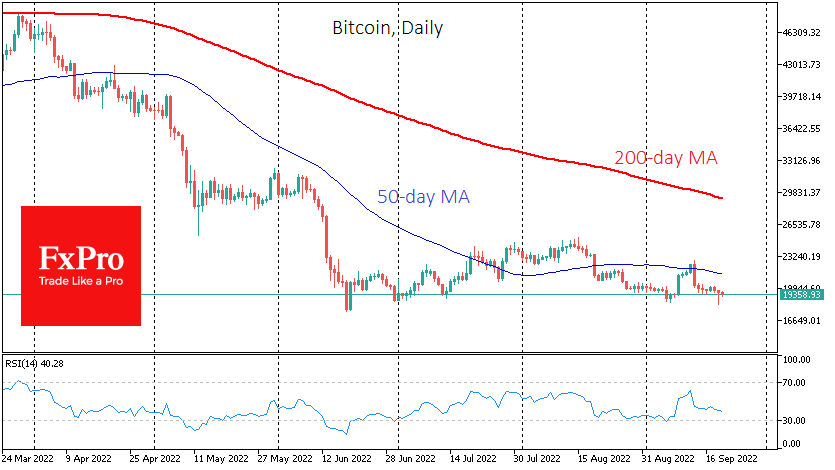
Bitcoin has changed little over the past 24 hours, trading at $19.4K on Tuesday at the start of the day. The initial fall was neatly redeemed during active European and US trading amid a rebound in stock indices. Some investors and traders saw the market response as excessive and sought to buy back the market at its current levels.
The capitalization of the entire crypto market rose 2.7% in the last 24 hours to 936bn. Both bitcoin and the crypto market continue to receive support near levels of the previous three months’ lows, around the $20K and $900B area, respectively.
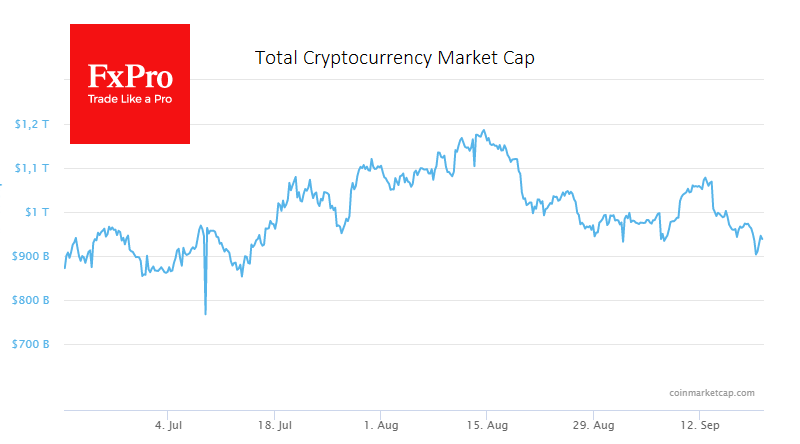
Despite a pause in the sell-off, the technical balance of power is on the bears’ side, with the potential to renew the June lows and move into the $12-14K area.
News background
According to renowned expert Willie Wu, the cryptocurrency market has not yet bottomed out. According to him, if bitcoin fails to stay in the $19K – $20K range, it faces a collapse to $17.6K. However, BTC may only bottom at around $10K.
According to CoinShares, investments in crypto funds rose last week after sharp outflows in the previous week. Net inflows of $7 million compared to outflows of $63 million the week before.
$17 million Inflows to bitcoin funds contrasted with $15 million outflows from Ethereum funds. Investments in funds that allow shorts on bitcoin rose by $3 million. “The combination of positive and negative flows suggests a continued lack of investor engagement in cryptocurrencies,” CoinShares said.
After nearly two years of litigation, the SEC and Ripple Labs called on a federal court to immediately rule on whether XRP sales violate US securities laws.
GBPUSD Could See Further Weakness; Still Strongly Negative
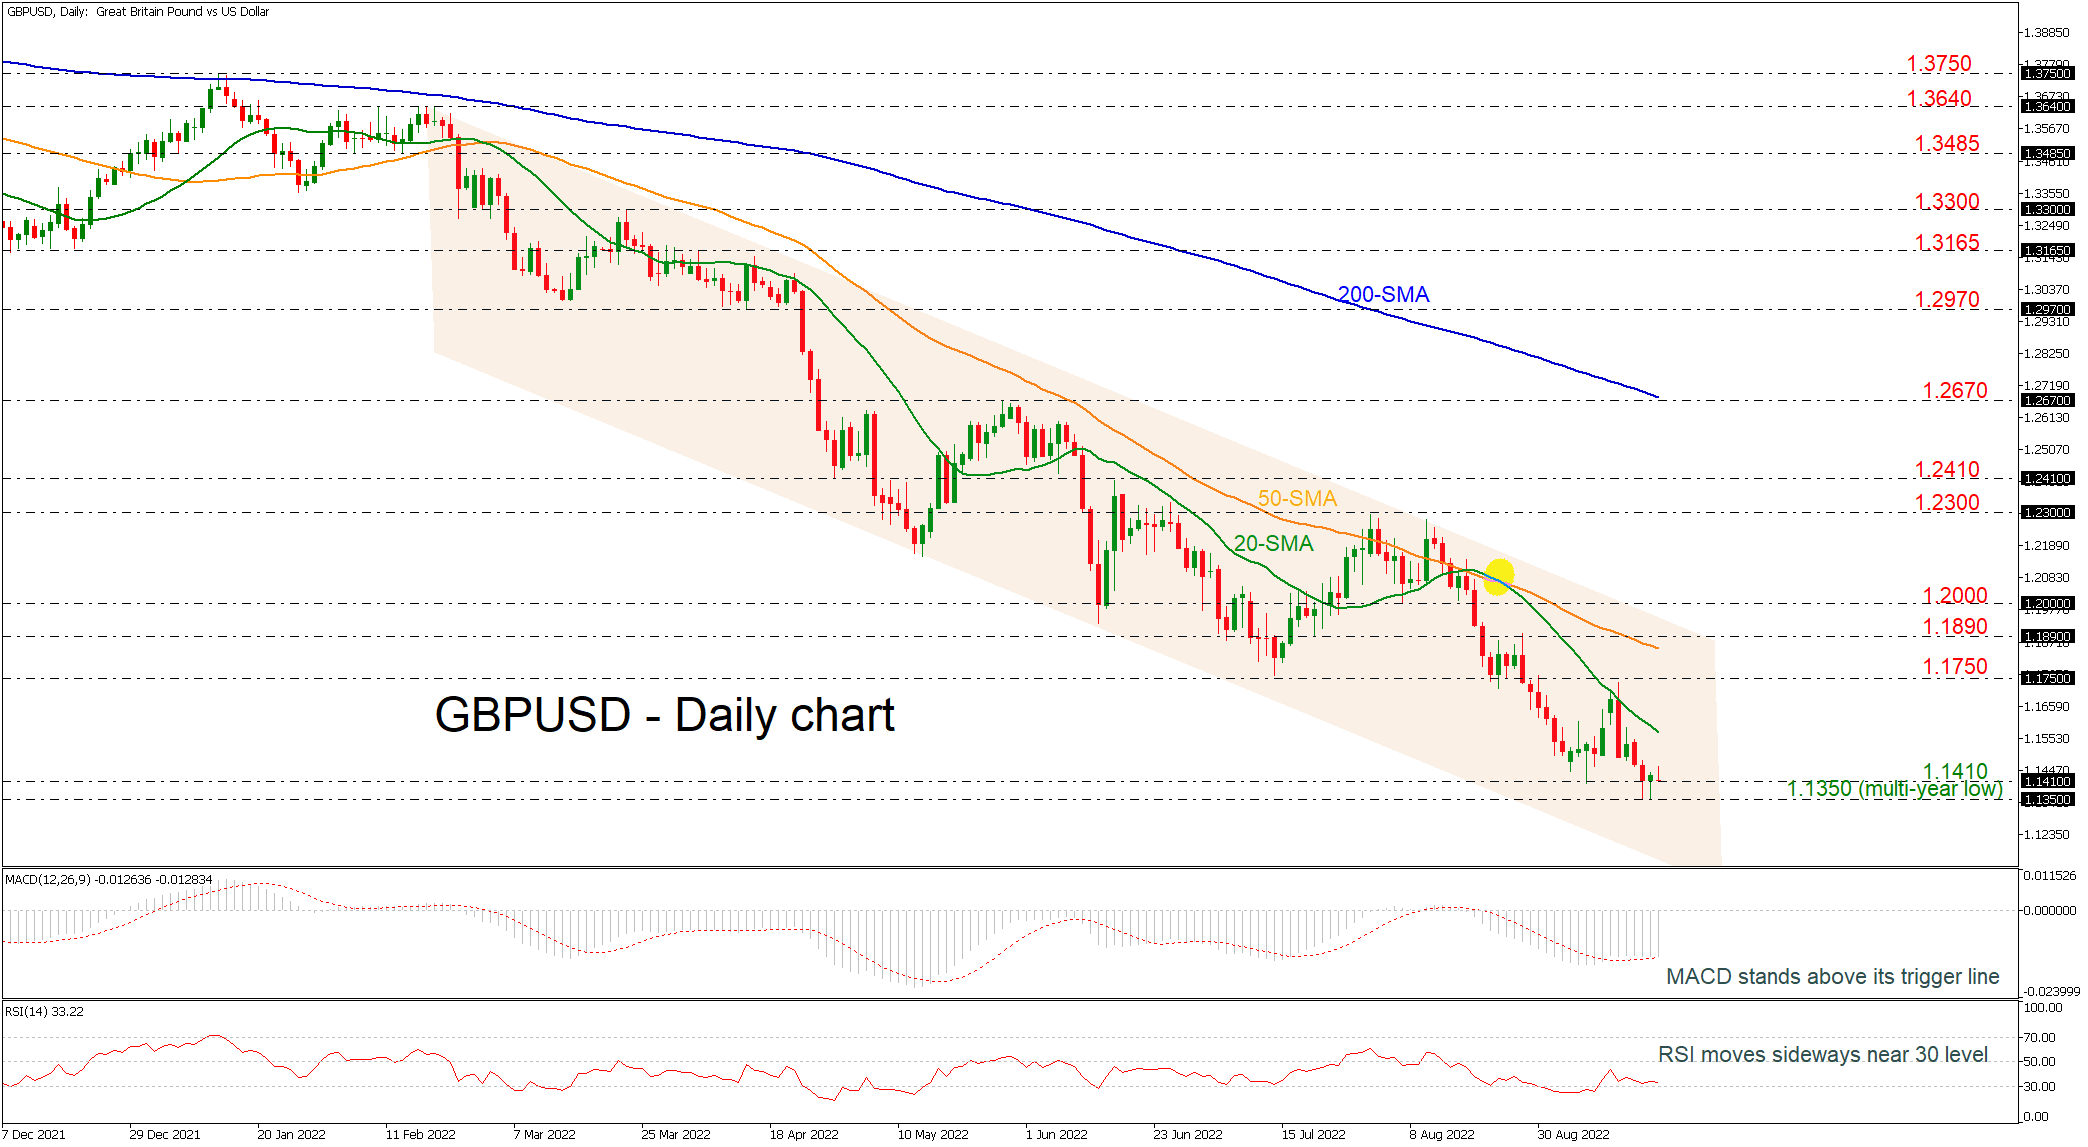
GBPUSD is holding above the multi-year low of 1.1350, remaining within the long-term descending channel. The technical oscillators are suggesting some positive movement in the short-term, with the MACD surpassing its trigger line in the negative region, while the RSI is standing above its 30 level. Moreover, the pair is still hovering well below the 20- and 50-day simple moving averages (SMAs).
On the upside, the price could attempt to overcome the 20-day SMA at 1.1570 and retest the previous high at 1.1750, which if successfully broken, could open the door for the 50-day SMA at 1.1845. Should traders continue to buy the pair above that line, resistance could then run towards the 1.1890-1.2000 area, meeting the upper boundary of the channel.
A reversal to the downside, however, could find immediate support at the 1.1350-1.1410 zone, while even lower the market could test the next psychological marks such as 1.1300 and 1.1200. Below that, the lower boundary of the downward pattern may halt bearish actions near 1.1100.
Turning to the long-term picture, the outlook has been bearish over the past seven months and only a decisive close above the 1.2000 handle and, more importantly, above the 200-day SMA at 1.2670, could shift the outlook to bullish.
Daily Technical Analysis
EUR/USD
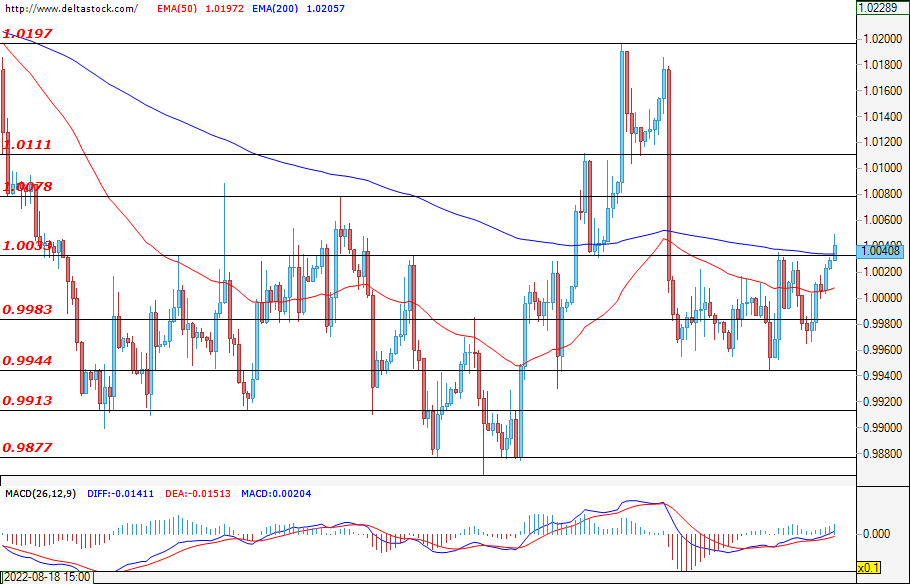
The bulls managed to prevail, and during the early hours of today`s trading, the pair tested the resistance at 1.0033, but the breach is yet to be confirmed.. If this happens, then the appreciation of the euro against the greenback will most likely continue.. A successful test of the next target at 1.0078, followed by a violation of the level at 1.0111, will draw a more bullish picture and could lead to a rally towards the local high at 1.0197. If the bears re-enter the market, then their first support could be found at 0.9983. A potential breach of the lower zone at 0.9944 could form the current movement as corrective and could pave the way for a test of the level at 0.9913.
USD/JPY
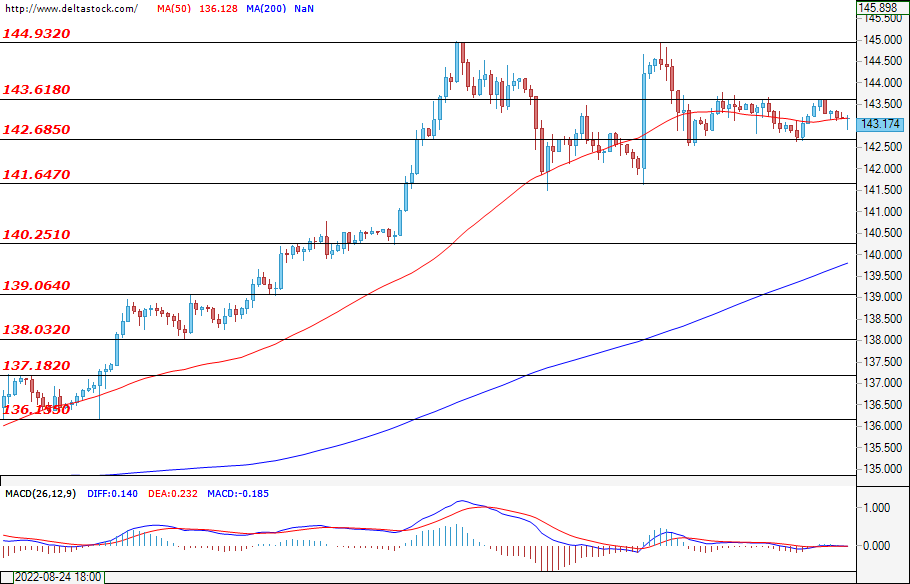
Neither the bulls, nor the bears managed to prevail and the Ninja remained locked in the zone between 142.68 and 143.61. A successful breach of the upper border could lead to a test of the high at 144.93, where a violation could easily result in new gains for the greenback against the yen and could strengthen the positive expectations for the future path of the pair. If sellers gain enough momentum and breach the support at 142.68, then they could attack the lower target at 141.64, where a potential breach could easily deepen the decline towards the level at 140.25.
GBP/USD
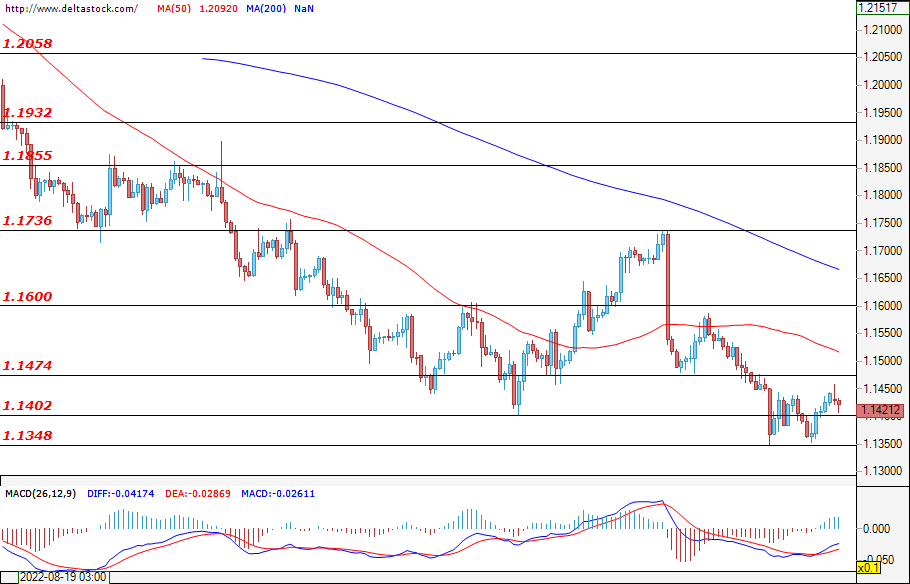
After the unsuccessful attack on 1.1348, the Cable recovered some of its recent losses, and at the time of writing the analysis, the pair is trading above the level at 1.1402. A test of the next target at 1.1474 is a highly probable scenario, but only a violation of the resistance at 1.1600 could lead to a change in the current market sentiment and could lead to a rally towards the important level at 1.1736. If the bears prevail, then a violation of the mentioned zone at 1.1402, which is now acting as support, followed by a new successful test on the local low at 1.1348, could both easily continue the sell-off towards the levels at around 1.1280.
EUGERMANY40
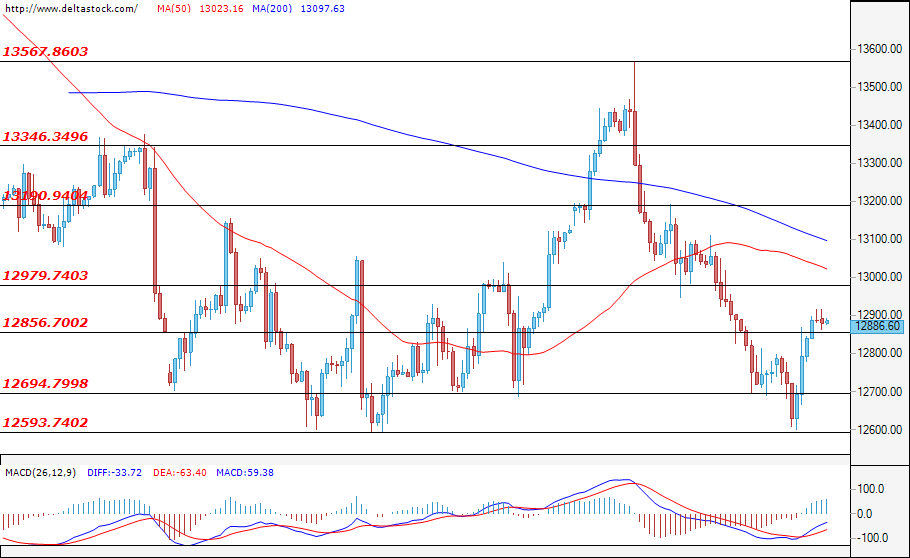
The support zone at 12953 successfully withheld the bearish attack and the German index is managing to remain above the level at 12856. The expectations are for a test of the resistance at 12979, but only a breach of the next target at 13190, followed by a violation of the major level at 13346, could continue the recovery and could lead to a move towards the local high at 13567. The first support for the bears could be found at 12694. A breach of the low at 12593 would mark the current move as corrective and could strengthen the negative expectations for the future path of the index.
US30
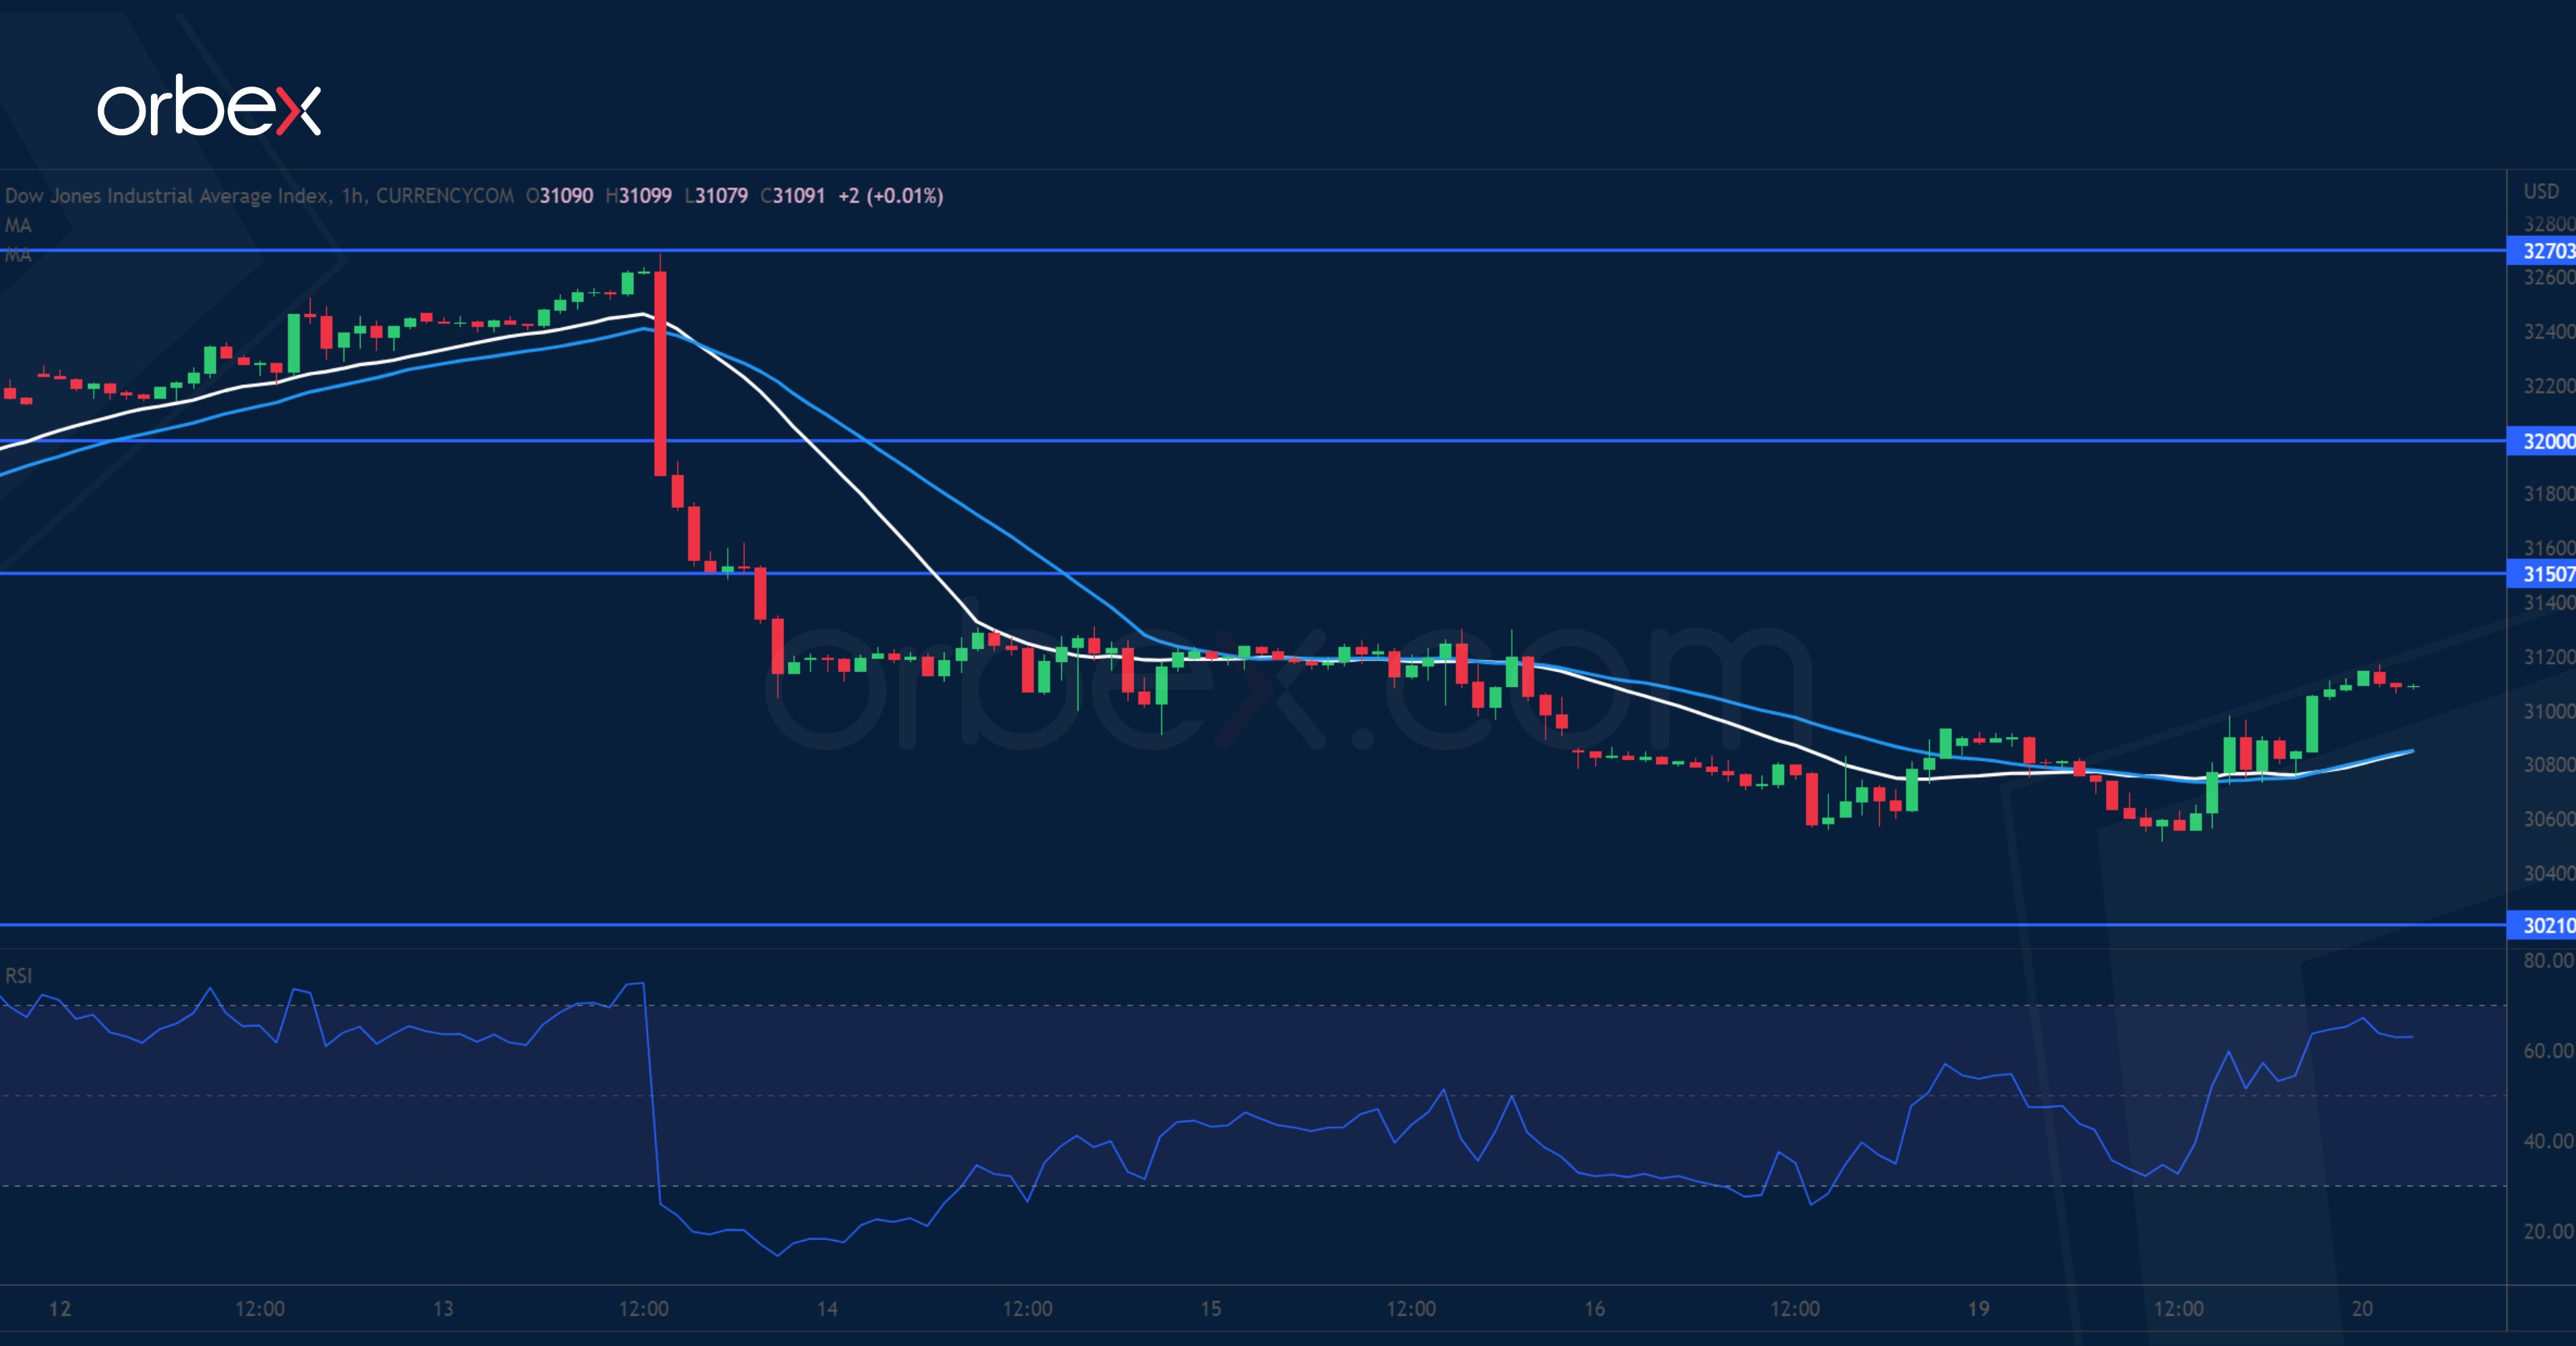
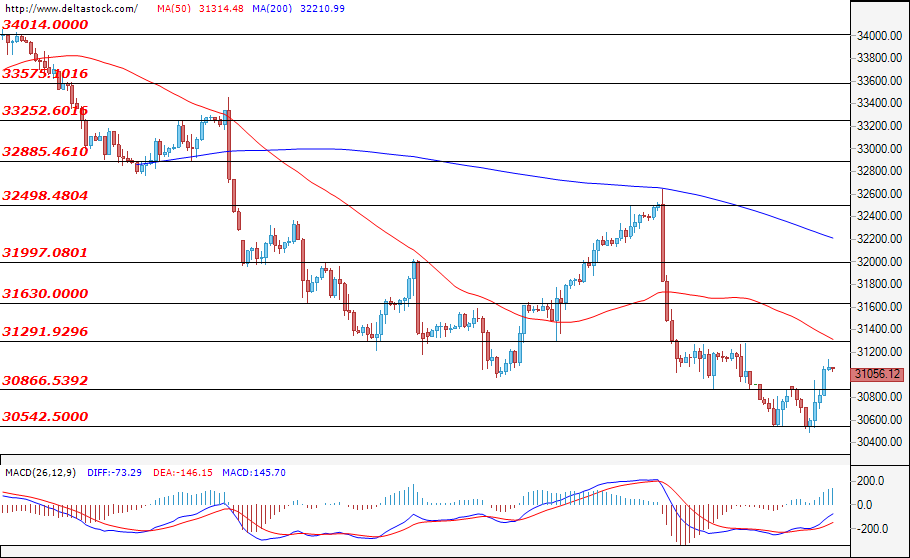
The bearish momentum faded and the U.S. index recovered some of its recent losses. During the early hours of today, the U30 is trading in the green, and if the bullish attack continues, then a test of the resistance at 31291 could be the most probable scenario. A successful breach for the bulls could continue the recovery and could easily head the price towards the upper zone at 31630. If the bears re-enter the market, breach the support at 30866, and follow this up with a violation of the lower level at 30542, then their actions could deepen the sell-off and head the index towards levels at around 30400.
Dow Jones 30 Tests Critical Support
The Dow Jones 30 recoups losses ahead of the Fed's policy meeting tomorrow. A bearish MA cross on the daily chart shows an acceleration to the downside and a break below 31000 has certainly put the bulls on the defensive. Last July’s low at 30200 is a critical floor and its breach may expose the index to a sharp sell-off towards 29000, confirming a bear market for the weeks to come. An oversold RSI attracted some bargain hunters. The support-turned-resistance at 31500 is the first hurdle in case of a bounce.