Sample Category Title
Technical Outlook and Review
USD/JPY:
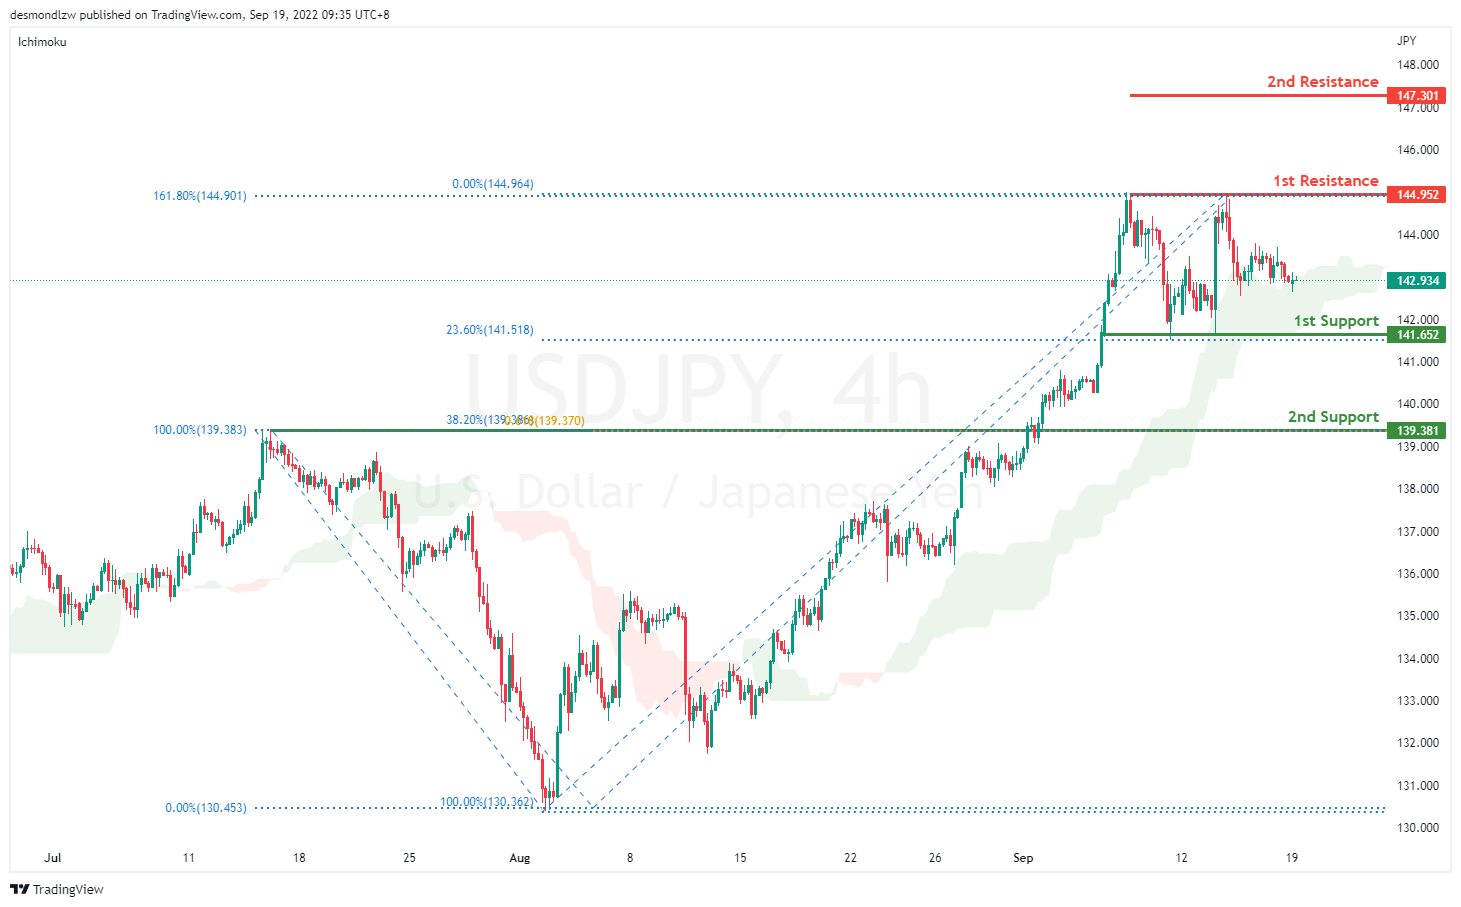
On the H4 chart, price is still respecting the ascending momentum. We are still bullish bias- Price is testing above the previous low and if bullish momentum continues, it should bring price to first resistance at 144.952 where the 161.8% extension sits. If it breaks this level, it should bring price to 147.301 where the previous swing high sits. Alternatively it could pull back to the first support at 141.652 where the 23.6% retracement and 100% projection sits then to the second support at 139.381 where the 38.2% retracement and overlapping support sits.
Areas of consideration:
- H4 time frame, 1st resistance at 144.952
- H4 time frame, 1st support at 141.652
DXY:
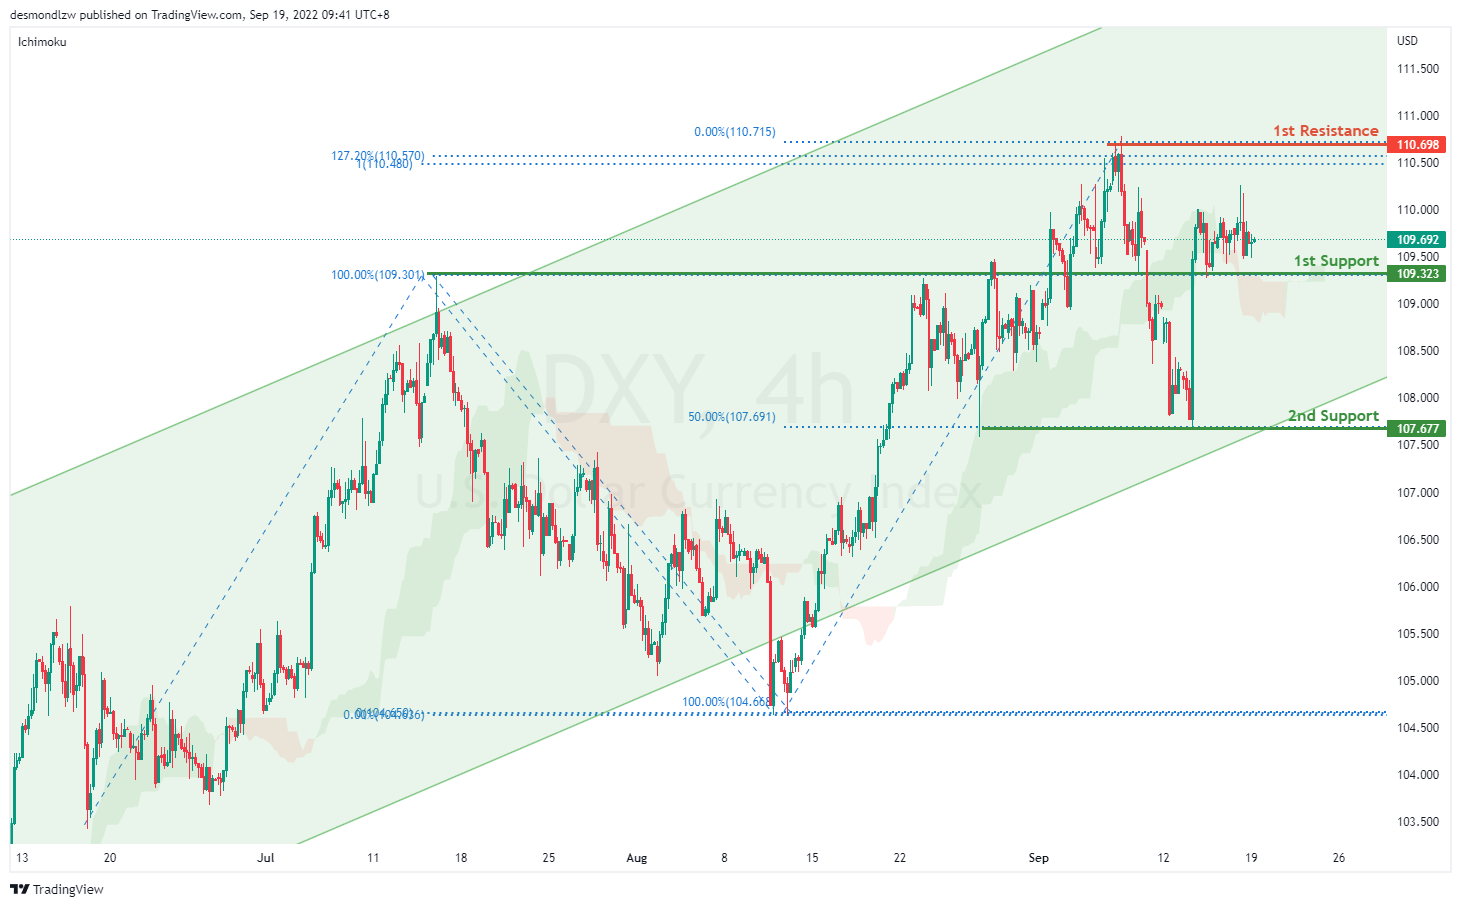
On the H4, price is still respecting the bullish channel and has failed to break the first support- we are bullish bias. Price has rebounded off the support level and is moving toward the first resistance at 110.698 levels where the previous swing high sits. Alternatively, price could pull back to test the first support at 109.323 where the 23.6% retracement sits then the second support at 107.677 where the 61.8% projection, 61.8% retracement and previous swing low sits.
Areas of consideration:
- H4 time frame, 1st resistance at 110.698
- H4 time frame, 1st support at 109.323
EUR/USD:
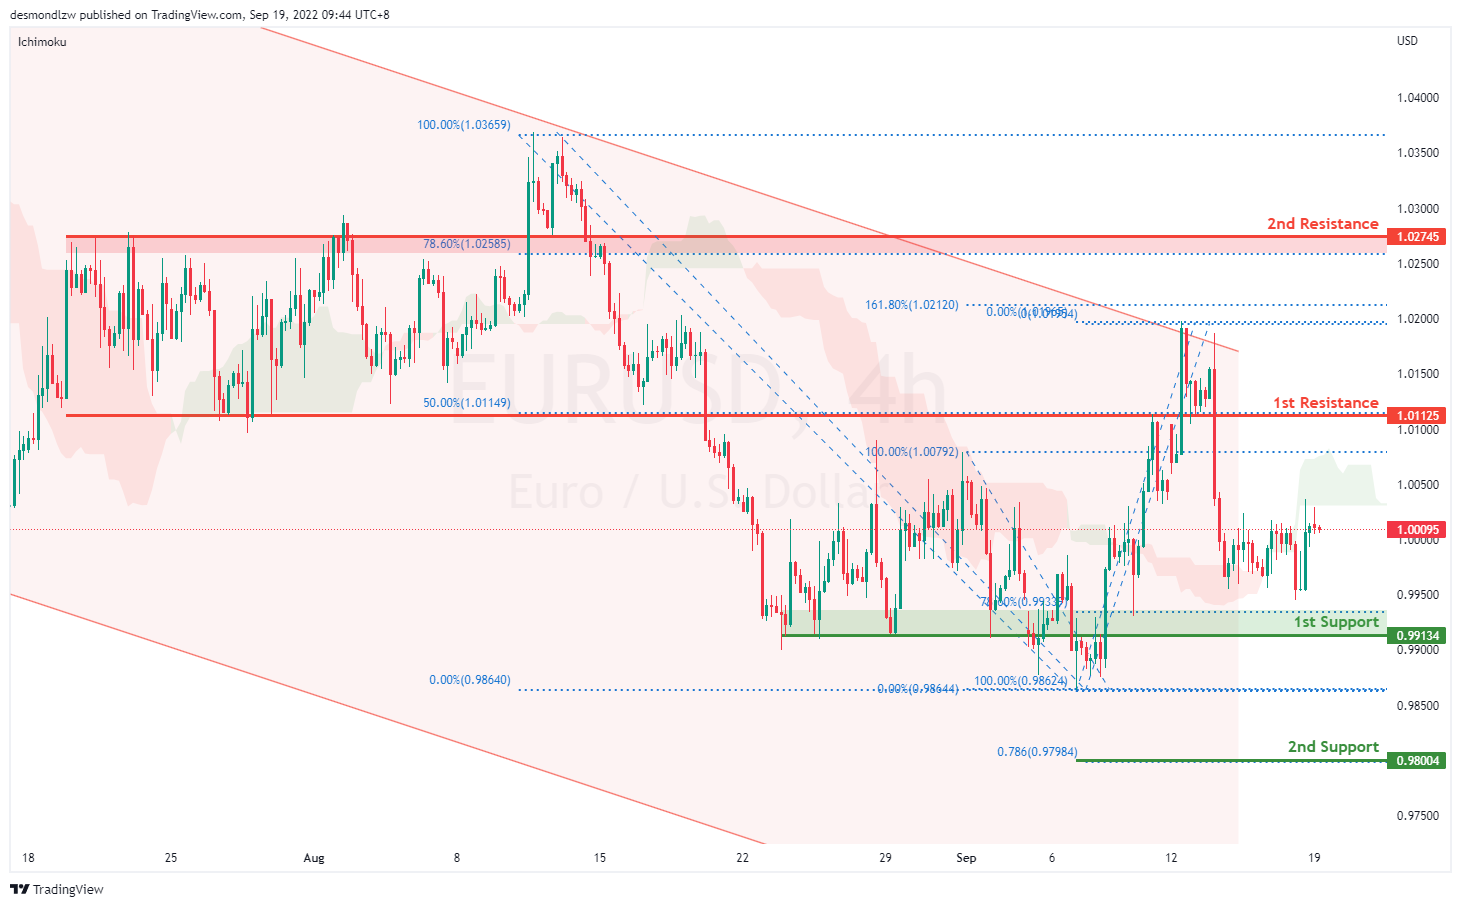
On the H4, price is moving within the channel, we are currently bullish bias as price fails to break the first support. Price seems like its moving to first resistance at 1.0112 level where the 50% retracement and previous swing low sits. If bullish momentum continues, it should bring price to second resistance at 1.0274 where the 78.6% retracement and previous swing high sits. Alternatively, price could pull back to test the first support at 0.9913 where the 78.6% projection and previous swing low sits, subsequently the second support at 0.9878 where the previous swing low sits.
Areas of consideration :
- H4 1st resistance at 1.0112
- H4 1st support at 0.99134
GBP/USD:
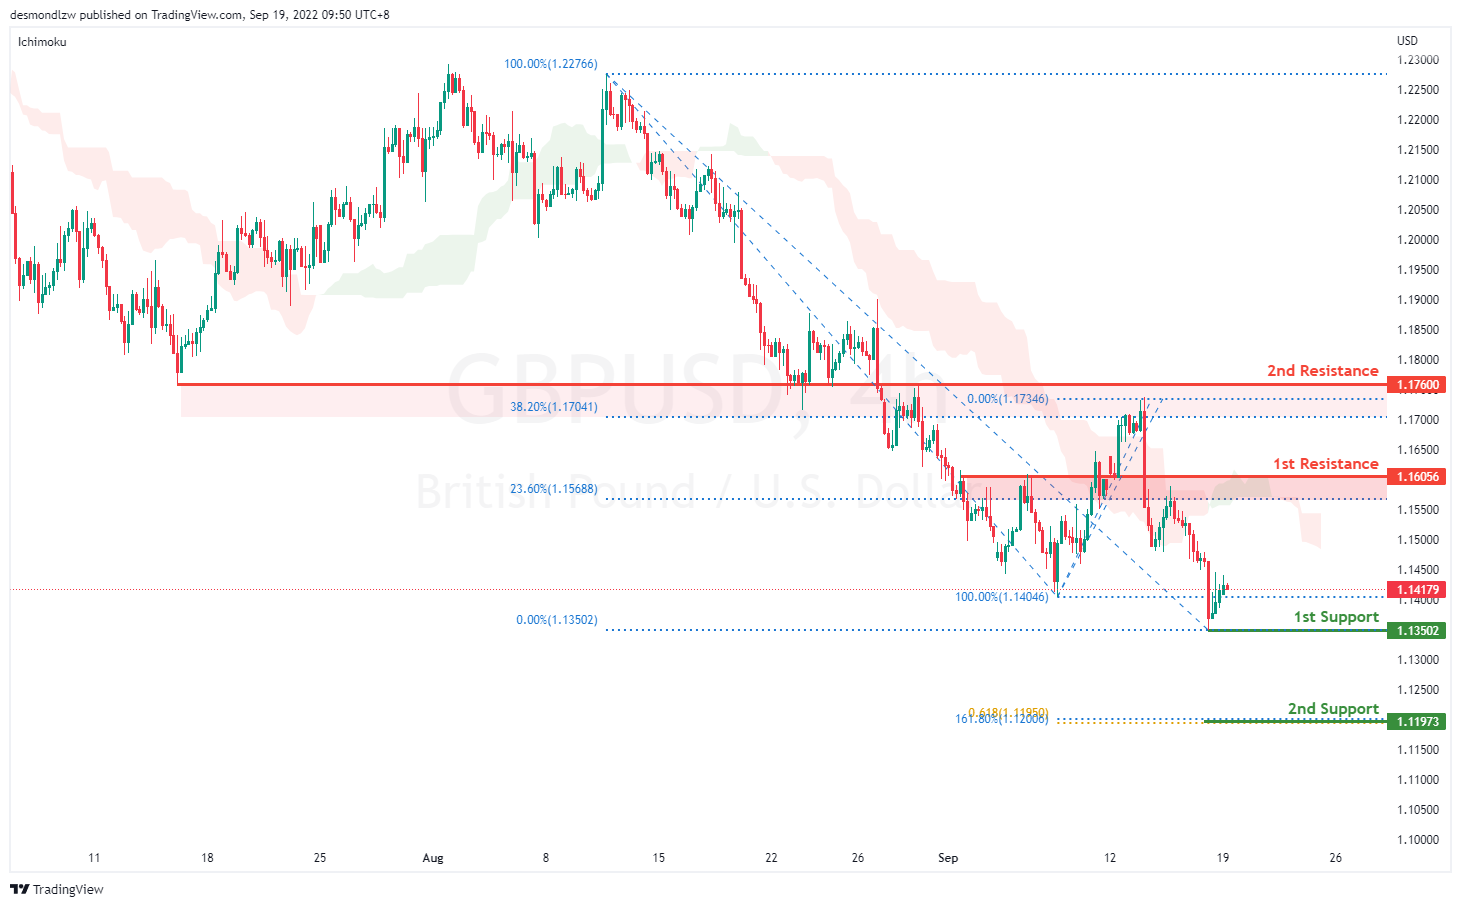
On the H4, prices are still moving in a bearish momentum hence we are bearish biassed. Prices have pulled back slightly but if bearish momentum continues, it should test the first support at 1.1350 levels where the previous swing low sits then the second support at 1.1197 where the 161.8% extension sits. Alternatively, price could pull back to test the first resistance at 1.1605 where the 23.6% retracement and overlapping support sits then the second resistance at 1.1760 where the 38.2% retracement and previous swing high sits
Areas of consideration:
- H4 1st resistance at 1.1605
- H4 1st support at 1.1350
USD/CHF:
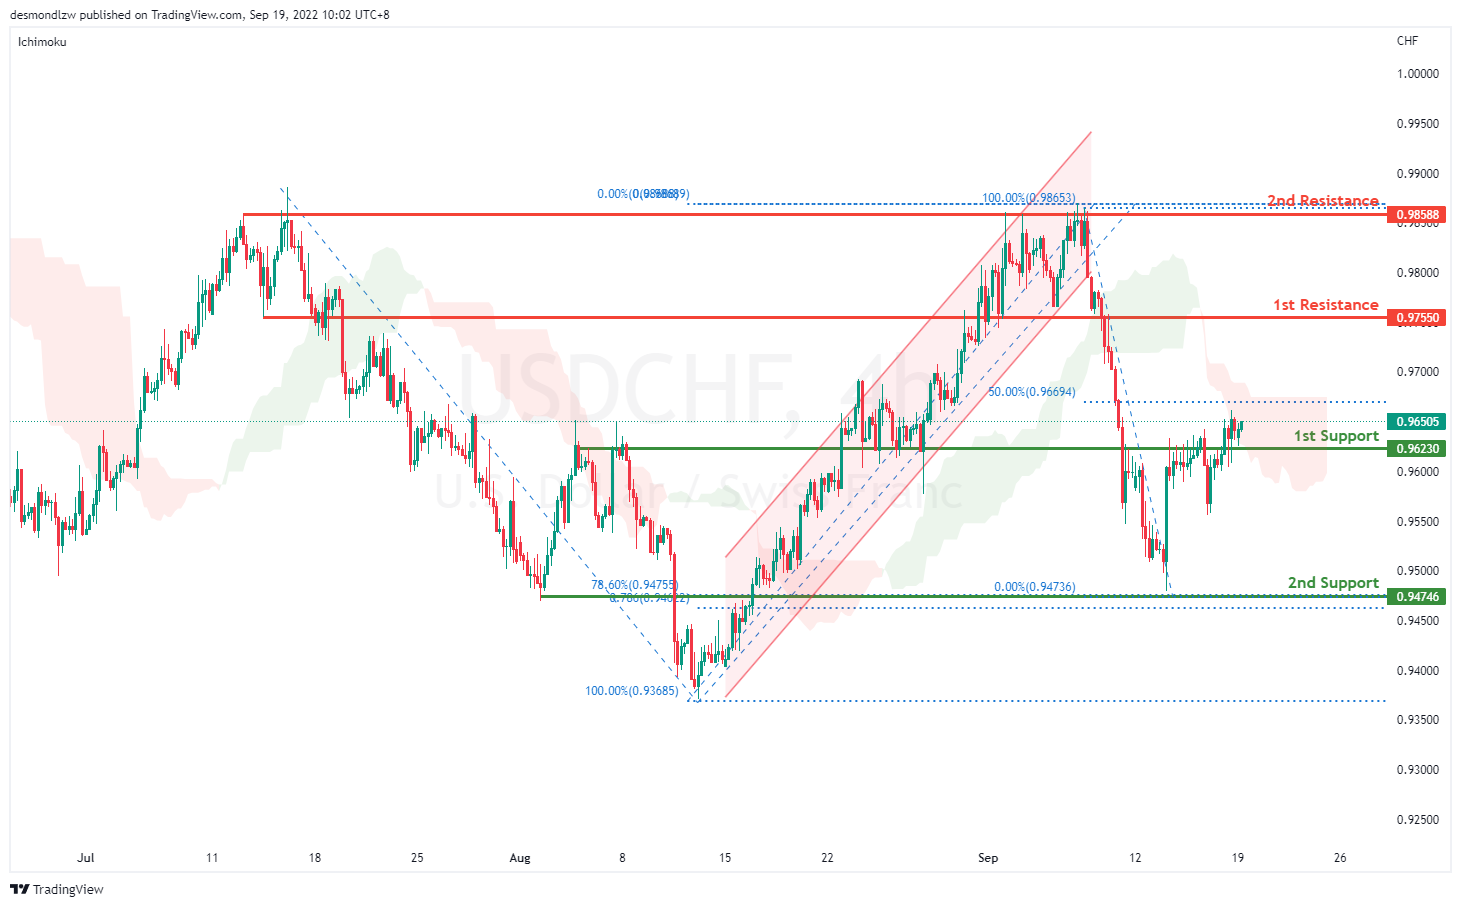
On the H4, prices have broken the ascending channel and we are currently bearish bias. Price has broken the first support at 0.9623 where the overlapping resistance sits but prices are ranging. If price continues with the bearish momentum, it should bring price back to test the 0.9623 levels before testing the second support at 0.9474 where the 78.6% projection and 78.6% retracement sits. Alternatively, price could pull back to test the first resistance at 0.9755 then the second support at 0.9858 where the swing high sits
Areas of consideration
- H4 1st support at 0.9623
- H4 1st resistance at 0.9755
XAU/USD (GOLD):
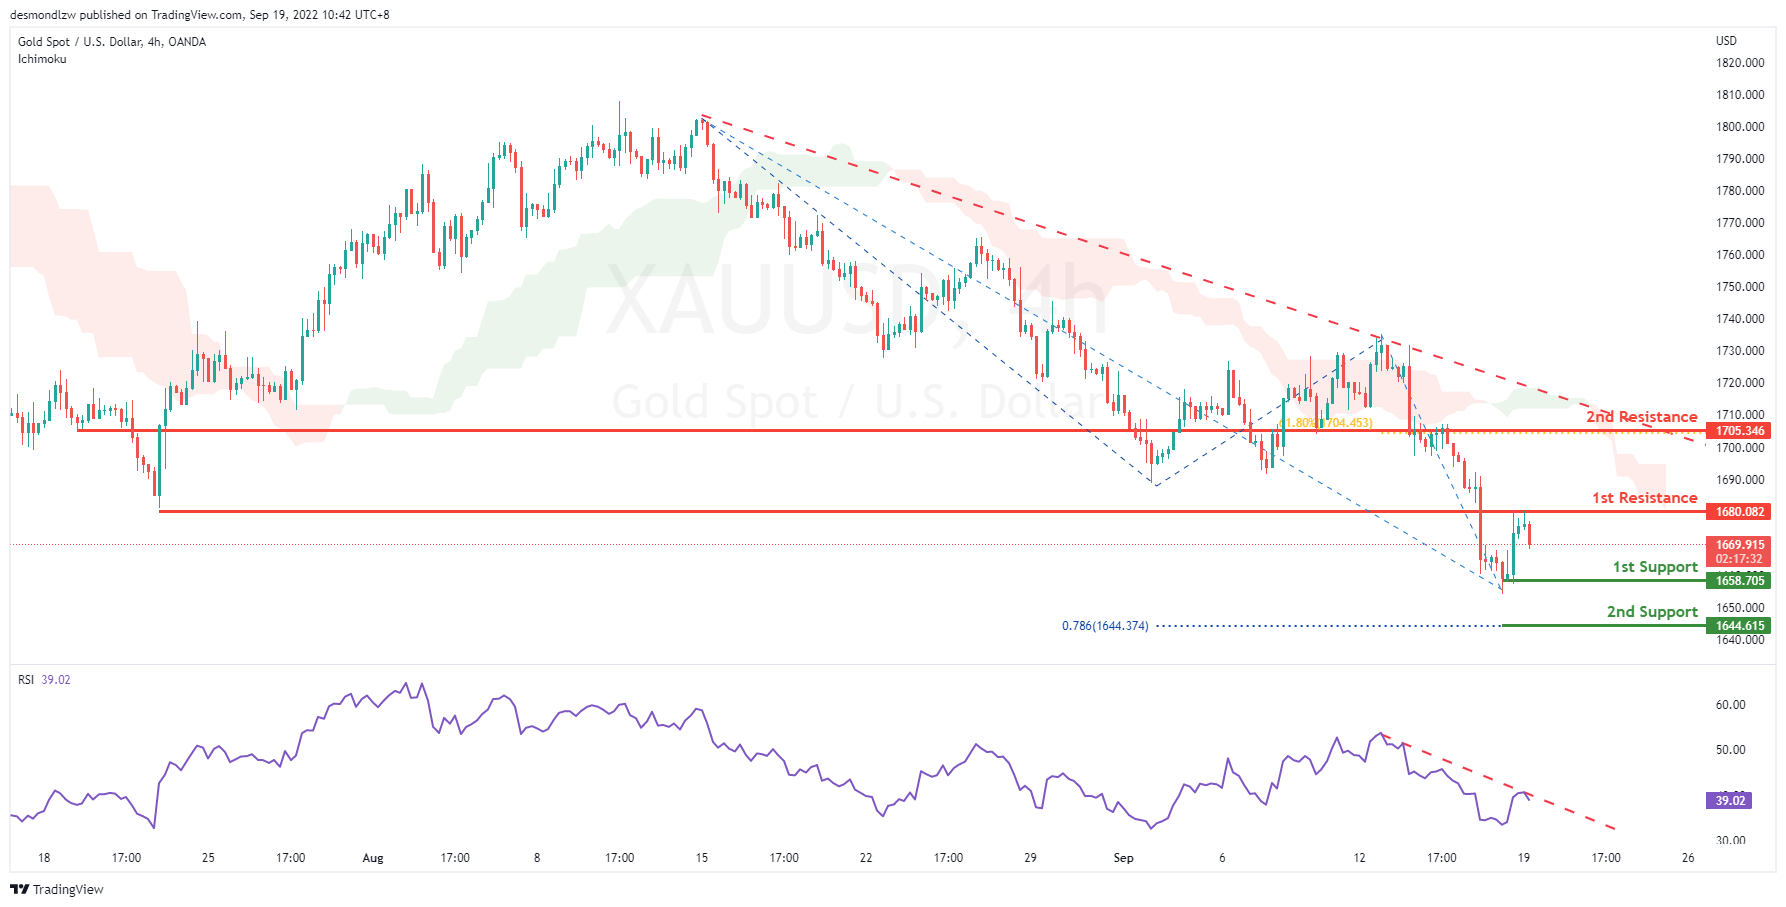
On the H4, with the price moving within the descending trendline, below ichimoku cloud and RSI is showing a descending trendline, we have a bearish bias that the price may drop to the 1st support at 1658.705, which is in line with the swing low. If the 1st support is broken, the 2nd support could be at 1644.615, which is in line with the 78.6% fibonacci projection. Alternatively, the price may rise to the 1st resistance at 1680.082, which is in line with the overlap resistance. If the 1st resistance is broken, the 2nd resistance could be at 1705.346, where the 61.8% fibonacci retracement is.
Areas of consideration:
- H4 time frame, 1st support at 1658.705
- H4 time frame, 1st resistance at 1680.082
AUD/USD:
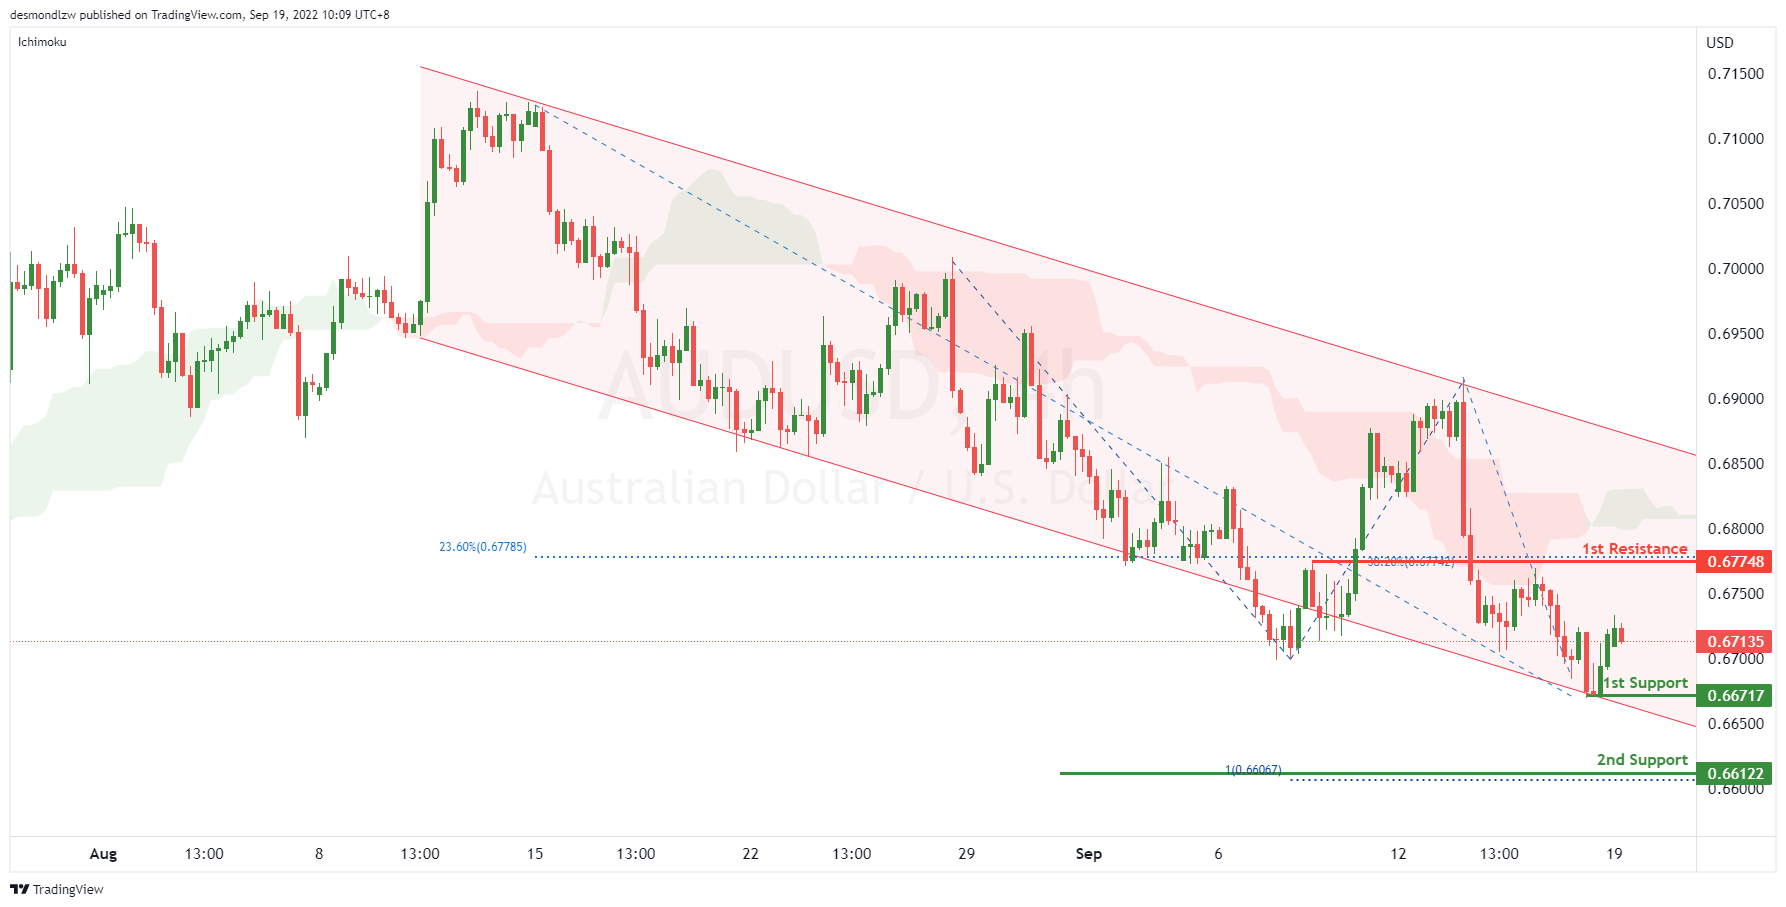
On the H4, with the price moving within the descending channel and below ichimoku cloud, we have a bearish bias that the price may drop to the 1st support at 0.66717, which is in line with the swing low. If the 1st support level is broken, the 2nd support could be at 0.66122, where the 100% fibonacci projection is. Alternatively, the price may rise to the 1st resistance at 0.67748, which is in line with the 38.2% fibonacci retracement and 23.6% fibonacci retracement.
Areas of consideration
- H4, current price
- H4 1st support at 0.66717
NZD/USD:
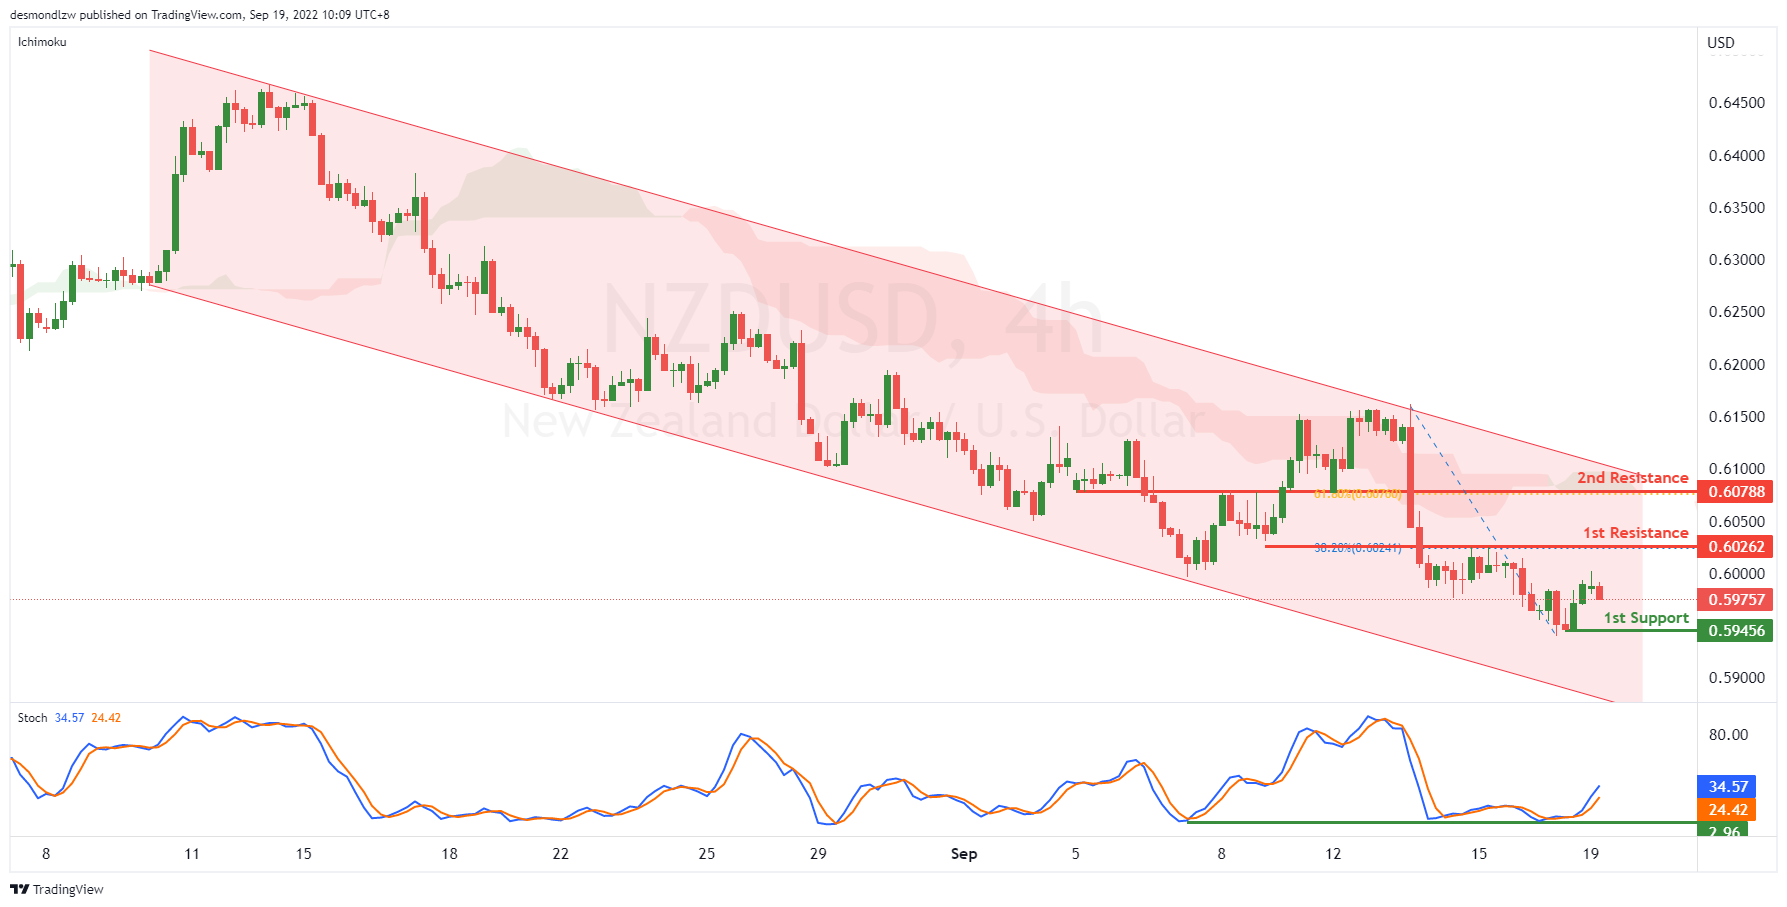
On the H4, with the price moving within the descending channel and below ichimoku cloud, we have a bearish bias that the price may drop to the 1st support at 0.59456, where the swing low is. Alternatively, as the Stoch is reversing from the support, the price may rise to the 1st resistance at 0.60262, which is in line with the pullback resistance and 38.2% fibonacci retracement. If the 1st resistance is broken, the 2nd resistance could be at 0.60788, which is in line with the overlap support and 61.8% fibonacci retracement.
Areas of consideration:
- H4 time frame, 1st support at 0.59456
- H4 time frame, 1st resistance at 0.6026
USD/CAD:
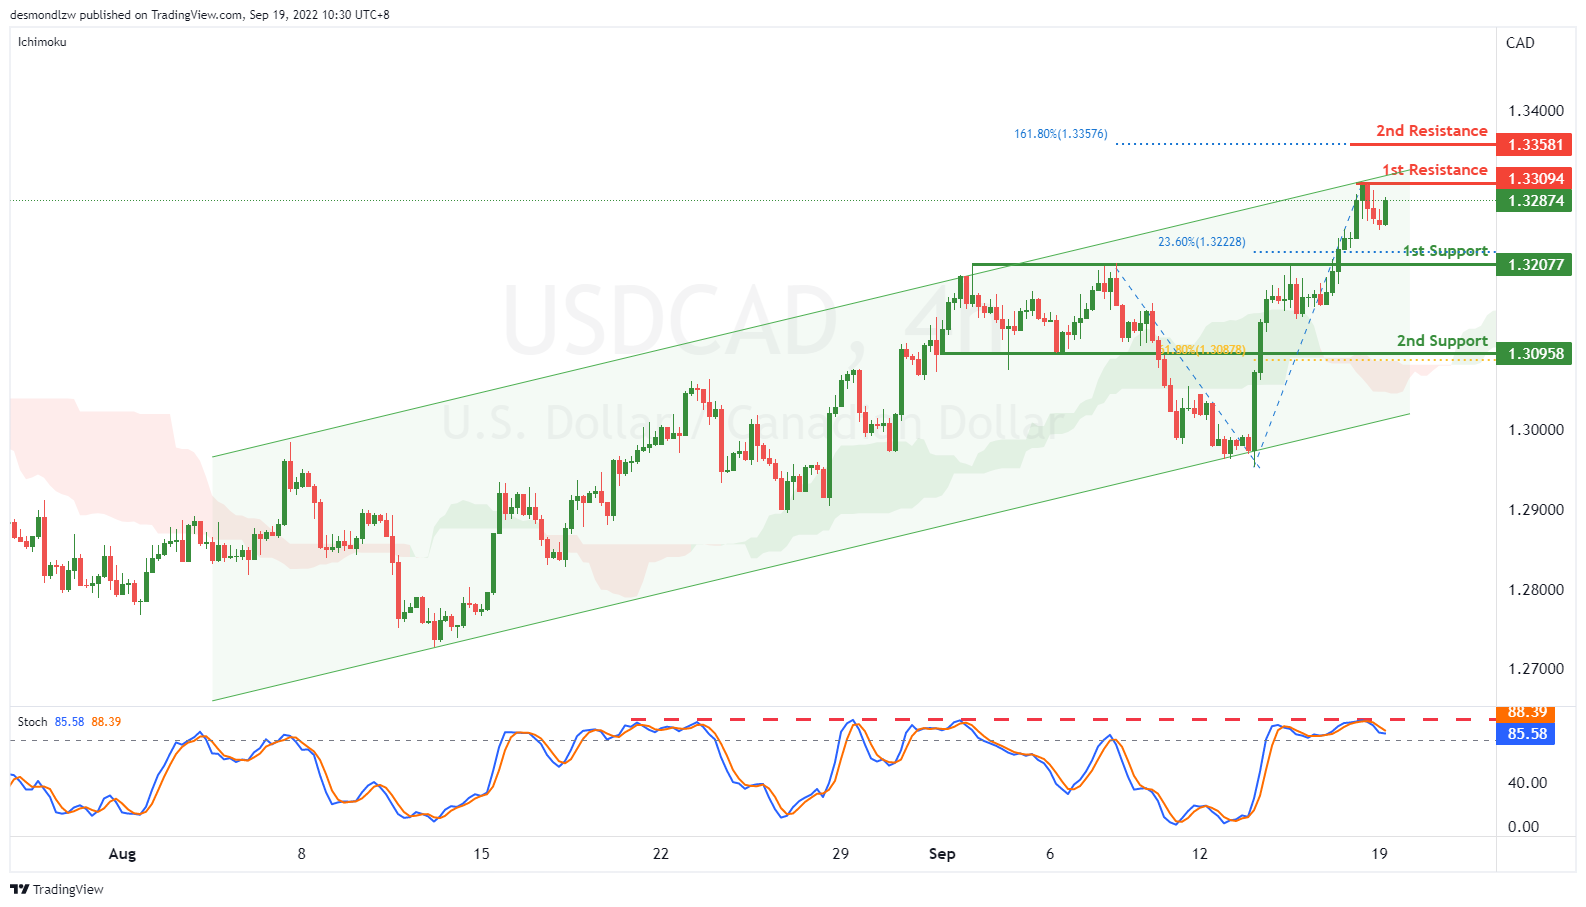
On the H4, with the price moving within the ascending channel and above ichimoku cloud, we have a bullish bias that the price may rise to the 1st resistance at 1.33094, which is in line with the swing high. If the 1st resistance is broken, the 2nd resistance could be at 1.33581, where the 161.8% fibonacci extension is. Alternatively, as the Stoch is reversing from the resistance, the price may drop to the 1st support at 1.32077, which is in line with the 23.6% fibonacci retracement and previous swing highs after testing the 1st resistance. If the price breaks the 1st support, the 2nd support could be at 1.30958, which is in line with the overlap support and 61.8% fibonacci retracement.
Areas of consideration:
- H4 time frame, 1st resistance at 1.33094
- H4 time frame, 1st support at 1.32077
OIL:
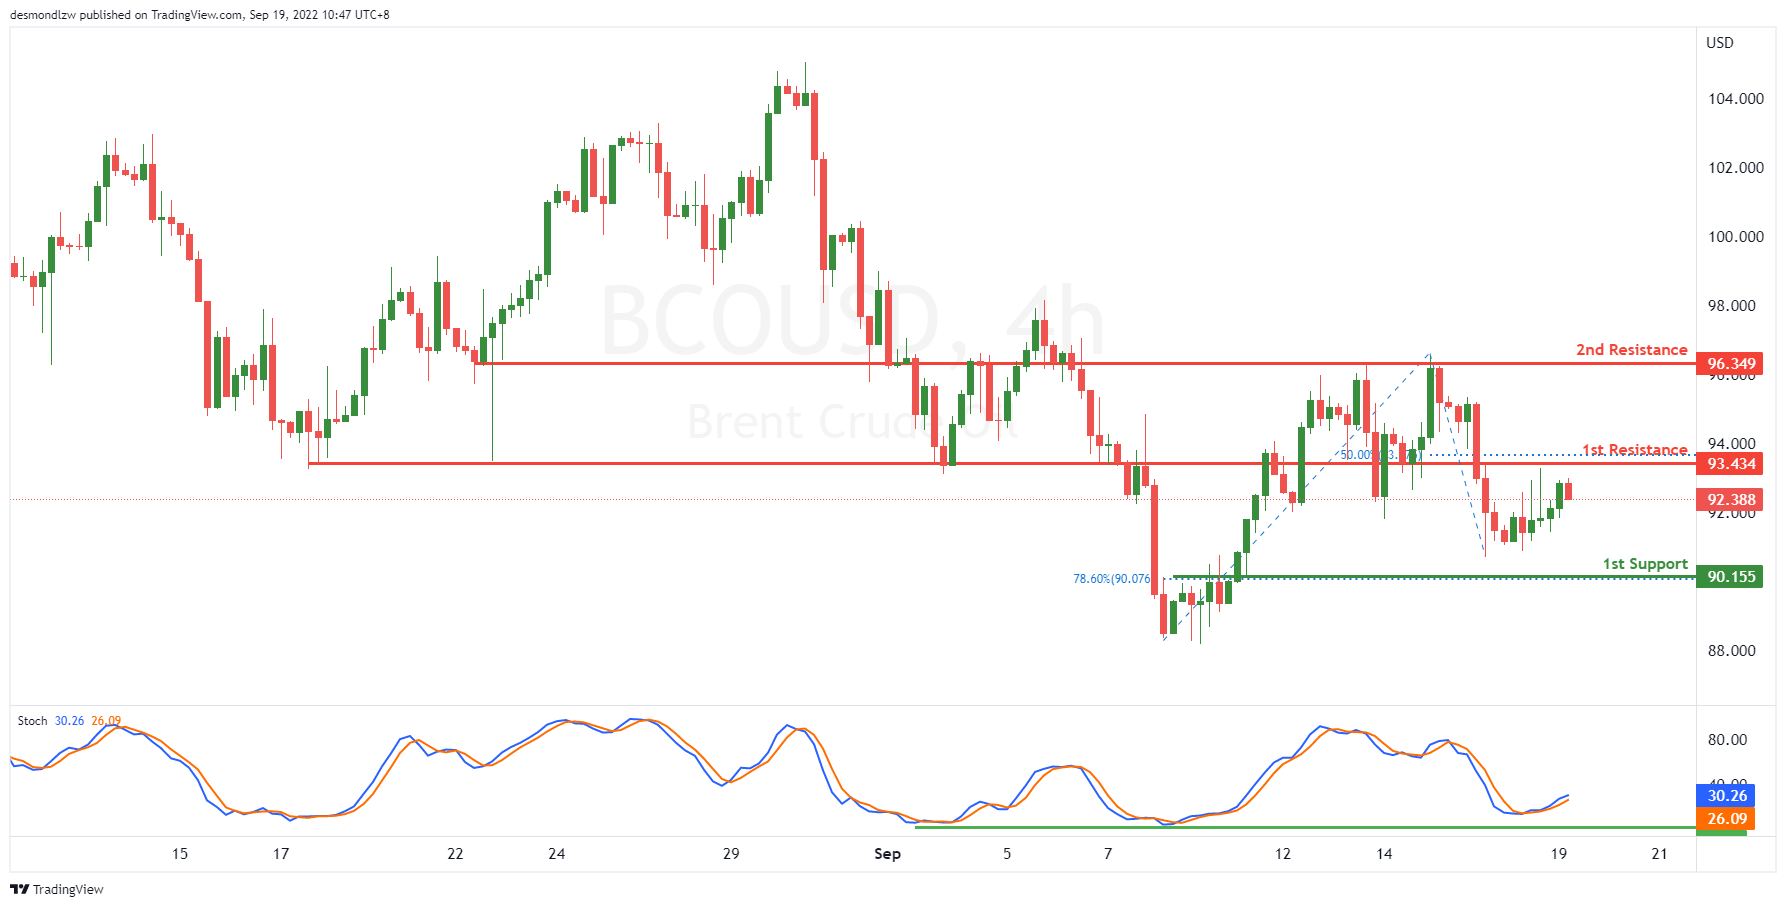
On the H4, with the stoch is reversing from the support line and here is a golden cross, we have a bullish bias that the price may test the 1st resistance at 93.434, which is in line with the 50% fibonacci retracement. If the 1st resistance is broken, the next key resistance could be at 96.349, which is in line with the overlap resistance. Alternatively, the price may drop to the 1st support at 90.155, where the78.6% fibonacci retracement is.
Areas of consideration:
- H4 time frame, 1st resistance at 93.434
- H4 time frame, 2nd resistance at 96.349
Dow Jones Industrial Average:
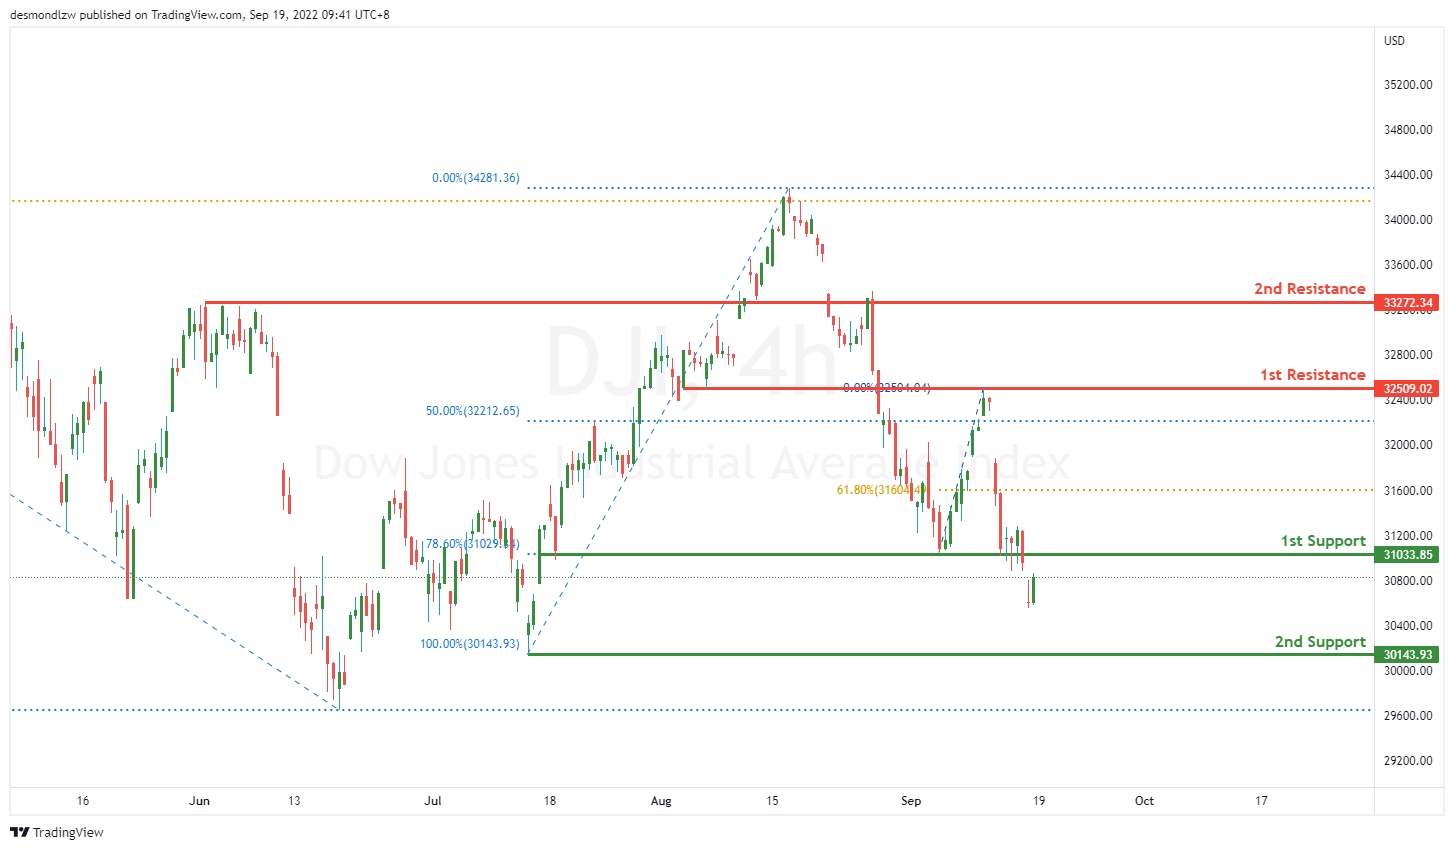
On the H4, price is reflected off nicely at the first resistance at 32500.85 where the 50% Fibonacci retracement is and broke right through the first support at 31029.34 where the 78.6% Fibonacci retracement is. Price might continue heading downwards towards the second support at 30343.73 where the previous swing low is.
Areas of consideration:
- H4 time frame, 1st support at 31029.34
- H4 time frame, 2nd support at 30343.73
DAX:
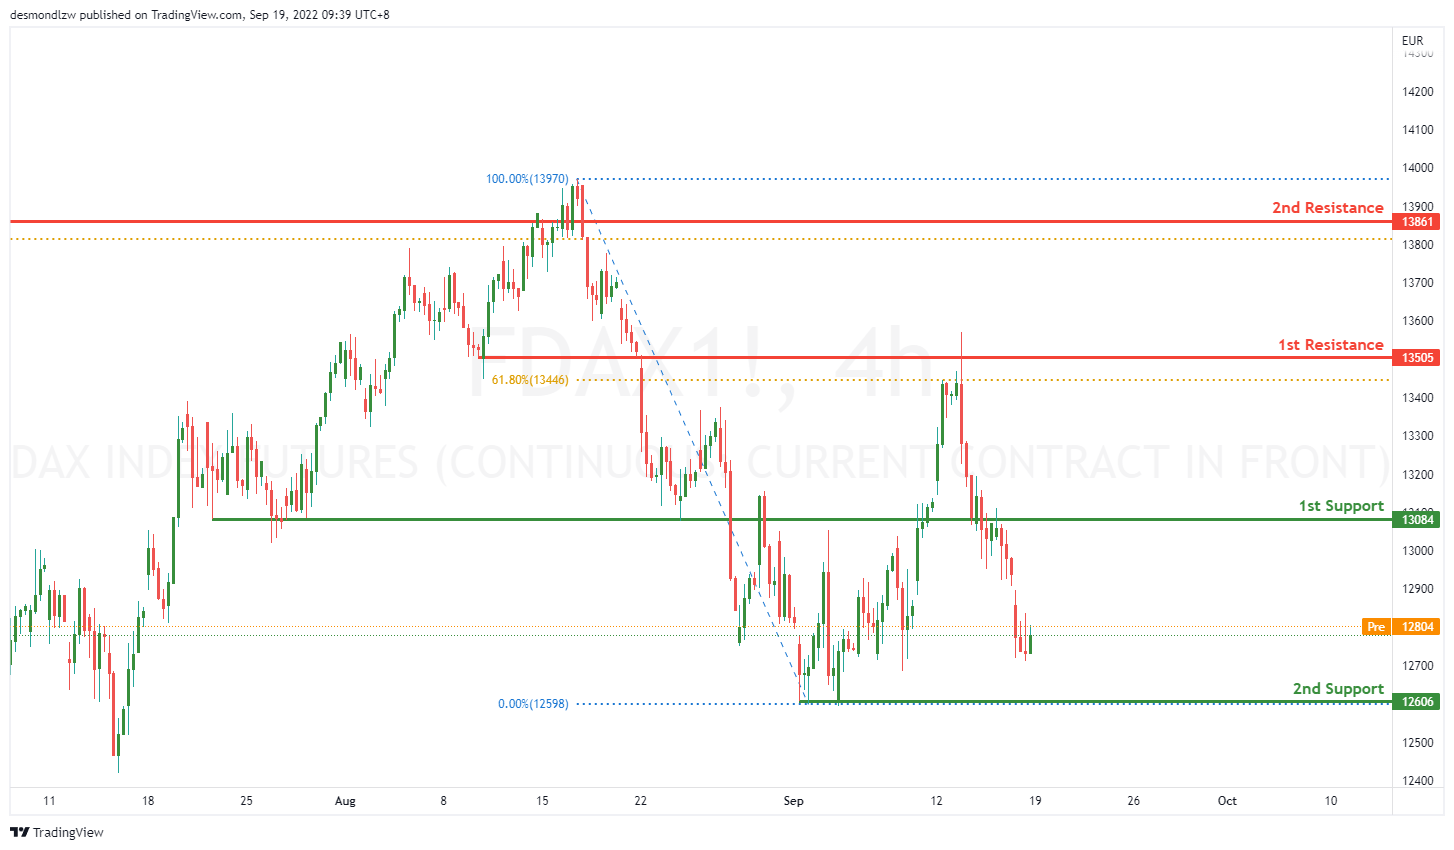
On the H4, price has reflected of the first resistance at 13505 where the 61.8% retracement is and got a big reaction breaking through the first support at 13084. Price might continue going down towards the second support at 12606 where the swing low is.
Areas of consideration:
- H4 time frame, 1st support at 13084
- H4 time frame, 2nd support at 12606
ETHUSD:
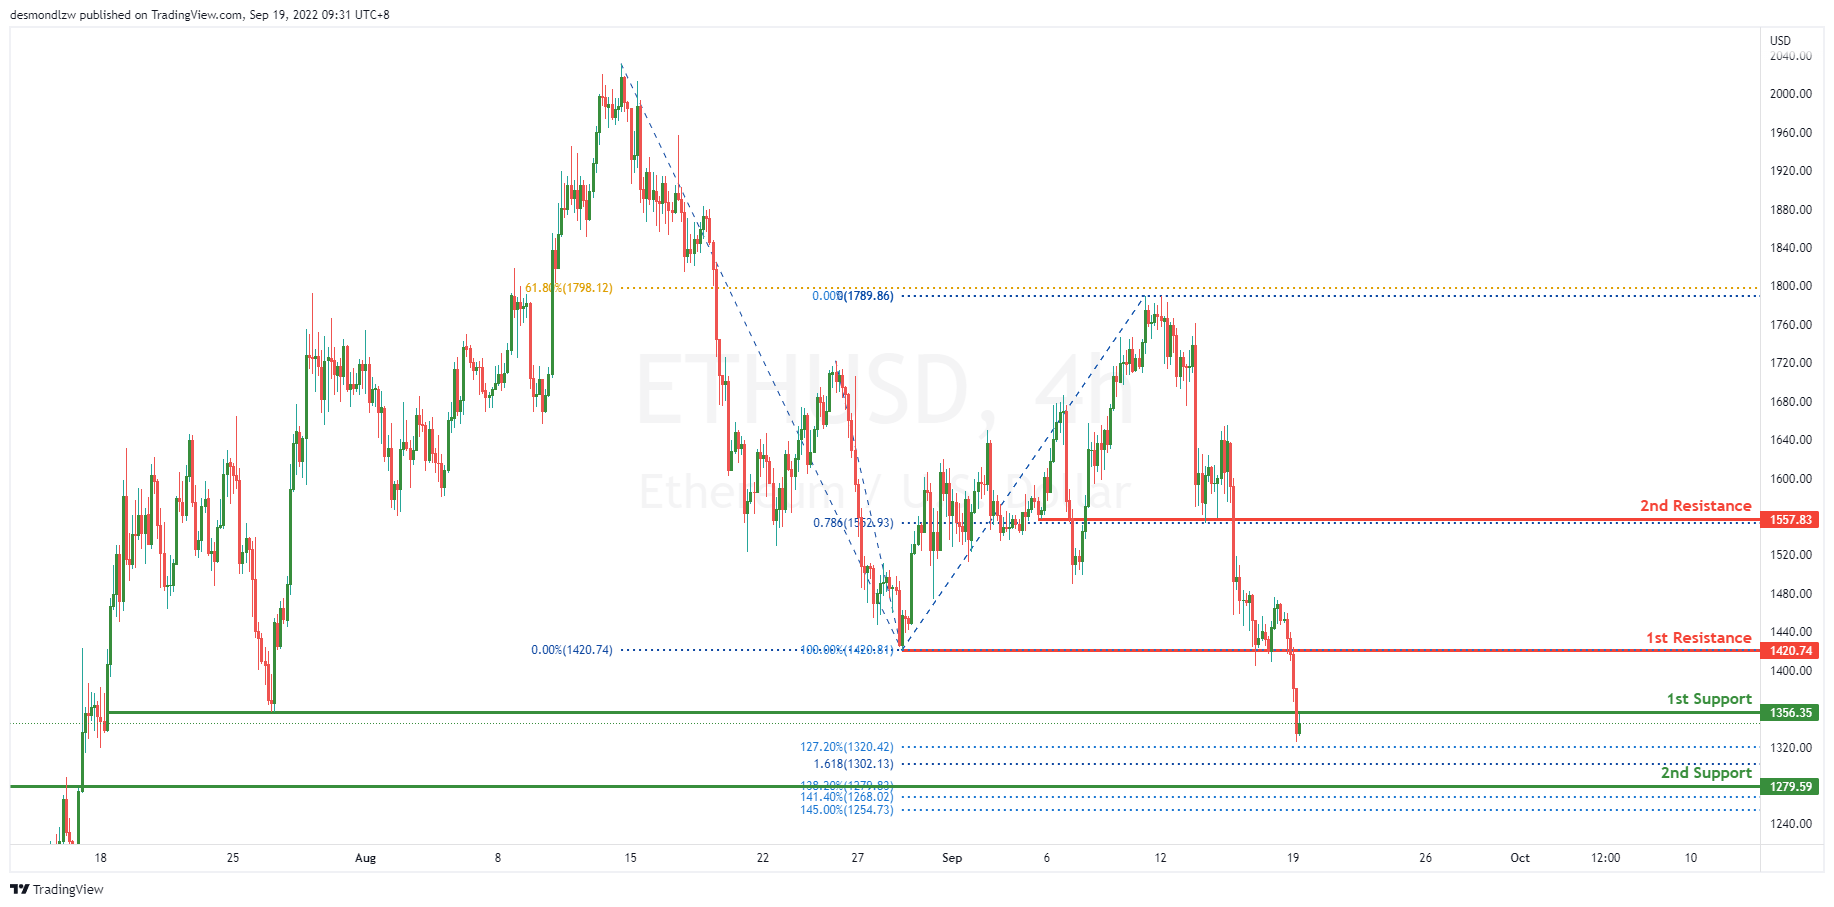
On the H4, price has pushed through the 1st Resistance at 1420.81 where the previous swing low sat. Price has also pushed through the 1st support at 1356.35 where the 127.2% Fibonacci extension lies. Expecting a pullback from the 127.2% Fibonacci extension back up to the 1st resistance at 1420.81.
Areas of consideration:
- H4 time frame, 1st resistance of 1420.81
- H4 time frame, 1st support at 1356.35
BTCUSD:
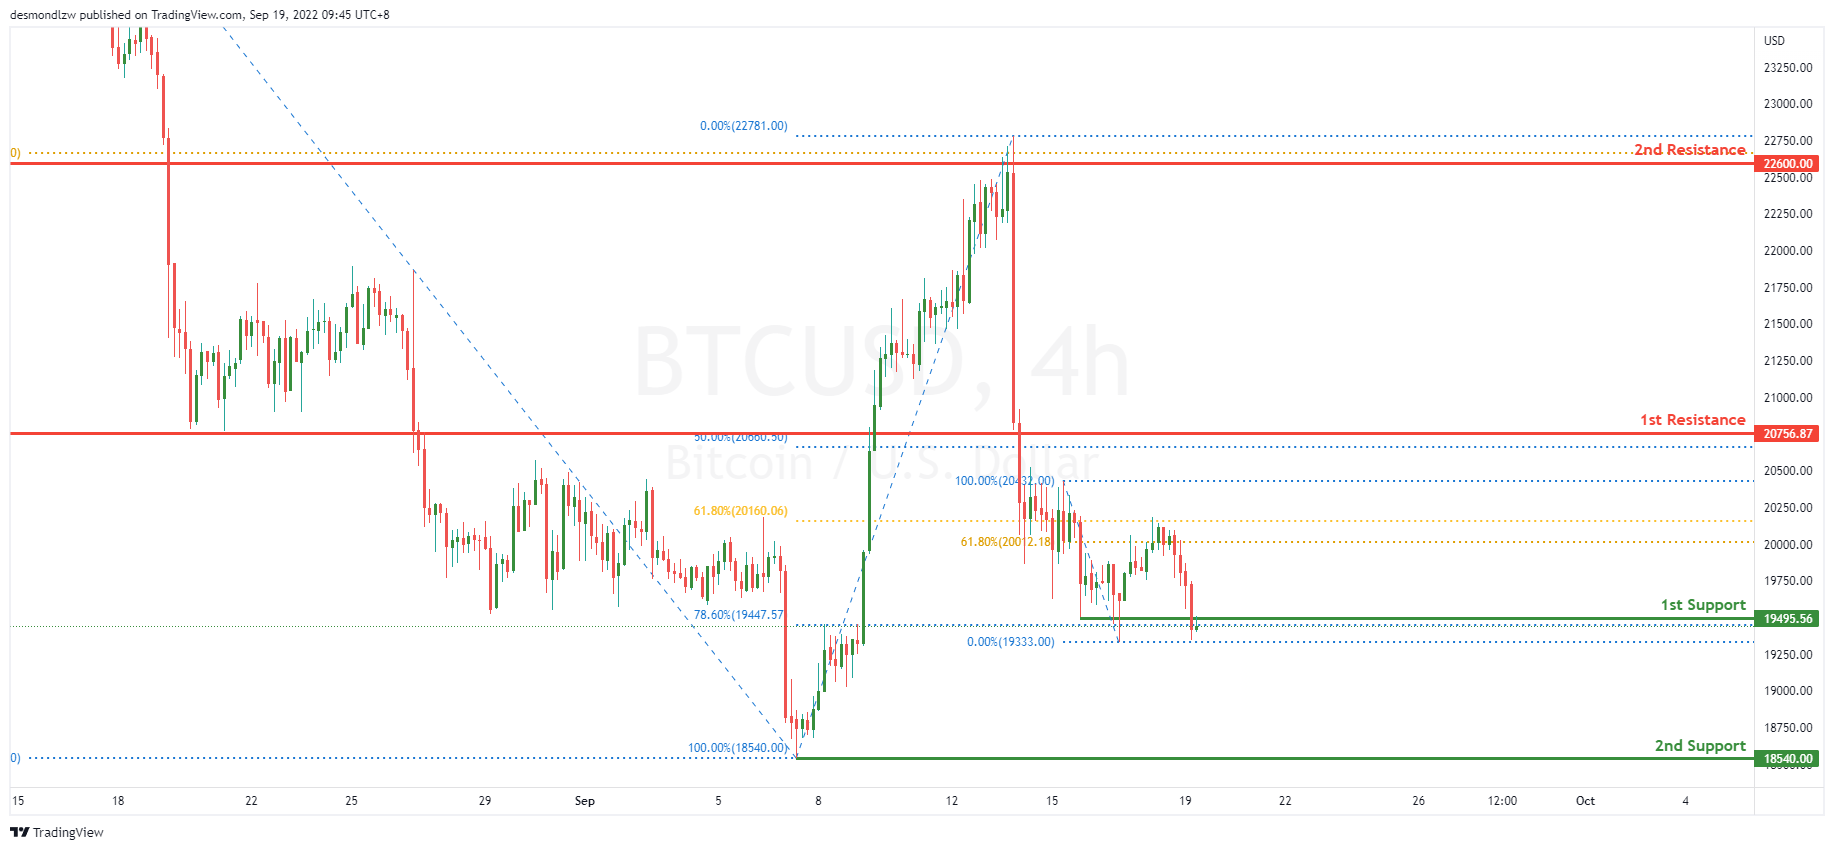
On the H4, price reflected off the first resistance at 22600.00, broke past the second resistance at 20756.87 and is moving in a bearish momentum hence we are bearish. Price has moved and pushed through the first support at 19557.00 where the 78.6% retracement sits. If bearish momentum continues, it should bring price to the second support 18540.00 where the previous swing low sits.
Areas of consideration:
- H4 time frame, 1st resistance of 22600.00
- H4 time frame, 1st support at 19557.00
S&P 500:
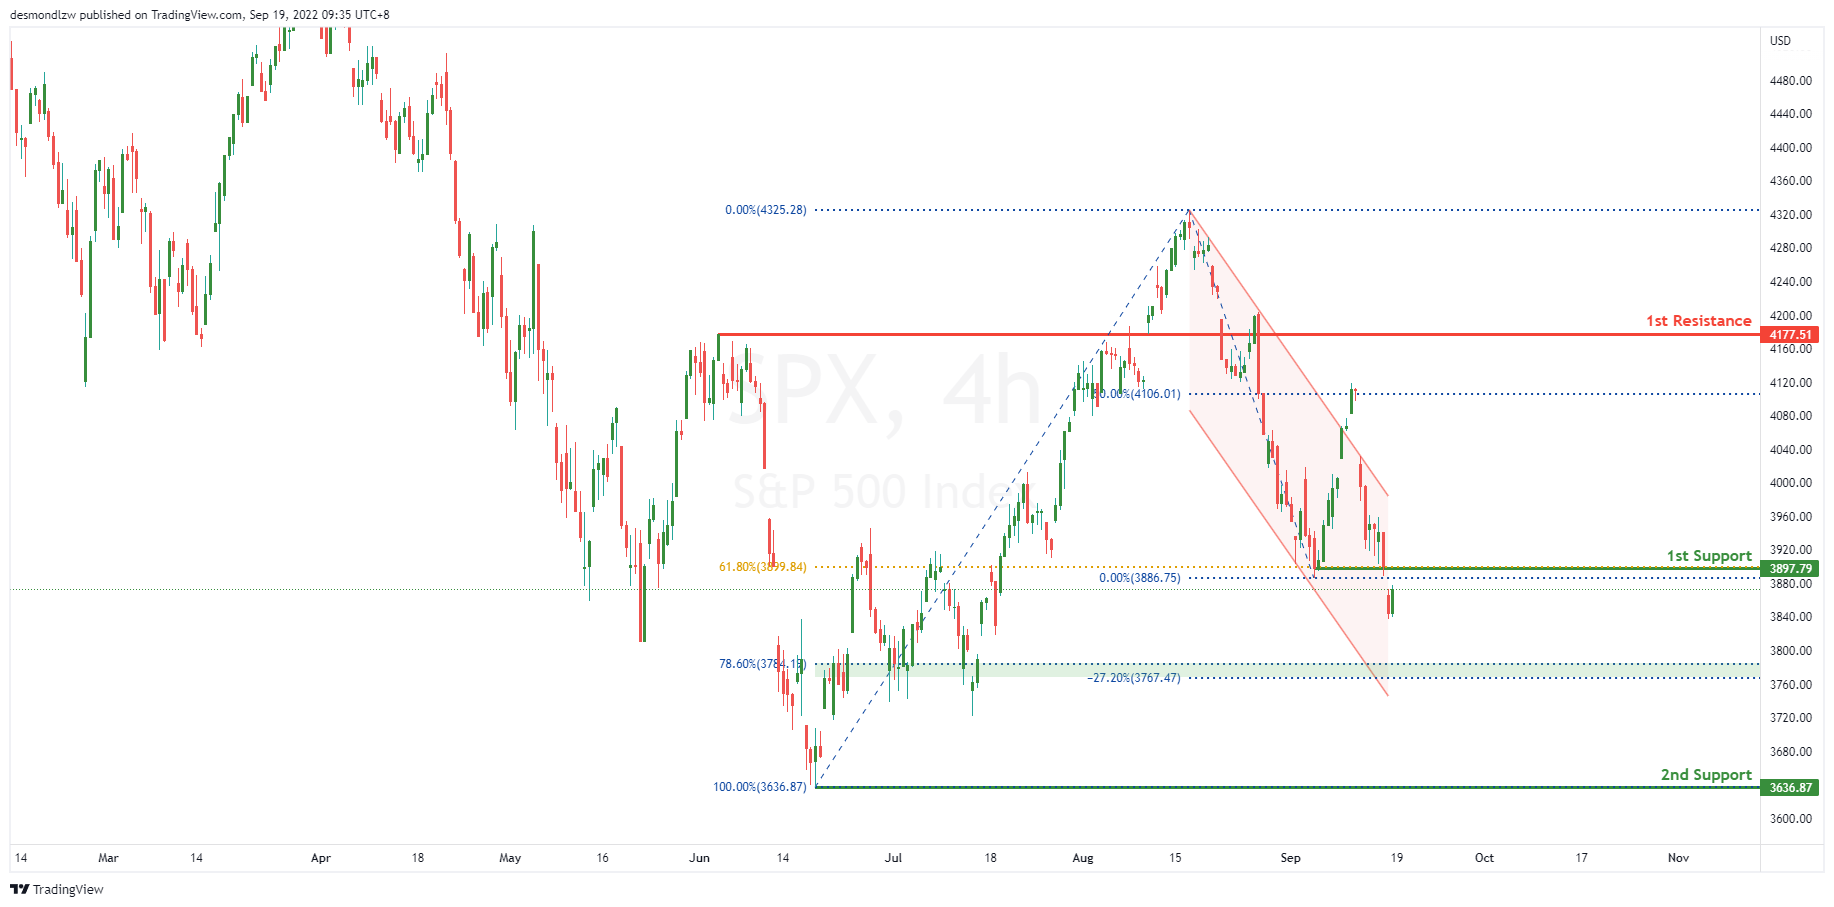
On the H4, the price reversed from the 4100 price area forming a bearish channel, with the price falling towards the 1st support are of 3900. With our bearish bias still valid, as price trades back towards the 61.8% Fibonacci retracement, look for price to test the 1st support area. Price has broken below the 1st support level, the price could fall towards the 78.6% Fibonacci retracement level of 3784.19. There could be some pullback up towards the 1st Support level area else it could head towards the 2nd support of 3636.87. As the price falls towards the 2nd support, it could find some pullback towards the 78.6% Fibonacci retracement pullback support area.
Areas of consideration:
- H4 time frame, 1st support at 3900
- H4 time frame, 2nd support at 3636.87
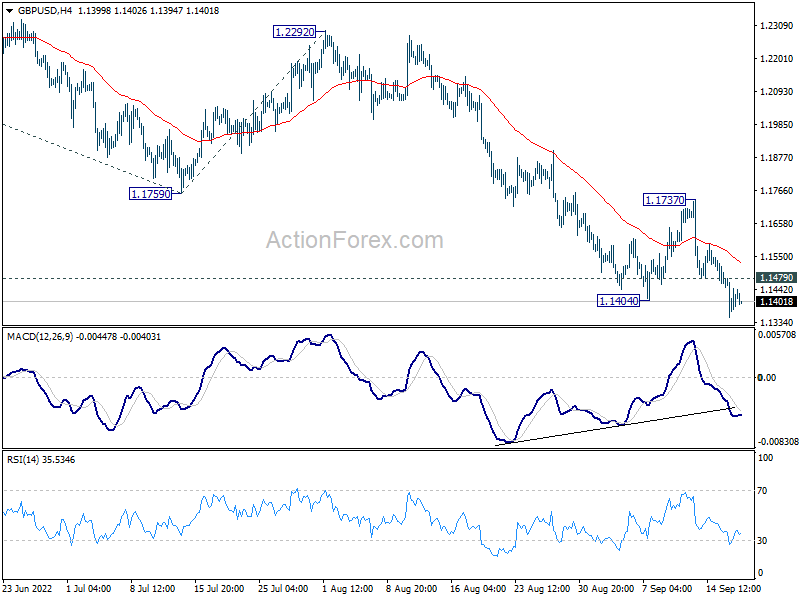
GBP/USD Daily Outlook
Daily Pivots: (S1) 1.1355; (P) 1.1418; (R1) 1.1485; More...
Intraday bias in GBP/USD stays on the downside this week. Current down trend should target 61.8% projection of 1.3748 to 1.1759 from 1.2292 at 1.1063. On the upside, above 1.1479 minor resistance will turn intraday bias neutral first. But break of 1.1737 resistance is needed to indicate short term bottoming. Otherwise, outlook will remain bearish in case of recovery.
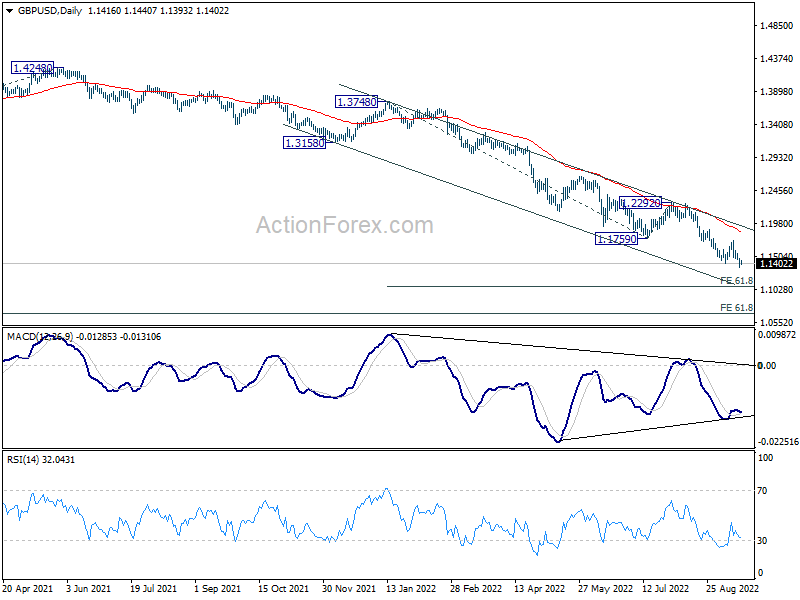
In the bigger picture, based on current momentum, fall from 1.4248 (2018 high) is probably resuming long term down trend from 2.1161 (2007 high). Sustained break of 1.1409 will target 61.8% projection of 1.7190 (2014 high) to 1.1409 (2020 low) from 1.4248 (2021 high) at 1.0675. This will remain the favored case for now as long as 1.2292 resistance holds.
Fed, SNB and BoE to Hike, BoJ to Stand Pat This Week
Dollar is trading with a slightly firmer tone in quiet Asian session. But overall, most major pairs and crosses are stuck inside Friday's range. Trading would likely remain subdued with Japan and UK on holiday, and the calendar is light. Nevertheless, the week ahead is ultra busy with four central bank meetings and some important economic data too.
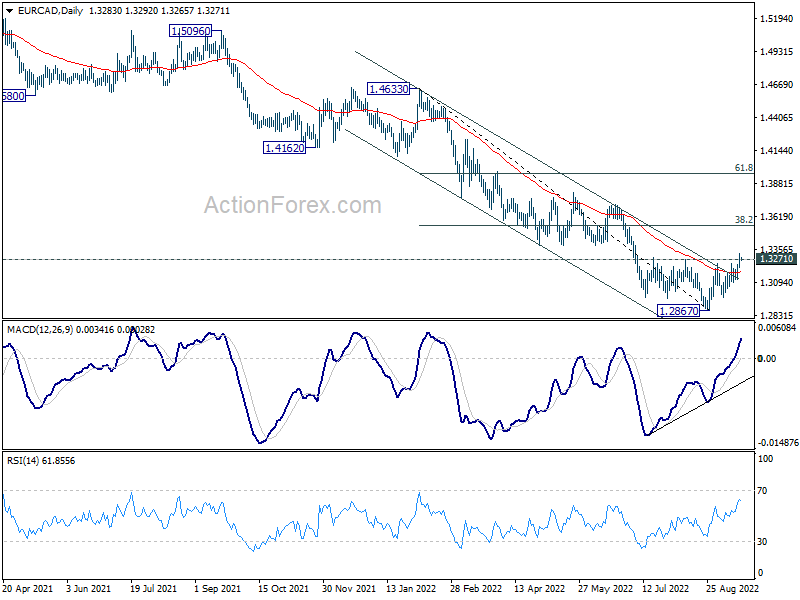
Technically, Euro has made nice bounces in some crosses, on expectation of hawkish ECB. EUR/CAD's break of 1.3271 resistance confirmed short term bottoming at 1.2867, on bullish convergence condition in daily MACD. The break above 55 day EMA, as well as the falling trend line resistance argues that it's at least correcting the decline from 1.4633. Further rally is in favor back to 38.2% retracement from 1.4633 to 1.2867 at 1.3542. Such development could help cushion any decline in EUR/USD.
In Asia, Japan is on holiday. Hong Kong HSI is down -0.99%. China Shanghai SSE is down -0.21%. Singapore Strait Times is down -0.09%.
ECB Lane: Tightening is not pain free
ECB Chief Economist Philip Lane said in a conference over the weekend, monetary tightening is "going to dampen demand", and "we're not going to pretend this is pain free".
"Demand is now a source of inflation pressure, it was not six or nine months ago in the same way it now is," he added.
While rate hikes could continue at each remaining meeting of the year, and extend to early next year, Lane said ECB is open mind on where to stop with a meeting-by-meeting approach.
On the economy, Lane said separately in an RTE interview, "If we think our base case is to barely grow, a technical recession - falling into a mild recession - cannot be ruled out."
Bundesbank Nagel: We have to be determined, in October and beyond
Bundesbank President Joachim Nagel said on Sunday, "If the data trend continues, more interest-rate increases have to follow -- that's already agreed in the Governing Council. We have to be determined, in October and beyond."
Nagel added that interest rates are still "somewhat off the levels" to curb inflation. "We must bring inflation back under control," he said. "We mustn't let up, even if the economy worsens."
On the German economy, he said that momentum will likely slow in Q3 and Q4, but he's confident that it could avoid a steep slump.
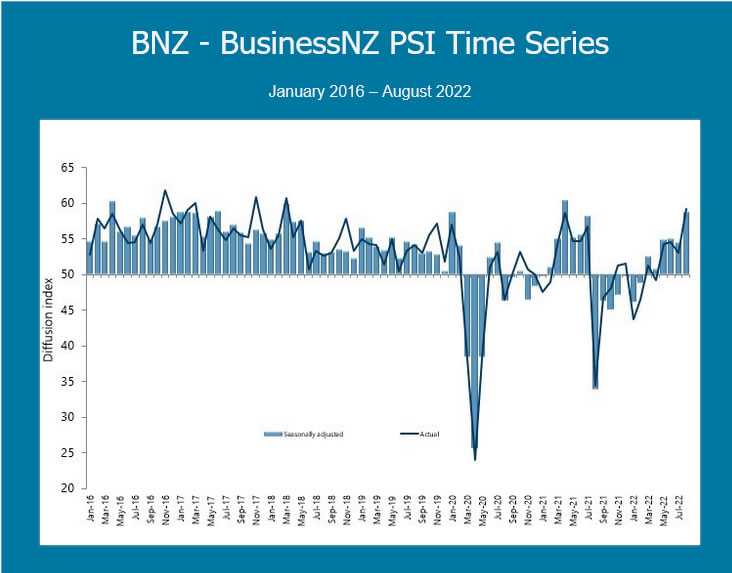
NZ BusinessNZ services rose to 58.6, bouncing for how long?
New Zealand BusinessNZ Performance of Services Index rose from 54.4 to 58.6 in August. Looking at some details, activity/sales rose from 54.4 to 67.1. Employment rose from 49.3 to 50.8. New orders/business rose from 53.4 to 66.5. Stocks/inventories rose from 53.8 to 59.6. Supplier deliveries rose from 47.6 to 49.6.
BNZ Senior Economist Doug Steel said that "overall, combining August's strong PSI with last week's firmer PMI yields a composite index (PCI) that suggests annual GDP growth up toward 5% in Q3 2022. We currently forecast 5%+ for that period but that strength is mostly a function of the very weak base period. If the PCI is truly bouncing, the key question is for how long?"
Fed, SNB and BoE to hike, BoJ to stand pat
Four central banks will meet this week. Fed is expected hike by another 75bps to 3.00-3.25%. There is some speculation of a 100bps hike, but Fed is unlikely to push the panic button and do that. The new economic projections and dot plot will also be released. Some hawkish surprise could be seen there, which indicates higher terminal rate for current cycle, and a longer period to stay there.
BoJ is expected to stay firmly on hold on monetary policy. Governor Haruhiko Kuroda might reiterate that rapid, one-sided depreciation in the exchange rate is undesirable, but nothing more. SNB is expected to joint the 75bps hike club, and lift interest rate back to positive at 0.50%. SNB will also repeat that appreciation of the Swiss Franc is welcome for now, as it helps curb imported inflation. BoE is expected to deliver another 50bps hike to 2.25%. Given that the UK economy is already in recession, there could be dovish surprises in the voting.
Other central bank activities include release of RBA minutes and ECB monthly bulletin. On the data front, Canada CPI and retail sales will catch much attention, together with PMIs from Australia, Eurozone, UK and the US.
Here are some highlights for the week:
- Monday: New Zealand BusinessNZ services; Canada IPPI, RMPI; US NAHB housing index.
- Tuesday: Japan CPI; RBA minutes; Swiss trade balance, SECO economic forecasts Germany PPI; Eurozone current account; Canada CPI, US building permits and housing starts.
- Wednesday: UK public sector net borrowing, CBI industrial order expectations; US existing home sales, FOMC rate decision.
- Thursday: New Zealand trade balance; BoJ rate decision; SNB rate decision; ECB monthly bulletin; BoE rate decision; Canada new housing price index; US jobless claims, current account, consumer confidence.
- Friday: Australia PMIs; Eurozone PMIs; UK PMIs; Canada retail sales; US PMIs.
GBP/USD Daily Outlook
Daily Pivots: (S1) 1.1355; (P) 1.1418; (R1) 1.1485; More...
Intraday bias in GBP/USD stays on the downside this week. Current down trend should target 61.8% projection of 1.3748 to 1.1759 from 1.2292 at 1.1063. On the upside, above 1.1479 minor resistance will turn intraday bias neutral first. But break of 1.1737 resistance is needed to indicate short term bottoming. Otherwise, outlook will remain bearish in case of recovery.
In the bigger picture, based on current momentum, fall from 1.4248 (2018 high) is probably resuming long term down trend from 2.1161 (2007 high). Sustained break of 1.1409 will target 61.8% projection of 1.7190 (2014 high) to 1.1409 (2020 low) from 1.4248 (2021 high) at 1.0675. This will remain the favored case for now as long as 1.2292 resistance holds.
Economic Indicators Update
| GMT | Ccy | Events | Actual | Forecast | Previous | Revised |
|---|---|---|---|---|---|---|
| 22:30 | NZD | Business NZ PSI Aug | 58.6 | 51.2 | 54.4 | |
| 10:00 | EUR | German Buba Monthly Report | ||||
| 12:30 | CAD | Industrial Product Price M/M Aug | 0.20% | -2.10% | ||
| 12:30 | CAD | Raw Material Price Index Aug | 3.20% | -7.40% | ||
| 14:00 | USD | NAHB Housing Market Index Sep | 48 | 49 |
NZ BusinessNZ services rose to 58.6, bouncing for how long?
New Zealand BusinessNZ Performance of Services Index rose from 54.4 to 58.6 in August. Looking at some details, activity/sales rose from 54.4 to 67.1. Employment rose from 49.3 to 50.8. New orders/business rose from 53.4 to 66.5. Stocks/inventories rose from 53.8 to 59.6. Supplier deliveries rose from 47.6 to 49.6.
BNZ Senior Economist Doug Steel said that "overall, combining August's strong PSI with last week's firmer PMI yields a composite index (PCI) that suggests annual GDP growth up toward 5% in Q3 2022. We currently forecast 5%+ for that period but that strength is mostly a function of the very weak base period. If the PCI is truly bouncing, the key question is for how long?"
ECB Lane: Tightening is not pain free
ECB Chief Economist Philip Lane said in a conference over the weekend, monetary tightening is "going to dampen demand", and "we're not going to pretend this is pain free".
"Demand is now a source of inflation pressure, it was not six or nine months ago in the same way it now is," he added.
While rate hikes could continue at each remaining meeting of the year, and extend to early next year, Lane said ECB is open mind on where to stop with a meeting-by-meeting approach.
On the economy, Lane said separately in an RTE interview, "If we think our base case is to barely grow, a technical recession - falling into a mild recession - cannot be ruled out."
Bundesbank Nagel: We have to be determined, in October and beyond
Bundesbank President Joachim Nagel said on Sunday, "If the data trend continues, more interest-rate increases have to follow -- that's already agreed in the Governing Council. We have to be determined, in October and beyond."
Nagel added that interest rates are still "somewhat off the levels" to curb inflation. "We must bring inflation back under control," he said. "We mustn't let up, even if the economy worsens."
On the German economy, he said that momentum will likely slow in Q3 and Q4, but he's confident that it could avoid a steep slump.
EUR/USD Faces Uphill Task, USD/JPY Signals Correction
Key Highlights
- EUR/USD is attempting a recovery wave above 1.0000.
- A major bullish trend line is forming with support at 0.9995 on the 4-hours chart.
- GBP/USD extended losses below the 1.1450 support zone.
- USD/JPY is signaling a downside correction from the 145.00 resistance.
EUR/USD Technical Analysis
The Euro faced a strong resistance near the 1.0197 against the US Dollar. EUR/USD started a fresh decline and traded below the 1.0060 support zone.

Looking at the 4-hours chart, the pair extended losses below the 1.0020 support, the 100 simple moving average (red, 4-hours), and the 200 simple moving average (green, 4-hours).
It traded as low as 0.9945 before the bulls took a stand. It is now consolidating losses above the 0.9980 level. On the upside, the pair is facing a strong resistance near the 1.0060 zone and the 200 simple moving average (green, 4-hours).
The 50% Fib retracement level of the key decline from the 1.0197 swing high to 0.9945 low is also near the 1.0070 level to act as a resistance.
A clear move above the 1.0060 and 1.0070 levels could open the doors for a larger increase. In the stated case, the pair might rise towards the 1.0120 and 1.0130 levels.
On the downside, an initial support is near the 0.9995 level. There is also a major bullish trend line forming with support at 0.9995 on the same chart. A downside break below the trend line support might spark a sharp decline towards the 0.9950 support.
The next major support is near the 0.9920 level, below which the pair could even test the 0.9900 level in the coming sessions.
Looking at USD/JPY, the pair made two attempts to clear the 145.00 resistance level, but failed. As a result, there is a risk of a downside correction to 140.00.
Economic Releases
- NAHB Housing Market Index for Sep 2022 – Forecast 48, versus 49 previous.
Eco Data 9/19/22
[php_everywhere instance="1"]
Forex and Cryptocurrencies Forecast
EUR/USD: Ahead of the US Federal Reserve FOMC Meeting
The World Bank said last week that risks of a recession in 2023 are growing amid simultaneous tightening of monetary policy by the world's leading Central banks and the energy crisis in Europe. According to Citigroup strategists, the dollar remains the only safe haven for investors to hedge against the risk of drawdown in investment portfolios.
Global stock markets have lost $23 trillion since the early 2022, and bond prices have also declined. As for the US currency, it continues to grow, unlike stocks and other risky assets. According to experts' forecasts, the DXY Dollar Index may come close to 112.00 points over the next three months, renewing a 20-year high. Investors' belief that the US economy will cope better with the impending global recession than the economies of other countries and regions strengthens the dollar as well.
Markets are now focused on the next FOMC meeting of the US Federal Reserve, which will be held on Wednesday, September 21. The key parameters that determine the monetary policy of the Central Bank at the present stage are inflation and the state of the labor market. Important statistics were released last week, including retail sales and unemployment claims in the US. This data strengthened investors in the opinion that the Fed will continue the policy of quantitative tightening (QT). According to the CME Group, the probability of another rate increase by 75 basis points (bp) is estimated at 74%, and by 100 bps at 26%. In addition, Wells Fargo analysts believe that the rate hike will be supplemented by an acceleration in the rate of balance sheet reduction.
The Fed's forecast for a neutral level of interest rates will be updated at this meeting as well. The median forecast for the federal funds rate in 2022 is expected to be revised to 3.875%, up from 3.375% in the June forecast.
All of the above steps may lead to further strengthening of the dollar and the fall of the stock market. The reverse scenario will be possible only if the announced plans are suddenly abandoned. However, this can only happen with a sharp decline in GDP, rising unemployment and a convincing victory over inflation. Neither one, nor the other, nor the third has yet been observed in the United States.
The Consumer Price Index (CPI), published on September 13, fell from 8.5% to 8.3% over the month. However, the forecast assumed a stronger fall, to 8.1%. An additional negative was the rise in core inflation to 6.3% y/y, which is the highest since March and more than three times higher than the Central Bank's target of 2%. But the labor market, on the contrary, is doing quite well, which supports forecasts for a rise in interest rates. Employment growth over the past two months has been robust, averaging 421K new jobs.
As for the Eurozone, inflation accelerated to 9.1% in August. Based on this, some analysts believe that the ECB may also continue to raise the rate in 0.75% increments. However, the next meeting of this regulator is not yet soon, on October 27. So it lags far behind in tightening (QT) from its overseas counterpart. At the same time, according to Rabobank strategists, the unstable situation in the region may mean that "raising rates will not significantly strengthen the euro." Given the strength of the US dollar, experts believe that the EUR/USD pair may fall to 0.9500 in the coming weeks.
The EUR/USD ended the week at 1.0013. At the time of writing this review, on the evening of Friday, September 16, the votes of the experts are distributed as follows. 75% of analysts say that the pair will continue moving south in the near future, another 25% vote for the continuation of the side trend along Pivot Point 1.0000. There is not a single vote on the side of the bulls.
Among the trend indicators on D1, 65% are red, 35% are green. Among the oscillators, 25% are on the green side, the same 25% on the red side, and 50% are colored neutral gray.
The pair has been moving along the parity line for the past four weeks. The main trading range was within 0.9900-1.0050. Taking into account breakdowns in both directions, it is somewhat wider: 0.9863-1.0197. The next strong support after the 0.9860 zone is located around 0.9685, the bears' target, as mentioned above, is 0.9500. The resistance levels and targets of the bulls look like this: 1.0050, 1.0080, 1.0130, then 1.0200 and 1.0254, the next target area is 1.0370-1.0470.
In addition to the FOMC (Federal Open Market Committee) meeting and subsequent forecasts and comments, we expect fresh data on unemployment in the US next week. It will be published on Thursday September 23. And business activity indicators (PMI) in Germany and in the Eurozone as a whole will become known at the end of the working week, on Friday, September 23.
GBP/USD: Ahead of the Bank of England Meeting
The British currency has set another anti-record. Having risen to 1.1737 at the beginning of the week, GBP/USD then turned around and flew down rapidly. Wednesday brought a little respite, and then the flight continued. The landing occurred on Friday 16 September at 1.1350. The pair was this low 37 years ago, in 1985. The last chord of the week sounded 75 points higher, at 1.1425.
Apart from the strengthening of the dollar on expectations of a rate hike by the Fed, additional pressure on the British currency was exerted by a drop in retail sales in the United Kingdom. They fell 1.6% m/m in August, more than three times the 0.5% forecast.
According to analysts, a strong technical correction can stop the collapse. And that's only for a while. Strategists from MUFG Bank believe that the downtrend of GBP/USD may continue to a historic low of 1.0520. "With the UK budget and current account deficits combined to reach an impressive 15% of GDP, downward pressure on the GBP will continue," they write.
The Bank of England will also announce its interest rate decision the next day after the FOMC meeting, on Thursday, September 22. The main forecast suggests that it may rise by 50 bp, from 1.75% to 2.25%. However, it is possible that the regulator will immediately raise the rate to 2.50%, which will support the British currency for some time.
However, this is a double-edged sword. If the rate increase forecast comes true, this will create an even greater burden on the country's economy, whose health is already causing serious concern. We previously wrote that, according to the estimates of the British Chamber of Commerce (BCC), the UK is already in the midst of a recession, and inflation will reach 14% this year. And according to Goldman Sachs, it could reach 22% by the end of 2023, which will provoke a protracted economic downturn and a contraction of the economy by more than 3.5%. British energy regulator Ofgem has already announced that average annual electricity bills for UK households will rise by 80% from October. And according to the Financial Times, the number of fuel-poor households will more than double in January to 12 million.
Ahead of the Fed and Bank of England meetings, the median outlook for next week looks neutral. A third of the analysts side with the dollar, another third - with the pound, and another third have taken a neutral position. The readings of the indicators on D1 are almost all red again. These are 100% among the trend indicators. For oscillators, 85% point south and 15% point east. No oscillators are pointing north.
As for the bulls, they will meet resistance in the zones and at the levels of 1.1475, 1.1535, 1.1600, 1.1650, 1.1710-1.1740, 1.1800, 1.1865-1.1900, 1.2000. The nearest support is in the 1.1400-1.1415 zone, followed by the September 16 low at 1.1350. One can only guess to what levels, given the increased volatility, the pair may fall further. Let us only repeat that the 1985 historical low is at 1.0520.
Among the events of the coming week, except for the Bank of England meeting, the calendar includes Friday, September 23, when data on business activity (PMI) in the UK will be published. It should also be noted that the country has a bank holiday on Monday, September 19.
USD/JPY: Ahead of the Bank of Japan Meeting
In addition to the Fed and Bank of England meetings, the Bank of Japan (BOJ) will also meet next week. According to forecasts, the Japanese regulator will continue to adhere to the ultra-soft monetary policy and keep the negative interest rate (-0.1%) unchanged.
A miracle can happen of course, but its probability is close to 0. At the same time, the BOJ's unilateral actions, according to economists from Societe Generale, will only be enough to stop the weakening of the yen. But they will not be enough to reverse the USD/JPY downtrend. Societe Generale calls a recession in the US, which will lead to a drop in the yield of US Treasury obligations, as another prerequisite.
USD/JPY ended the trading session last week at 142.90, failing to reach the 145.00 high. However, according to Bank of America analysts, the pair's bullish sentiment remains, and it is still aimed at moving towards 150.00. At the same time, bank specialists note the following three levels: Fibo 38.2% correction (head and shoulders) at 145.18, the peak of 1999 at 147.00, and the target A=C at 149.53.
The closest resistance for the pair, just like a week ago, is 143.75. The bulls' task No. 1 is to gain a foothold above 145.00. Back in the spring, when analyzing the rate of the pair's rise, we made a forecast according to which it could reach a peak of 150.00 in September. And it may come true against the background of a rise in the Fed's interest rate. Supports for the pair are located at the levels and in the zones 142.00-142.20, 140.60, 140.00, 138.35-139.05, 137.50, 135.60-136.00, 134.40, 132.80, 131.70.
The opinion of Bank of America analysts is supported by 65% of experts, 25% have taken the opposite position, the remaining 10% remain neutral. Oscillators on D1 are 100% on the green side, although 10% of them signal being overbought. Among trend indicators, 75% are green and 25% are red.
With the exception of the BOJ meeting, no important macro data on the Japanese economy is expected to be released this week. Traders should also note that Monday, September 19 and Friday, September 23 are non-working days in Japan.
CRYPTOCURRENCIES: ETH After the Merge: Fall Instead of Growth
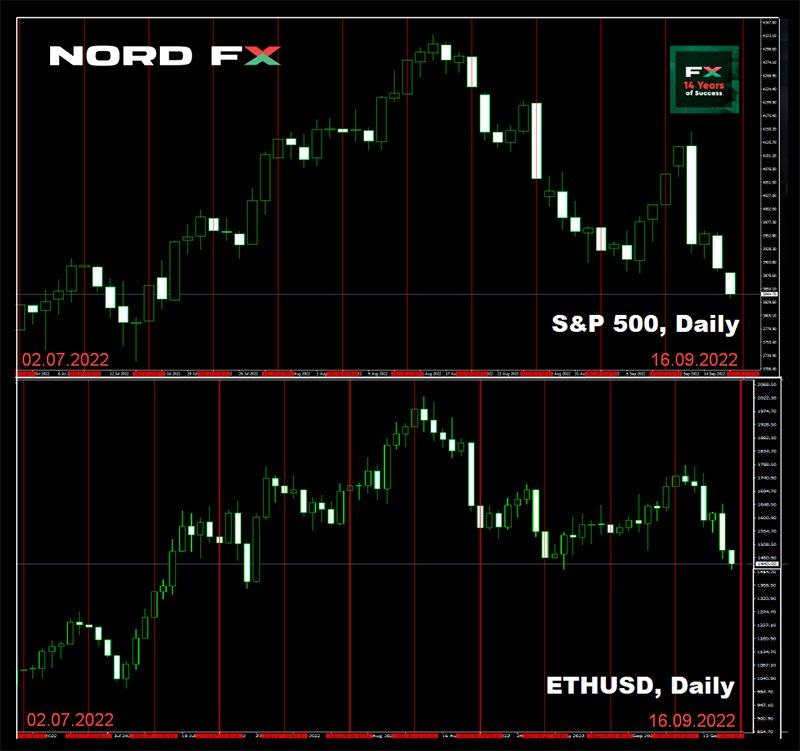
We usually start our review with the main cryptocurrency, bitcoin. But this time, let's deviate from the rules and give the palm to the main altcoin, Ethereum. This is due to an event that may become the most important for the crypto industry in 2022. On September 15, the ETH network hosted the global update The Merge, which involves the transition of the altcoin from the Proof-of-Work protocol to Proof-of-Stake (PoS). This means that now the security of the blockchain will be ensured not by miners, but by validators: users who have deposited and blocked their share of coins (staking).
Now, instead of running large networks of computers, validators will use their Ethereum cache as a means of validating transactions and mining new tokens. This should improve the speed and efficiency of the network so that it can process more transactions and solve the problem of user growth. The developers claim that the update will make the network that hosts the ecosystem of cryptocurrency exchanges, lending companies, non-playable token (NFT) markets and other applications more secure and scalable. In addition, cryptocurrencies have been constantly criticized for their huge energy consumption. Ethereum will now consume 99.9% less of it.
Enthusiasts believe that this merge will revolutionize the industry and allow Ethereum to overtake bitcoin in capitalization and value. However, many authoritative voices sound much calmer. For example, Bank of America (BofA) believes that this hard fork will not solve the problem of scalability or high fees but may lead to wider institutional adoption. The notable decrease in power consumption after The Merge will allow some investors to purchase this altcoin for the first time. "The ability to place ETH and generate higher quality returns (lower credit and liquidity risk) as a validator or through staking could also drive institutional adoption," BofA admitted.
CoinShares Chief Strategy Officer Meltem Demirors looks more pessimistic. He believes that investors are ignoring the overall market situation in the hype around the Merge. And it's not certain that this event will attract significant investment capital: "The reality is more prosaic," says the CoinShares strategist. "At the global level, investors are concerned about rates and macro indicators. And I don't believe that significant amounts of new capital are likely to enter ETH."
Time will tell how the market will eventually react to the Merge. In the meantime, instead of growth, there has been a fall. The trigger was the collapse of stock indices (S&P500, Dow Jones and Nasdaq), which was provoked by US inflation data for August. Market participants decided that in such a situation the Fed would tighten its monetary policy more actively and raise interest rates. It is expected that the rate will rise by another 0.75% or even 1.0% next week. As a result, the dollar began to rise sharply, while risky assets, including bitcoin and Ethereum, fell. BTC fell to $19,341 by Friday evening, having lost 15% of its value over the week, ETH fell to $1,403, "shrinking" by 20%.
According to many experts, due to the hawkish position of the Fed and the ECB, the dynamics of the crypto market will remain negative at least until the end of the year. Against the backdrop of a reduction in market risk appetite, it will be difficult for bitcoin to stay above not only the psychologically important level of $20,000, but also above the June 18 low of $17,600. The latter threatens a further collapse.
A trader and analyst under the nickname filbfilb allowed in an interview with Cointelegraph the bitcoin to fall from current levels to $10,000-11,000. According to the specialist, bitcoin has become highly correlated with the US stock market, which is under enormous pressure due to the Fed's policies. The first cryptocurrency behaves as a risky asset, not as inflation insurance.
The expert noted that the upcoming winter will be a serious test for residents and politicians of the European Union, the consequences of which will have a negative impact on hodlers. The important thing will be how the countries of the Old World will cope with the energy crisis. According to him, everything is in the hands of diplomats who are able to prevent an emergency. Otherwise, risky assets will face a difficult future. "The dialogue between Russia and NATO is important: the sooner it starts, the higher the bitcoin low will be", filbfilb emphasized.
It should be noted here that the dependence of BTC on the US stock market weakened sharply in August and was at the annual low. However, it has begun to grow again and, according to the TradingView service, the correlation between bitcoin and the S&P 500 index has reached 0.59. The situation is similar with the Nasdaq. The correlation with it fell to 0.31 in August, and it rose to 0.62 in September. Analysts remind that the dependence of the crypto sphere on the stock market becomes strong after the correlation index rises above 0.5. When 0.7 is reached, the dependence becomes ideal.
However, despite the negative sentiments, there is still hope to see light at the end of the tunnel. The aforementioned filbfilb called bitcoin's Q1 2023 rally "obvious". The expert sees two reasons for this. The first is the seasonal factor. Downtrends end 1000 days after the halving (which will be early next year. The second is a change in sentiments to positive ones, based on game theory. With a probability of 2/3, the expert suggested that Europe will survive the coming winter. But if things go badly, it will increase the likelihood of a dialogue with Russia that will bring stability in the short term.
Cryptocurrency analyst with the nickname Rager does not believe in the decline of BTC to $12,000. He agreed that there are no guarantees when dealing with bitcoin. But, in his opinion, it is very likely that the asset is forming a bear market bottom above $19,000. Another analyst and trader with the nickname Rekt Capital believes that everything is moving towards the final phase of bitcoin's decline. "A significant part of the BTC bear market is behind us, and the entire bull market is ahead. The bottom of the bear market will be in November, December or the beginning of the Q1 2023."
Rekt Capital noted that the data signal a possible rise in BTC by 200%, but there is one caveat: Bitcoin could fall even more before it goes up. "Of course, in the short term, the BTC price could fall by 5%-10%," Rekt Capital writes. "But in the long term, a rally of more than 200% is very likely."
Despite the depreciation of BTC, Michael Saylor, the founder of MicroStrategy, hopes for the best. His company intends to proceed with the acquisition of this asset. It will reportedly sell $500 million worth of its own shares. The proceeds from these sales will be used, among other things, to replenish the cryptocurrency stocks. Note that MicroStrategy is the largest corporate bitcoin holder. It owns 129,699 coins purchased at an average exchange rate of $30,664. The last purchase (480 BTC) was made in June.
At the time of writing (Friday evening, September 16), this MicroStrategy investment is deeply unprofitable, as BTC/USD is trading at $19,730 (ETH/USD - $1,435). The total capitalization of the crypto market has again fallen below the psychologically important level of $1 trillion and is $0.959 trillion ($1.042 trillion a week ago). The Crypto Fear & Greed Index fell 2 points in seven days from 22 to 20 and is still in the Extreme Fear zone.
Dollar Jumped on Expectations of 75bps Fed Hike, Sterling and Franc Look to Rate Decisions Too
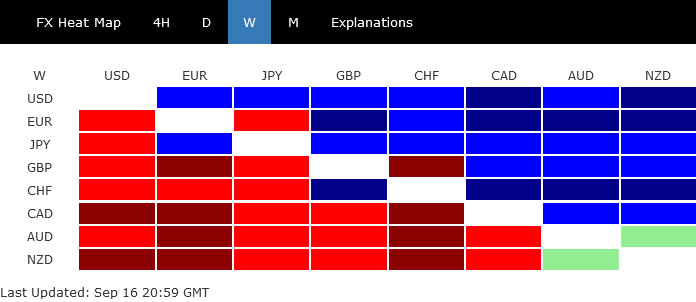
The stronger than expected consumer inflation data from the US basically sealed the case for a 75bps hike by Fed next. Dollar ended as the strongest one last week, as supported by risk aversion too. But the greenback could only close above prior week's high against Canadian and New Zealand Dollar, suggesting that momentum was relatively unconvincing. Yen recovered on intervention threat by Japan, and closed as second strongest, followed by Euro.
Commodity currencies ended as worst performers on risk sentiment. It's hard to say which one of Aussie, Kiwi and Loonie has an advantage over the others. Yet, it's the weakness in Pound that caught most attention, which hit multi-decade lows against Dollar and Swiss Franc.
Market fully pricing in 75bps Fed hike, Dollar index bounded in range
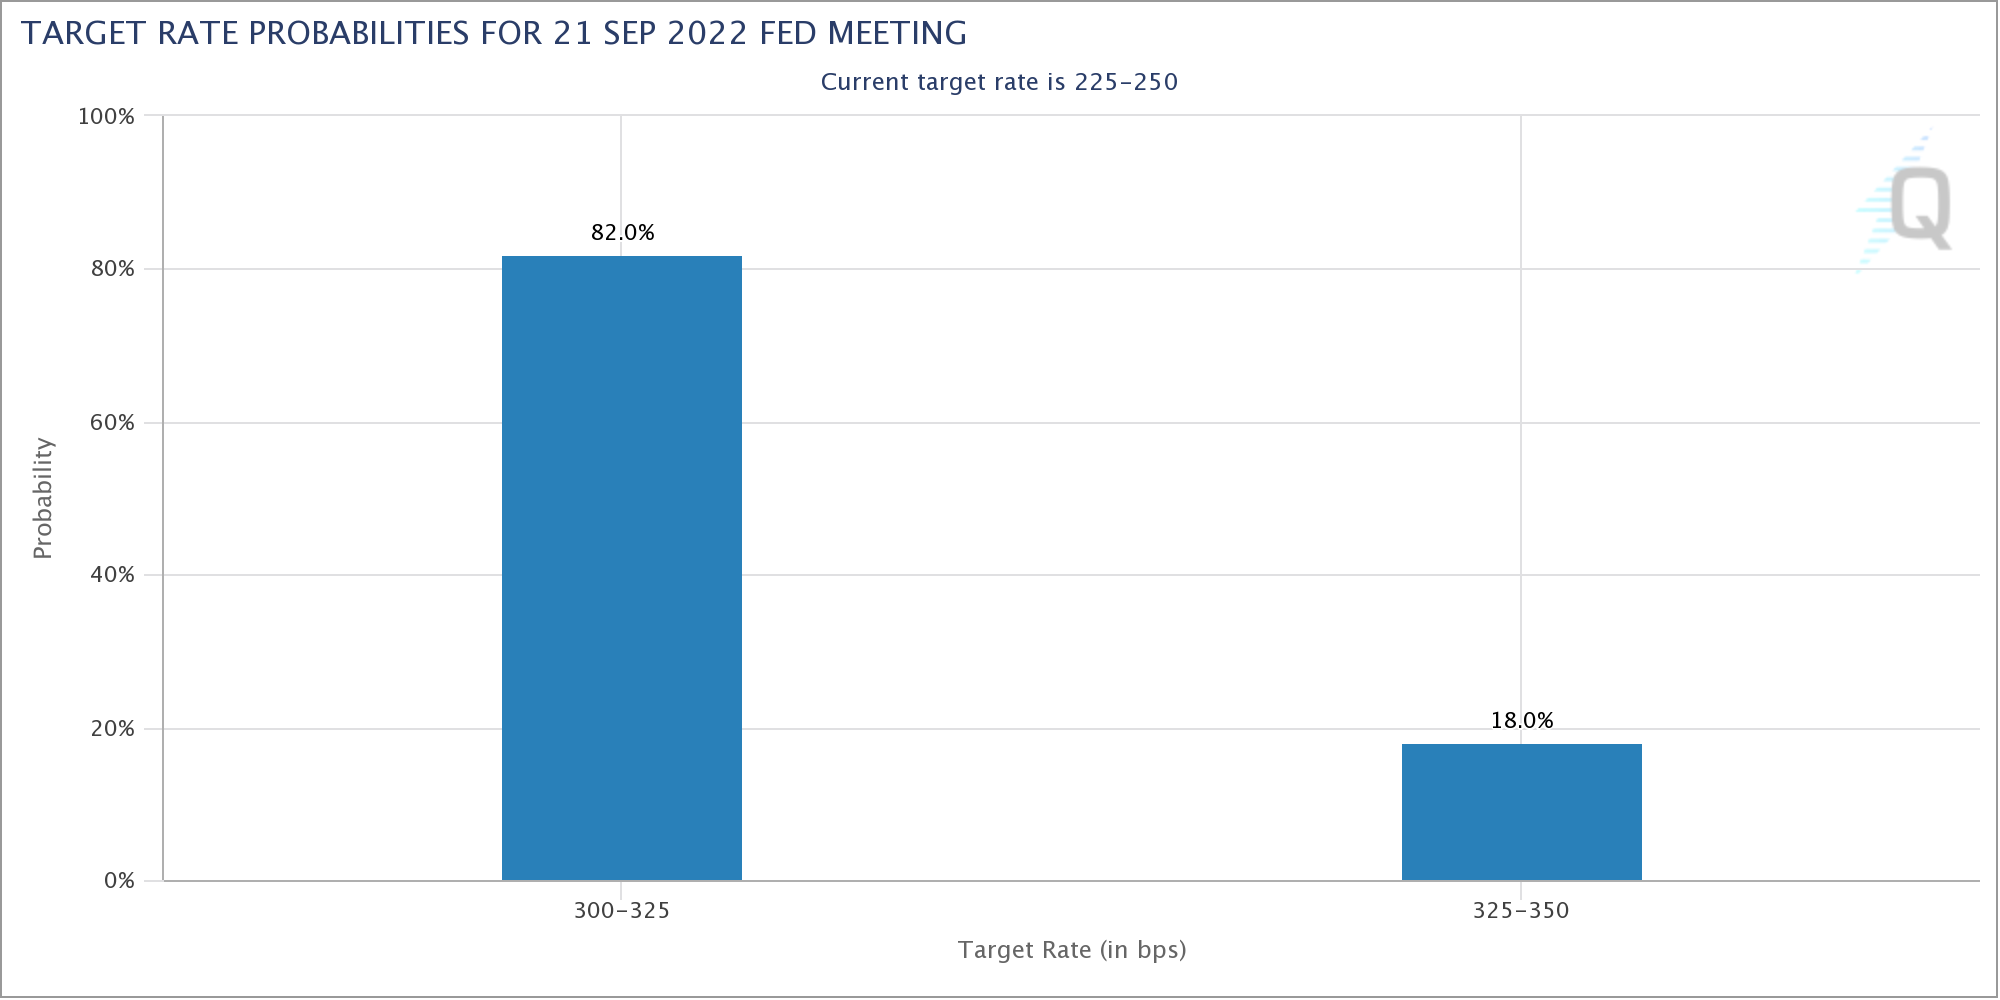
After stronger than expected August CPI reading from the US, markets are now fully pricing in a 75bps rate hike by FOMC this Wednesday on September 21. Indeed, there is 18% chance of a 100bps hike. Fed is likely not to upset market expectations for now, and show panic. But there could be hawkish surprises from the new economic projections and dot plot, which indicates higher terminal rate for current cycle, and a longer period to stay there.
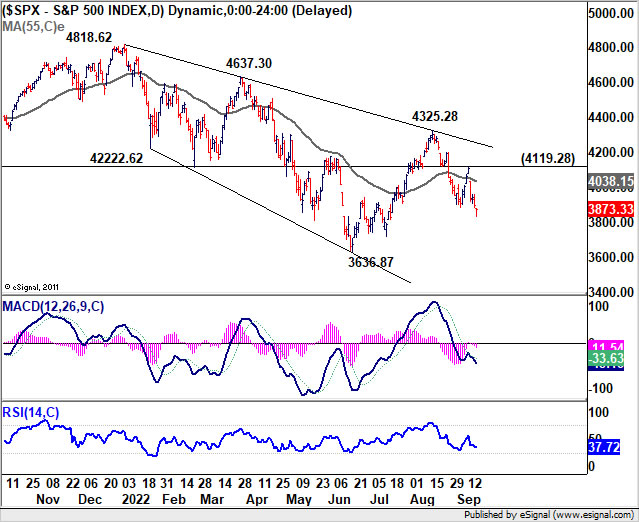
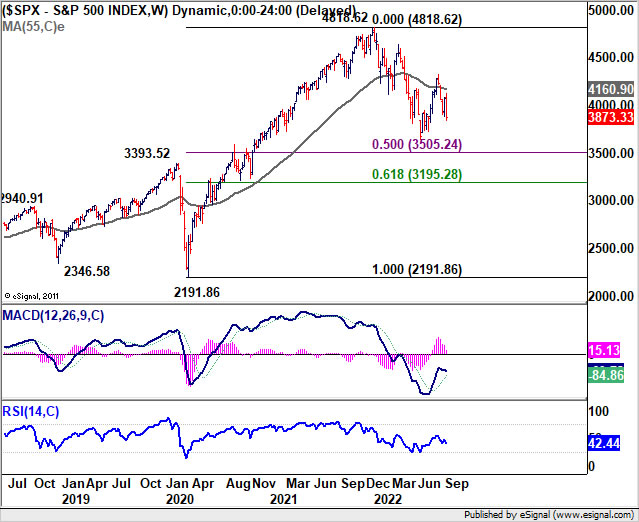
Major US stock indexes closed deeper lower, reversing all of prior week's rebound. S&P 500's close on Friday was not a very bad one. But further decline would be in favor as long as 4119.28 resistance holds. Current fall from 4325.28 is seen as part of the corrective pattern from 4818.62, which could fall through 3636.87 to 50% retracement of 2191.86 to 4818.62 at 3505.24 before completion.
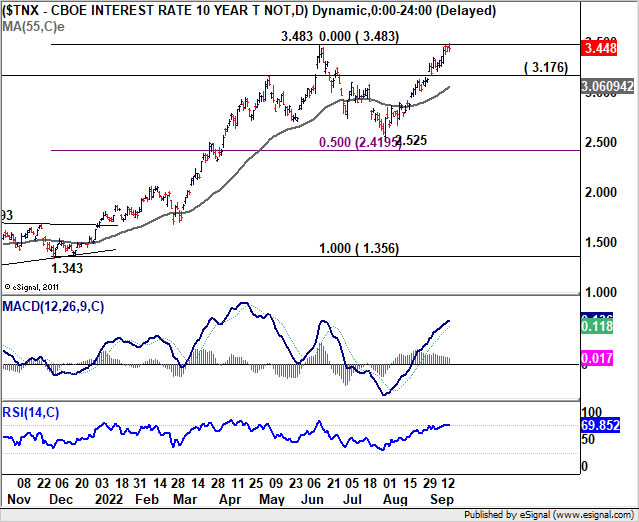
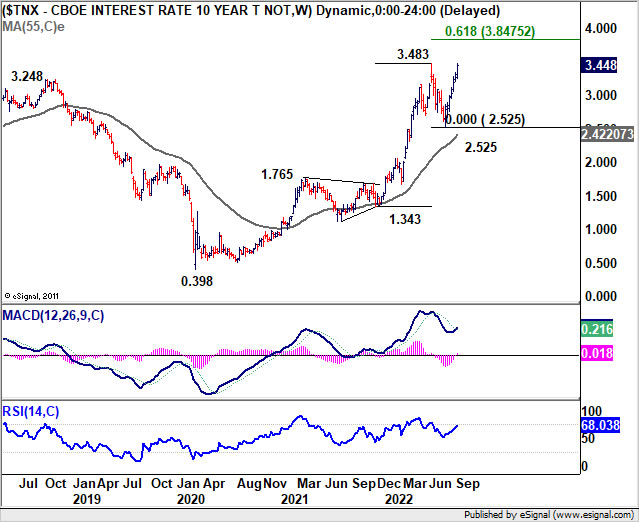
10 year-yield extended recent rise from 2.525 and breached 3.483 resistance, but could's close above. There could still be strong resistance from 3.483 to bring reversal, to extend the corrective pattern from there with a third leg (down). Yet, sustained break of 3.483 would indicate resumption of larger up trend. In that bullish case, next target is 61.8% projection of 1.343 to 3.483 from 2.525 at 3.847.
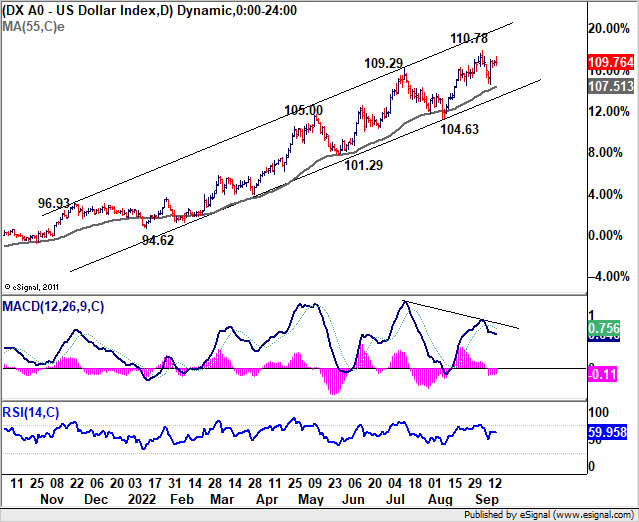
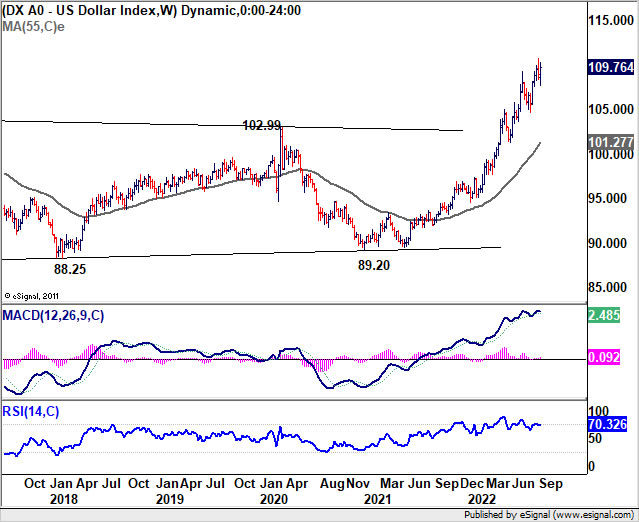
Dollar index bounded last week but stayed below 110.78 short term top. More consolidative trading could be seen in the near term. While bearish divergence condition in daily MACD indicates loss of upside momentum, there is so sign of reversal. Current up trend should resume sooner or later through 110.78. That could happen with either an up trend resumption in USD/JPY, or down trend resumption in EUR/USD, or both, in reaction to FOMC.
Yen recovered on jawboning, but no change in bearish trend
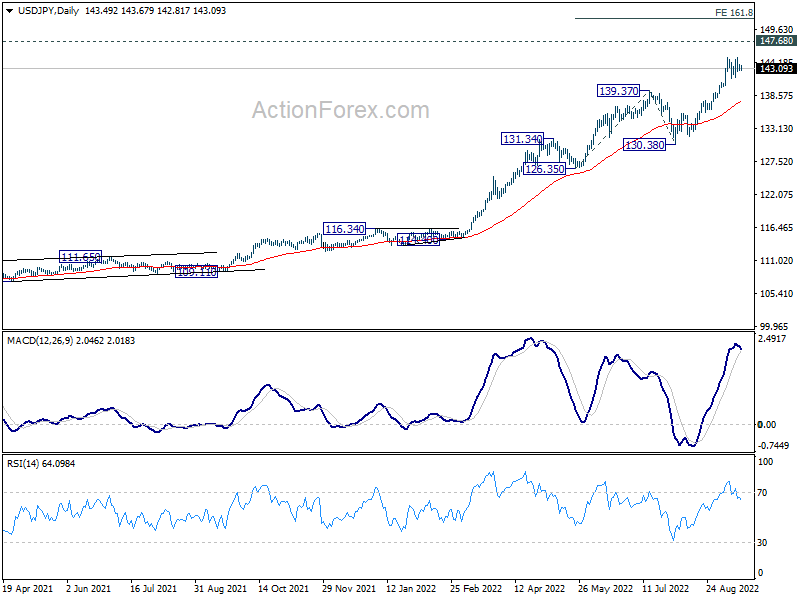
Talking about USD/JPY, the pair will also face another event of BoJ rate decision on Thursday. BoJ should remain firmly on hold on monetary policy, and reiterate the need to do so. Last week rebound in Yen was somewhat attributable to jawboning of Japanese officials. But it should be noted that Japan is concerned with rapid, one-sided depreciation in the exchange rate only. That is, they're concerned about the speed, rather than the direction of Yen. Such message would be echoed by comments of BoJ Governor Haruhiko Kuroda.
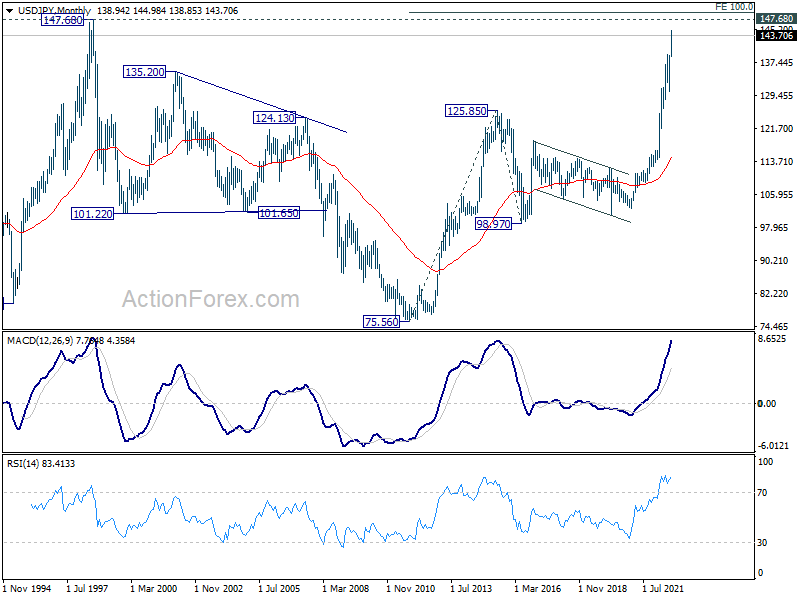
Technically, outlook is USD/JPY remains clearly bullish. Any further retreat should be contained by1 39.37 resistance turned support. Break of 144.98 resistance would pave the way to 147.68 long term resistance. Break there will target 161.8% projection of 126.35 to 139.37 from 130.38 at 151.44 next.
GBP/CHF hit multi-decade low ahead of BoE and SNB
Two more central banks will meet this week, including BoE and SNB. Sterling lost much ground last week after data showed headline CPI slowing, while retail sales contracted in both volume and value term. While BoE is expected to deliver another 50bps hike, the path after that is less certain than other major counterparts. SNB is expected to join the 75bps hike club, and finally leave negative interest rate behind. The central bank will also continue to give a node to Franc's appreciation, which could help cap inflation.
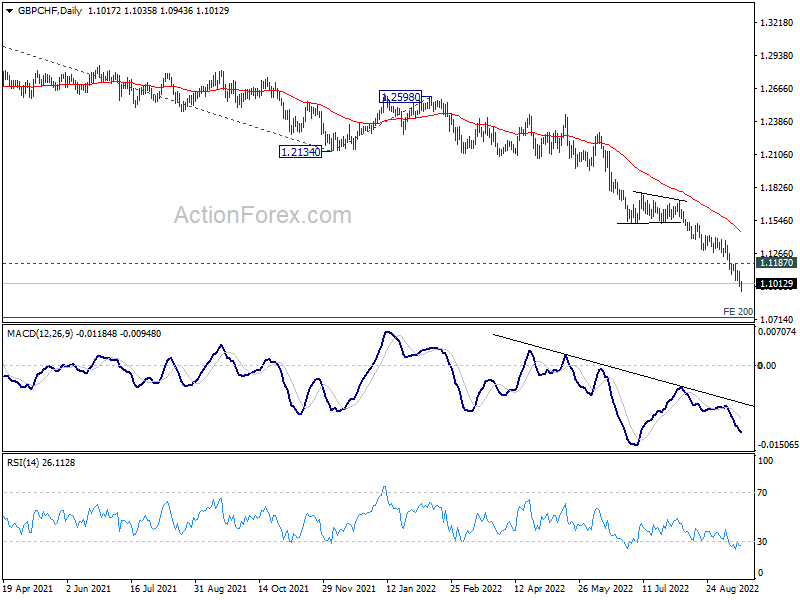
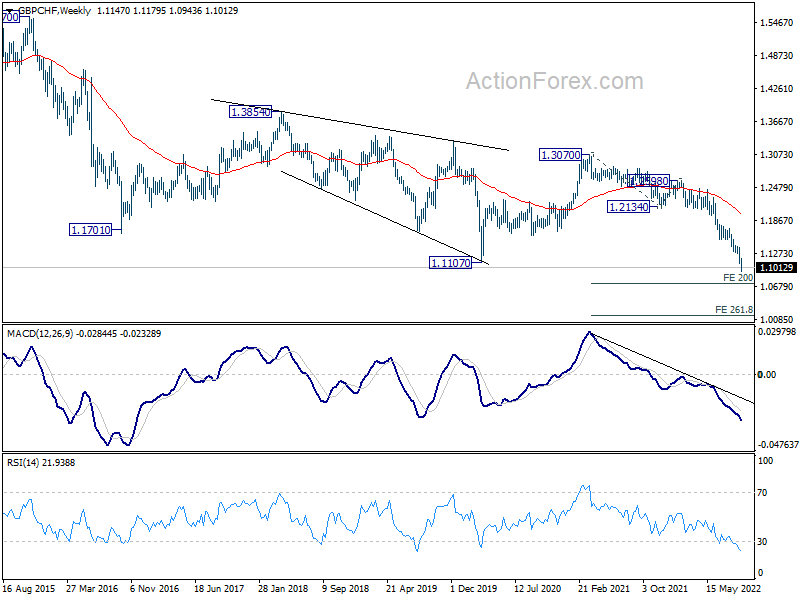
GBPCHF broke through pandemic trough last week and hit a new multi-decade low. Both daily and weekly MACD suggests that it's still in downside acceleration mode. Near term outlook will stay bearish as long as 1.1187 resistance holds. Next target is 200% projection of 1.3070 to 1.2134 from 1.2598 at 1.0726. This target could be easily reached should BoE sounds a bit more dovish than market expected.
Gold breaking down, could 55 month EMA save it?
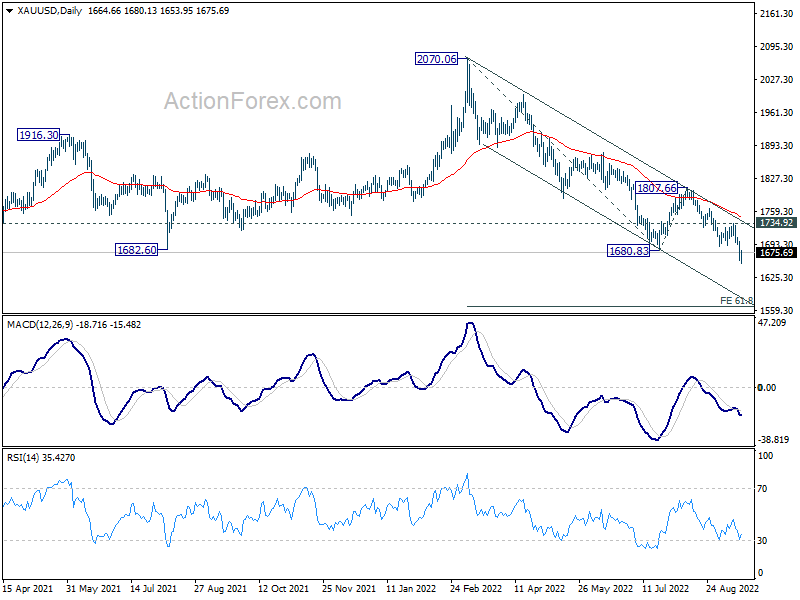
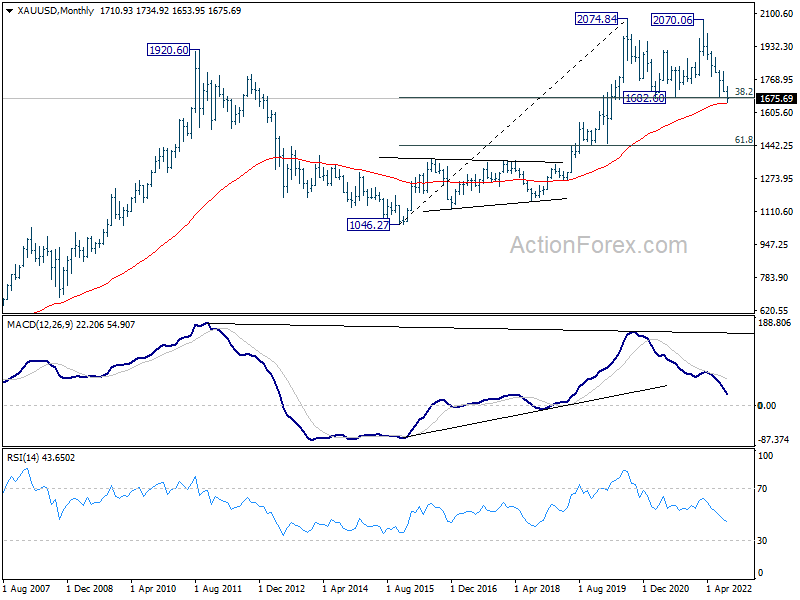
Another major development in the markets last week was the break of a key support level at around 1680 in Gold. The selloff came on the back on aggressive tightening by global major central banks, not just Fed.
Technically, Gold should have completed a long term double top reversal pattern (2074.74, 2070.06). Yet, it's trying to draw support from 55 month EMA (now at 1652.71), which might give it a life. In any case, near term outlook will stay bearish as long as 1734.92 resistance holds. Current fall would target 61.8% projection of 2070.06 to 1680.83 from 1807.66 at 1567.11.
However, break of 1734.92 would argue that the 55 month EMA has done it job, and stronger rebound would be seen back to 1807.66 resistance, for confirming near term bottoming.
USD/CAD Weekly Outlook
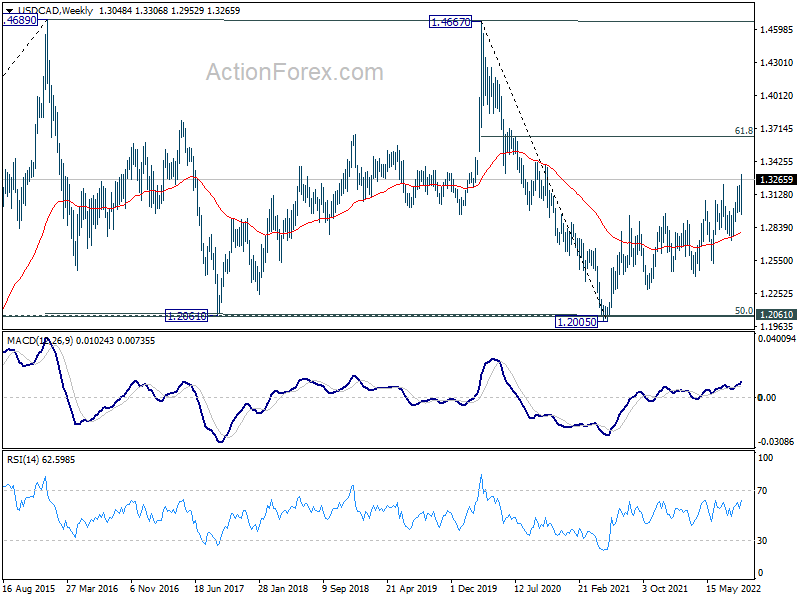
USD/CAD's up trend from 1.2005 resumed last week and hit as high as 1.3306. Initial bias stays on the upside this week for 100% projection of 1.2005 to 1.2947 from 1.2401 at 1.3343. Break there will target medium term fibonacci level at 1.3650. On the downside, below 1.3238 minor support will turn intraday bias neutral first. But retreat should be contained well above 1.2952 support to bring another rally.
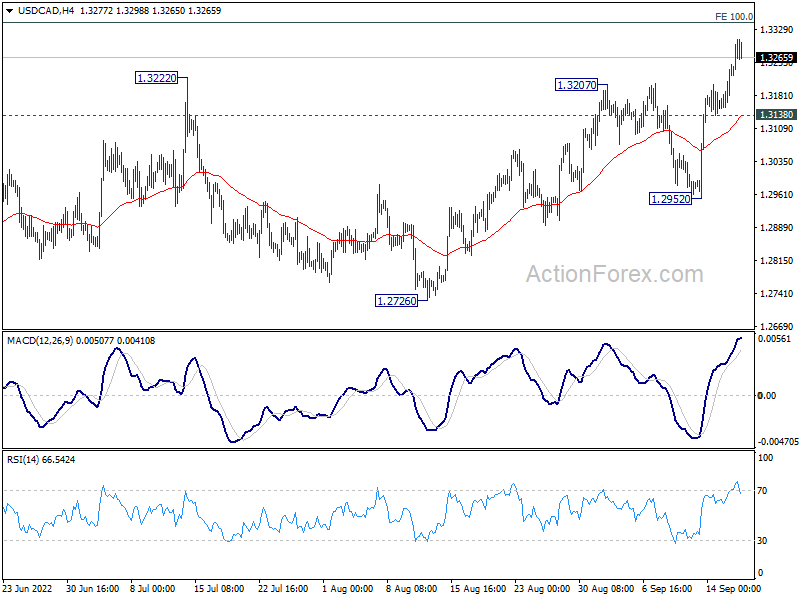
In the bigger picture, down trend from 1.4667 (2020 high) should have completed at 1.2005, after defending 1.2061 long term cluster support. Rise from there should target 61.8% retracement of 1.4667 to 1.2005 (2021 low) at 1.3650. This will remain the favored case now as long as 1.2716 support holds.
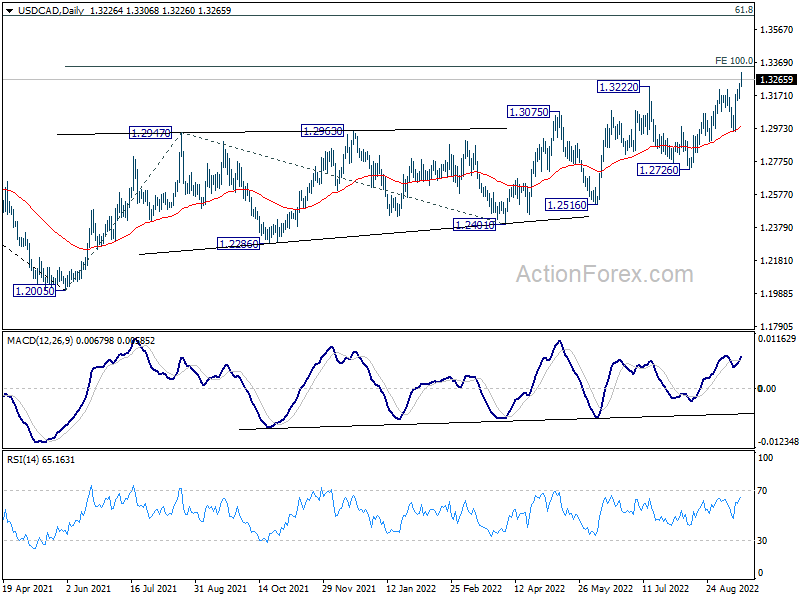
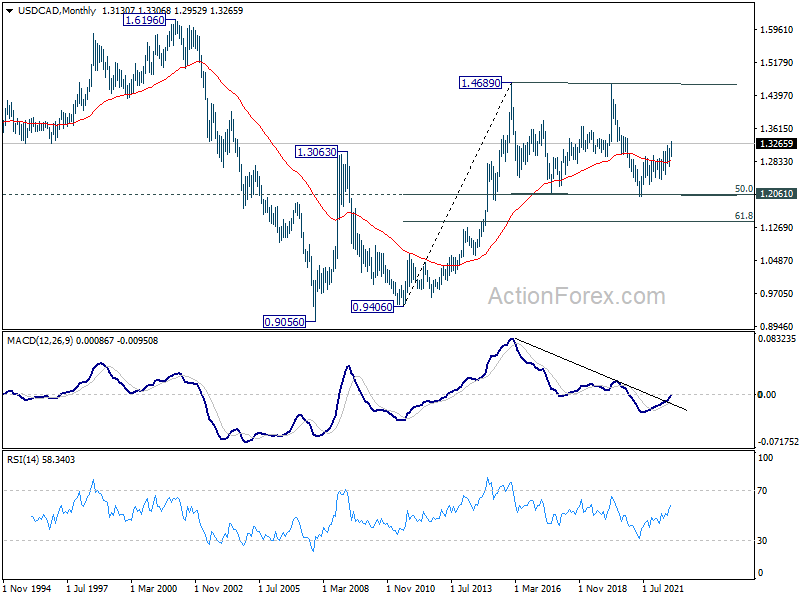
In the longer term picture, price actions from 1.4689 (2016 high) are seen as a consolidation pattern only. That is, up trend from 0.9506 (2007 low) is still expected to resume at a later stage. This will remain the favored case as long as 1.2061 support holds, which is close to 50% retracement of 0.9406 to 1.4689 at 1.2048.