Sample Category Title
USDCAD Wave Analysis
- USDCAD broke key resistance level 1.3200
- Likely to rise to resistance level 1.3400
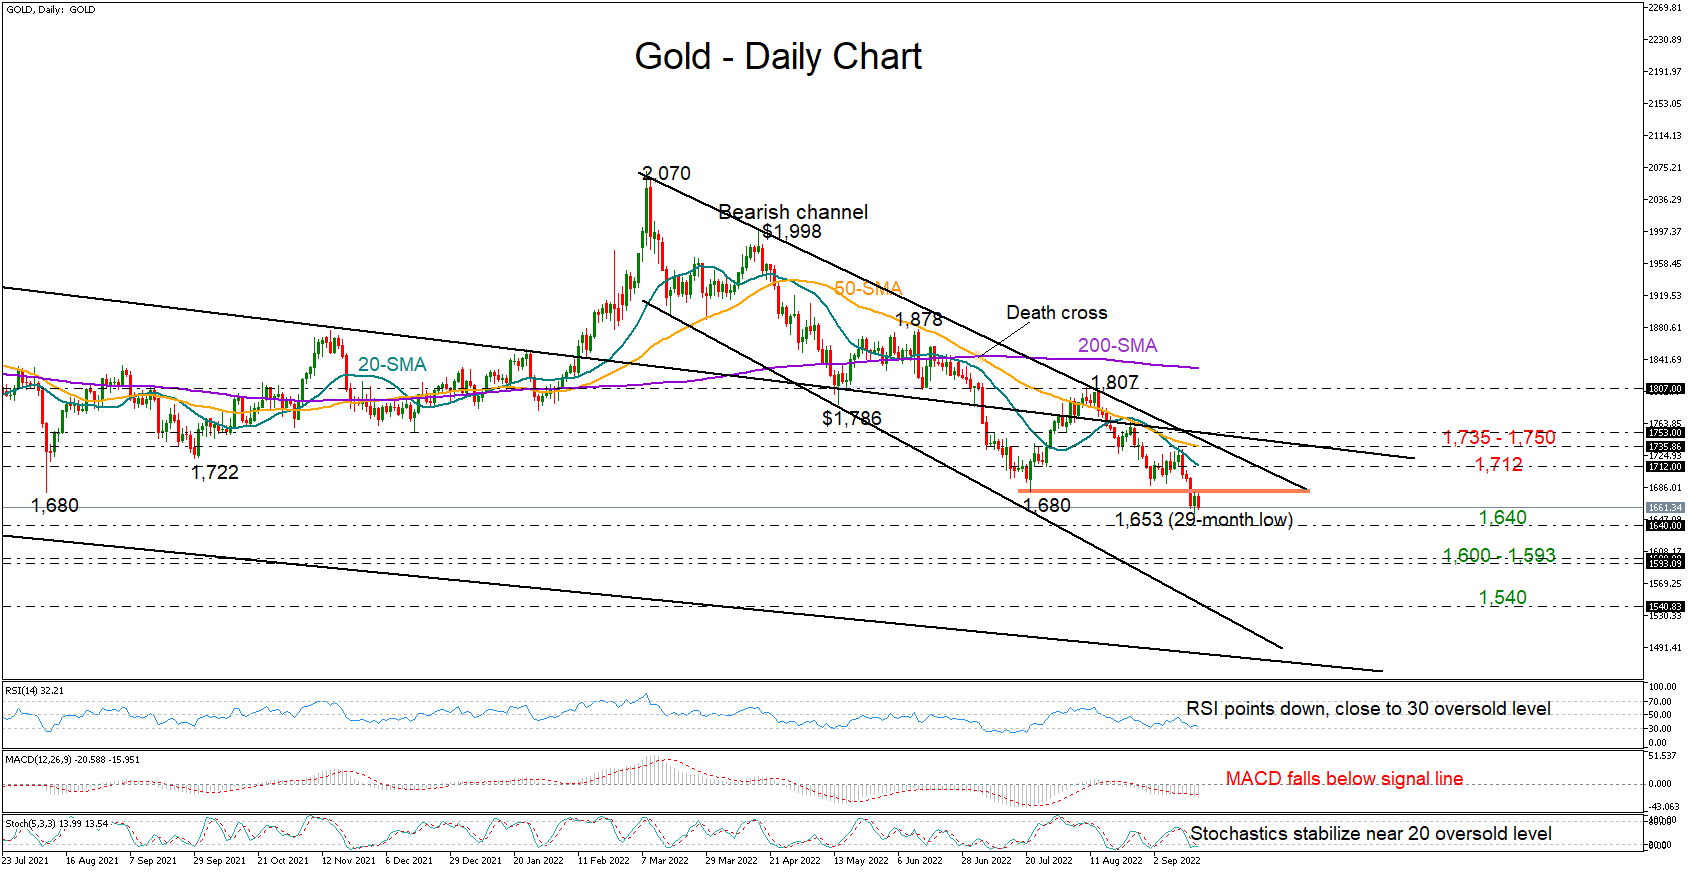
USDCAD currency pair under the bullish pressure after the price broke above the key resistance level 1.3200 (which has been reversing the pair from July, as can be seen below).
The breakout of the resistance level 1.3200 accelerated the active short-term impulse wave 3, which belongs to the intermediate impulse wave (3) from April.
Given the clear uptrend, strong CAD sales on oil losses, USDCAD can be expected to rise further toward the next resistance level 1.3400 (intersecting with the up channel from April, target for the end of minor wave (iii)).
Dow Jones Wave Analysis
- Dow Jones under bearish pressure
- Likely to fall to support level 30000.00
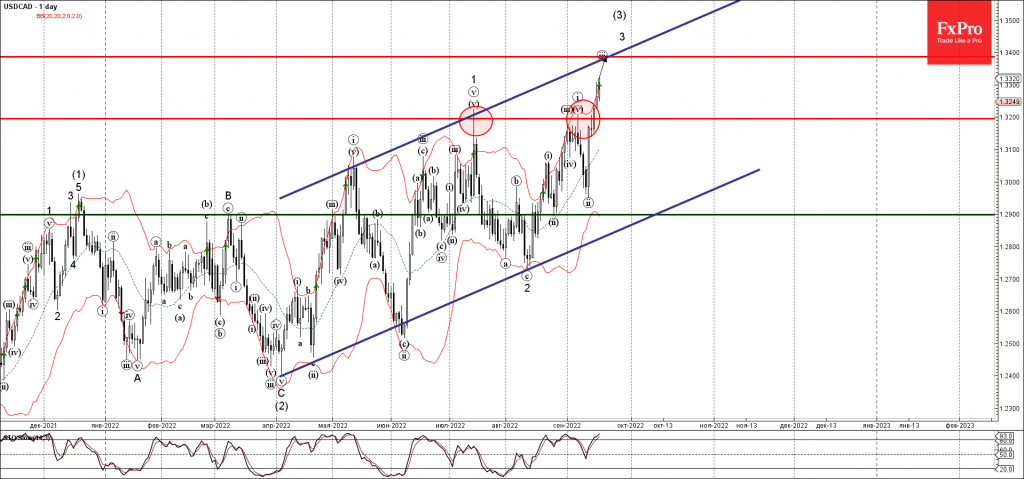
Dow Jones index under the bearish pressure after it broke above the support level 31000.00 (which stopped the earlier minor impulse wave 1 at the start of September).
The breakout of the support level 31000.00 accelerated the active short-term impulse wave 3, which is a part of the sharp intermediate impulse wave (C) from April.
Dow Jones index can be expected to fall further toward the next round support level 30000.00 (which reversed wave (A) in June).
Bundesbank: Inflation should move into double digits in the next few months
Bundesbank said in the monthly report that there are "increasing signs that the German economy is slipping into a recession". It added, "the high inflation and the uncertainty regarding the energy supply and its costs affect not only the gas and electricity-intensive industry and its export business and investments, but also private consumption and the service providers dependent on it."
Gas supply situation is expected to "remain extremely tense in the coming month". For Q4 and Q1, economists expect a "noticeable decline in economic output", and outlook is "extremely uncertain".
Regarding inflation, Bundesbank said the fiscal relief package will only be reflected in consumer prices at the beginning of next year. "The bottom line is that the inflation rate should move into the double digits in the next few months," it added.
Gold to Choose its Path for Years: $1160 or $2600
Gold’s timid attempts to push back from the lower end of a more than two-year range were foiled by a stiff market reaction to US inflation statistics. Gold plunged to $1660 on Friday, rewriting its low from April 2020, while buying has been rising for the last 19 months just after touching the $1680 area.
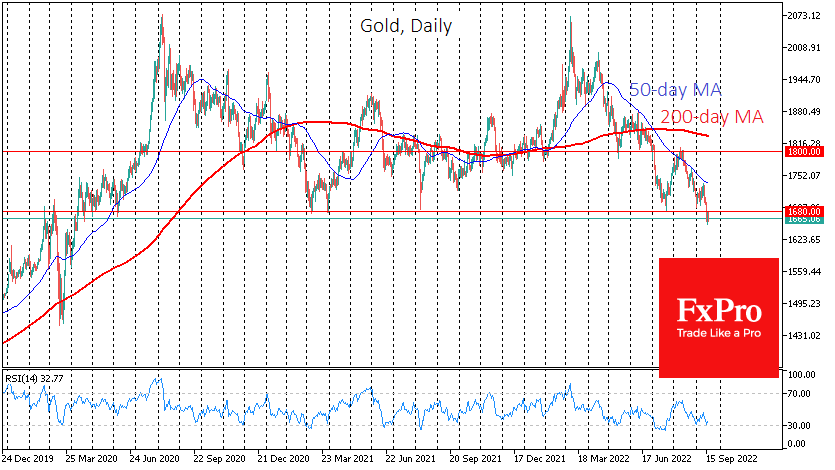
Notably, gold reversed sharply last month from the round level of $1800, which had acted as support several times between February and June. Thus, the gold bulls are one by one, giving away the technical levels that were significant before.
In addition to the consistent retreat from the horizontal levels, we note that the downwardly directed 50-day moving average has been acting as local resistance since June. Last week’s last downward momentum was precisely from this curve.
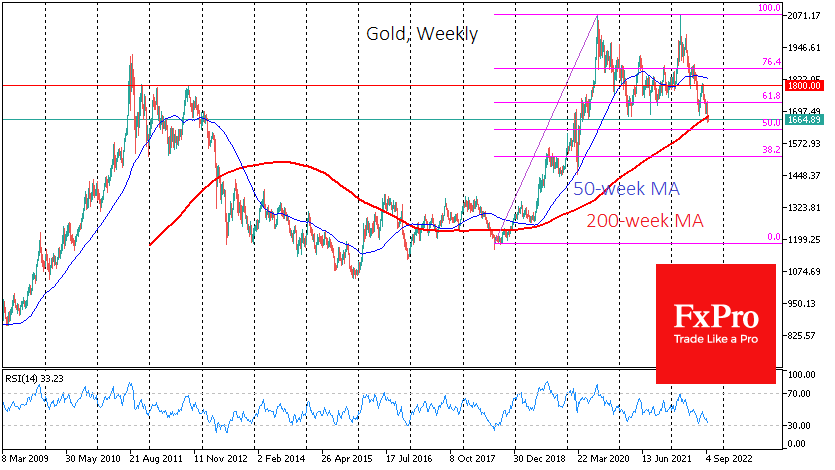
The move to higher timeframes generates even more worries about the outlook for gold. Gold closed last week a hair above its 200-week moving average. That was mainly due to Friday’s local bounce, as the bears were lowering profits from the big move. The start of the new week is under this curve. The fall under it in 2013 and the inability to get a foothold over it in 2016 were followed by a strong sell-off, which is a worrying sign now.
A test of the 200-week average is a once in a few years event that can set the trend for years to come, and the forthcoming Fed meeting this week provides a meaningful macroeconomic backdrop for this choice.
If the Fed’s decisions and Powell’s comments prove to be as adamant about fighting inflation as the markets now expect, we could see a repeat of the 2013-2015 pattern of gold’s failure. Back then, a breakout of the lower end of the sideways range in 2.5 years of the steady decline took more than 30% off the price. A similar failure will wipe out all the gains from 2018, returning to the $1170 area over the next two years.
However, on our side, the odds are now slightly outweighed that the FOMC will shift the rhetoric towards easing, as the markets had expected since June. But they seem to have dropped that idea last week after the inflation report, and we note that it was quite a minor upshot. Moreover, long-term inflation expectations have already returned to normal. In addition, there are increasing signs that financial markets are under stress, which the Fed will also consider when setting policy.
Looking at financial markets in favour of the Fed indicates that the committee has slowed down asset sales from the balance sheet, increasingly deviating from its declared trajectory. Excessive stress on financial markets can effectively shut down the economy and turn around the labour market.
If the markets perceive current prices as profitable for gold and miners to buy, this week, we could see the formation of a long-term wave that could take gold above $2600 for the next two years.
GBP Dips, UK Says Goodbye to Queen Elizabeth
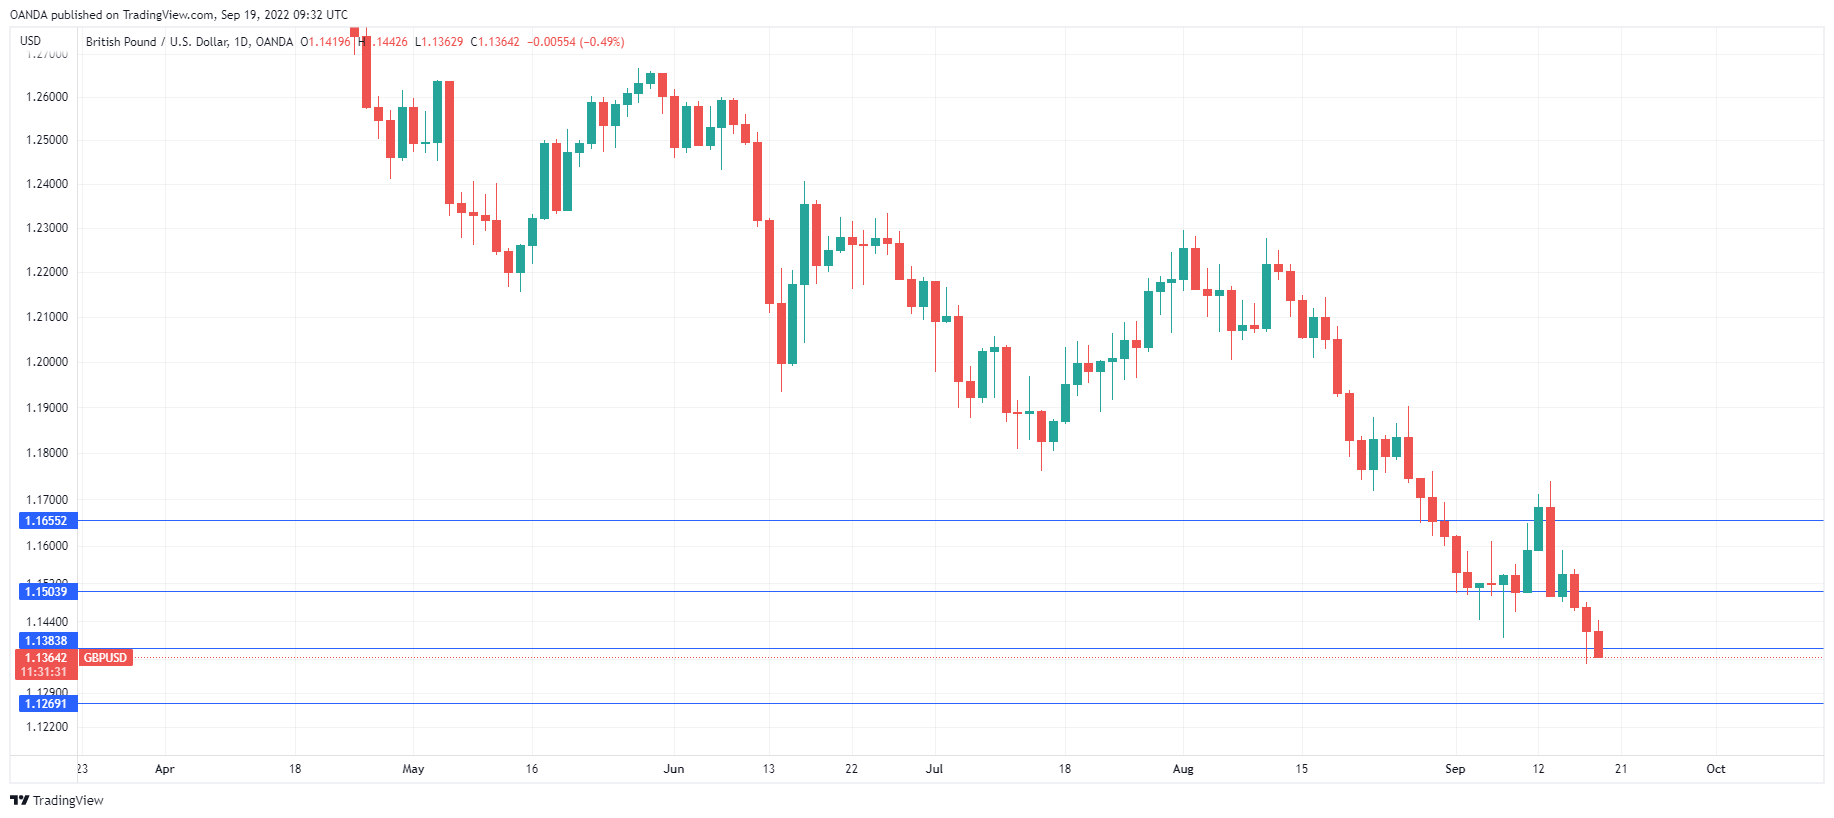
The British pound has started the week in negative territory after posting a losing week. GBP/USD is trading at 1.1374, down 0.31% on the day. The pound closed below the 1.14 level on Friday, which hasn’t occurred since 1985.
UK at standstill for Queen Elizabeth’s funeral
Today is a bank holiday in the UK, as the country is at a standstill for the funeral of Queen Elizabeth II. There are no economic releases out of the UK and just one minor event in the US, but the pound has extended its losses and is still trying to find its footing. The pound has been pummelled by weak UK data and a strong US dollar which has been boosted by an aggressive Federal Reserve. The pound has fallen more than 15% against the dollar and with the UK possibly already in recession, the pound’s downswing could well continue.
The cost-of-living crisis has hammered UK consumers who are in a sour mood and are cutting on disposable spending. Retail sales in August plunged by 5.4% YoY, following a July reading of -3.1%. A YouGov survey found that consumer confidence fell into negative territory in August for the first time since the Covid lockdown in mid-2020.
The Bank of England meets on Thursday after the meeting was delayed by a week to the 10-period of national mourning. This could make for a most interesting week, with the Fed meeting one day earlier. Both central banks are expected to raise rates by 0.75%, and any surprises would likely trigger a strong reaction in the markets. The BoE has been widely criticized for failing to get a handle on inflation, which is running at a 9.9% click. Inflation is yet to peak, and if the BoE hikes by 0.75%, it will not only help slow inflation, but will restore credibility in the BoE, which is critical in the fight against inflation.
GBP/USD Technical
- GBP/USD faces resistance at 1.1504 and 1.1656
- There is support at 1.1384 and 1.1269
Canadian Inflation Data: The Case for BoC to Back Off?
The BOC has taken an even more aggressive rate hike route than the Fed, giving the CAD the fastest rising rate of the majors. This didn't stop the meteoric rise in inflation that most developed countries have been seeing this year, although not as dramatic as in the US. Given the economic interconnectivity with the US, it's not surprising that CPI trends have been similar in both countries.
However, unlike in the US, Canada has been seeing not only a flattening but actual downturn in core CPI, the measure followed by central banks. This opens the question whether the BOC's increased frontloading of the interest rate means they can slow the pace of hikes before other central banks. Particularly as more economists worry that there is a recession on the horizon, if it's not already here. If core rates continue to fall, there would be further arguments for the BOC to not "lead" the Fed higher. The BOC meets again in late October.
What to look out for
Canada's inflation rate is expected to fall for the second consecutive month to 7.3% from 7.6% prior. This is expected to be supported by a -0.1% monthly rate, compared to 0.1% in July. The figures mirror the results seen in the US, but at a lower level. The drop in global crude prices has contributed to a reduction in energy costs in Canada as well.
But what the BOC focuses on is the core rate, which trims off the effects of energy and food prices. And there the situation is a little more complicated, since annual core CPI is expected to rise to 6.2% from 6.1% prior. This is based on an expected acceleration in the monthly measure to 0.6% from 0.5% in July.
Putting the pieces together
Just like with the US' data from last week, even if the headline inflation rate goes down, the market is likely to react to the core rate. However, the differences that could impact the market here are really small. If the core rate is in line with expectations, it's just a decimal away from the prior. And a variation of a couple of decimal points from expectations is quite common.
If the rate were to be at 6.1% or above, it would likely lead to speculation that the BOC will keep its aggressive stance. Because it suggests that a downward trend in the core inflation rate has not been established yet. This idea could get an extra boost later this week if the Fed raises rates by 100bps, which could lead to speculation that the BOC might raise rates by a full percentage point again.
What if expectations aren't met?
On the other hand, a miss of expectations by just two decimals (or more) would signal that the downward trajectory in inflation is intact. That could return the discussion to how much the BOC will moderate its tightening at the next meeting. And, again, this could be further supported if the Fed hikes by just 75bps on Wednesday.
As for the Canadian dollar, weakness has been attributed to the expectation that the BOC will "pivot" first. But if headline inflation is coming down, while core inflation signals the BOC will remain aggressive, the upward trend of the USDCAD could get interrupted. Of course, the situation could be reversed if inflation signals the BOC could take a breather in the steep rate climbing.
Weekly Waves: GBP/USD, Gas and Bitcoin
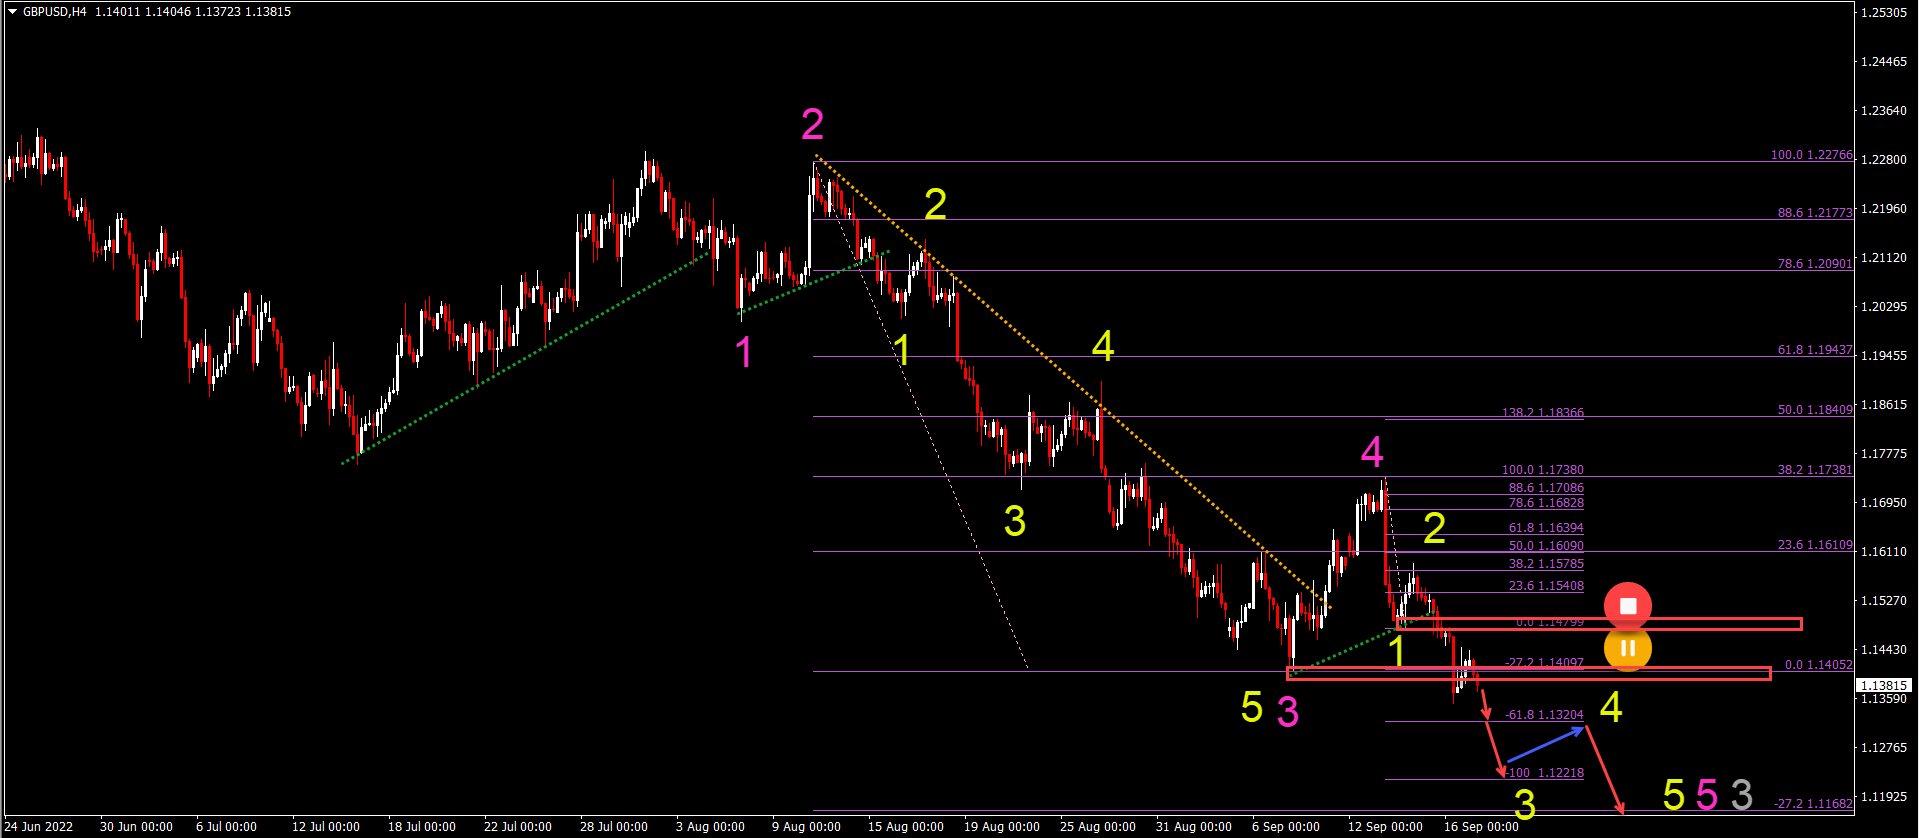
- Price action is expected to continue with its downtrend (red arrows) as part of a wave 3 (yellow). The main targets are the Fibonacci at 1.1325, 1.1250, and 1.1175.
- The NGAS chart offers a classical head and shoulders reversal chart pattern (orange boxes).
- The BTC break of the bottom should complete the bullish, shallow wave 4 (yellow) and start the bearish wave 5 (yellow).
GBP/USD bears take control and break bottom
The GBP/USD made a bullish retracement to and bearish bounce at the 38.2% Fibonacci resistance level:
- The GBP/USD bounce at the 38.2% Fib indicates a wave 4 (pink) pattern.
- Price action has now broken below the bottom after a strong bearish decline, which has been labeled as a wave 1 (yellow).
- Price action is expected to continue with its downtrend (red arrows) as part of a wave 3 (yellow).
- The main targets are the Fibonacci levels at 1.1325, 1.1250, and 1.1175.
- Eventually a shallow retracement is expected to occur within wave 4 (yellow).
- The retracement should not break above the previous bottoms and resistance zones (red boxes).
- A further decline is then expected within wave 5 (yellow).
- A bullish push above the resistance levels makes it likely that another wave pattern is valid.
NGAS head and shoulders pattern indicates reversal
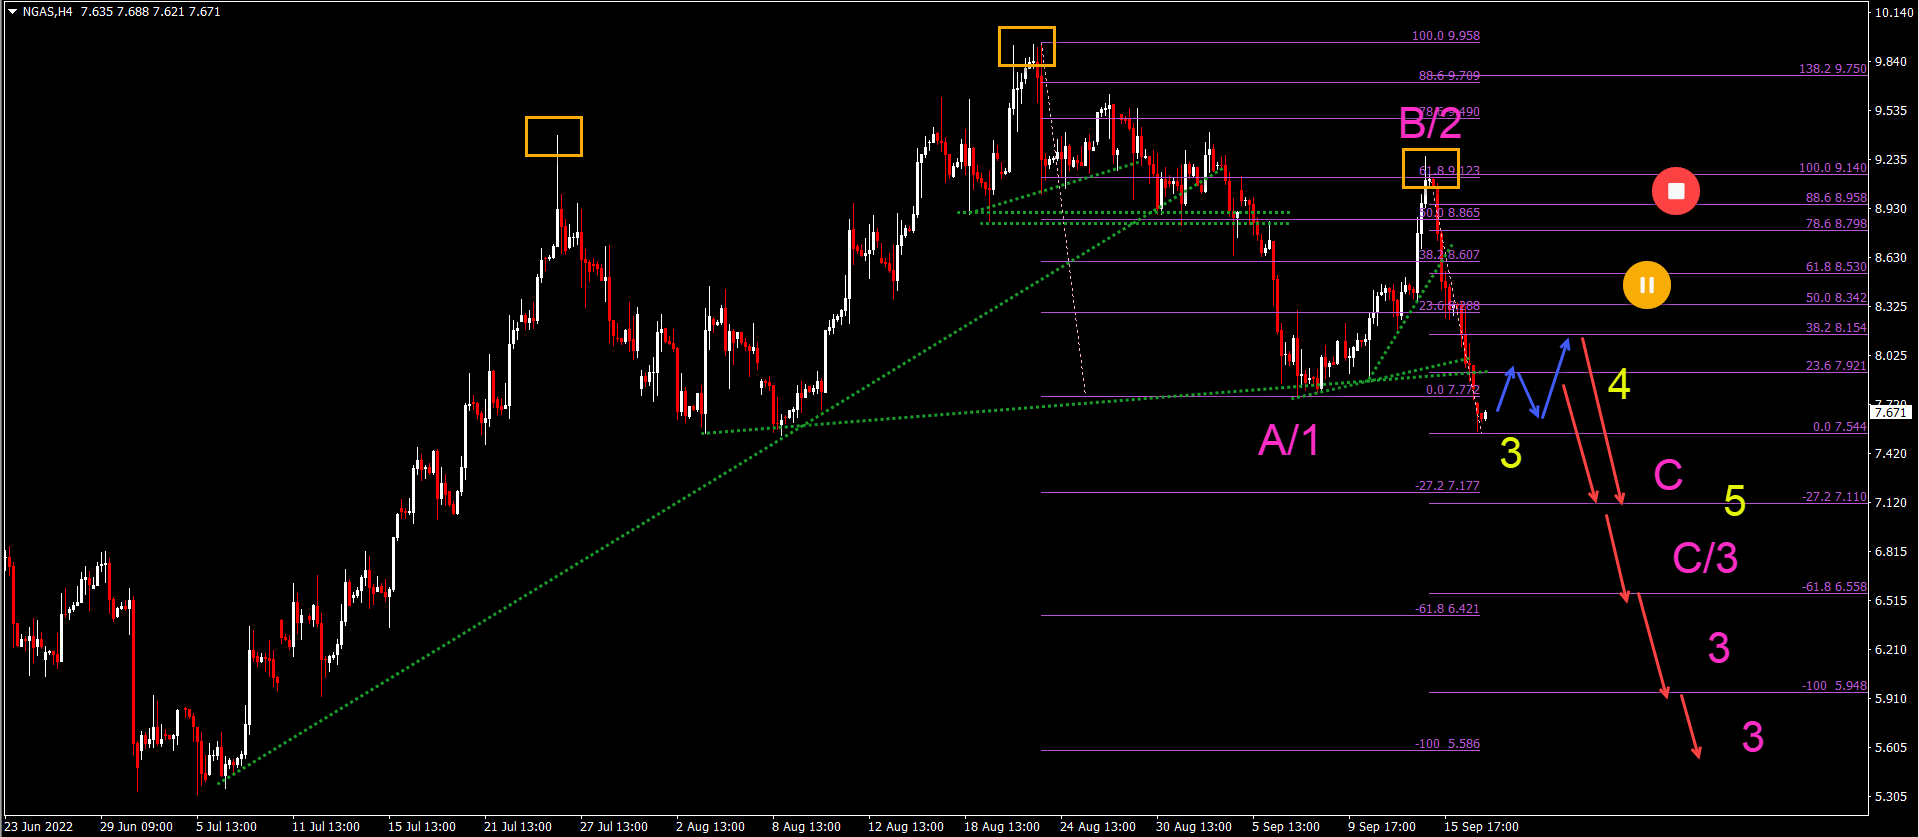
The NGAS 4 hour chart is showing a reversal chart pattern:
- The NGAS chart offers a classical head and shoulders reversal chart pattern (orange boxes).
- The bullish push up within wave B/2 stopped at the 61.8% Fibonacci level.
- The bearish decline after the bearish bounce has been very strong and is likely some type of wave 3 (yellow).
- A mild retracement within the wave 4 (yellow) could take price eventually back to the 23.6% or 38.2% Fibonacci levels.
- A deeper bullish retracement invalidates the wave 4 (yellow) pattern.
- A bearish continuation aims for the Fibonacci targets down below.
- If price action only reaches the -27.2% Fibonacci target, then it’s most likely a wave C ([pink). If price action goes to the -61.8% Fib, then it could be either a wave 3 or C.
- A break below the -61.8% Fibonacci level indicates a wave 3 (pink).
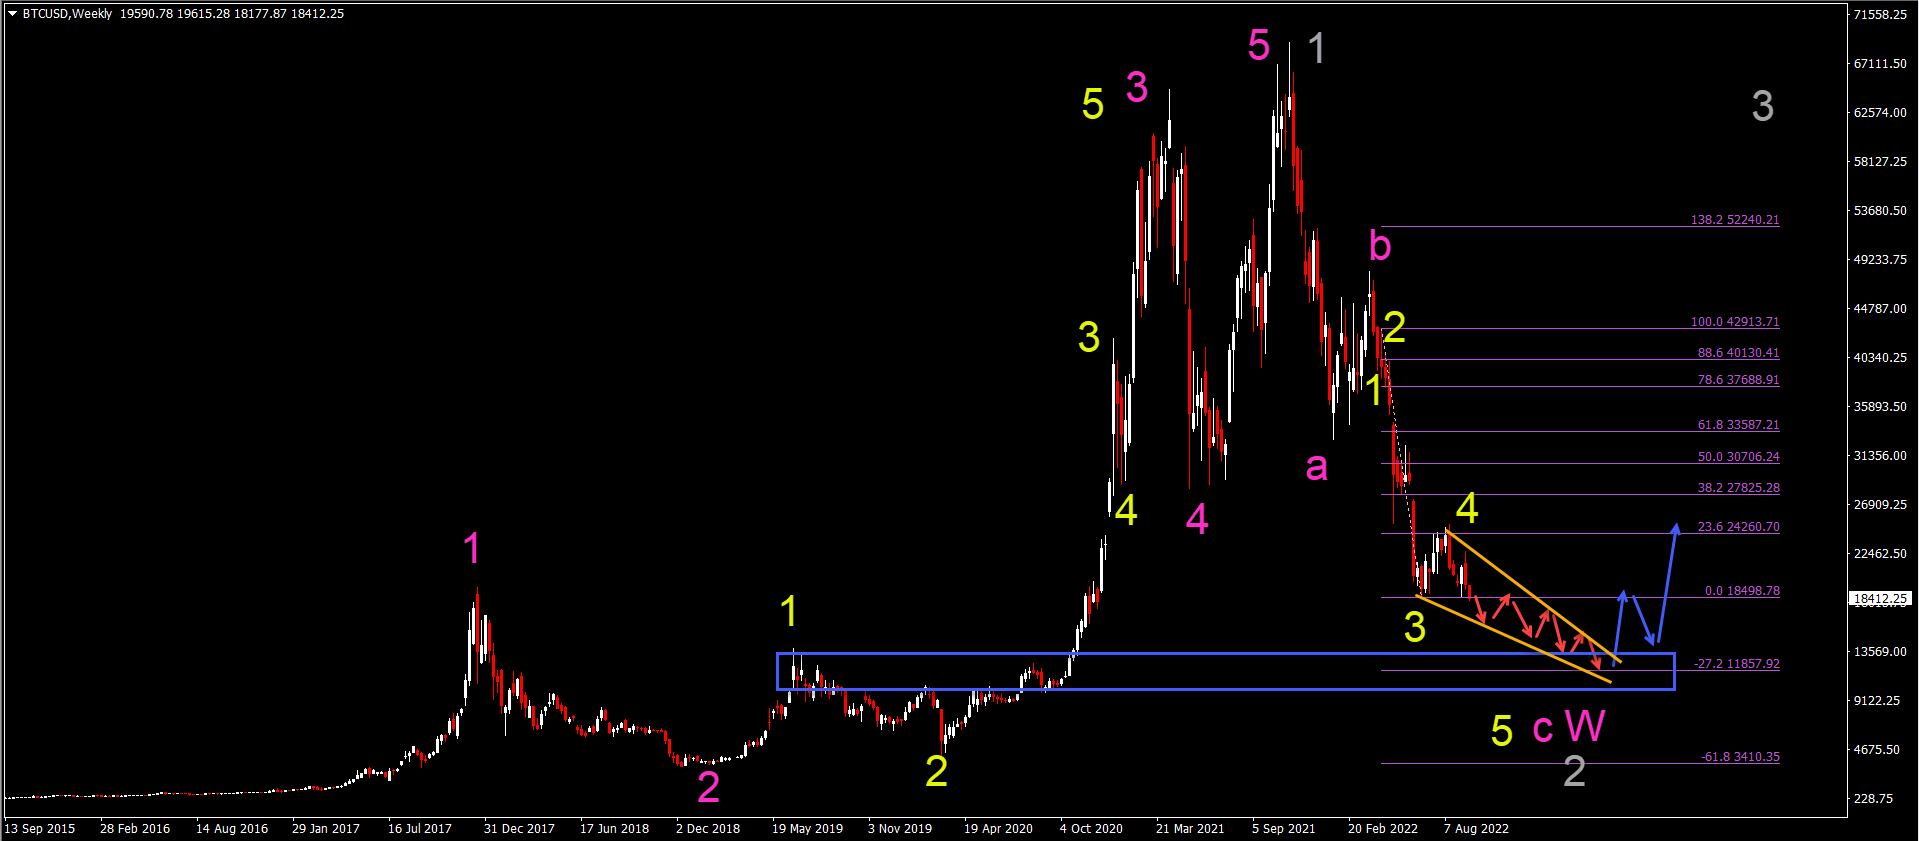
BTC/USD breaks low and prepares for decline
Bitcoin (BTC/USD) is breaking the bottom and low for a continuation of the downtrend:
- The BTC/USD bulls are disappointed yet again after a bullish rally was unable to break above the resistance zone.
- The break of the bottom should complete the bullish, shallow wave 4 (yellow) and start the bearish wave 5 (yellow).
- The main target is the -27.2% Fibonacci target around $12k with an important zone around the round level of $15k.
- The wave 5 (yellow) could move lower within a falling wedge reversal chart pattern (orange lines).
- A strong bullish bounce is needed to confirm the start of any reversal (blue arrows)
- The wave 5 (yellow) would complete a wave C (pink) of wave W (pink) or wave 2 (gray).
WTI Oil: Oil Remains Firmly in Red on Demand Fears, Strong Dollar
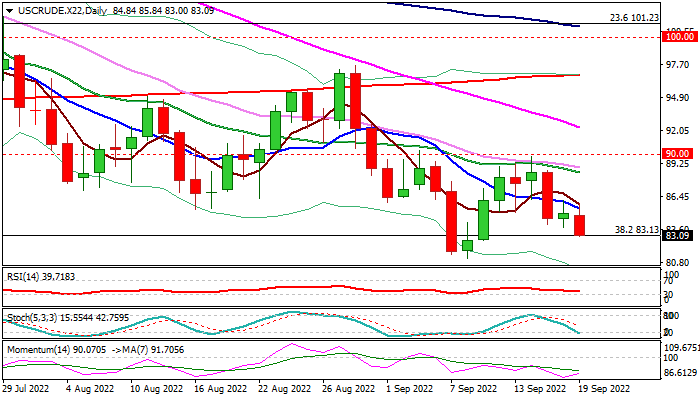
WTI oil started the week in negative mode, falling 1.7% during Asian and early European trading on Monday.
Crude oil is pressured by fears of recession that would significantly slow global economy and lower demand for energies, while strong dollar on prospects of further aggressive steps of the Fed towards its monetary policy, adds to negative sentiment
The contract remains in red following three consecutive weeks of losses, as well as falling for the fourth straight month.
Fresh weakness probes again through pivotal Fibo support at $83.13 (38.2% of $6.52/$130.48, Apr 2020/Mar 2022 rally), with firm break here to generate bearish signal for retest of key near-term support at $81.17 (nine-month low, posted on Sep 8).
Bearish technical studies on daily and weekly chart support the action, with upticks expected to provide better selling opportunities.
Upticks will face solid resistance from daily Tenkan-sen ($85.50) which should ideally cap.
Only break above $90 zone (daily Kijun-sen / Sep 14 lower top / psychological) would sideline bear
Res: 85.50; 86.16; 88.68; 89.40.
Sup: 82.73; 81.17; 80.00; 78.48.
Bitcoin’s Depressing Technical Picture
Market picture
Bitcoin is down 8.8% over the past week, ending near $19,700. The losses continued to pile up on Monday, decreasing the price to $18.5K (-7.77% in 24 hours). Ethereum collapsed 25% to $1300 in exactly one week. Top altcoins fell from 10% (Solana, Dogecoin) to 19% (Polkadot). The exception was XRP (-0.5%).
Total crypto market capitalisation, according to CoinMarketCap, was down 14% for the week at $903bn. The cryptocurrency Fear & Greed Index returned to “extreme fear” territory at 21 by Monday.
Flee from risks in global markets has pressured Bitcoin over the past week. Ethereum has underperformed, quickly taking back the speculative advantage accumulated before the move to PoS.
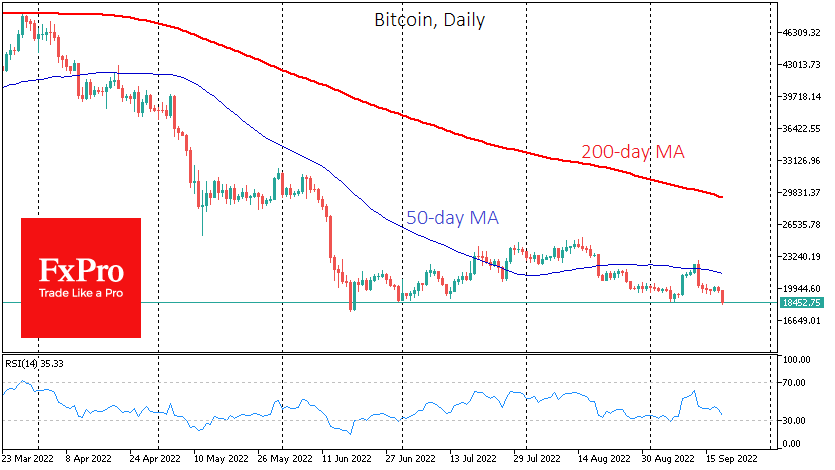
The local technical picture in BTCUSD looks quite worrying. The pair has fallen to the lows of June, where it spent a few hours during the long squeeze.
Bitcoin’s main fall came Tuesday on higher-than-expected US inflation, raising the possibility of a sharper monetary policy tightening at this week’s Fed meeting.
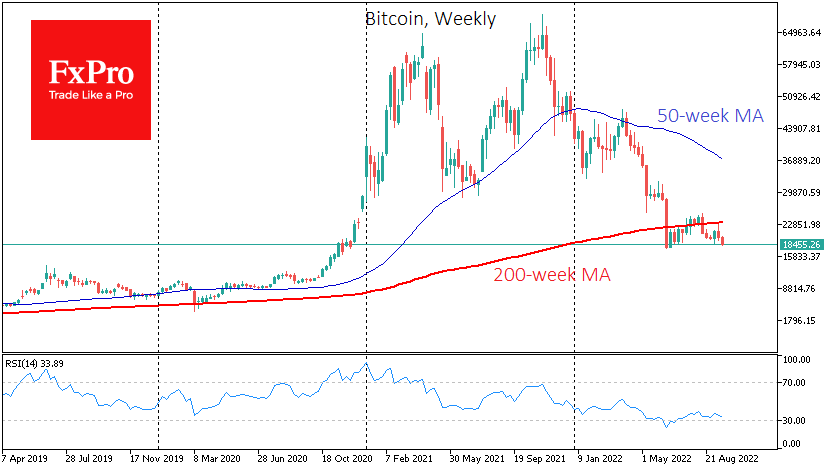
The bear market was confirmed by BTCUSD actively selling off after testing the significant moving averages – the 50-day and 200-week moving averages. The latter, which had previously confirmed that the crypto market was growing over the long term, capitulated in June. And in recent months has acted as a selling point from which to intensify, convincing investors that the 10k mark of Bitcoin will be seen sooner than the 30k mark.
News background
Ethereum’s transition to the new algorithm last week was a success, with the network’s power consumption reduced by 99.95%. However, the hopes of crypto bulls, expecting a rise in quotations, were not fulfilled.
Changpeng Zhao, CEO of cryptocurrency exchange Binance, urged traders to be patient. In his view, the move to PoS should not be expected to impact the Ethereum ecosystem immediately.
US Securities and Exchange Commission (SEC) chief Gary Gensler has warned after The Merge update ETH can be treated as security from a legal perspective.
Nassim Taleb, the author of Black Swan, called bitcoin a “tumour” caused by the US Federal Reserve’s loose monetary policy. In his view, 15 years of low-interest rates ruined the economy and created bubbles in the market, like BTC.
Gold Faces Dim Outlook as New Resistance Pops Up
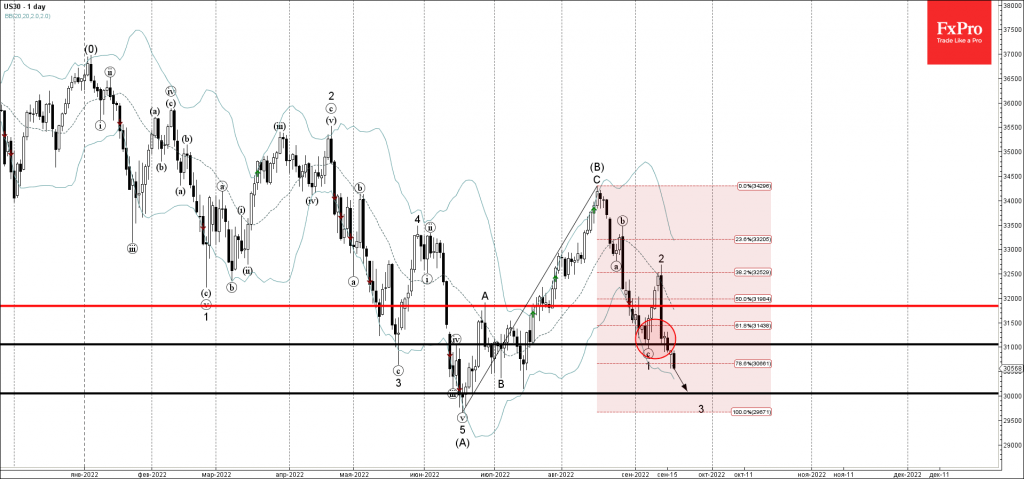
Gold resumed its bearish momentum early on Monday after Friday's rebound off a 29-month low of 1,653 faded immediately around the previous low of 1,680. Strikingly, the latter overlaps with the 200-weekly moving average (SMA), which has been out of sight since the end of 2018.
In technical indicators, the bearish cross within the 20- and 50-day SMAs is endorsing the negative trend in the market. Meanwhile, the MACD is set for another downside extension below its red signal and zero lines, while the RSI and the stochastics, although close to their oversold levels, have yet to change direction northwards, all keeping the bias on the bearish side for now.
If the 1,680 resistance stands firm, the precious metal could slide towards the 1,640 barrier from February-April 2020. Breaking lower, the 1,600 psychological mark may attract special attention in fear that any violation at this point could quickly sink the price to the bottom of the bearish channel seen around 1,540.
Alternatively, a close above the 1,680-1,690 constraining zone could stage a new battle near the 20-day SMA currently at 1,712. Running higher, the price may next attempt to breach the 50-day SMA at 1,735 and successfully pierce the channel’s upper band at 1,750. Note that a former restrictive line is also passing through this area.
Summarizing, gold remains exposed to additional declines as the price is fighting a critical support-turned-resistance zone at 1,680. If the bulls cannot knock down that wall, the bears may further worsen the already dim outlook.