Sample Category Title
Global Inflation Watch – US Inflation Surprise Points to Another 75bp Fed Hike
Overview: Inflation pressures from oil, metals, food and freight rates have come down but labour markets remain tight in US and Europe keeping wage pressures high. Incoming inflation numbers also remain elevated as evident from the upward surprise in US CPI for August (see below). Gas and electricity prices have come off the highs in Europe but remain very high. Looking forward, we expect inflation to stay high in the short term (rise further in the euro area) but decline during 2023 as recession looms.
Inflation expectations: US household 3-year inflation expectations from NY Fed turned lower in August. Euro consumer price expectations are off the peak but still high. Market-based long-term inflation expectations are moving broadly sideways above 2%.
US: CPI inflation surprised to the upside in August, as core inflation remained brisk at +0.6% m/m. Declining gasoline prices will continue to ease energy and transportation related inflation, weighing on headline CPI towards year-end. Most leading indicators point towards moderating inflation expectations, as supply chain challenges ease and commodity prices have declined. In addition, while shelter prices contribute positively to the CPI for now, housing market conditions have continued to cool. That said, the strong economic momentum and persistent labour shortages continue to push wages higher, creating sticky and broad-based upward pressure on consumer prices as well.
Euro: In contrast to the US, an inflation peak remains not yet in sight, with headline inflation reaching an all-time high of 9.1% in August. Food prices remain on a steep uptrend and although energy price inflation moderated slightly, we think it is the 'calm before the storm', with significant increases for gas and electricity prices still looming in coming months. Weaker demand does not yet seem to be an issue for firms' pricing decisions, as both goods and services inflation accelerated further. Inflation expectations ticked up with the latest energy price surge, leaving ECB to highlight the risk of de-anchoring. Despite the tight labour market, a sharp rise in wages is not yet in sight, with negotiated wage edging down to 2.4% in Q2 22 (from 3.0% in Q1).
China: CPI moved down to 2.5% y/y in August from 2.7% in July. PPI inflation fell yet again to 2.3% y/y from 4.2% y/y. It's down from the peak in Oct '21 at 13.5% y/y.
US Inflation Surprise Brings Markets Back Down to Earth
Global markets are trying to pick up the pieces after a torrid Tuesday, following the nasty surprise in the latest US inflation report. The higher-than-expected CPI print nullified premature hopes for a “dovish pivot” by the Fed in the second quarter of next year, wrong-footing risk assets while reasserting king dollar’s dominance.
The S&P 500 erased all of its month-to-date gains in one fell swoop, posting its largest single-day drop since June 2020, though US futures are edging higher on Wednesday. At the time of writing, gold remains rooted near the $1700 floor, oil prices are extending Tuesday’s declines, while EURUSD is still cowering below parity.
Markets have been jolted by the realisation that inflation could stay persistently elevated for an extended period, forcing the Fed to persist with more supersized rate hikes. Fed Funds futures duly raised the forecasted peak in this ongoing rate-hike cycle by 30 basis points to 4.3% by March 2023. There’s even now a 35% chance being allocated for a gargantuan 100-basis point hike by the Fed next week.
As long as the FOMC has more runaway before reaching “peak hawkishness”, risk assets are unlikely to garner significant gains in the interim, while sanctioning king dollar’s iron grip across the FX universe.
USDJPY Touches 24-Year High as Bullish Forces Persist
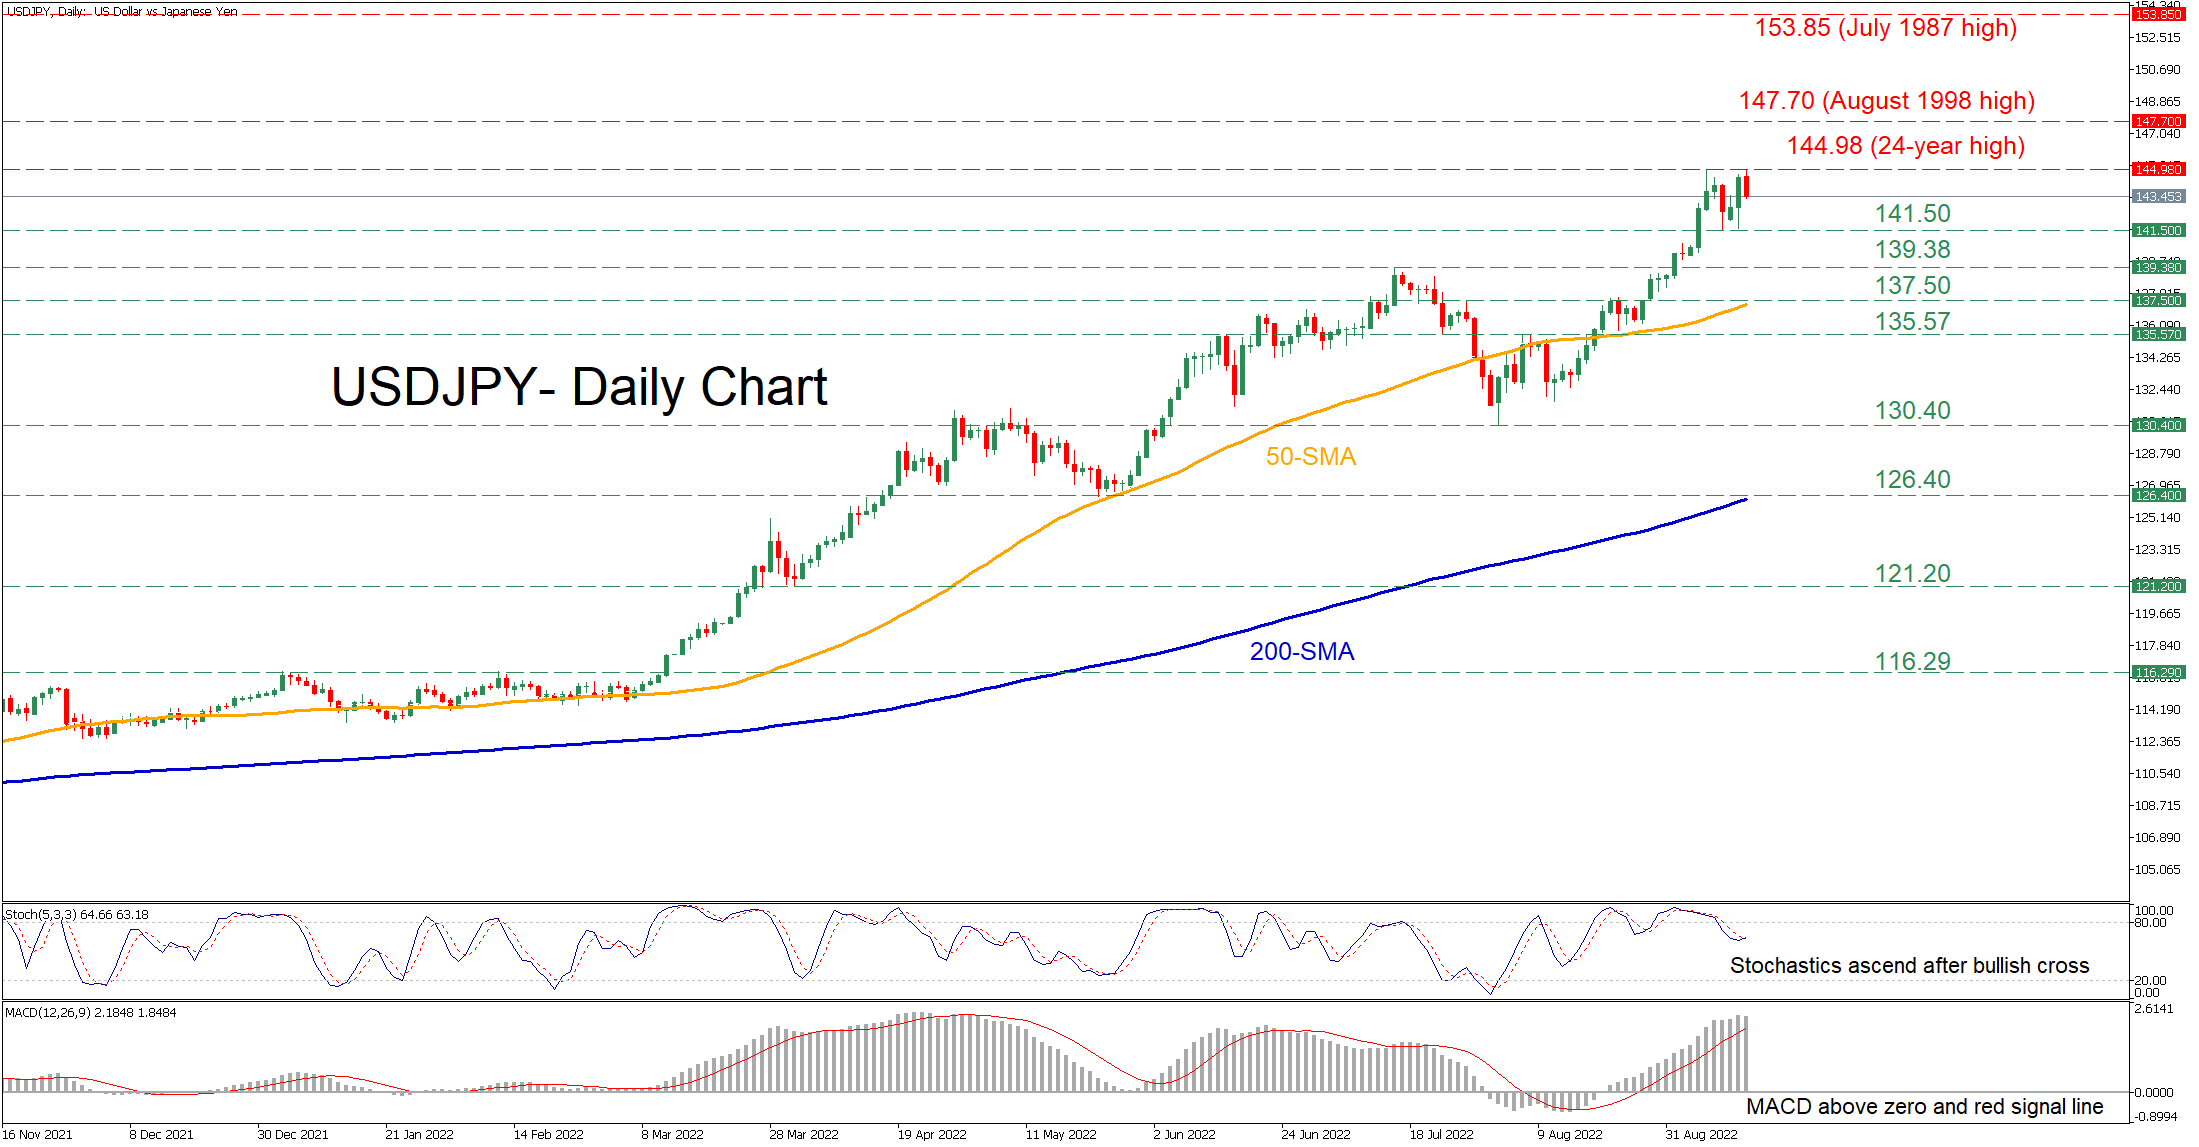
USDJPY has been in a prolonged uptrend since early March, crossing forcefully above both its 50- and 200-day simple moving averages (SMAs) and generating consecutive fresh highs. Moreover, despite the recent consolidation, the positive tone appears to be strengthening in the near term as the pair has edged higher again to challenge its recent 24-year high of 144.98.
The momentum indicators currently suggest that bullish forces have gained total control. Specifically, the stochastic oscillator is set to post a bullish crossover, while the MACD histogram is currently above zero and its red signal line.
Should buying interest persist, the pair could move higher to test the 24-year peak of 144.98. Jumping above the latter, the price would form fresh multi-year highs, where the August 1998 resistance of 147.70 might come under examination. Even higher, the July 1987 peak of 153.85 could prove to be a tough barrier for the price to overcome.
On the flipside, a negative correction could initially halt at the recent low of 141.50. Should that floor collapse, the bears could aim for the 139.98 resistance territory before the spotlight turns to the 50-day SMA, currently at 137.50. Failing to stop there, any further declines may encounter strong support at the 135.57.
Overall, USDJPY appears to have the necessary momentum to push higher and generate fresh multi-year highs. Nevertheless, the bulls should not rule out the possibility of some retracement, before the latter is accomplished.
GBP/JPY Daily Outlook
Daily Pivots: (S1) 165.73; (P) 166.41; (R1) 166.82; More...
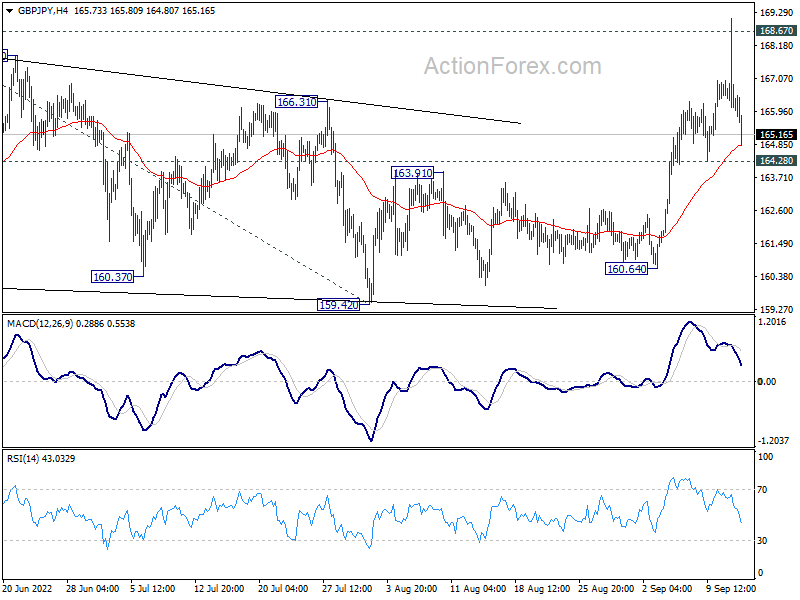
Intraday bias in GBP/JPY is turned neutral with current deep retreat. On the upside, decisive break of 168.67 high will resume larger up trend. Next target is 100% projection of 155.57 to 168.67 from 159.42 at 172.42. On the downside, break of 164.28 minor support will turn bias back to the downside to extend the corrective pattern from 168.67.
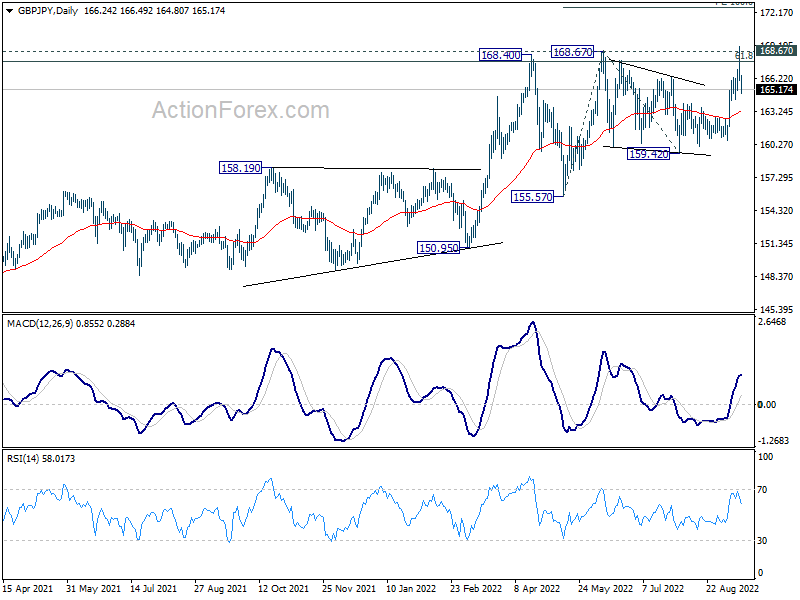
In the bigger picture, up trend from 123.94 (2020 low) is still in progress. Sustained break of 61.8% retracement of 195.86 (2015 high) to 122.75 (2016 low) at 167.93 will be a long term bullish signal, and could pave the way back to 195.86 high. This will remain the favored case as long as 155.57 support holds, even in case of deep pull back.
EUR/JPY Daily Outlook
Daily Pivots: (S1) 143.73; (P) 144.38; (R1) 144.73; More....
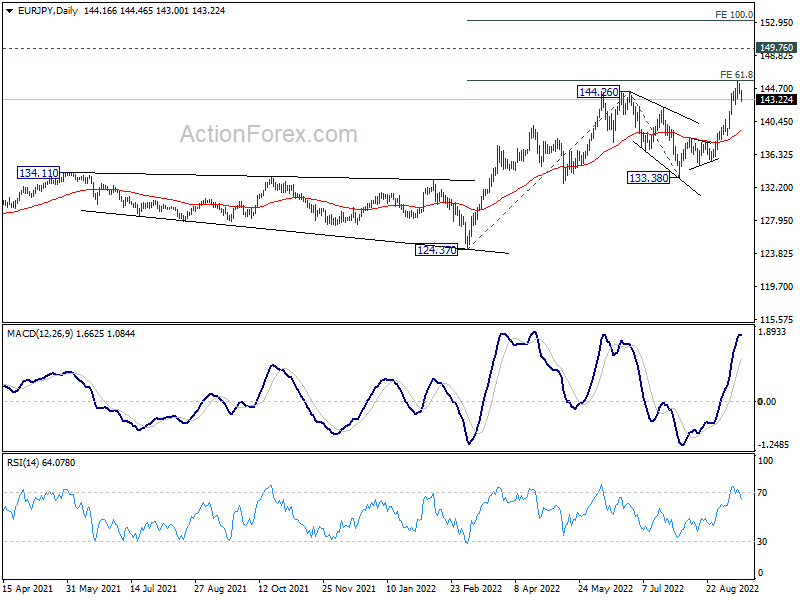
Intraday bias in EUR/JPY is turned neutral with current retreat and some consolidations could be seen. But downside should be contained above 138.38 resistance turned support bring another rally. On the upside, decisive break of 61.8% projection of 124.37 to 144.26 from 133.38 at 145.67 will pave the way to 149.76 long term resistance, and then 100% projection at 153.27.
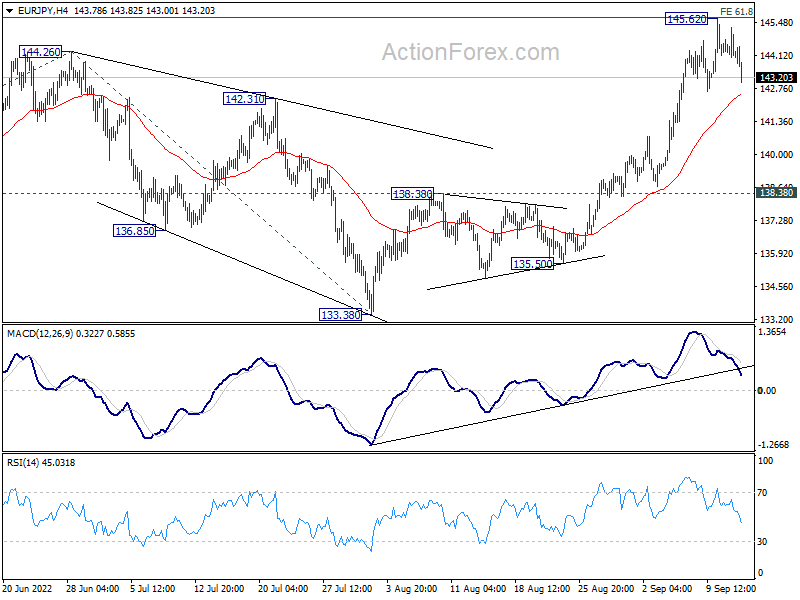
In the bigger picture, up trend from 114.42 (2020 low) is seen as the third leg of the pattern from 109.30 (2016 low). Next target is 149.76 (2015 high). For now, outlook will remain bullish as long as 133.38 support holds, even in case of deep pull back.
EUR/AUD Daily Outlook
Daily Pivots: (S1) 1.4722; (P) 1.4773; (R1) 1.4859; More...
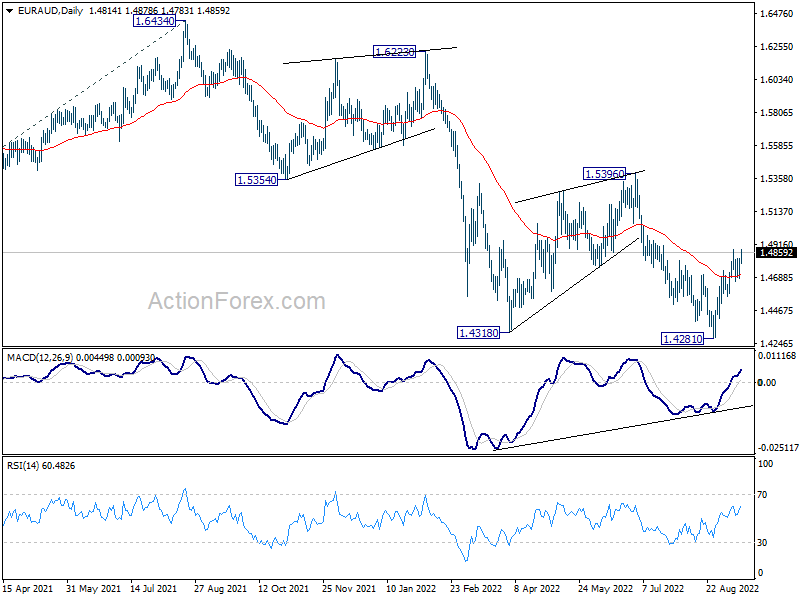
Intraday bias in EUR/AUD stays neutral as range trading continues. On the upside, above 1.4880 will resume the rebound from 1.4281 short term bottom, and target 1.5396 resistance. On the downside, however, break of 1.4564 minor support will turn bias back to the downside for retesting 1.4281 low.
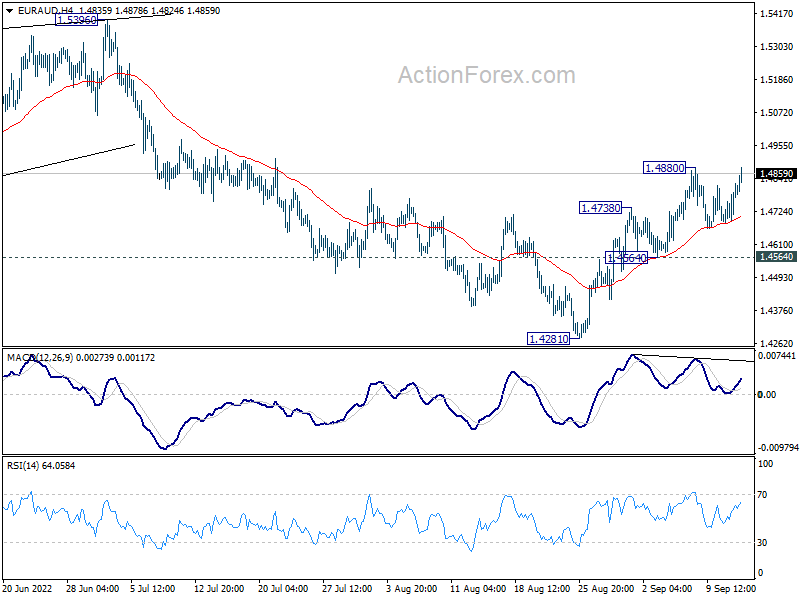
In the bigger picture, down trend from 1.9799 is still in progress. Break of 1.4318 low will target 61.8% projection of 1.9799 to 1.5250 from 1.6434 at 1.3623, which is close to 1.3624 long term support (2017 low). This will remain the favored case now as long as 1.5396 resistance holds.
EUR/GBP Daily Outlook
Daily Pivots: (S1) 0.8649; (P) 0.8672; (R1) 0.8695; More...
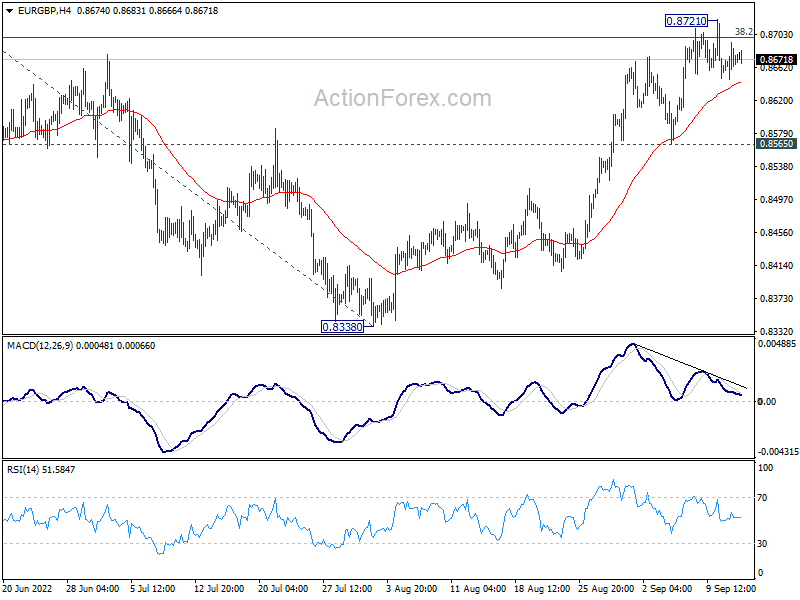
Intraday bias in EUR/GBP remains neutral for the moment. On the upside, firm break of 0.8720 resistance will indicate resumption of whole rise from 0.8201. Intraday bias will be back on the upside for 100% projection of 0.8201 to 0.8720 from 0.8338 at 0.8857. On the downside, however, break of 0.8565 support will indicate rejection by 0.8720 and turn bias back to the downside.
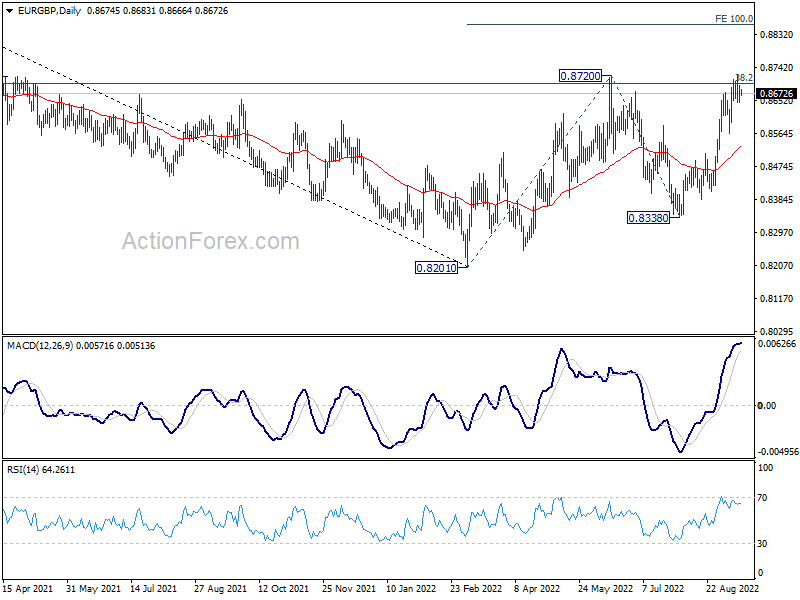
In the bigger picture, focus is back on 38.2% retracement of 0.9499 to 0.8201 at 0.8697. Sustained break there will argue that rise from 0.8201 is a medium term up trend, rather than a correction. Next target is 61.8% retracement at 0.9003. Rejection by 0.8697 again will maintain medium term bearishness, for extending the down trend from 0.9499 (2020 high) at a later stage.
EUR/CHF Daily Outlook
Daily Pivots: (S1) 0.9554; (P) 0.9620; (R1) 0.9655; More....
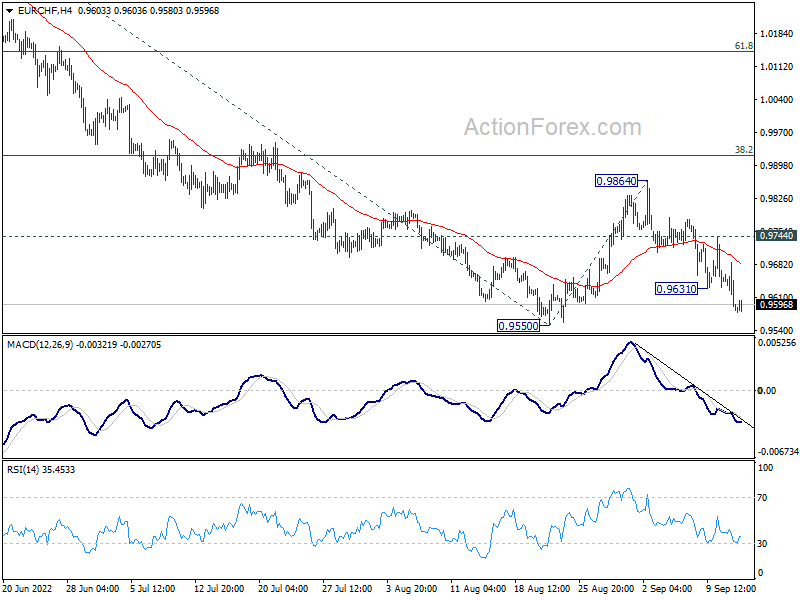
EUR/CHF's fall from 0.9864 resumed by breaking 0.9631 and intraday bias is back on the downside. Retest of 0.9550 low should be seen first. Decisive break there will resume larger down trend. Next target is 61.8% projection of 1.0512 to 0.9550 from 0.9864 at 0.9269. On the upside, above 0.9744 minor resistance will extend the corrective pattern from 0.9550 with another rising leg.
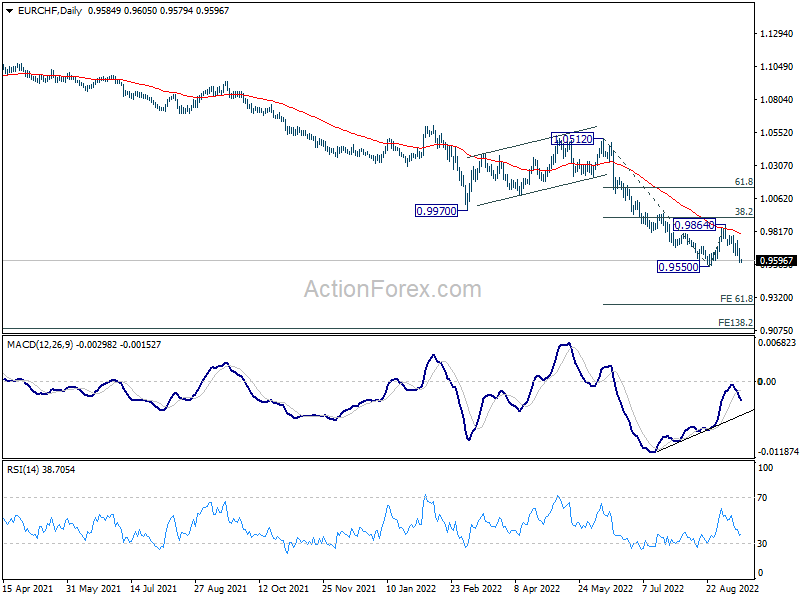
In the bigger picture, long term down trend from 1.2004 (2018 high) is still in progress. Next target is 138.2% projection of 1.2004 to 1.0505 to 1.1149 at 0.9033. On the upside, break of 0.9970 support turned resistance is needed to be the first sign of medium term bottoming. Otherwise, outlook will stay bearish in case of strong rebound.
NZDUSD Plummets to Fresh 28-month Low Below 0.6000
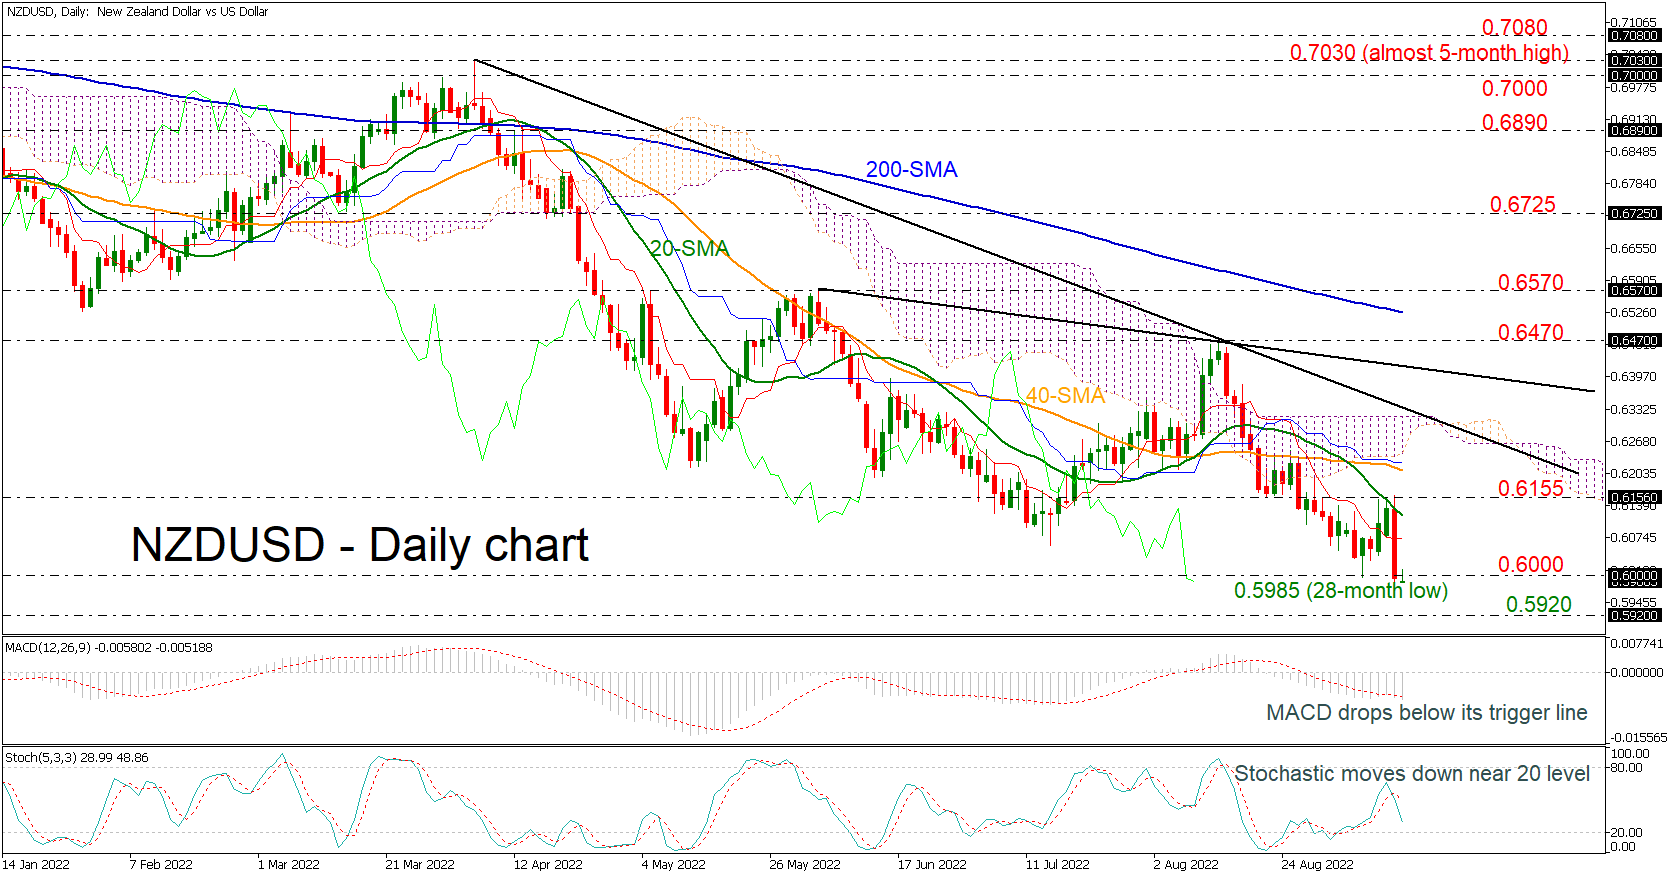
NZDUSD plunged to a new 28-month low of 0.5985 during yesterday’s session after it found strong resistance near the 20-day simple moving average (SMA). The price is holding well below the Ichimoku cloud as well as the short- and long-term descending trend lines.
Technically, the MACD oscillator has dived beneath its trigger line in the negative region, while the stochastic is approaching the 20 level following the bearish crossover within its %K and %D lines.
As the price falls beneath the 0.6000 psychological level, the next support to have in mind is the 0.5920 barrier, taken from the bottoms in May 2020. Even lower, the market may meet the trough at 0.5468, registered in March 2020.
On the flipside, if there is a successful climb beyond the 0.6000 mark, the price may run towards the 20-day SMA at 0.6117 ahead of the 0.6155 barrier. Above that, traders may turn their focus on the 40-day SMA at 0.6210, which overlaps with the lower boundary of the cloud and the blue Kijun-sen line. Higher up, the short-term downtrend line at 0.6320 may halt the bullish actions.
All in all, NZDUSD has been developing within a descending move since April 5, and only an advance above the long-term diagonal line may change this outlook.
USD/CNH: Global Corrective Movement Likely to Complete in the Next Coming Trading Days
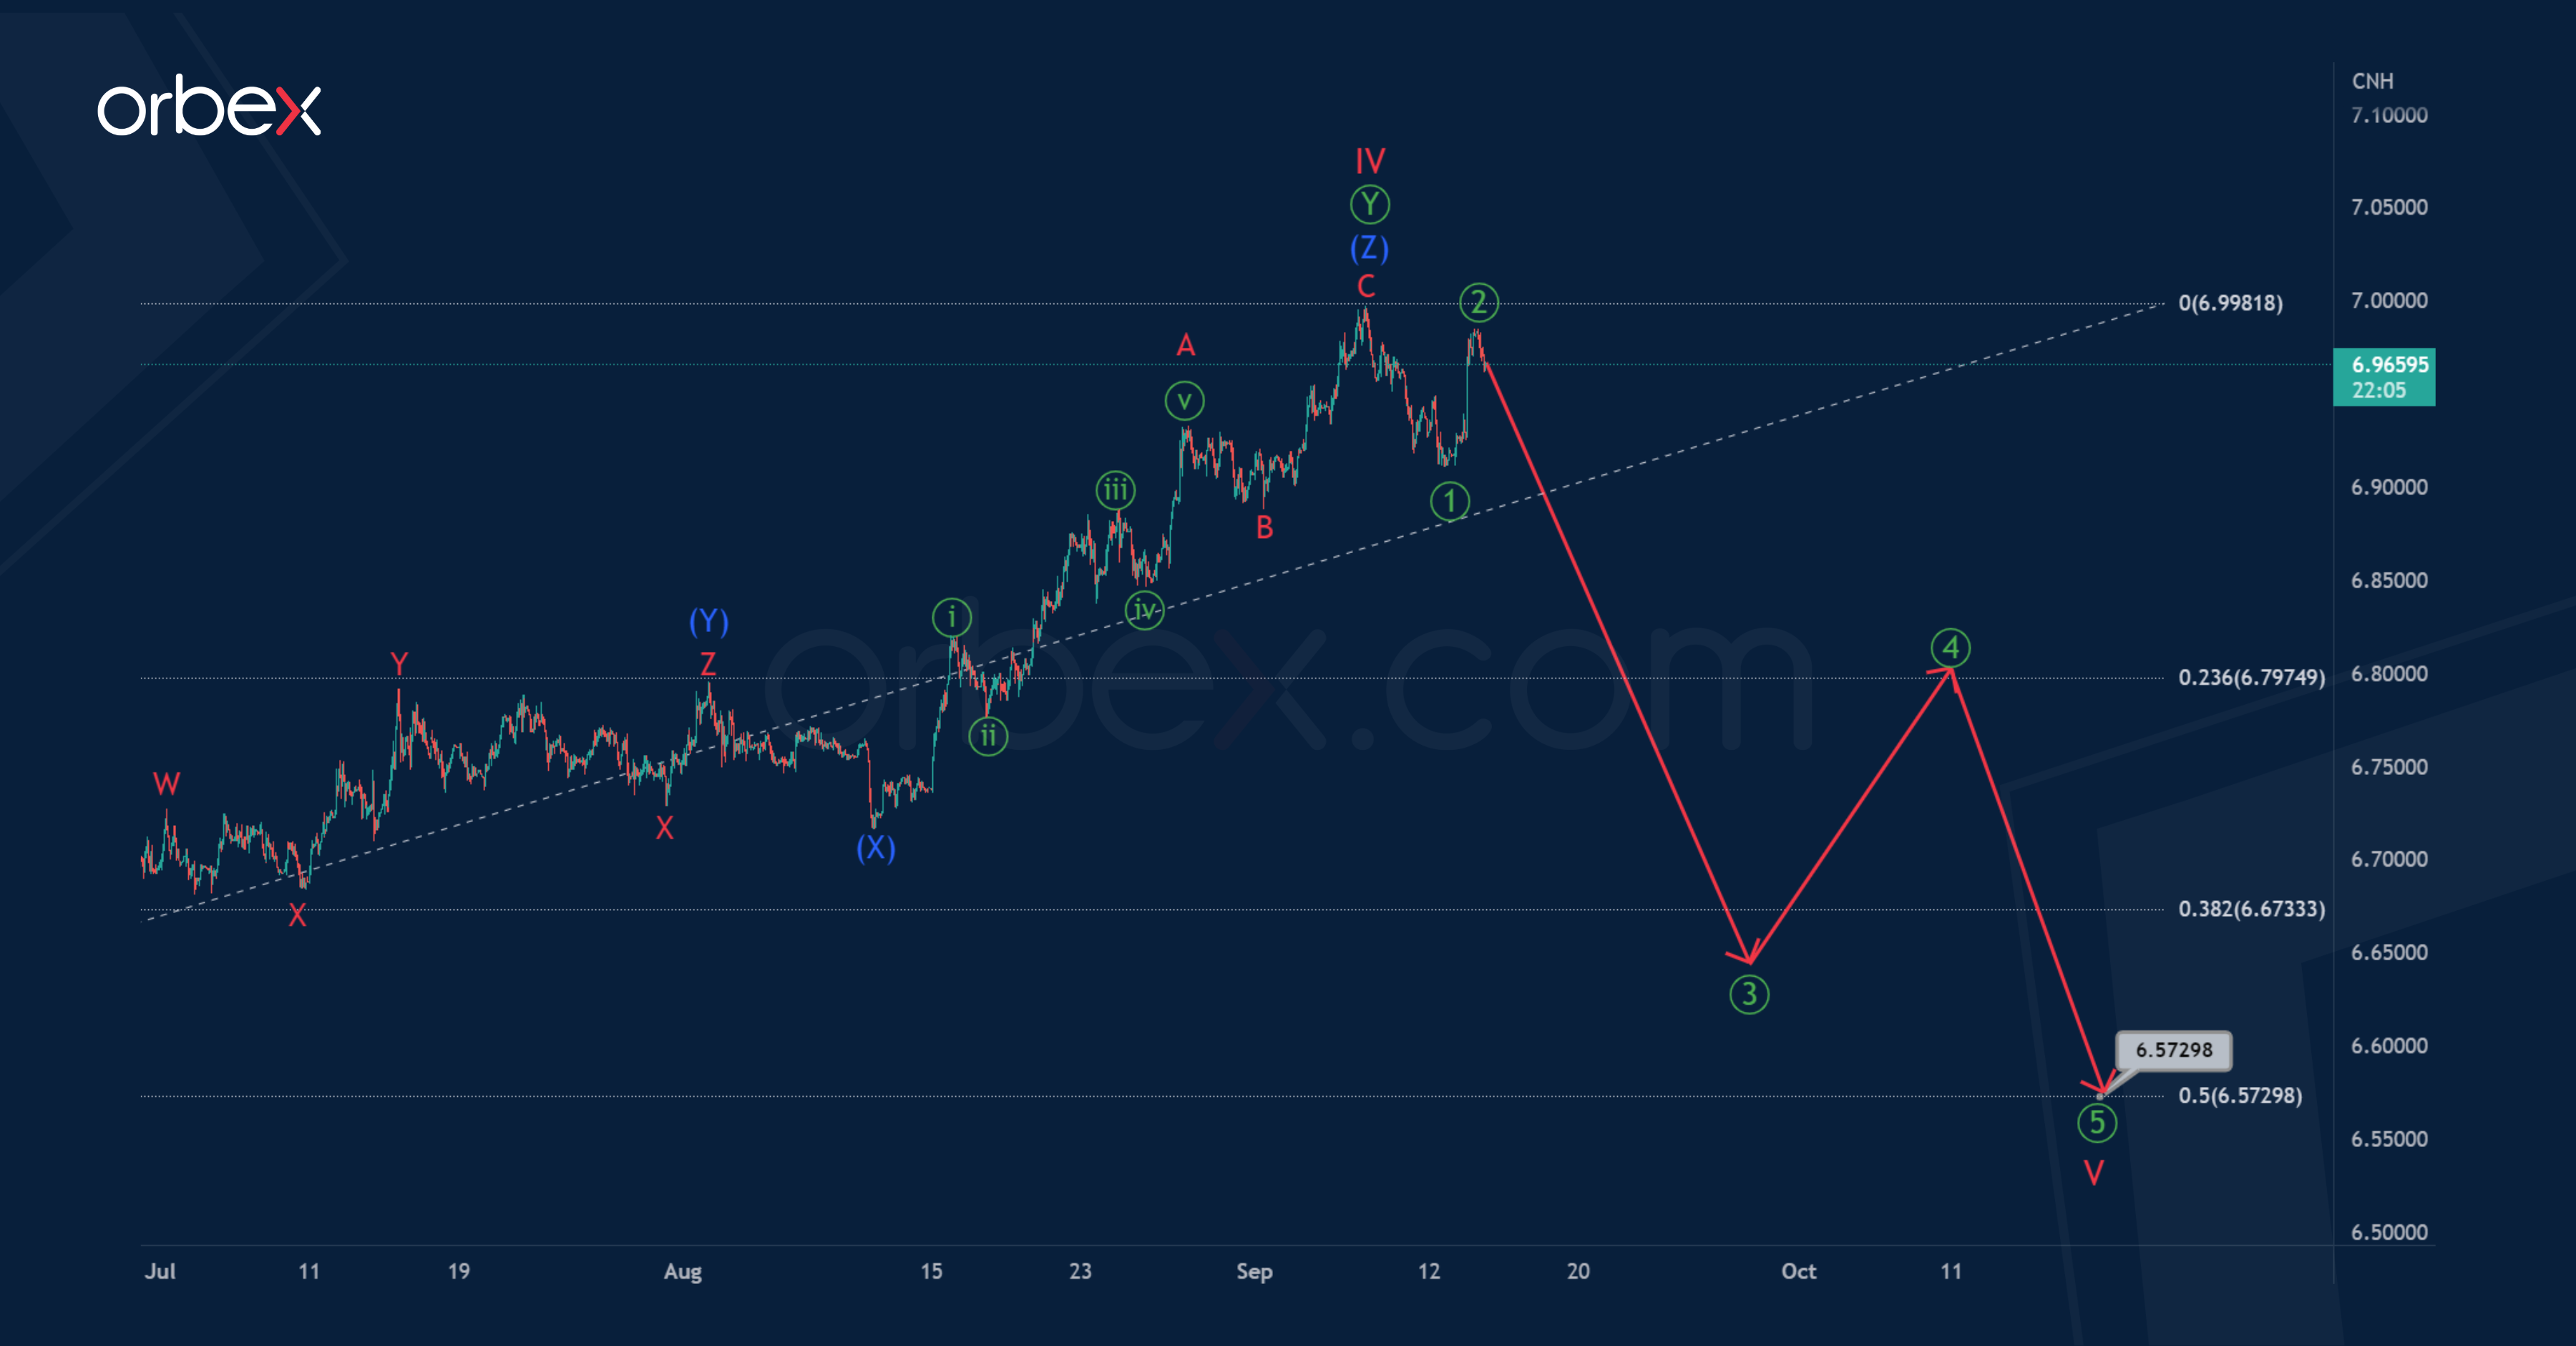
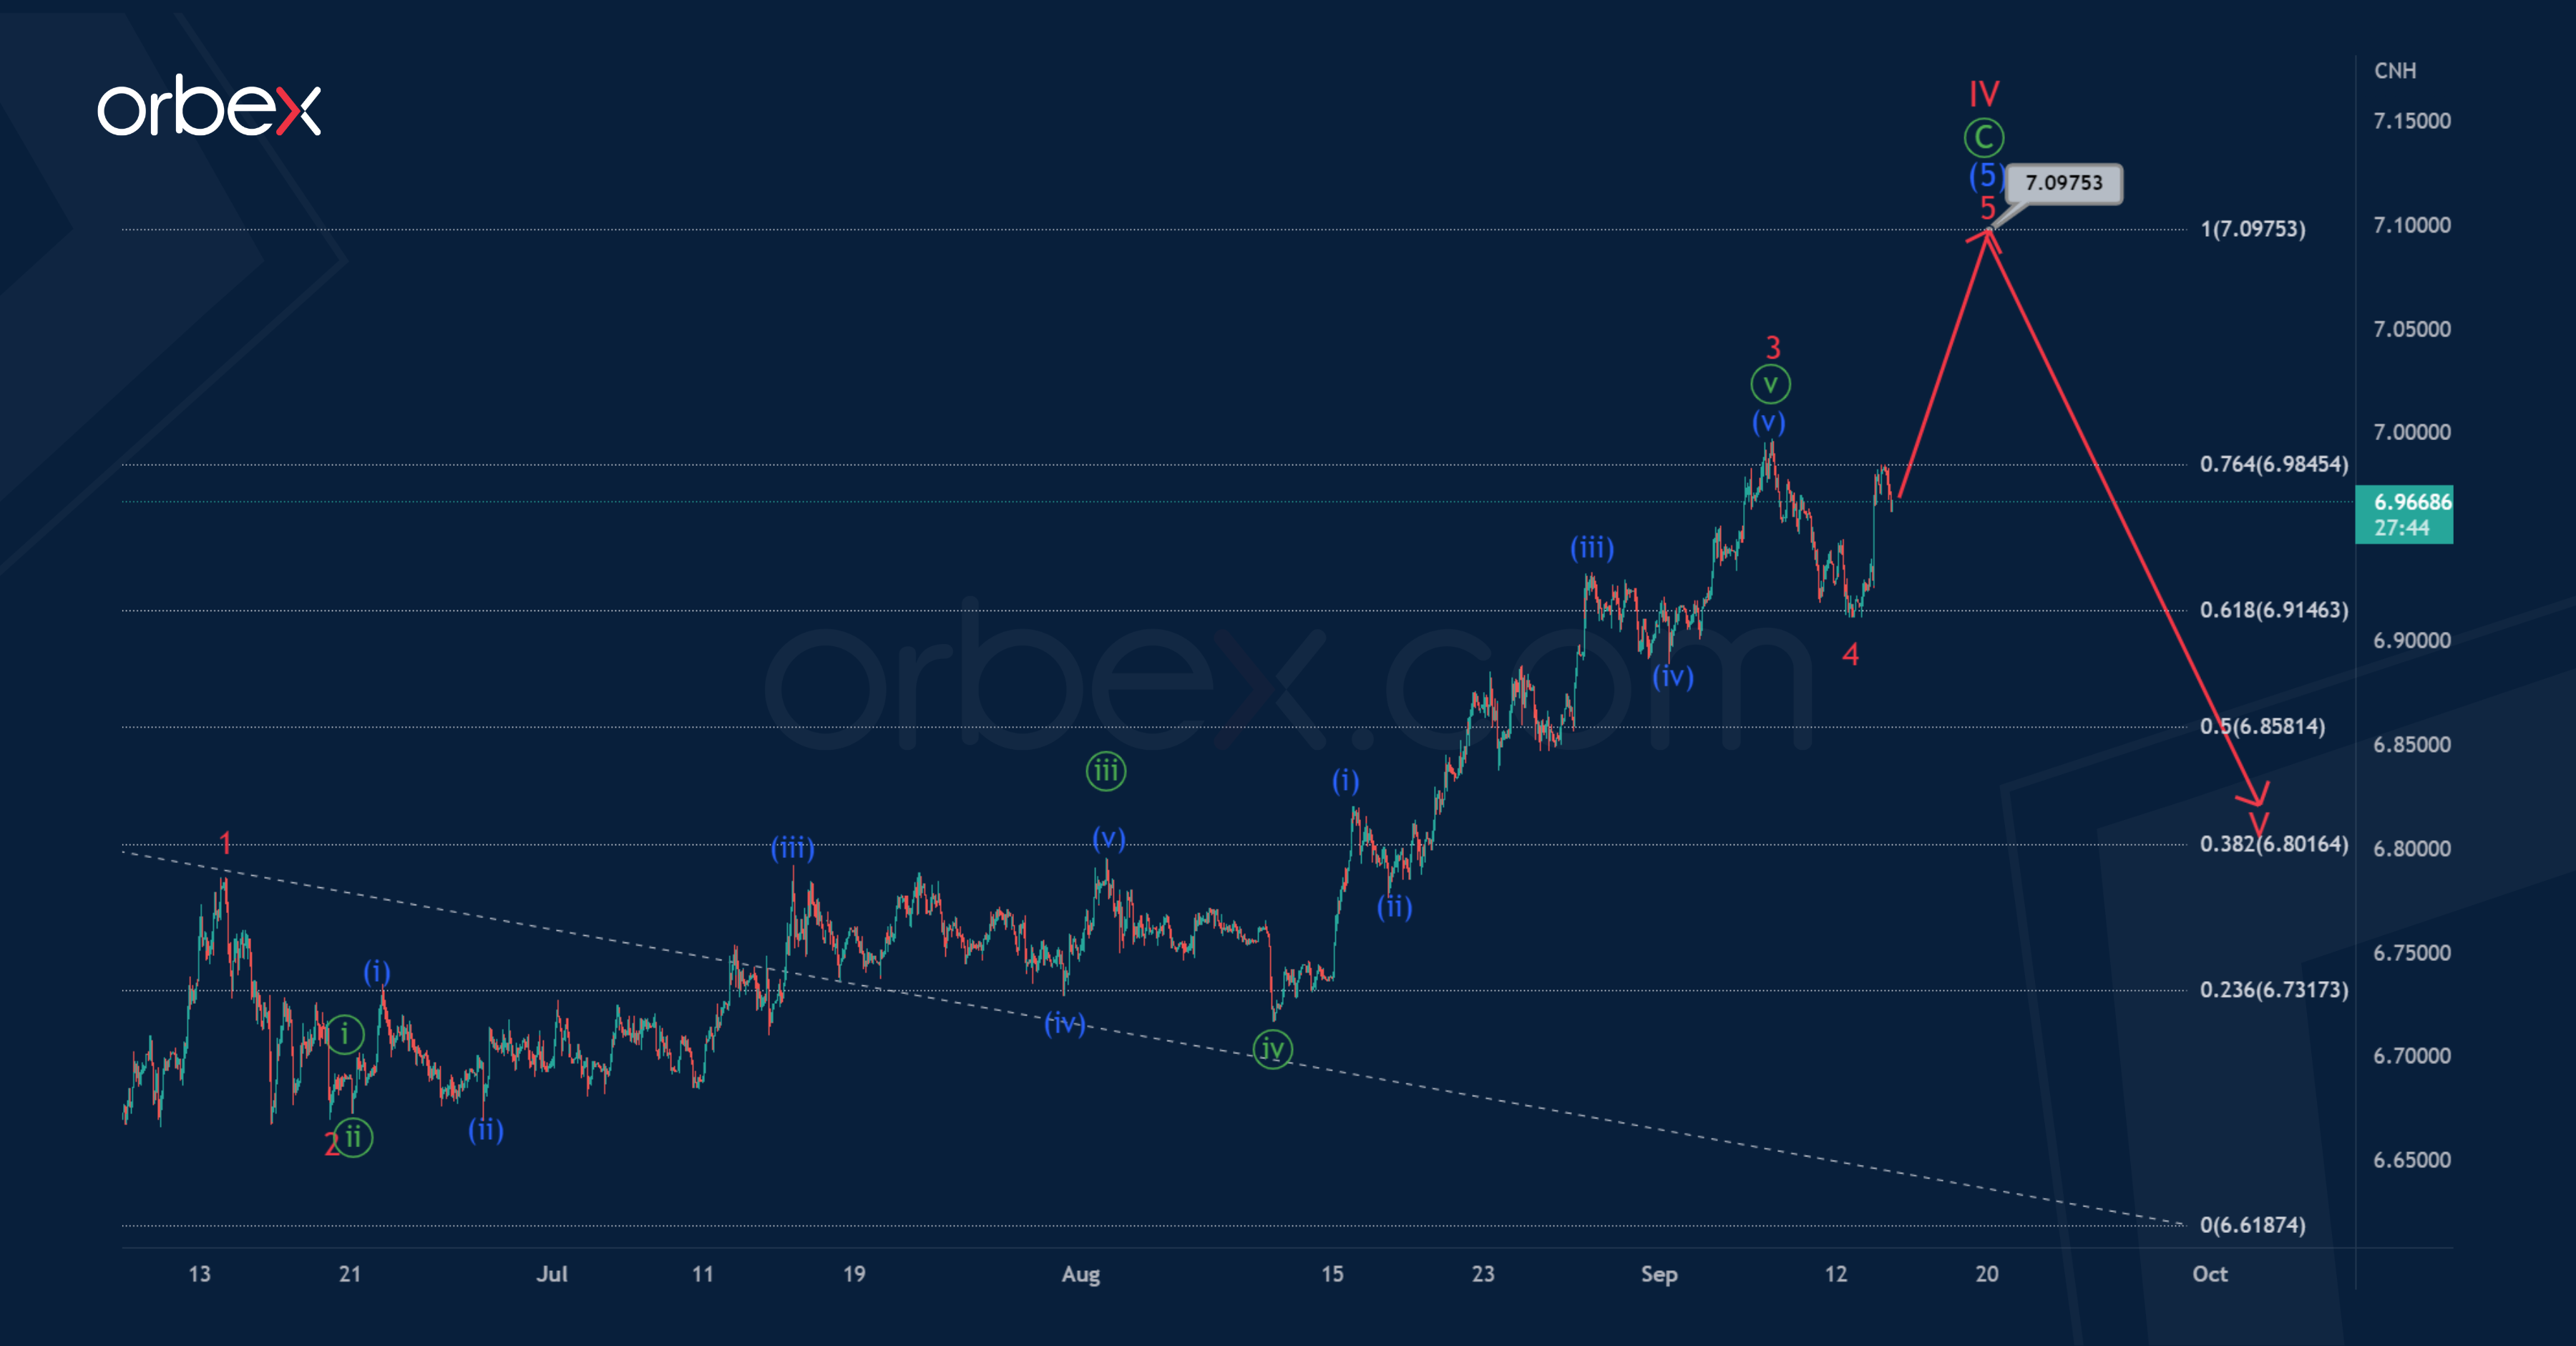
The current formation of the USDCNH shows the primary zigzag pattern Ⓐ-Ⓑ-Ⓒ, which in the long term seems to be forming a large correction IV of the cycle degree. This pattern today looks completed in two parts out of three.
The last primary wave Ⓒ takes the form of an intermediate 5-wave impulse (1)-(2)-(3)-(4)- (5).
Perhaps the last intermediate wave (5) is currently under development. It is assumed that it will take the form of a minor impulse 1-2-3-4-5. For its full completion, a sub-wave 5 is needed. The growth in this wave may continue to 7.097.
At that level, sub-wave (5) will be at 100% of wave (3).
An alternative scenario shows that the construction of the entire cycle correction IV has already been fully completed. It took the form not of a simple zigzag, but of a double zigzag consisting of primary sub-waves Ⓦ-Ⓧ-Ⓨ.
If this assumption is correct, then the market may begin to move in a downward direction, forming the final cycle wave V.
Most likely, the wave V will have the form of a primary impulse, as shown in the chart. And it will finish its pattern near 6.572. At that level, sub-wave V will be at 50% of impulse III.