Sample Category Title
US Inflation and Its Cost to Test the FOMC’s Resolve
CPI components outside the FOMC’s direct control are holding inflation at historic levels. We now see the fed funds rate at 4.125% by year end.
A near 11% decline in the price of gasoline kept the headline CPI to a weak 0.1% gain in August despite stronger-than-expected food prices, and resulted in the annual rate declining to 8.3%yr from 8.5%yr in July and a cycle peak of 9.1%yr in June.
Completely against expectations however, the core CPI printed at a strong 0.6% (0.33% consensus), lifting its annual rate from 5.9%yr in July to 6.3%yr in August, albeit still inside of the 6.5%yr peak of March 2022. Of particular concern is that the August core reading, at 0.57%, is higher than the average monthly rise in the core over the last 12 months of 0.53%.
Of the components of core inflation, price increases related to the essentials of life (shelter, medical care, insurance and education) drove the result. Inflation related to household furnishings and new cars also arguably surprised to the upside; though these gains were moderated by a second-consecutive (admittedly very small) decline in the price of used vehicles (-0.1% in August following July’s -0.4%). Pointing not only to the passthrough of lower energy prices but also arguably a reduction in demand, airline fares declined 4.6% after a 7.8% fall in July.
Taking a broader view and looking at the 6-month annualised contributions of key categories. helping to bring the pace of inflation down: supply disruptions and support from fiscal policy have largely abated, with August’s 0.8ppt contribution for goods ex energy and food unchanged from July and only a quarter of its September 2021 peak of 3.2%; also, at August, energy and transport’s 2.8ppt contribution was less than half that seen at the June 2022 peak, 6.6ppts. Holding inflation up, however: shelter inflation continued to rise at a historic pace, the 6-month contribution rising from 2.2ppts to 2.3ppts in August; and food inflation remained sticky, its contribution little changed at 1.7ppts. The change in the contribution from medical, education and other services meanwhile was negligible in August, the sum of these components continuing to contribute 0.7ppts on a 6-month annualised basis.
Clearly, this CPI report will test the resolve of the FOMC. Prices outside of their direct control (shelter and other essential services as well as food) are holding inflation up while price pressures for categories of consumption driven by demand such as other goods are airline fares are dissipating, admittedly to varying degrees. Moreover, for shelter and food, it is very difficult to work out when inflation will meaningfully abate, with higher interest rates, the tight labour market and material shortages continuing to encourage landlords to increase rents at an above-average pace, and the food supply chain subject to not only first but second and third-round price shocks from commodity, packaging and labour costs.
Factoring in the recent rhetoric of the FOMC, it now seems most appropriate to forecast a 75bp increase at next week’s September meeting to be followed by 50bp hikes at both the November and December meetings. That would take the fed funds rate from 2.375% today to 4.125% at year end. The scale and persistence of the contributions from shelter and food also points to the FOMC holding to their hawkish resolve through 2023, with rate cuts not beginning until early-2024.
This will all come at a cost, however. Since the FOMC’s rate hikes began this year, we have been of the view that growth would materially disappoint. As the FOMC have ratcheted up the pressure, the activity data has largely supported this view. We now anticipate cumulative growth through 2022 and 2023 of just 0.6%, leading to an output gap of more than 3.0% by end-2023 compared to the pre-pandemic path. Given the lags with which policy works, this output gap is likely to widen further in 2024 and sustain thereafter. The consequence is likely to be the impairment of productivity and real income into the medium-term, restricting US consumer demand and investment in productive capacity alike.
GBPUSD Wave Analysis
- GBPUSD reversed from resistance level 1.1740
- Likely to fall to support level 1.1400
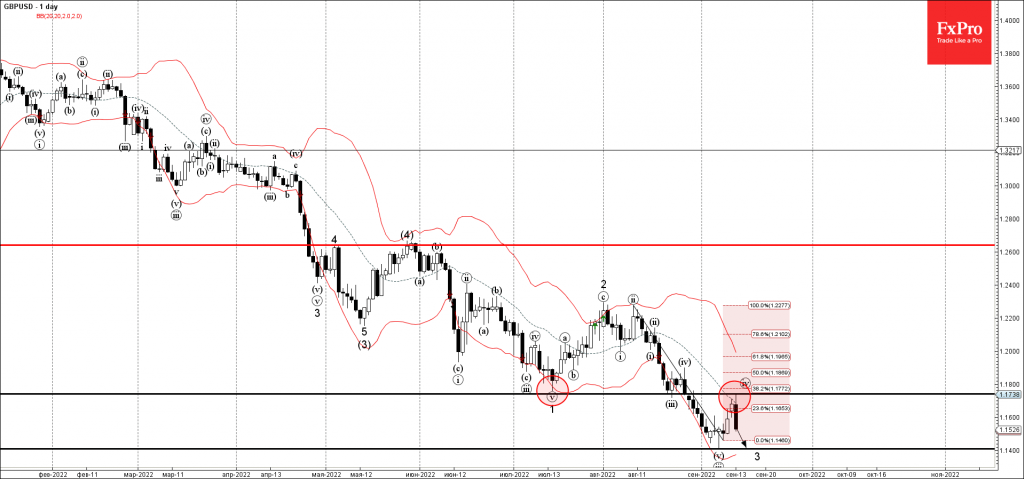
GBPUSD recently reversed down from the key resistance level 1.1740 (former monthly low from July), 20-day moving average and the 38.2% Fibonacci correction of the downward impulse from August.
The downward reversal from the resistance level 1.1740 continues the active short-term impulse wave 3 of wave (5) from May.
GBPUSD can be expected to fall further toward the next support level 1.1400 (low of wave (v) and the target for the completion of the impulse wave 3).
Eco Data 9/14/22
[php_everywhere instance="1"]
Euro Slides after Hot US Inflation Report
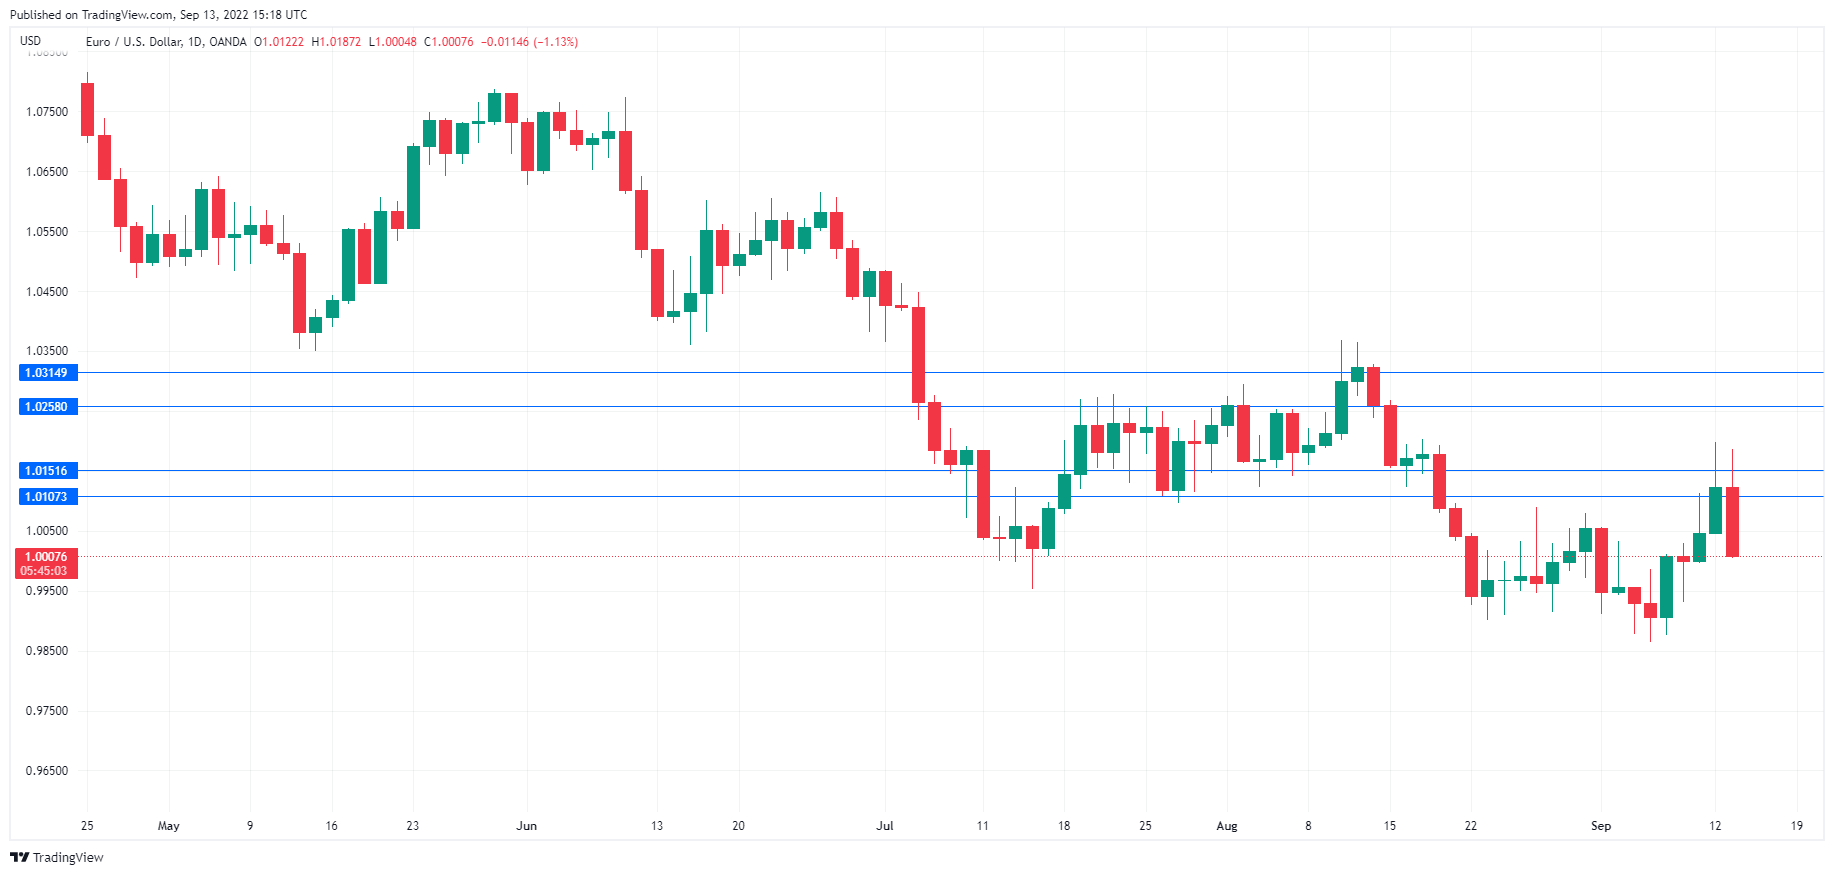
The US dollar, on the ropes for the past few days, came out swinging today and has posted sharp gains against all of the major currencies. In the North American session, EUR/USD is trading at 1.0012, down 1.12%. The euro could find itself below the symbolic parity level before the end of the day.
Dollar flies as US inflation higher than expected
Last week’s ECB rate hike of 0.75% sent the euro on a strong upswing, but the currency came crashing down today. The US dollar has rebounded after the August inflation report was hotter than expected. Headline CPI dropped to 8.3% YoY, down from 8.5%, courtesy of lower gasoline prices. Still, inflation was considerably higher than the market consensus of 8.0%. Investors were especially concerned about core CPI, which rose to 6.3%, up from 5.9% and above the forecast of 6.1%. The mood in the markets is the polar opposite after the July inflation report, which dropped unexpectedly and sent the US dollar sharply lower.
The latest inflation data have increased the odds of a 75 basis point hike at next week’s policy meeting, with the likelihood of such a move rising to 80%, up from 72% prior to the inflation release. Interestingly, there is now a 20% chance of a massive 100bp hike, with zero expectation of a modest 50bp increase.
Since the market euphoria after the July meeting, when there was talk of the Fed pulling a U-turn on policy, the markets have bought into the Fed’s message that it will continue to raise rates until there are clear indications that inflation has peaked and is moving lower. The markets are anticipating a terminal rate of 4-4.25%, which means there is some life still left in the Fed’s rate-tightening cycle, as the current benchmark rate is 2.50%.
EUR/USD Technical
- EUR/USD is testing support at 1.0152. Next, there is support at 1.0107
- There is resistance at 1.0257 and 1.0314
Dollar Surged after the Sticky Inflation Report
US inflation turned out to be wider and hotter than expected, confirming markets for another 75-point rate hike next week. Published data showed a 0.1% increase in prices for August, against expectations of a decline of the same magnitude. Annual inflation slowed from 8.5% to 8.3% but was better than the 8.1% forecasted.
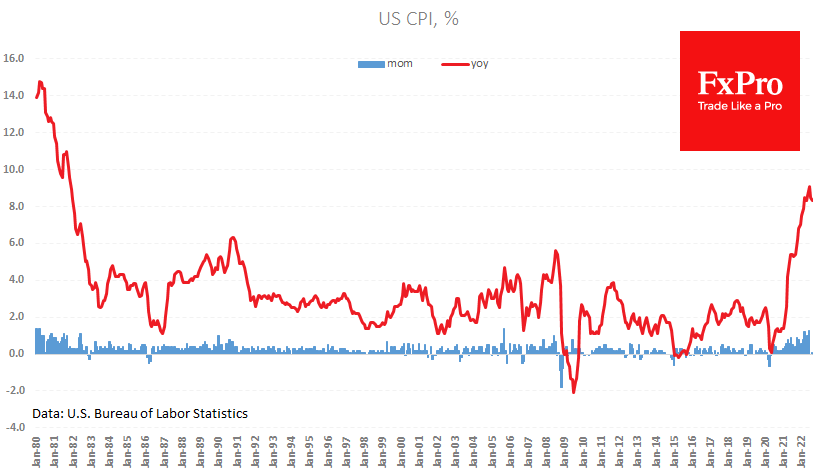
Most of all, the markets were spooked by the surge in the core index. It added 0.6% over the month, to an annual rate of 6.3%, signalling inflation is spreading beyond energy and food.
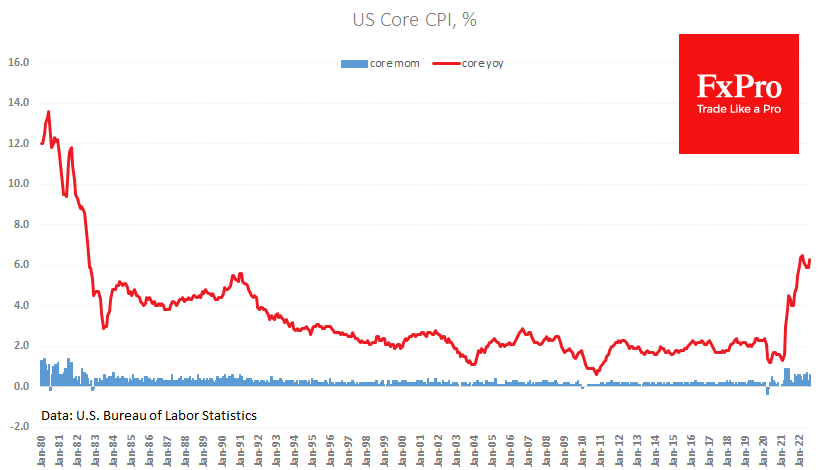
The inflation roots set the stage for a stiffening response from the Fed. Almost immediately after the report, the swap market plotted a 100% probability of a rate hike of 75 points in a week. Risk assets have been vulnerable as the currency and stock markets have retreated from extremes over the past week. The dollar, meanwhile, has decisively returned to the upside.
The S&P500 futures are losing almost 3% immediately after publication, and the Nasdaq100 is down 3.5%, erasing virtually all the gains from last Friday. The Dollar Index adds 1.6% to the day’s lows, hitting 109.48. Once again, the 50 SMA acts as the basis for renewing longs after a brief shake-out.
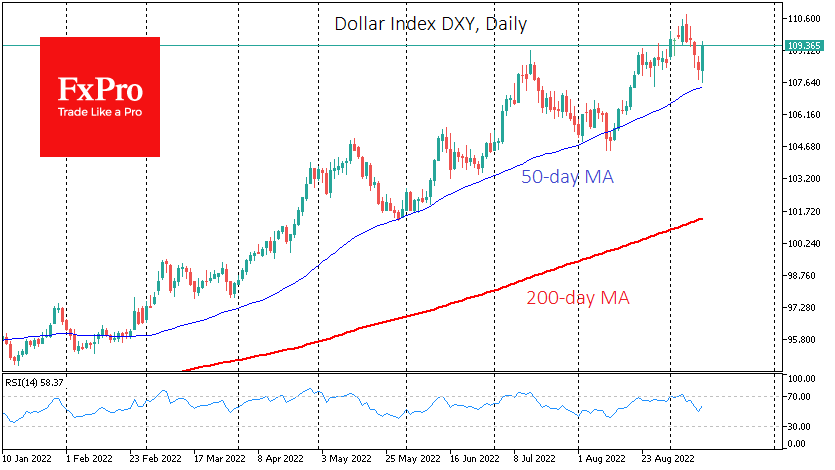
Tomorrow starting the week-long silence period for the Fed before the next policy meeting, which will leave the markets on their own assessments. In such an environment, the USD index is well placed to make new 20-year highs within just a few days.
Dollar Index : Dollar Becomes Attractive Again on Higher than Expected US Aug Inflation
The dollar rallied across the board in immediate reaction to hotter than expected US inflation in August, which signal that price pressures are not easing at expected pace, implying that the US central bank will remain on aggressive hiking path in the policy meeting next week.
The data made the dollar attractive again after larger bulls took a breather, as expectations of another 75 basis points hike in Fed’s September meeting, were revived.
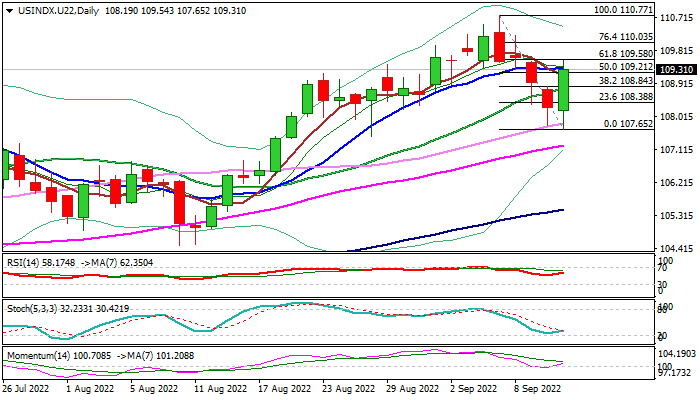
The dollar index surged around 1.6% in minutes after the release of rather disappointing data, so far retracing nearly 61.8% of the pullback from new 20-year high (110.77) to 107.65 and generating an initial signal that corrective phase might be over.
Four-day correction was contained by daily Kijun-sen and 50% of 104.49/110.77 upleg, with likely formation of bullish engulfing on daily chart, to add to positive signals.
Daily studies improved on reversal of 14-d momentum after a brief probe into negative territory and RSI turned north from neutrality zone.
Today’s close above 108.84 (broken Fibo 38.2% of 110.77/107.65) is seen as a minimum requirement to keep fresh bulls in play, while lift and close above 10DMA (109.37) would strengthen bullish structure for further recovery.
Res: 109.33; 109.58; 110.00; 110.22.
Sup: 108.84; 108.38; 107.78; 707.65.
Sunset Market Commentary
Markets
US headline inflation in August rose 0.1% m/m, defying (commodity driven) expectations for a 0.1% decline. Year-on-year, prices grew by 8.3%. While down from 8.5% in July, the cooldown was less than the 8.1% hoped for. Core measures even surged 0.6% m/m. That’s double the pace analysts’ foresaw and that of July. Compared to August last year, core inflation quickened to 6.3% (vs 6.1% consensus). Energy indeed weighed considerably on prices last month, tanking 5% m/m. But many other categories clearly provided a significant counterweight. These include the notoriously sticky shelter component (0.7% m/m), new vehicles (0.8%) and transportation services (0.5%). Investors were (too) confident in thinking that inflation would cool down quickly and that it could remove some of the enormous pressure on the Fed. In the summer, we’ve seen a similar thinking play out. Back then recession fears drove the correction in yields. In both cases, however, reality forces markets to reassess. Today’s report caused a mini crash on bond markets. US yields swap losses of more than 6 bps for stunning gains in a matter of seconds. The curve flattens with changes going from +2.7 bps (30y) to 15.3 bps (2y). The 2y yield forces a decisive push through recent resistance levels just north of 3.5% to set a new 15-year high (3.74%). This opens technical opportunities for a return to the psychological 4%. A 75 bps move at the Fed meeting next week with this data is a done deal. US money markets indeed discount a more than 100% chance. They even attach a 65% probability for a similar move in November. European yields get caught in the slipstream, with swap yields adding 6.4-10.4 bps in a flattener. Here too, the 2y tenor steams ahead to new cycle highs (2.37%). Next stop: 2.5% (2011 high). The sharp rise in real yields - the 10y one in the US hits 1% for the first time since 2018 - hurts equities and other risky assets. The EuroStoxx50 tumbles 1.4% in the red, reversing gains of 1%. American indices gap lower at the open. The Nasdaq suffers the biggest losses (-2.7%). Brent oil slips sub $95/b after the inflation release, snapping a three-day winning streak.
Dollar strength is back after a two-day sabbatical. The greenback roars back against all G10 peers with the trade-weighted index rebounding from 108 support to 109.14 currently. 109.29 marks the previous cycle high (July) and serves as immediate resistance and is probably soon up for a test. EUR/USD’s comeback over the previous days ends in tears. A second attempt to escape the 2022 downward trend channel reversed instantly. The pair fell from just south of 1.02 to close to parity again. USD/JPY (144.6) is on track to close at a new 44-year high.
News Headlines
The UK unemployment rate in the three months to July dropped from 3.8% to 3.6%, the lowest level since 1974. While good news at first sight, the underlying dynamics suggests a more mixed picture. The decline in the unemployment rate was for an important part due to people leaving the labour market, raising the inactivity rate by 0.4% to 21.7%. At the same time, employment growth in the 3mths to July slowed the 40k from 160k, a figure substantially weaker than expected. The total actual weekly hours worked in the 3 months to August also declined and stays below the pre-corona level. Weekly earnings growth (ex-bonuses) accelerated faster than expected from 4.7% 3M Y/Y to 5.2%. However, this is still well below the headline inflation which printed at 10.1% in July. August UK inflation will be published tomorrow morning. Vacancy data also suggest a tentative loss of momentum in the UK labour market. Available jobs in the June-August period declined 34 000, albeit to a still high 1.266 mln.
According to reports from German daily Handelsblatt and sources at the Ministry of Finance, the German government intends to use a mechanism set up to support companies at the time of the corona crisis to support struggling energy firms. State Development Bank KFW is said to be able to use €67 bln of the WSF Stabilization Fund to provide liquidity assistance and guarantees to struggling energy companies as they have to cope with higher prices and growing liquidity needs to meet a sharp rise collateral claims. The German cabinet is expected to approve the measures on Wednesday.
Still Too Hot to Handle: August CPI
Summary
The Consumer Price Index increased 0.1% in August, but the modest gain for the headline index masked what was a disappointing report. Gasoline prices fell 10.6% in the month, helping to keep overall inflation in check, but beyond energy goods there were not many encouraging takeaways. Excluding food and energy prices, core inflation increased 0.6%, well above the Bloomberg consensus of 0.3%. Core goods inflation remained strong and broad-based despite indications that supply chains are functioning more smoothly and inventory stockpiles are building. Core services inflation also remained hot, increasing 0.6% in August.
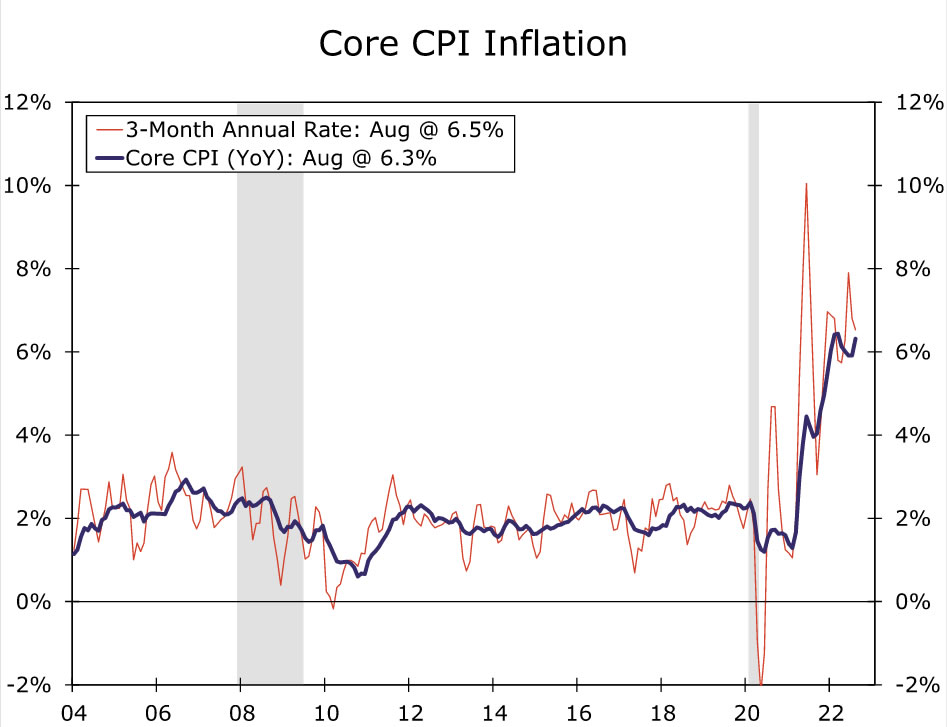
Of course, declining gasoline prices and moderating food price inflation are welcome developments. But through the noise, inflation remains a long way off from 2% over a sustained period of time. Over the past three months, the core CPI has advanced at a 6.5% annualized pace, more than triple the Fed's 2% inflation target and above the 6.3% increase seen over the past 12 months. A 50 bps rate hike at next week's FOMC meeting now seems like a distant pipe dream, with a 75 bps rate hike now all but assured.
Slower Inflation, but Still Disappointing
The Consumer Price Index increased just 0.1% in August, but the tepid gain was stronger than the Bloomberg consensus expectation for a -0.1% decline in consumer prices. August's small increase in prices helped lower the year-over-year rate of price growth to 8.3%—a welcome but still insufficient step in relieving excruciatingly high inflation for Americans.
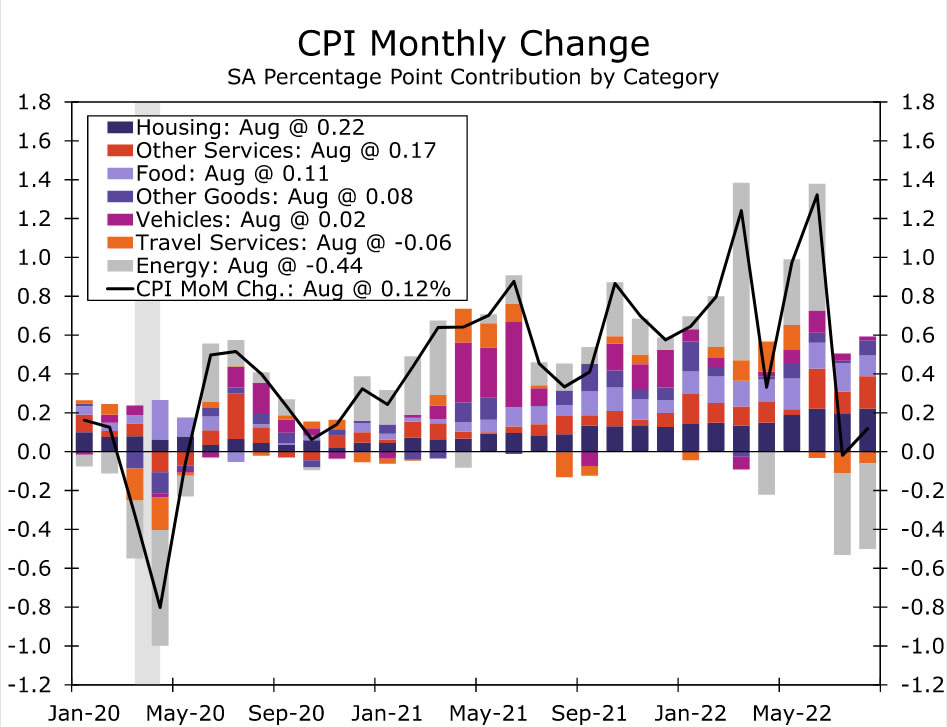
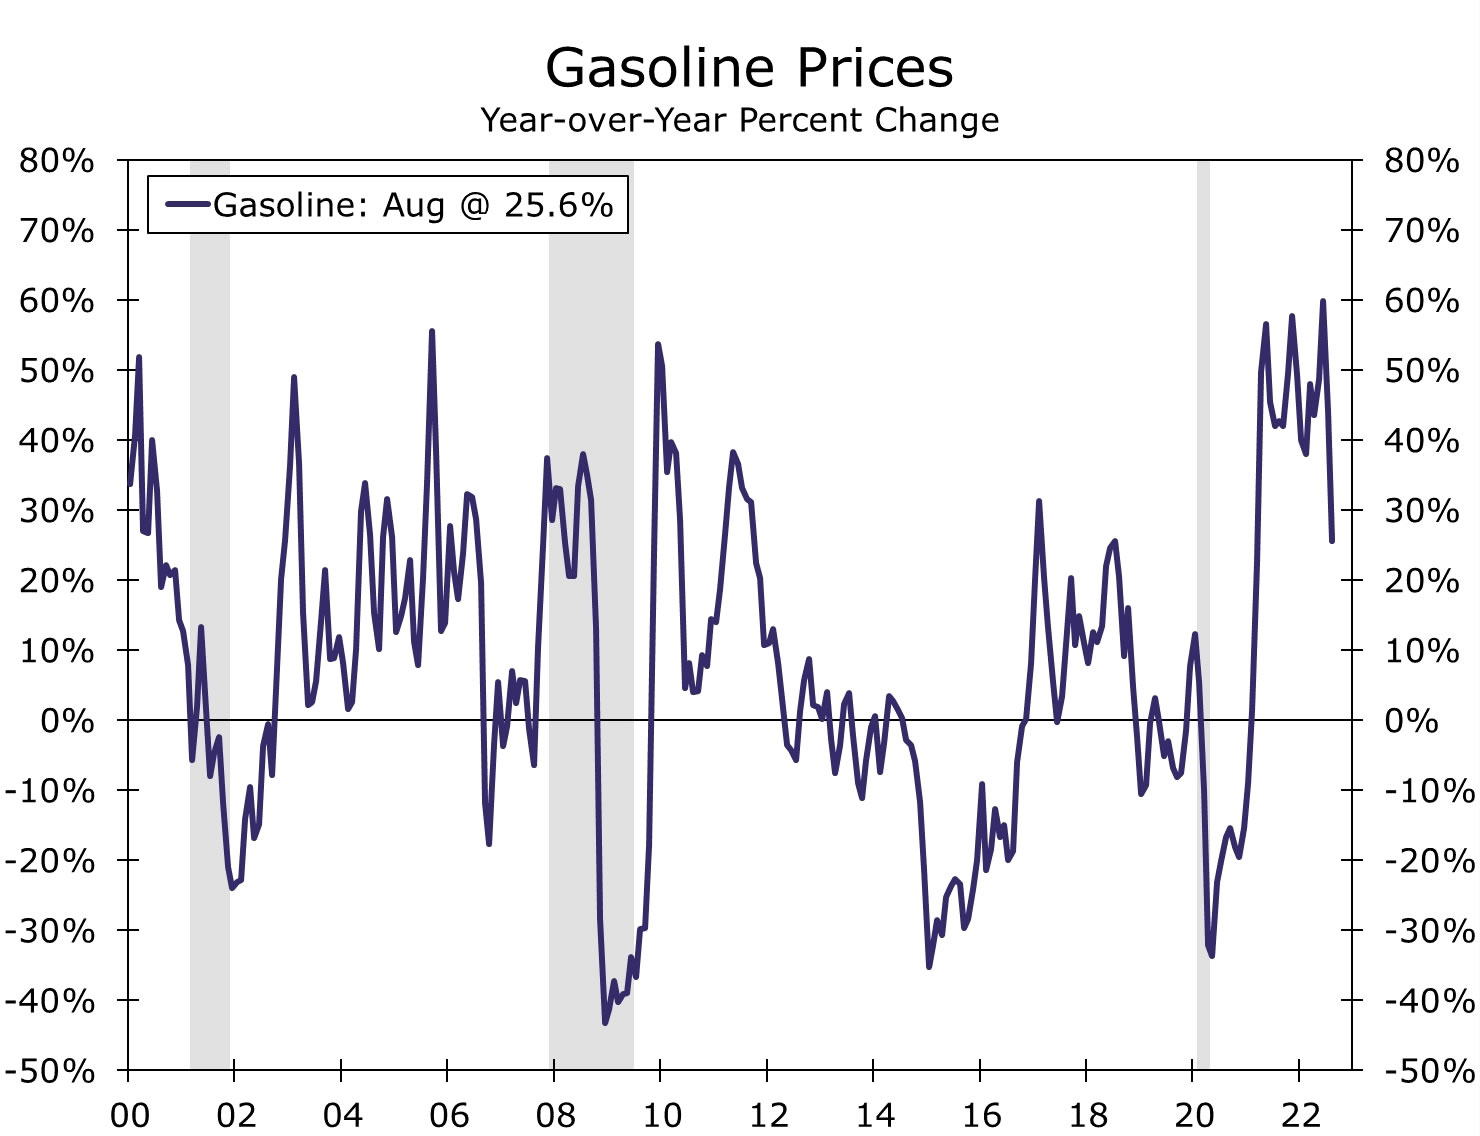
As expected, energy goods were a major driver of August's softer print. Gasoline prices fell 10.6% in August and are now "only" up 25.6% year-over-year. Energy services rose 2.1% on the back of higher electricity and utility gas prices. Food inflation eased slightly, increasing 0.8% in August and marking the slowest pace of price growth for food this year. That said, a 0.8% monthly increase in food prices will hardly be considered a victory by consumers. Prices at the grocery store check out counter are now up 13.5% year-over-year, the biggest increase since February 1979.
Meanwhile, the core index showed that price pressures remain strong and broad-based. Excluding food and energy, prices rose 0.6%, surpassing even our above-consensus estimate for a 0.4% increase. Lower commodity prices, signs of supply chains functioning more smoothly and greater inventory levels have done little to ease core goods inflation, which rose 0.5% in August. Despite declining auction prices, used vehicle prices are hanging in there, dipping just 0.1% in August, while new vehicle prices continue to rise at a pace unthinkable over the past two decades (up 0.8% last month). Prices for goods remain sticky beyond the particularly supply-constrained auto sector. Household goods, apparel, medical and recreational goods prices all rose in August.
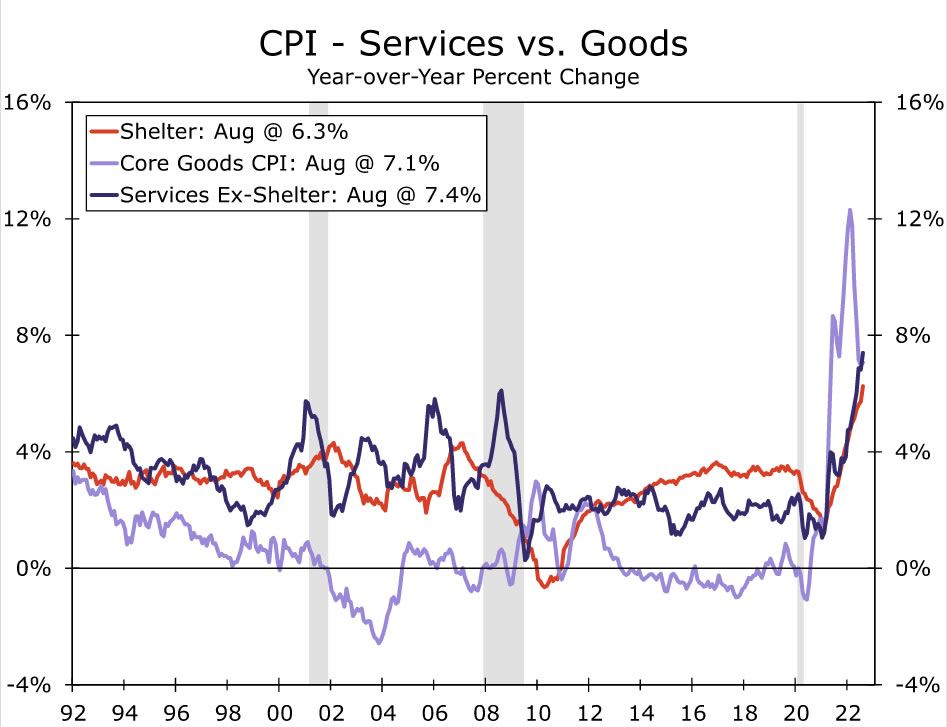
Relief on services inflation was always going to be a harder ask than for goods at this stage of the cycle, and here too price growth picked up in August. Notably, the 0.6% rise in core services was driven in large part by stronger shelter inflation. Both primary rent and owners' equivalent rent rose 0.7%, with the latter posting the largest monthly gain since 1990 (0.71%). While private sector measures of rent growth suggest the corresponding CPI categories may be close to peaking on a monthly basis, the slow-moving nature of primary rent and OER in the CPI data suggest housing will continue to provide a sizable boost to core inflation in the coming months. At the same time, price growth for other services like medical care, insurance, tuition and personal care continue to press ahead at a strong rate, underscoring the inertia inflation continues to carry. One of the few spates of good news for services inflation came from a 4.6% drop in airfares last month, although that still leaves the cost of a plane ticket up 33% over the past year.
Another 75 bps Rate Hike Likely Coming Next Week
At this point, any slowdown in inflation is encouraging for the outlook. Declining gas prices and a modest slowing in food price inflation should help keep inflation expectations in check and boost consumer purchasing power. Some categories such as used auto prices continue to gradually normalize, while easing constraints across supply chains and softening in the housing/rental market look promising for further moderation ahead.
That said, there remains considerable ground to cover before getting inflation back to a pace that resembles the Fed's target. Over the past three months, the core CPI has advanced at a 6.5% annualized pace, more than triple the 2% target. Moreover, a sustained return to 2% inflation remains even more distant at present. The tight labor market has kept compensation, the largest cost for most businesses, advancing well above 2% (even after accounting for productivity growth), while consumer and business inflation expectations remain high relative to the range of recent decades. We think the road to returning inflation to target is still a long one, and we continue to look for the FOMC to press ahead with another 75 bps point hike at its meeting next week.
AUD/USD Mid-Day Report
Daily Pivots: (S1) 0.6843; (P) 0.6871; (R1) 0.6919; More...
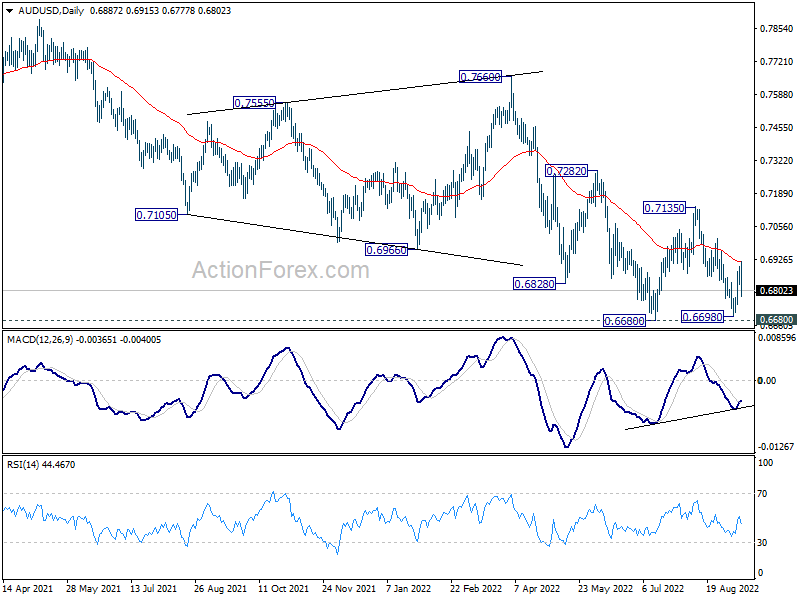
AUD/USD's break of 0.6823 minor support argues that rebound from 0.6698 has completed. Intraday bias is turned neutral first. On the downside, further break of 0.6680 low will resume larger down trend. On the upside, sustained break of 55 day EMA (now at 0.6915) will target 0.7135 resistance next.
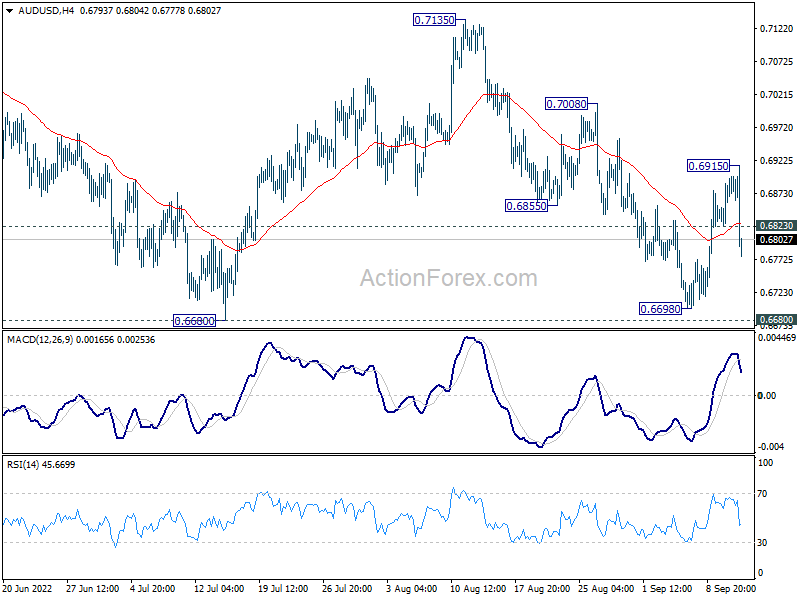
In the bigger picture, price actions from 0.8006 (2021 high) is seen more as a corrective pattern to rise from 0.5506 (2020 low). Or it could also be a bearish impulsive move. In either case, outlook will remain bearish as long as 0.7135 resistance holds. Next target is 61.8% retracement of 0.5506 to 0.8006 at 0.6461.
USD/JPY Mid-Day Outlook
Daily Pivots: (S1) 142.13; (P) 142.81; (R1) 143.52; More...
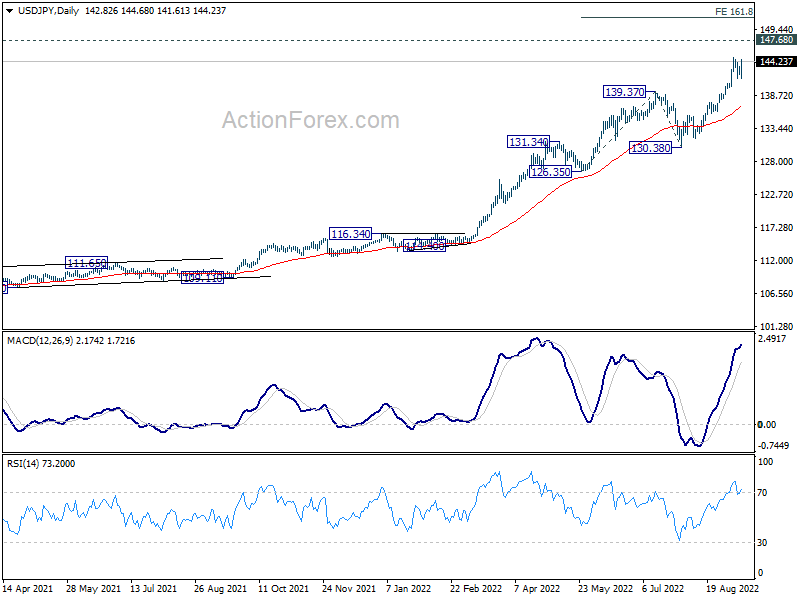
USD/JPY rebounded strongly after drawing support from 4 hour 55 EMA, but stays below 144.98 temporary top. Intraday bias remains neutral first. In case of another retreat, downside should be contained by 139.37 resistance turned support. On the upside, break of 144.98 will resume larger up trend to 147.68 long term resistance. Break there will target 161.8% projection of 126.35 to 139.37 from 130.38 at 151.44 next.
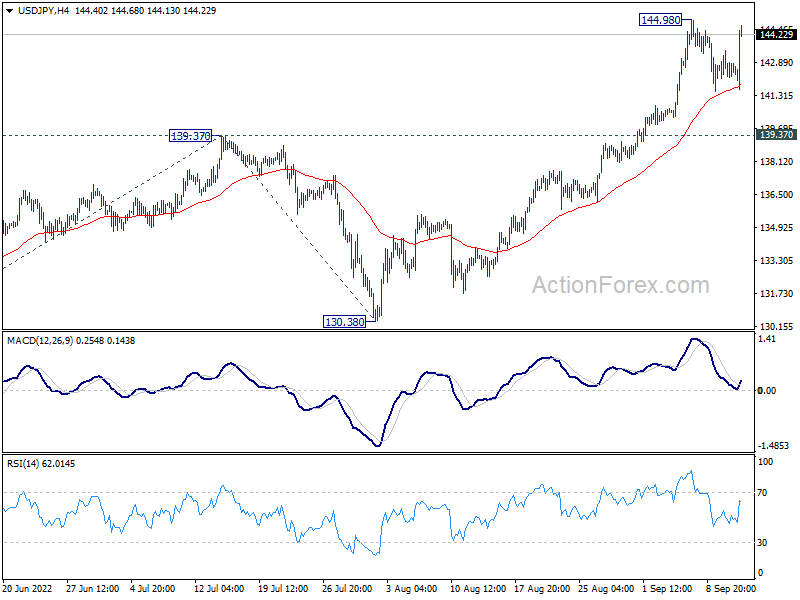
In the bigger picture, up trend from 101.18 is still in progress, as part of the whole up trend from 75.56 (2011 low). Further rise should be seen to 147.68 (1998 high). For now, break of 130.38 support is needed to be the first indication of medium term topping. Otherwise, outlook will stay bullish even in case of deep pull back.