

Sample Category Title
Sunset Market Commentary
Markets
Central bankers of late stressed that the pace of further tightening will be guided by incoming data. In this narrative, yesterday’s higher than expected US inflation challenged markets’ expectations (or was it simply hope?) that there is a case for the Fed to turn less aggressive on its anti-inflation campaign. If inflation stays higher for longer, the peak policy rate also remains subject to debate. Markets after the US CPI release pondered whether that peak Fed policy rate shouldn’t be 4.50% rather than 4.25%. Today’s news flow at least gave no reason to backtrack on yesterday’s repositioning. US yields are gaining an additional 4 (2-y)/2 (30-y) bps. At 3.80%, the 2-y yield set a new cycle top. US 10-y yield (3.45%) is coming ever closer to the 3.50% mid-June peak. The 10-y real yield stays just south of 1.0%. The repricing on European interest rate markets also continued unabatedly. EMU swap yields are gaining another 6.5 bps (2-y) to 2.0 bps (10-y). The 2-y intraday attacked the next key reference (2.49% 2011 top). European money markets gradually consider the idea that the terminal ECB rate for current cycle might be north of 2.5%. EC president Ursula Von der Leyen reconfirmed the EC’s intention to tax revenues of low cost power producers. The EC also tries to hammer out a mechanism to cap gas prices and intends to reduce demand. For now, interest rate markets apparently don’t see how this might help to cool down EMU inflation. UK yields are lagging the moves in the US and EMU. UK August inflation (headline 9.9%, core 6.3%) was as expected. Markets still try to find out the BoE’s reaction function as government measures capping firms’ and consumers’ energy bills will drastically slow inflation, admittedly at the expense of a huge fiscal effort. European equities cede about 1.0% (EuroStoxx 50), but stay away from the August low. US indices open little changed after yesterday free-fall.
Relative calm returned to FX markets after yesterday’s sharp USD rebound. The USD DXY index fails to regain the 110 handle (109.50). In a similar move, EUR/USD tries to recapture parity. Even so, yesterday’s setback suggests that any sustained EUR/USD rebound won’t be easy with US real yields supporting USD attractiveness. USD/JPY retreats from the 145 area as the BOJ checking FX rates was seen as a last warning before starting FX interventions to slow the yen’s free-fall. UK inflation didn’t change the picture for sterling trading. Monday’s rejected test of the key EUR/GBP 0.8721 level inspires some further return action back in previous trading range (currently 0.87665).
News Headlines
Swedish August inflation exceeded estimates. Headline CPI printed at 9.8% Y/Y (1.8% m/m), up from 8.5% and more than the 9.6% expected. Using a fixed interest rate (CPIF), inflation accelerated from 8% to 9%. CPIF excluding energy – the Riksbank’s preferred measure – was the only gauge that didn’t top expectations. Nevertheless it sped up from 6.6% to 6.8%. Intensifying price pressures have already upped the ante for the September Riksbank meeting (Sep 20). Anything less than a 75 bps hike would come as a disappointment. But as the ECB also raised the stakes, the Swedish krone barely profited from the upcoming interest rate support. EUR/SEK is trading near recent highs around 10.67.
Officials close to the matter said the European Commission plans to back recommendations to cut funding to PM Orban’s Hungary on Sunday. It’s the next step in a drawn out legal process over concerns about corruption and the rule of law. EU governments will then make a final decision within three months. It takes a qualified majority of the member states for the EC’s proposal to take effect. Right now, some €40bn in EU financing is blocked. The Hungarian government recently offered to set up an anti-graft agency and to push through changes to public procurement legislation. The EC is said to tell EU leaders to give Orban some time to make good on these pledges. The Hungarian forint greatly underperforms peers following the report. EUR/HUF surges 4 big figures to 403.80.
Belgium successfully launched its second green government bond via a bank syndicate today. The April-2039 dated bond carrying a 2.75% coupon attracted market interest of more than €32bn of which the Kingdom eventually raised €4.5bn. Price was set 6 bps above the conventional 1.9% June 2038 OLO.
Sterling Climbs as UK Inflation Eases
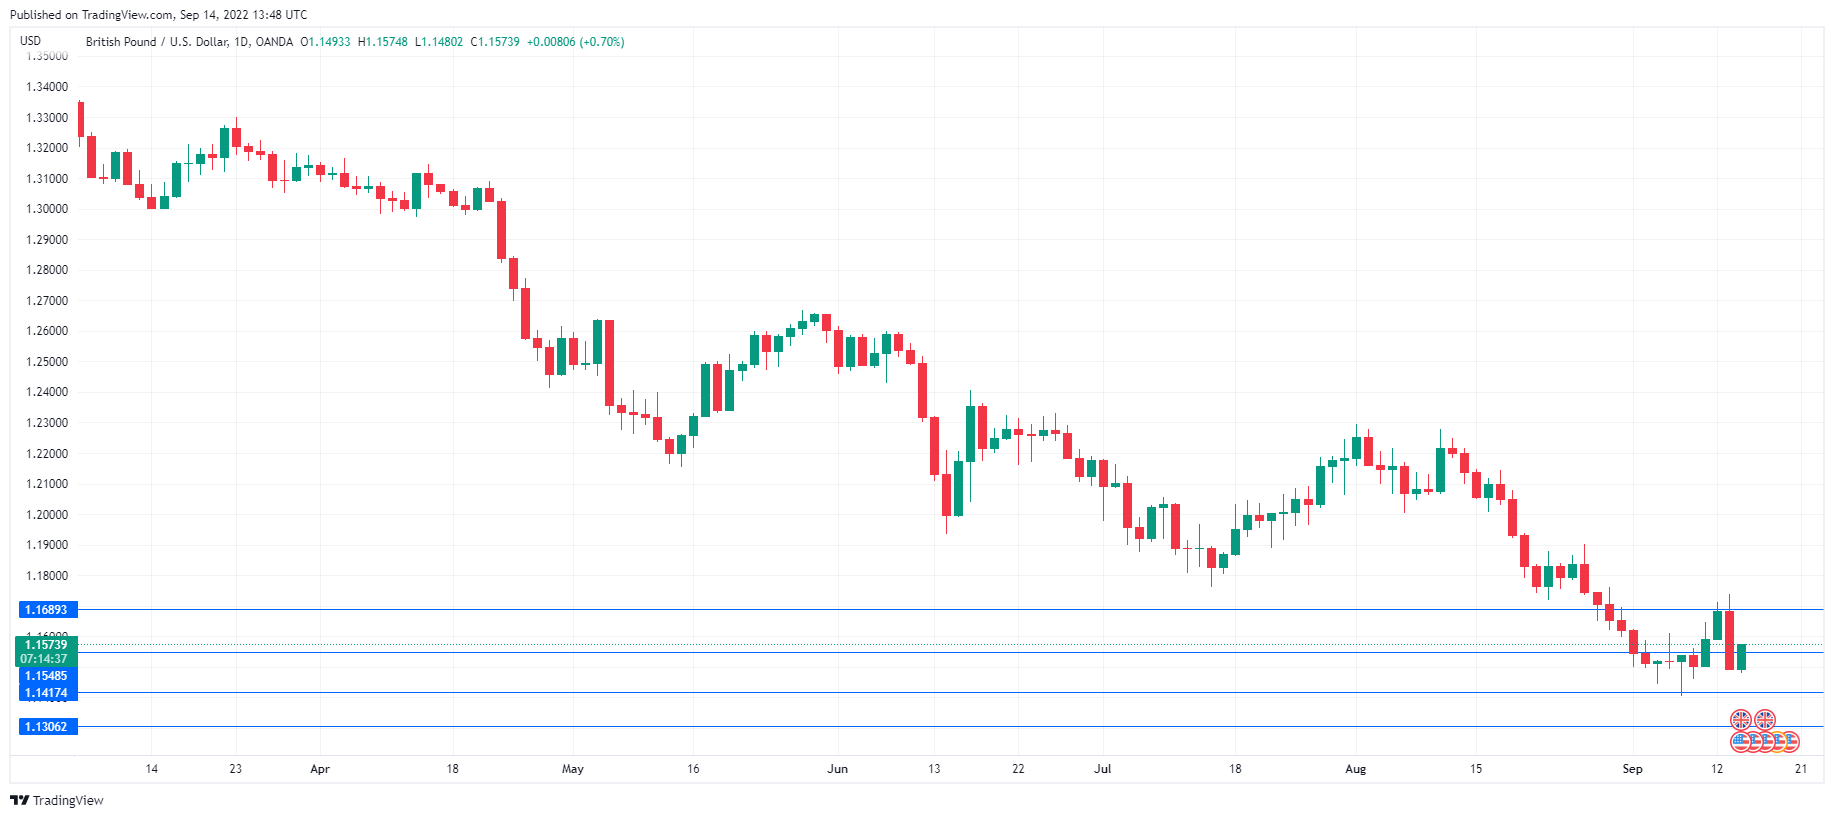
It has been a busy week for the British pound. GBP/USD has climbed 0.66% today and is trading at 1.1566. This follows the pound’s huge decline on Tuesday, as the US dollar pummelled the major currencies after a weaker-than-expected inflation report shocked the financial markets.
The US dollar, which has looked mediocre recently, received a welcome shot in the arm after the July inflation report. The dollar steamrolled most of the major after the inflation data, and GBP/USD declined by 1.62%. Investors were not pleased with the report, as equity markets slumped and the US dollar rose sharply. Headline inflation dropped from 8.5% to 8.3%, but missed the consensus of 8.1%. Core CPI rose to 6.3%, up from 5.9% and above the forecast of 6.1%.
The markets had priced in a 75bp increase in September followed by 50bp in November and 25bp in December. However, with inflation higher than expected, the Fed may need to remain more aggressive than expected. Market pricing for the September meeting is fluctuating – currently, there is a 68% chance of a 75bp move and a 32% likelihood of a massive 100bp increase. Just a few days ago, a “modest” 50bp hike was a strong possibility, but it is apparently off the table after the inflation report.
UK inflation dips below 10%
UK inflation eased slightly in August to 9.9%, down from the 40-year high of 10.1% in July and a notch lower than the 10.0% estimate. The drop in headline reading was due to a decline in fuel prices. Core inflation rose to 6.3%, up from 6.2% prior. Inflation remains very high and the markets are expecting the BoE to come out swinging with a 75bp increase at the September 22nd meeting, just a day after the Federal Reserve meets. The BoE has projected that inflation will not peak before hitting 13%, which means that the new Truss government has its work cut out as it grapples with the severe cost of living crisis in the UK.
GBP/USD Technical
- GBP/USD is testing resistance at 1.1548. Above, there is resistance at 1.1689
- There is support at 1.1417 and 1.1306
EUR/USD: Recovery Struggles at Parity Level
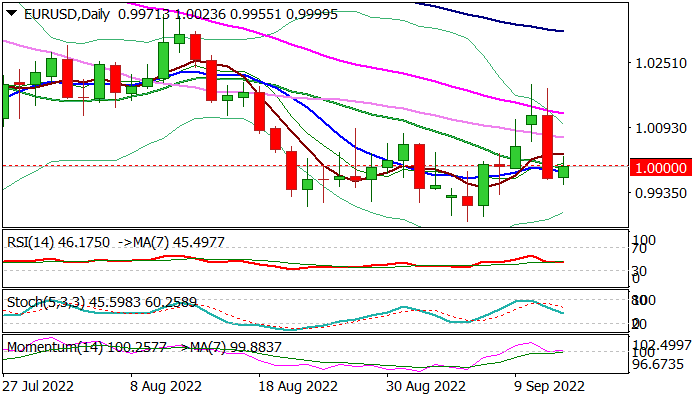
Recovery attempts after Tuesday’s 1.5% drop, cracked parity barrier (reinforced by 20DMA), but so far lack momentum for stronger recovery.
Headwinds from parity zone, accompanied with bearishly aligned daily studies, warn of recovery stall, which would be additionally signaled by repeated close below this level, as Tuesday’s long bearish daily candle weighs heavily.
On the other side, 14-d momentum is in positive territory and turning north, while near-term action is also underpinned by rising 4-hr cloud, but sustained break above parity is seen as minimum requirement to generate initial recovery signal, which would need confirmation on lift above 1.0031/47 (daily Tenkan-sen/Fibo 38.2% of 1.0197/0.9955 Mon-Wed drop).
Res: 1.0031; 1.0047 1.0076; 1.0105.
Sup: 0.9955; 0.9900; 0.9864; 0.9785.
USD/JPY Mid-Day Outlook
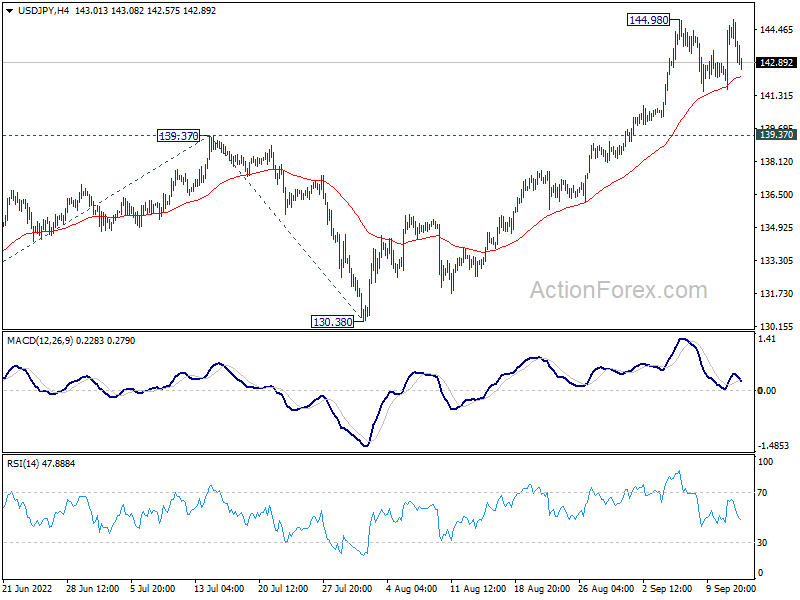
Daily Pivots: (S1) 142.59; (P) 143.63; (R1) 145.61; More...
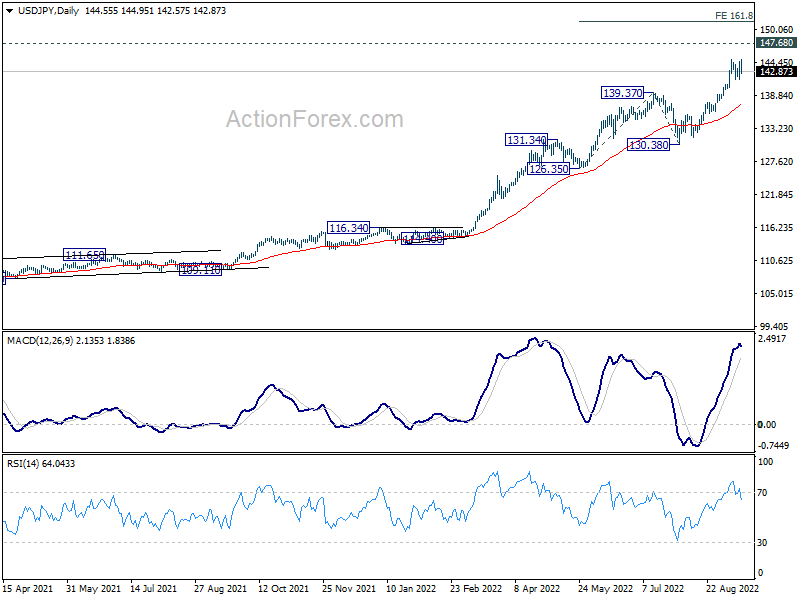
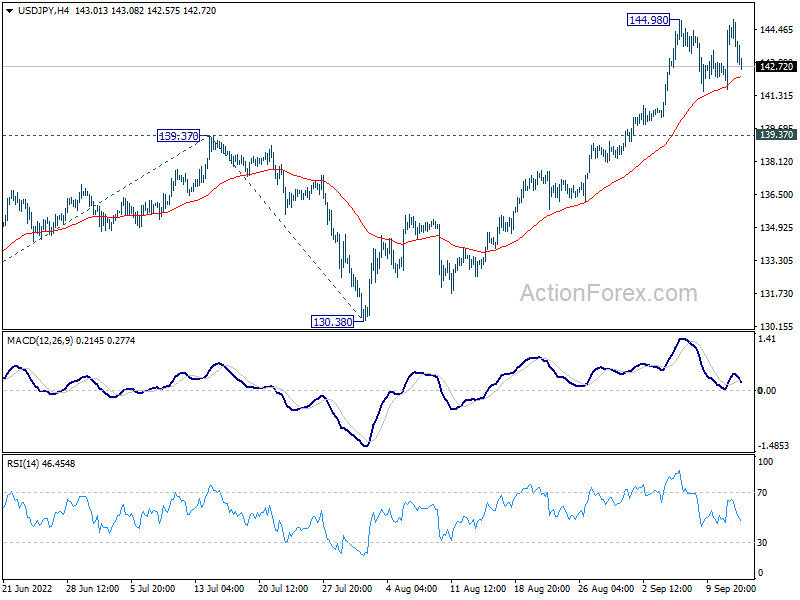
USD/JPY is staying in consolidation from 144.98 and intraday bias remains neutral. Downside should be contained by 139.37 resistance turned support. On the upside, break of 144.98 will resume larger up trend to 147.68 long term resistance. Break there will target 161.8% projection of 126.35 to 139.37 from 130.38 at 151.44 next.
In the bigger picture, up trend from 101.18 is still in progress, as part of the whole up trend from 75.56 (2011 low). Further rise should be seen to 147.68 (1998 high). For now, break of 130.38 support is needed to be the first indication of medium term topping. Otherwise, outlook will stay bullish even in case of deep pull back.
USD/CHF Mid-Day Outlook
Daily Pivots: (S1) 0.9522; (P) 0.9577; (R1) 0.9675; More...
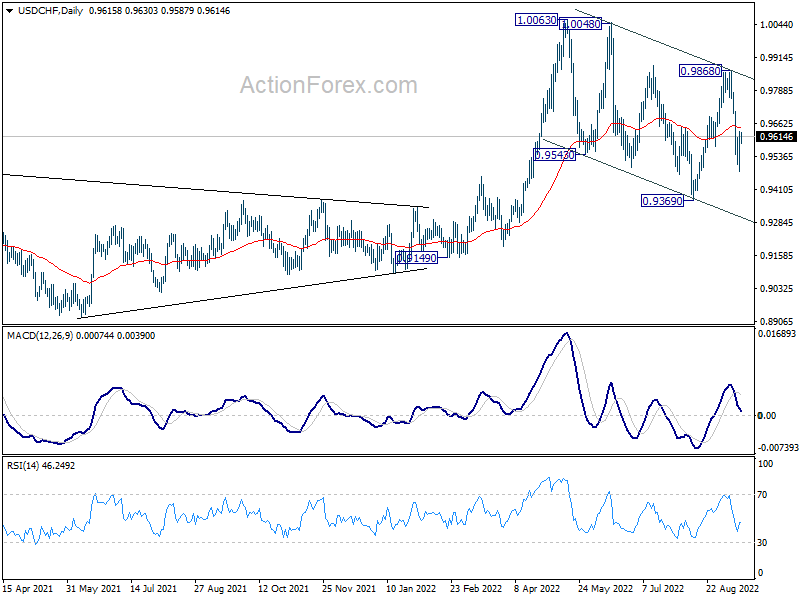
Intraday bias in USD/CHF stays neutral for the moment. The pair is still in corrective pattern from 1.0063. Below 0.9478 will extend the fall from 0.9868 towards 0.9369 support. On the upside, firm break of 4 hour 55 EMA (now at 0.9658) will target 0.9868 resistance first. Further break there will argue that larger up trend is ready to resume through 1.0063.
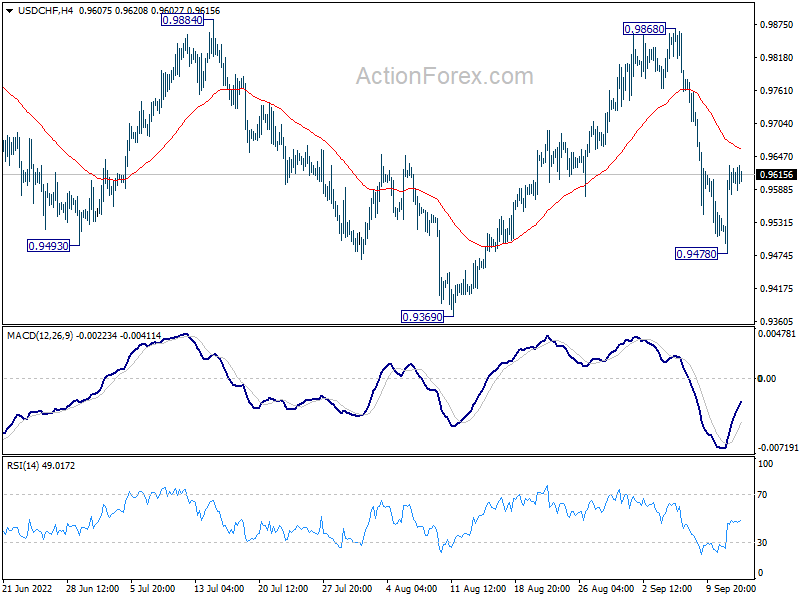
In the bigger picture, current development suggests that up trend from 0.8756 (2021 low) is still in progress. Sustained break of 1.0063 will target 100% projection of 0.9149 to 1.0063 from 0.9369 at 1.0283, and then 1.0342 (2016 high). For now, this will remain the favored case as long as 0.9369 support holds, even in case of deep pull back.
EUR/USD Mid-Day Outlook
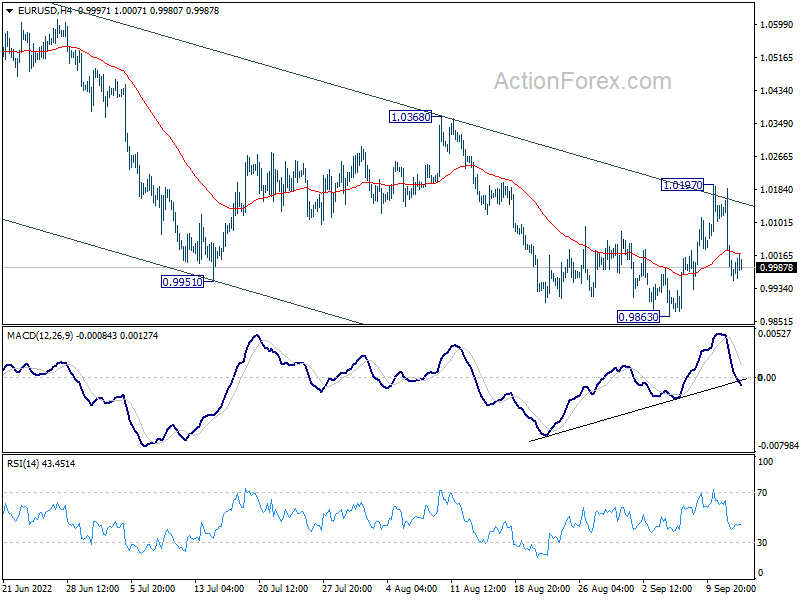
Daily Pivots: (S1) 0.9894; (P) 1.0040; (R1) 1.0114; More...
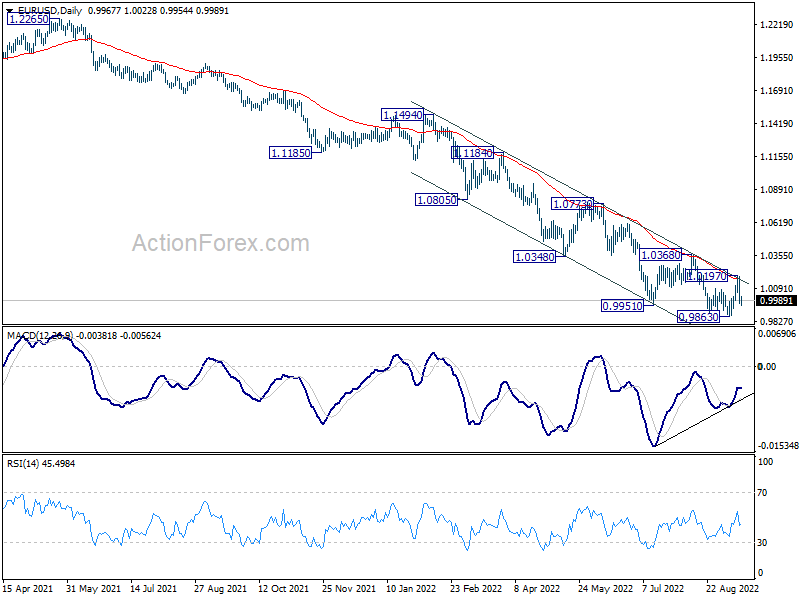
Intraday bias in EUR/USD stays mildly on the downside for retesting 0.9863 low first. . Firm break there will resume larger down trend. On the upside, sustained trading above 55 day EMA (now at 1.0154) raise the chance of larger trend reversal, and target 1.0368 resistance.
In the bigger picture, down trend from 1.6039 (2008 high) is still in progress. Next target is 100% projection of 1.3993 to 1.0339 from 1.2348 at 0.8694. In any case, outlook will stay bearish as long as 1.0368 resistance holds, in case of strong rebound. However, firm break of 1.0368 will confirm medium term bottom at 0.9863 already.
GBP/USD Mid-Day Outlook
Daily Pivots: (S1) 1.1411; (P) 1.1574; (R1) 1.1657; More...
GBP/USD recovered well ahead of 1.1404/9 support zone and intraday bias is turned neutral first. On the downside, decisive break of 1.1404/9 will resume larger down trend. Next target is 61.8% projection of 1.3748 to 1.1759 from 1.2292 at 1.1063. On the upside, above 1.1737 minor resistance will resume the rebound from 1.1404 to 55 day EMA (now at 1.1917).
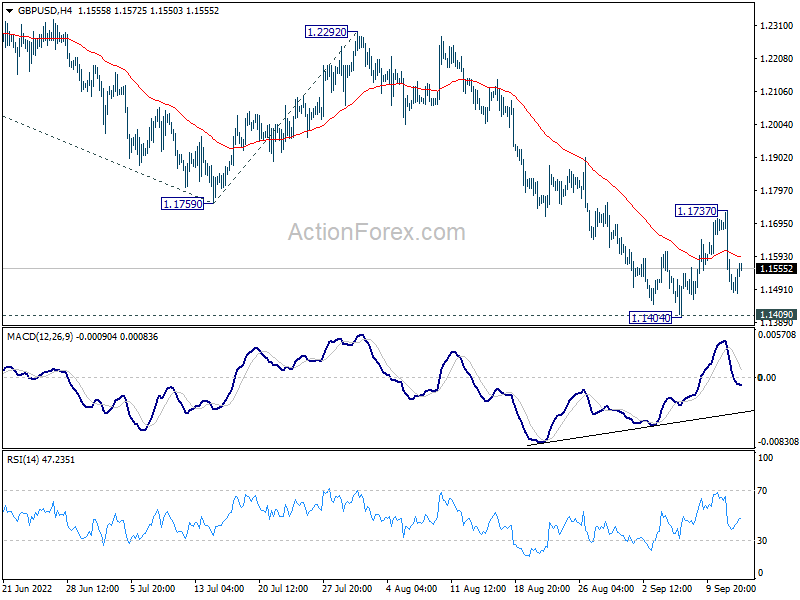
In the bigger picture, based on current momentum, fall from 1.4248 (2018 high) is probably resuming long term down trend from 2.1161 (2007 high). Sustained break of 1.1409 will target 61.8% projection of 1.7190 (2014 high) to 1.1409 (2020 low) from 1.4248 (2021 high) at 1.0675. This will remain the favored case for now as long as 1.2292 resistance holds.
Yen Extending Rebound on Intervention Threat, Dollar Turned Mixed
Yen is shrugging off rally in US and European benchmark yields today, and rebound on threat of intervention in Japan. European majors are also finding some foots while Dollar turned mixed. Still commodity currencies are under broad based selling pressure. While US futures might point to a flat open, selling could come back later in the session. Overall, for the week, Dollar is so far the strongest, followed by Swiss Franc and Yen, and Kiwi is worst followed by Aussie and then Loonie.
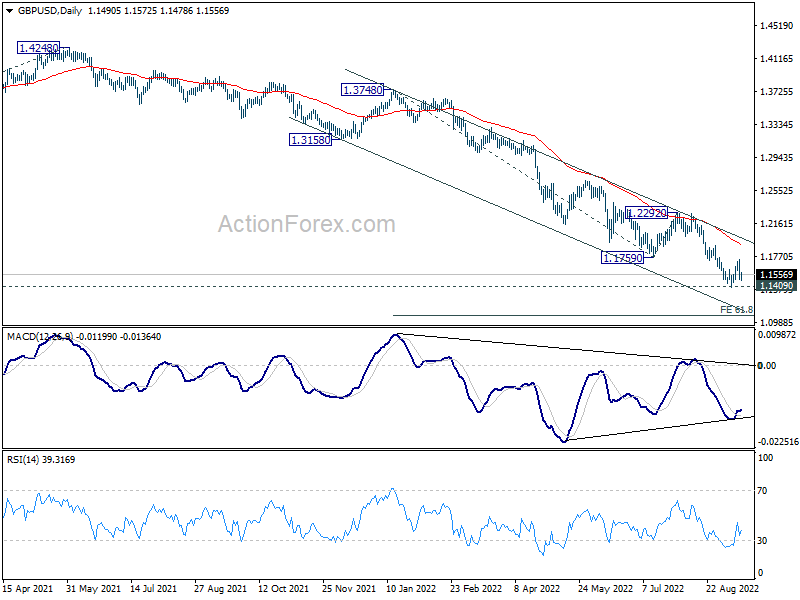
Technically, a focus now is on how far Yen's rebound could go. As long as 139.37 resistance turned support in USD/JPY holds, it's too early to call for bearish reversal. The pair is still more likely to resume recent up trend then not. Such development would also provide a floor to the selloff in other Yen crosses.
In Europe, at the time of writing, FTSE is down -1.29%. DAX is down -1.1%. CAC is down -0.58%. Germany 10-year yield is up 0.012 at 1.744. Earlier in Asia, Nikkei dropped -2.78%. Hong Kong HSI dropped -2.48%. China Shanghai SSE dropped -0.37%. Singapore Strait Times dropped -0.97%. Japan 10-year JGB yield rose 0.0128 to 0.258.
US PPI down -0.1% mom, up 8.9% yoy in Aug
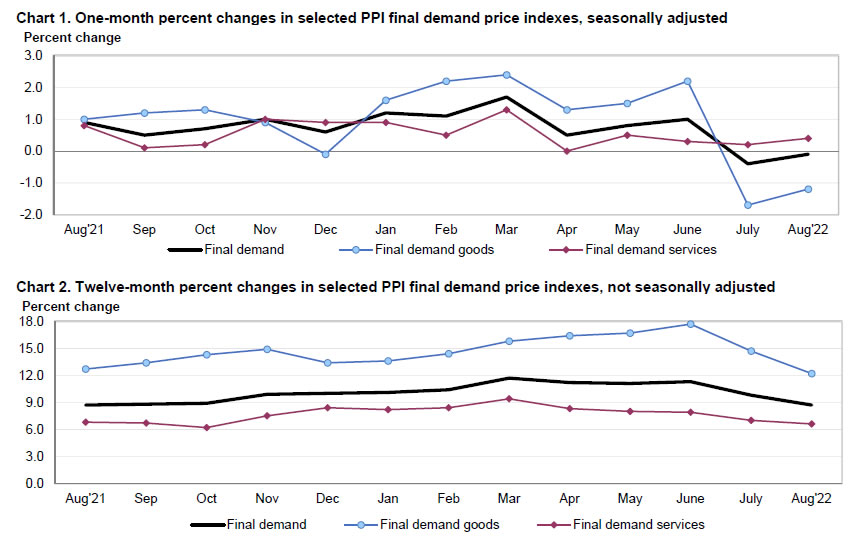
US PPI for final demand dropped -0.1% mom in August, matched expectations. The decreased is attributable to a -1.2% mom decline in prices for goods, while prices for services rose 0.4% mom. For the 12 months ended in August, PPI slowed from 9.8% yoy to 8.7% yoy, below expectation of 8.9% yoy. PPI for final demand less foods, energy and trade services rose 0.2% mom, 5.6% yoy.
From Canada, manufacturing sales dropped -0.9% mom in July, versus expectation of -1.0% yoy.
Eurozone industrial production dropped -2.3% mom in Jul, EU down -1.6% mom
Eurozone industrial production dropped -2.3% mom in July, much worse than expectation of -0.8% mom. Production of capital goods fell by -4.2%, durable consumer goods by -1.6% and intermediate goods by -0.8%, while production of energy rose by 0.4% and non-durable consumer goods by 1.2%.
EU industrial production declined -1.6% mom. Among Member States for which data are available, the largest monthly decreases were registered in Ireland (-18.9%), Estonia (-7.4%) and Austria (-3.2%). The highest increases were observed in Lithuania (+6.5%), Sweden (+5.8%) and Malta (+4.2%).
UK CPI slowed to 9.9% yoy in Aug, core CPI ticked up to 6.3% yoy
UK CPI slowed from 10.1% yoy to 9.9% yoy in August, below expectation of 10.2% yoy. CPI core rose from 6.2% yoy to 6.3% yoy, matched expectations. The largest contributions to the annual rate in August are from housing and household services, transport, and food and non-alcoholic beverages. July's figure was the highest since 1982 based on indicative model.
On monthly basis, CPI rose 0.5% mom, slowed from prior 0.6% mom. Food and non-alcoholic beverages made the largest upward contribution to the monthly rates, while falling prices for motor fuels resulted in a large offsetting downward contribution.
Also released, RPI came in at 0.6% mom, 12.3% yoy, below expectation of 0.7% mom, 12.4% yoy. PPI input was at -1.2% mom, 20.5% yoy, versus expectation of 1.2% mom, 21.0% yoy. PPI output was at -0.1% mom, 116.1% yoy, versus expectation of 1.6% mom, 17.8% yoy. PPI core output was at 0.3% mom, 13.7% yoy, versus expectation of 1.5% yoy.
Japan officials toughen up talks on Yen
Top Japanese officials toughened up the talks on Yen, as it tumbled notably again overnight following US CPI data. Finance Minister Shunichi Suzuki said Japan wouldn't rule out any response if current trends in the foreign exchange market continued, with intervention as an option.
The comment was echoed by top current diplomat Masato Kanda, who reiterated, "we are monitoring yen moves with a sense of urgency. We will respond appropriately to currency moves without ruling out any options."
Chief Cabinet Secretary Hirokazu Matsuno also said at a briefing that the government would take necessary action should excessive yen moves continue. He added that rapid currency moves were undesirable.
GBP/USD Mid-Day Outlook
Daily Pivots: (S1) 1.1411; (P) 1.1574; (R1) 1.1657; More...
GBP/USD recovered well ahead of 1.1404/9 support zone and intraday bias is turned neutral first. On the downside, decisive break of 1.1404/9 will resume larger down trend. Next target is 61.8% projection of 1.3748 to 1.1759 from 1.2292 at 1.1063. On the upside, above 1.1737 minor resistance will resume the rebound from 1.1404 to 55 day EMA (now at 1.1917).
In the bigger picture, based on current momentum, fall from 1.4248 (2018 high) is probably resuming long term down trend from 2.1161 (2007 high). Sustained break of 1.1409 will target 61.8% projection of 1.7190 (2014 high) to 1.1409 (2020 low) from 1.4248 (2021 high) at 1.0675. This will remain the favored case for now as long as 1.2292 resistance holds.
Economic Indicators Update
| GMT | Ccy | Events | Actual | Forecast | Previous | Revised |
|---|---|---|---|---|---|---|
| 22:45 | NZD | Current Account (NZD) Q2 | -5.22B | -4.70B | -6.14B | -6.50B |
| 23:50 | JPY | Machinery Orders M/M Jul | 5.30% | -0.60% | 0.90% | |
| 04:30 | JPY | Industrial Production M/M Jul F | 0.80% | 1.00% | 1.00% | |
| 06:00 | GBP | CPI M/M Aug | 0.50% | 0.60% | 0.60% | |
| 06:00 | GBP | CPI Y/Y Aug | 9.90% | 10.20% | 10.10% | |
| 06:00 | GBP | Core CPI Y/Y Aug | 6.30% | 6.30% | 6.20% | |
| 06:00 | GBP | RPI M/M Aug | 0.60% | 0.70% | 0.90% | |
| 06:00 | GBP | RPI Y/Y Aug | 12.30% | 12.40% | 12.30% | |
| 06:00 | GBP | PPI Input M/M Aug | -1.20% | 1.20% | 0.10% | 0.00% |
| 06:00 | GBP | PPI Input Y/Y Aug | 20.50% | 21.00% | 22.60% | |
| 06:00 | GBP | PPI Output M/M Aug | -0.10% | 1.60% | 1.60% | 1.60% |
| 06:00 | GBP | PPI Output Y/Y Aug | 16.10% | 17.80% | 17.10% | |
| 06:00 | GBP | PPI Core Output M/M Aug | 0.30% | 1.50% | 1.00% | 0.80% |
| 06:00 | GBP | PPI Core Output Y/Y Aug | 13.70% | 13.90% | 14.60% | 14.40% |
| 09:00 | EUR | Eurozone Industrial Production M/M Jul | -2.30% | -0.80% | 0.70% | 1.10% |
| 12:30 | USD | PPI M/M Aug | -0.10% | -0.10% | -0.50% | -0.40% |
| 12:30 | USD | PPI Y/Y Aug | 8.70% | 8.90% | 9.80% | |
| 12:30 | USD | PPI Core M/M Aug | 0.40% | 0.30% | 0.20% | 0.30% |
| 12:30 | USD | PPI Core Y/Y Aug | 7.30% | 7.40% | 7.60% | 7.70% |
| 12:30 | CAD | Manufacturing Sales M/M Jul | -0.90% | -1.00% | -0.80% | -0.10% |
| 14:30 | USD | Crude Oil Inventories | 1.9M | 8.8M |
US PPI down -0.1% mom, up 8.9% yoy in Aug
US PPI for final demand dropped -0.1% mom in August, matched expectations. The decreased is attributable to a -1.2% mom decline in prices for goods, while prices for services rose 0.4% mom. For the 12 months ended in August, PPI slowed from 9.8% yoy to 8.7% yoy, below expectation of 8.9% yoy.
PPI for final demand less foods, energy and trade services rose 0.2% mom, 5.6% yoy.
September Flashlight for the FOMC Blackout Period
Summary
Another super-sized 75 bps rate hike at next week's FOMC meetings seems all but assured. Employment growth has been robust over the past two months, averaging 421K new jobs in July and August. Headline inflation has been relatively tame over the same period, but falling gasoline prices have accounted for the bulk of the weakness. Excluding food and energy, core inflation has remained far too high for the Fed's liking. Over the past three months, core inflation has risen at a 6.5% annualized rate, more than triple the central bank's 2% target.
Next week's meeting will also include an update to the FOMC's Summary of Economic Projections (SEP). We expect the 2022 median projection for the federal funds rate to be 3.875%, up from 3.375% in the June SEP. We think the 2023 median dot probably will be above the 2022 dot, but only modestly so. Despite the hawkish rhetoric, few Fed officials have publicly advocated for a peak federal funds rate that is well above 4%. Our expectation is that the median projection for the 2023 fed funds rate will be 4.175%. For 2024 and 2025, we think the dots will show a steady easing of policy as inflation moves back to 2%. We expect the changes to the SEP inflation projections will be relatively modest, but weaker GDP growth and higher unemployment projections for 2023 seem likely in our view.
At some point, Chair Powell and his FOMC colleagues will feel confident enough that they can slow the pace of monetary policy tightening. With the federal funds rate soon to be above 3% for the first time in 15 years and with QT running at full speed, monetary policy is rapidly moving towards restrictive territory. That said, we do not think the FOMC is ready to slow the pace of tightening yet, let alone reverse course. Chair Powell's speech at Jackson Hole made clear that the Federal Reserve views its fight against inflation as far from finished. We expect a similar message to come through in the post-meeting press conference next week.
The FOMC to Keep Rolling with Another 75 Bps Hike in September
Unrelenting inflation along with a boiling hot jobs market led the FOMC to deliver its second-straight 75 bps rate hike at its most recent meeting in late July. The decision for another jumbo move—the likes of which prior to June had not been seen since 1994—came despite signs of economic activity beginning to soften. With 225 bps of tightening delivered over just four meetings and indications that spending and investment are wobbling, Chair Powell noted in July's post-meeting press conference that at some point it will become appropriate to slow the pace of rate increases. Deciding when exactly to ease up on the brakes, however, depends on incoming data. Not only does the FOMC want to assess the cumulative affects of tightening to date, but, in our view, it wants to move away from meeting-specific guidance given the fast pace at which the inflation and broader economic backdrop continue to evolve.
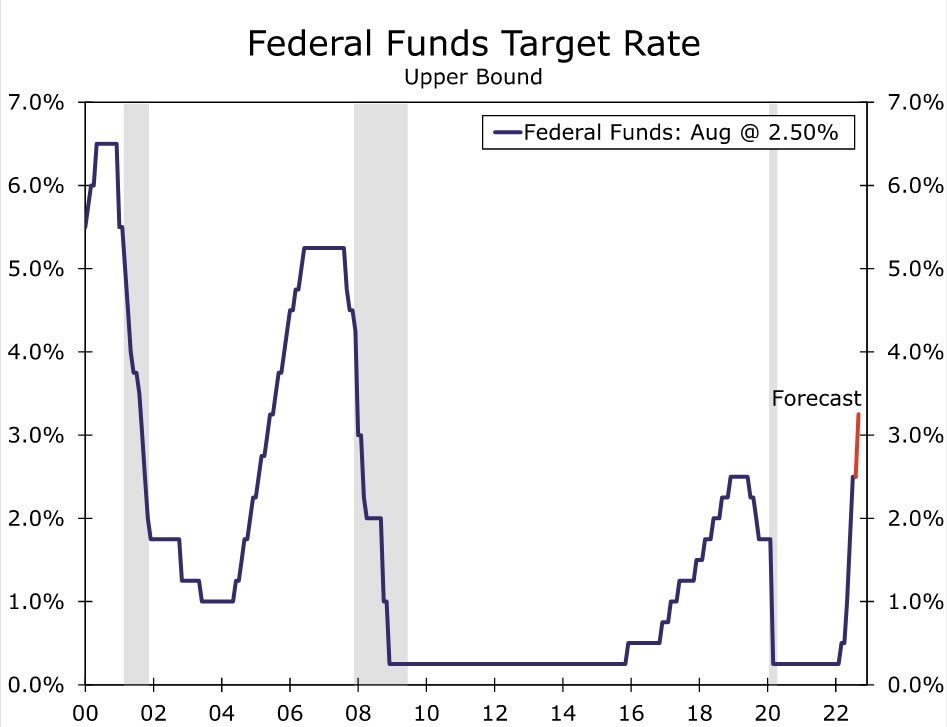
While FOMC officials have been playing their next move closer to the chest, the time to start slowing rate increases does not appear to be in hand just yet. We expect the FOMC to raise the fed funds rate by another 75 bps in September, bringing the target range to 3.00-3.25%. If realized, this move would put the federal funds rate at its highest level in 15 years (Figure 1). Consumer spending remains under pressure from inflation but thus far has not buckled. Similarly, industrial activity has shown signs of stabilizing relative to a couple of months ago when growth in industrial production essentially stalled.
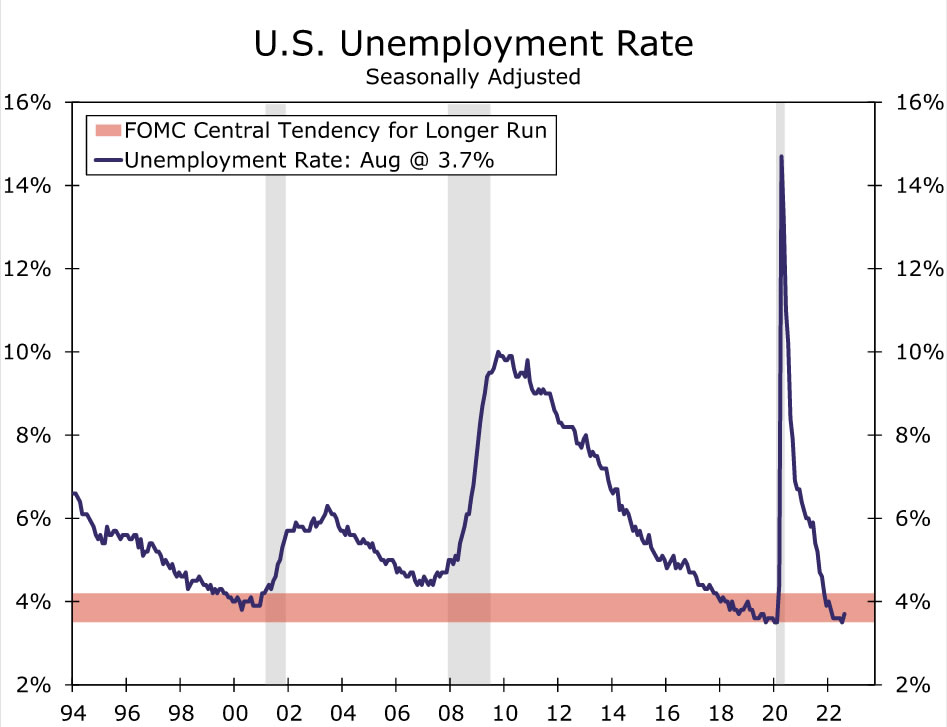
More importantly for the FOMC, the labor market remains exceptionally strong. Employment growth cooled slightly over the inter-meeting period, but the labor market is still incredibly tight. Hiring in August followed up July's blockbuster print with a gain of 315K jobs, robust in its own right. The unemployment rate moved up to 3.7%, but the increase was due to an encouraging rise in labor force participation rather than an increase in layoffs. At just 3.7%, the unemployment rate remains near the low end of what Fed officials agree is sustainable over the long run (Figure 2). Job openings, hiring plans and businesses reporting at least one job hard to fill have softened since the Fed's past meeting, but only minimally. All told, tightness in the labor market eased only incrementally since the previous FOMC meeting.
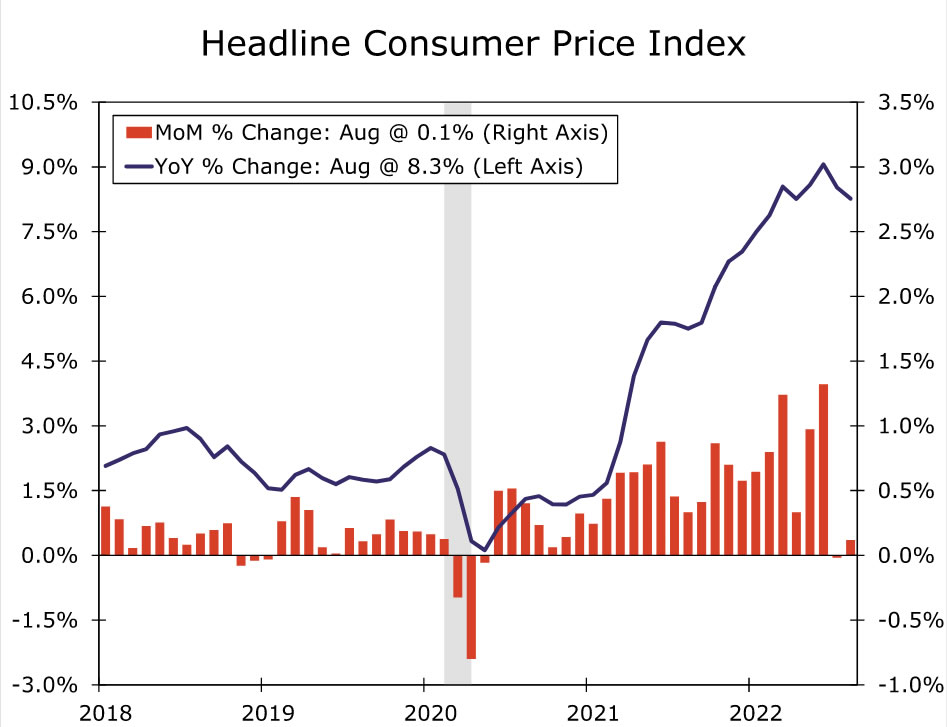
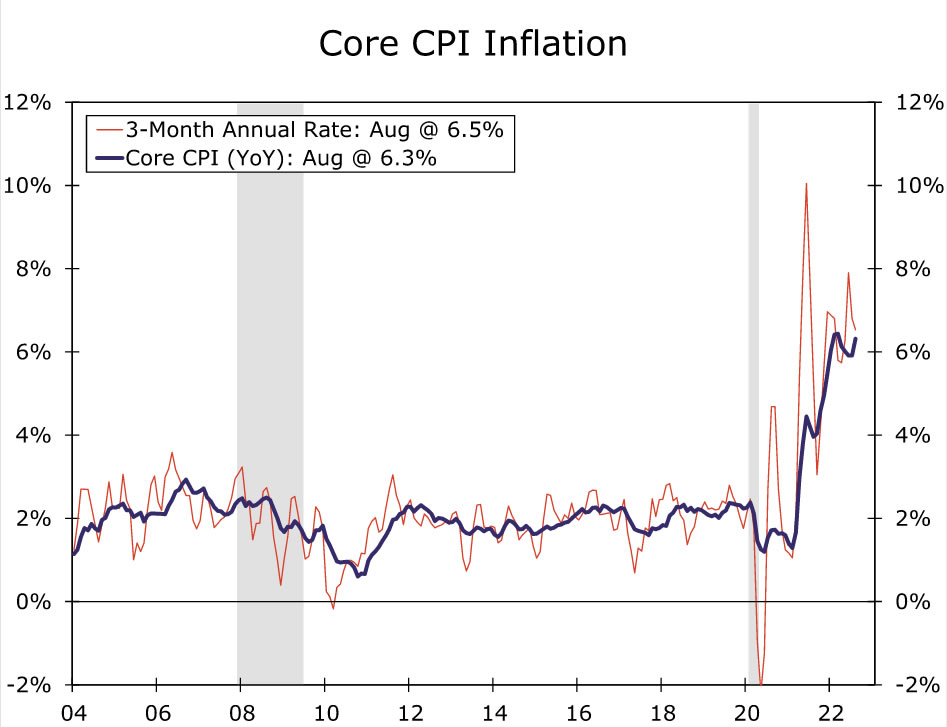
Headline inflation has been relatively benign over the past two months. The overall CPI was flat in July relative to the previous month and increased just 0.1% in August (Figure 3) Chair Powell has stated that he would like to see "compelling evidence that inflation is moving down," and the two past two CPI prints would seem to offer some preliminary evidence. But, with a drop in gasoline prices driving much of the recent softness, a sustained return to 2% inflation remains far from assured. Core inflation has not eased nearly as much as headline inflation and is still advancing well-ahead of the Fed target. The August CPI report showed core inflation registered a 6.5% annualized pace over the past three months (Figure 4).
While some recent slowing in price growth is a step in the right direction, it comes at a time when FOMC members sound more resolute in their efforts to return inflation to 2% for the long haul. In a pointed speech at the Kansas City Fed's annual symposium at Jackson Hole, Chair Powell made clear that the FOMC is laser-focused on restoring price stability. Chair Powell and other members appear wary of easing up prematurely, citing historical comparisons to the 1970s and coalescing around the view that policy will need to be restrictive for some time. The steady string of tough talk on inflation continued even after the August jobs report showed slight cooling in the labor market and estimates rolled in that consumer price growth was tame in August. Financial market participants have taken notice: at present, the market is fully priced for a 75 bps rate hike at the September FOMC meeting.
September's increase in the fed funds rate will be complimented by the reduction in the Fed's balance sheet hitting its full stride. Starting this month, up to $60 billion each month of maturing Treasury securities will roll off the balance sheet, a doubling from the June-August pace of $30 billion per month. The cap on mortgage-backed securities paydowns also has doubled to $35 billion per month, although by our estimates paydowns are expected to run well below this cap for the foreseeable future since mortgage demand has slowed to trickle in recent months amid higher rates.1
Smaller Yet Meaningful Changes Likely Coming in the New SEP
The FOMC updates its Summary of Economic Projections (SEP) four times a year: March, June, September and December. The past few updates have contained sizable revisions to the outlook for economic growth, inflation and the federal funds rate amid a rapidly evolving economic landscape. Next week's update will once again include some revisions, but we expect them to be more modest than the ones that occurred in March and June.
In our view, the biggest changes to the FOMC's projections for the federal funds rate (i.e. the dot plot) will be for 2022. In June, the median participant projection for the 2022 year-end fed funds rate was 3.375% (Figure 5). If the FOMC hikes by 75bps next week as we expect, that would put the midpoint of the fed funds target range at 3.125% with two meetings still to go this year. We think the 2022 median dot will move up to 3.875% to reflect a more aggressive path of tightening.
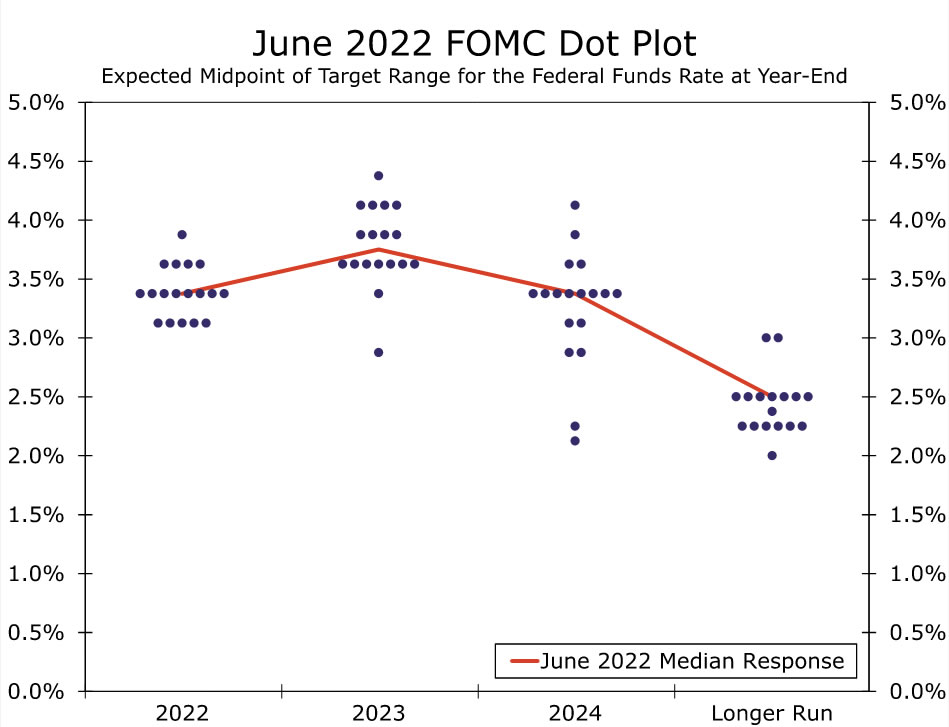
As discussed earlier, Fed officials have made clear in their public comments that monetary policy easing remains a long way off. Thus, from a signaling standpoint, we think the 2023 median dot probably will be above the 2022 dot, but only modestly so. Despite the hawkish rhetoric, few Fed officials have publicly advocated for a peak federal funds rate that is well above 4%. Our expectation is that the median projection for the 2023 fed funds rate will be 4.125%. For 2024 and 2025, we think the dots will show a steady easing of policy as inflation moves back to 2% and the Committee responds accordingly by gradually moving the fed funds rate back towards its longer-run level of 2.5%.
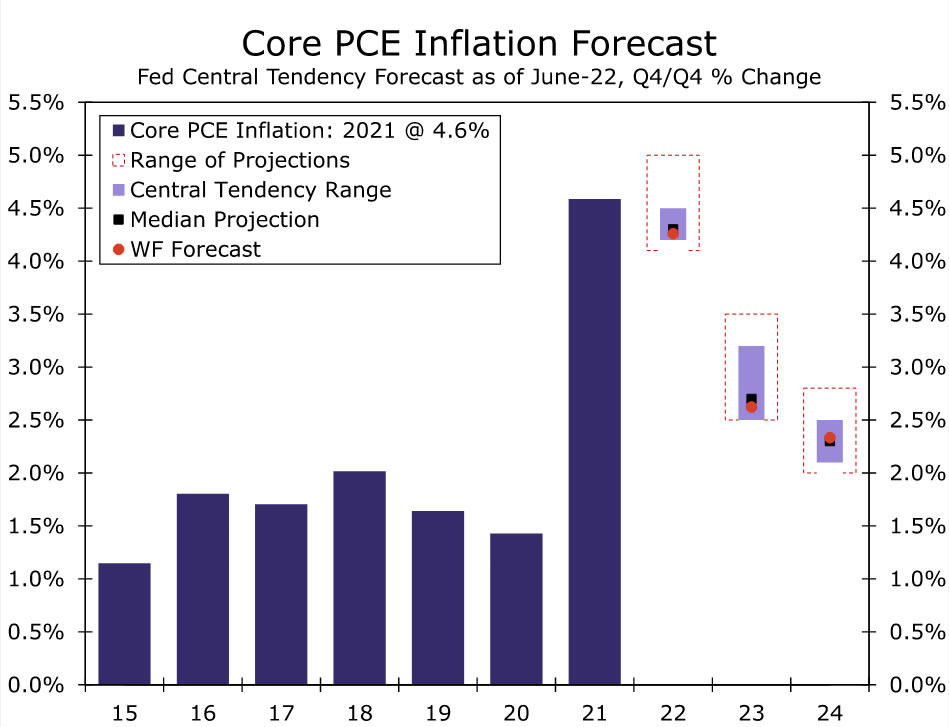
In the June SEP, the median FOMC participant looked for PCE inflation to be 5.2% in 2022 and 2.6% in 2023. Our most recent forecast, published on September 9, is roughly in line with these projections. We look for inflation as measured by the PCE deflator to be 5.1% and 2.3% in 2022 and 2023, respectively. Similarly, the median FOMC projection in the June SEP for the core PCE deflator was 4.3% in 2022 and 2.7% in 2023, and our latest forecast looks for a comparable 4.3% in 2022 and 2.6% in 2023 (Figure 6). Tweaks may be coming, but we do not expect sweeping changes to the inflation outlook in the updated September SEP.
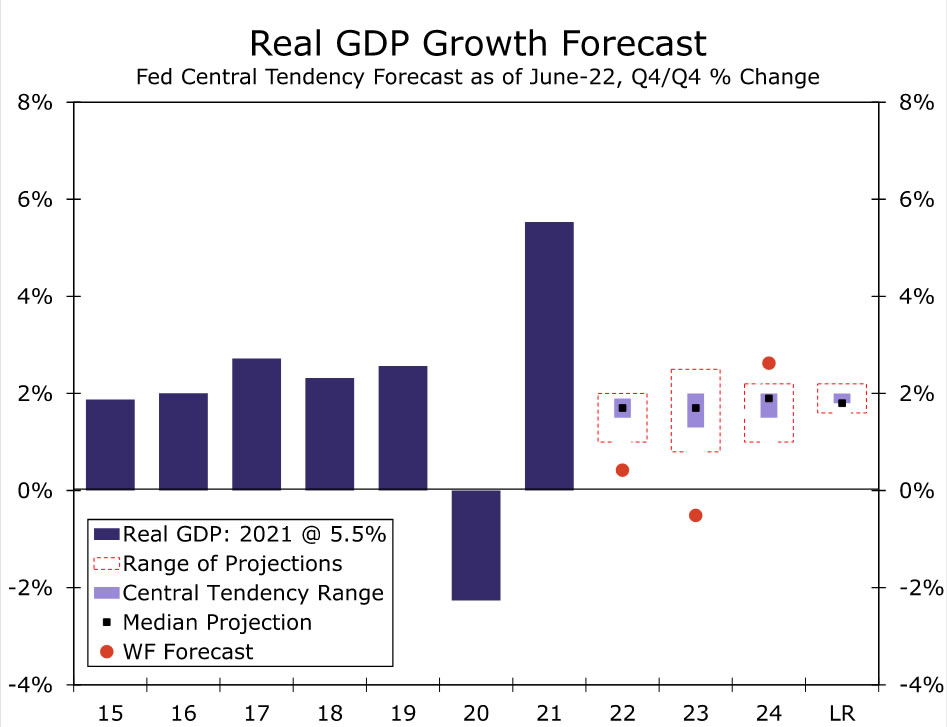
The FOMC's projections for economic growth in 2022 likely will come down, reflecting the two consecutive quarters of negative real GDP registered in the first half of this year. Our own estimate is for GDP to register just a 0.4% year-over-year rise in Q4, well below the 1.7% median estimate in the June SEP (Figure 7). The 2023 estimates for GDP growth and unemployment should be more telling of how bumpy the FOMC sees the road to bringing down inflation. In June, the median 2023 estimate for GDP growth (1.7%) was only a hair below the Committee's estimate for the economy's long run trend growth rate (1.8%).
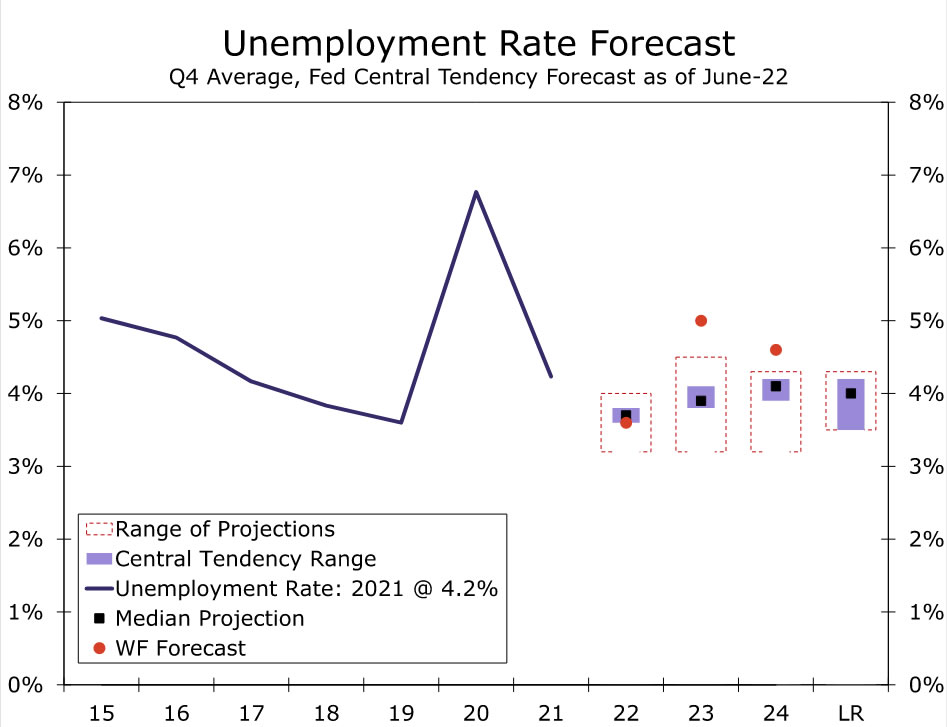
We would not be surprised to see the 2023 growth projection decline further as the FOMC signals a more restrictive stance of policy will be needed to bring down inflation. Similarly, we expect the median estimate for the unemployment rate at the end of 2023 to move up (Figure 8). While we do not believe the SEP will signal that a recession is likely to ensue from the prolonged stance of more restrictive policy, as our own forecast suggests, we expect it paint a more realistic portrait in that restoring price stability will impart a meaningful hit to economic growth and the jobs market.
It remains to be seen whether next week will mark the final 75 bps rate hike of the tightening cycle. For essentially the entire year, the FOMC has been increasingly hawkish at each successive Committee meeting in response to alarmingly fast inflation. July's downside miss on inflation was promptly offset by an upside miss in the August CPI report, putting pressure back on the FOMC to remain diligently hawkish at next week's meeting. But with the federal funds rate poised to be above 3% after next week's meeting and QT running at full speed, Fed officials may finally start to feel that the pace of tightening can moderate in Q4 and beyond. That said, there is a big difference between slowing the pace of tightening and a full-blown policy pivot. Chair Powell's speech at Jackson Hole made clear that the Federal Reserve views its fight against inflation as far from finished. We expect a similar message to come through in the post-meeting press conference next week.