Sample Category Title
GBP/JPY Daily Outlook
Daily Pivots: (S1) 164.49; (P) 165.50; (R1) 166.25; More...
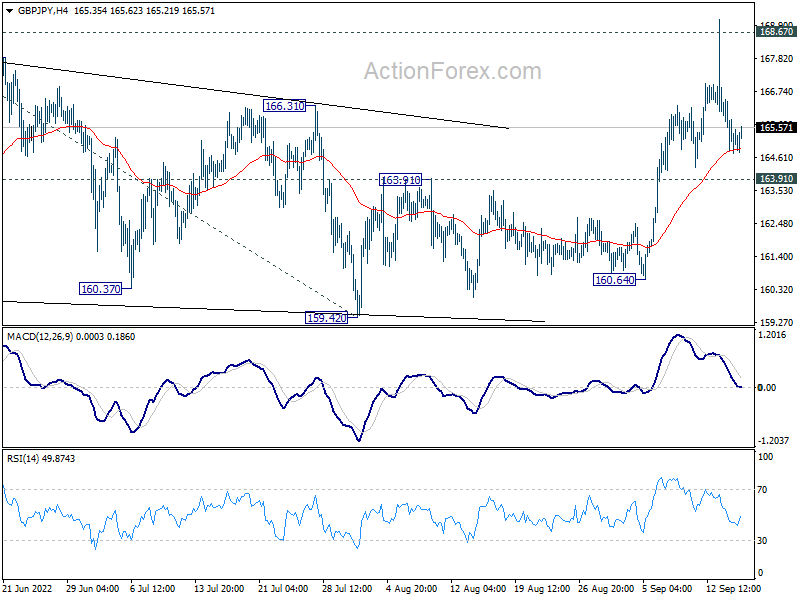
Intraday bias in GBP/JPY stays neutral for the moment. On the upside, decisive break of 168.67 high will resume larger up trend. Next target is 100% projection of 155.57 to 168.67 from 159.42 at 172.42. On the downside, break of 163.91 resistance turned support will turn bias back to the downside to extend the corrective pattern from 168.67.
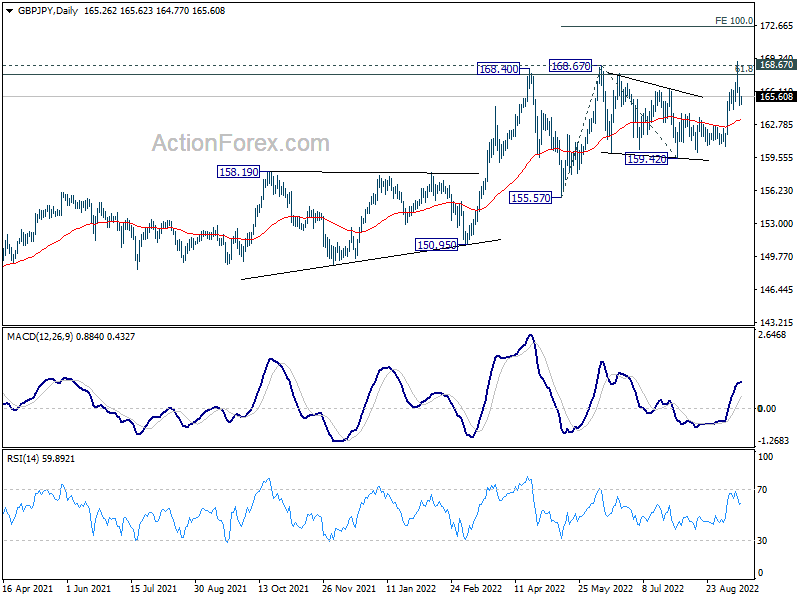
In the bigger picture, up trend from 123.94 (2020 low) is still in progress. Sustained break of 61.8% retracement of 195.86 (2015 high) to 122.75 (2016 low) at 167.93 will be a long term bullish signal, and could pave the way back to 195.86 high. This will remain the favored case as long as 155.57 support holds, even in case of deep pull back.
EUR/JPY Daily Outlook
Daily Pivots: (S1) 141.95; (P) 143.21; (R1) 144.13; More....
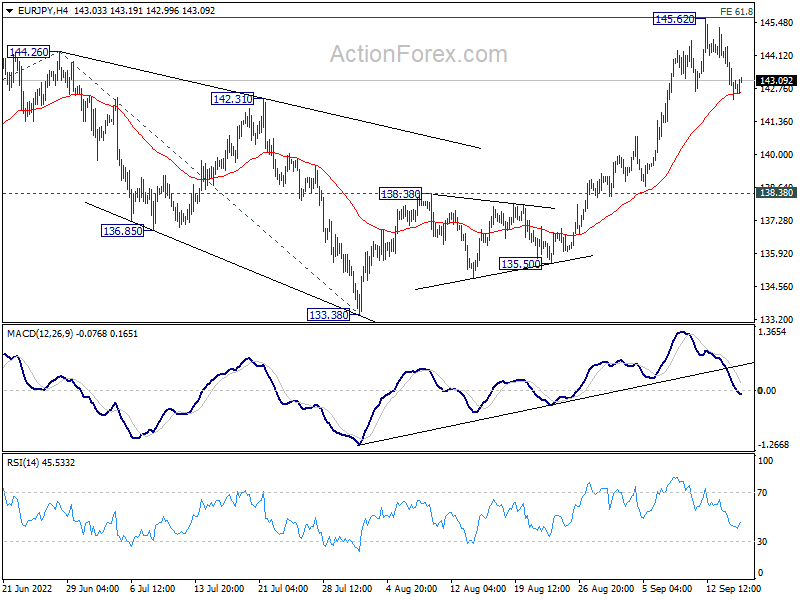
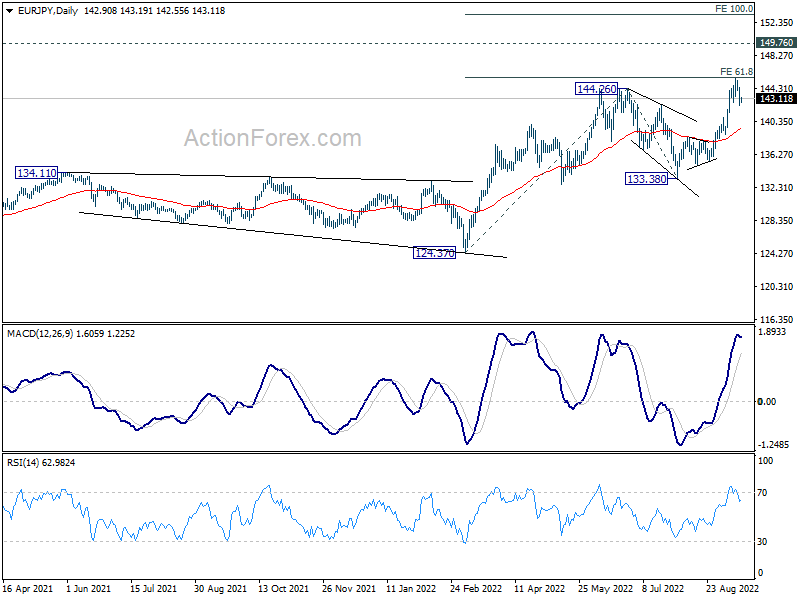
EUR/JPY is staying in consolidation from 145.62 and intraday bias remains neutral first. Deeper pull back cannot be ruled out. But downside should be contained above 138.38 resistance turned support bring another rally. On the upside, decisive break of 61.8% projection of 124.37 to 144.26 from 133.38 at 145.67 will pave the way to 149.76 long term resistance, and then 100% projection at 153.27.
In the bigger picture, up trend from 114.42 (2020 low) is seen as the third leg of the pattern from 109.30 (2016 low). Next target is 149.76 (2015 high). For now, outlook will remain bullish as long as 133.38 support holds, even in case of deep pull back.
EUR/GBP Daily Outlook
Daily Pivots: (S1) 0.8621; (P) 0.8652; (R1) 0.8679; More...
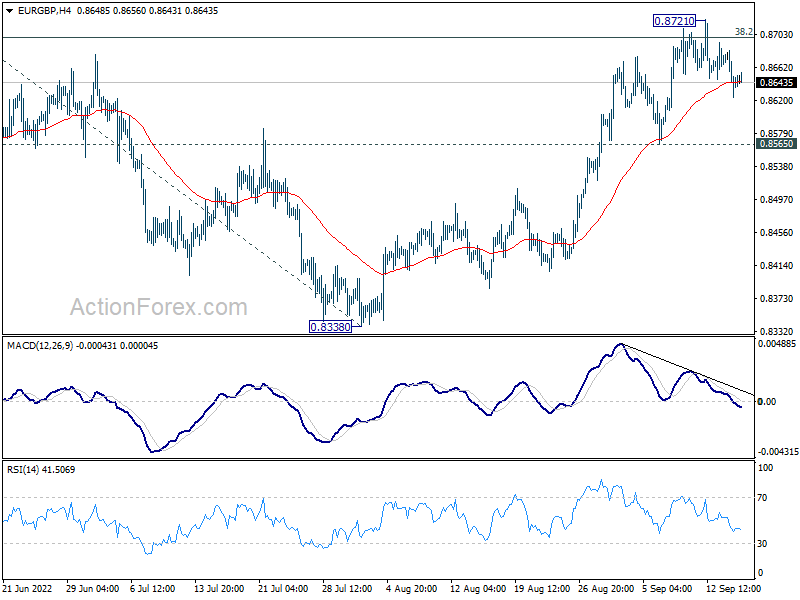
Intraday bias in EUR/GBP remains neutral and outlook is unchanged. On the upside, firm break of 0.8720 resistance will indicate resumption of whole rise from 0.8201. Intraday bias will be back on the upside for 100% projection of 0.8201 to 0.8720 from 0.8338 at 0.8857. On the downside, however, break of 0.8565 support will indicate rejection by 0.8720 and turn bias back to the downside.
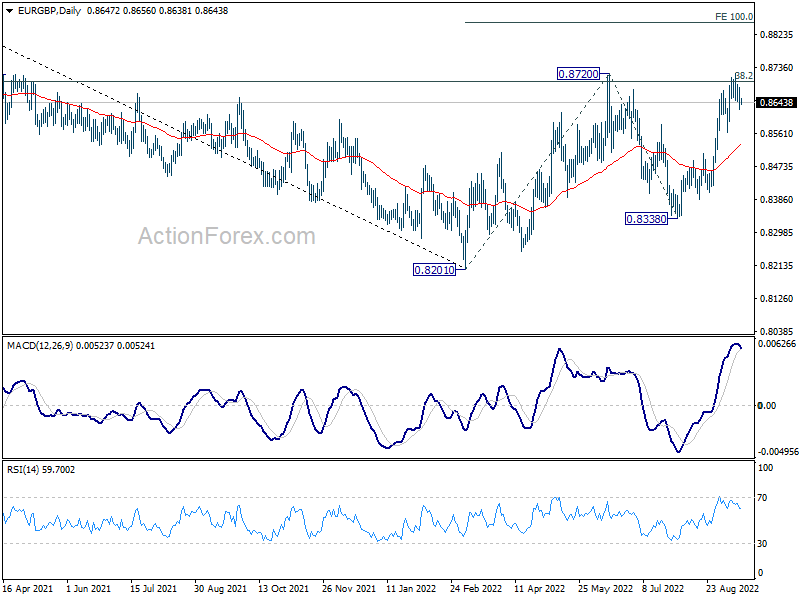
In the bigger picture, focus is back on 38.2% retracement of 0.9499 to 0.8201 at 0.8697. Sustained break there will argue that rise from 0.8201 is a medium term up trend, rather than a correction. Next target is 61.8% retracement at 0.9003. Rejection by 0.8697 again will maintain medium term bearishness, for extending the down trend from 0.9499 (2020 high) at a later stage.
EUR/AUD Daily Outlook
Daily Pivots: (S1) 1.4722; (P) 1.4773; (R1) 1.4859; More...
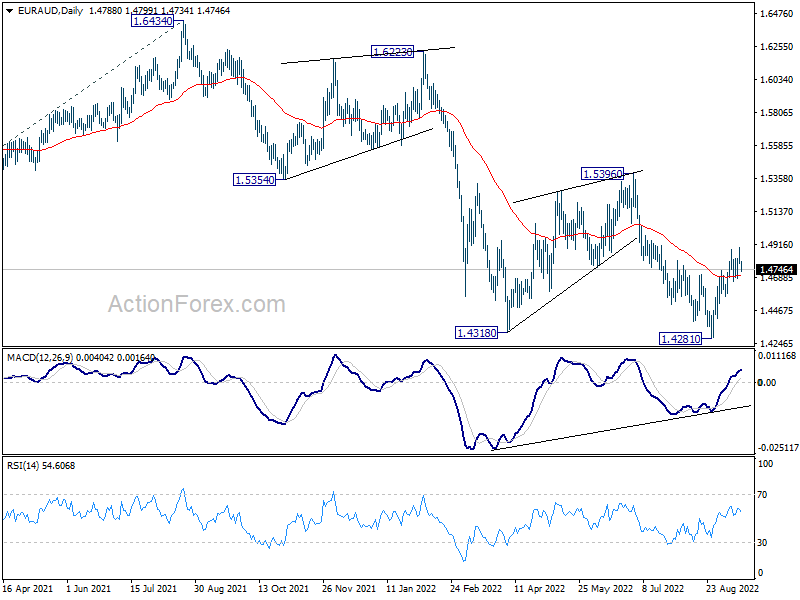
EUR/AUD edged higher to 1.4896 but quickly retreated. Intraday bias stays neutral first. On the upside, above 1.4896 will resume the rebound from 1.4281 short term bottom, and target 1.5396 resistance. On the downside, however, break of 1.4564 minor support will turn bias back to the downside for retesting 1.4281 low.
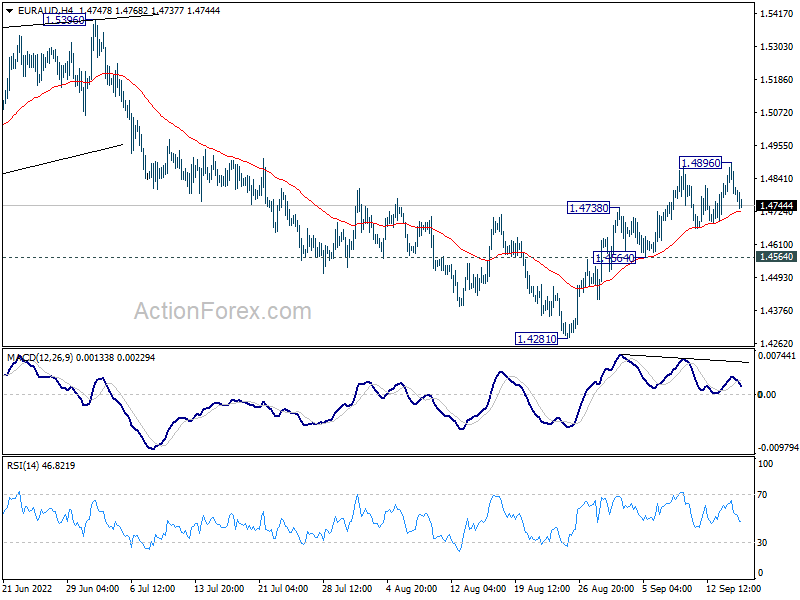
In the bigger picture, down trend from 1.9799 is still in progress. Break of 1.4318 low will target 61.8% projection of 1.9799 to 1.5250 from 1.6434 at 1.3623, which is close to 1.3624 long term support (2017 low). This will remain the favored case now as long as 1.5396 resistance holds.
EUR/CHF Daily Outlook
Daily Pivots: (S1) 0.9580; (P) 0.9605; (R1) 0.9627; More....
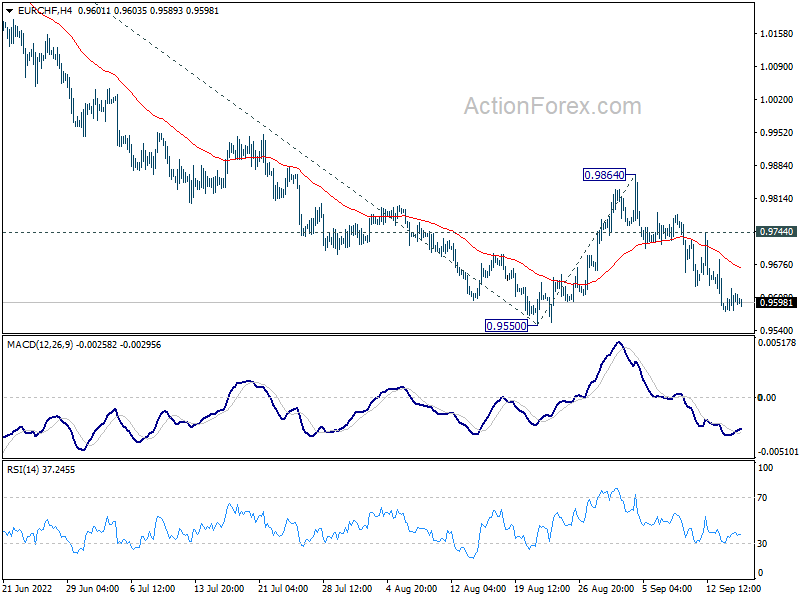
Intraday bias in EUR/CHF stays mildly on the downside for retesting 0.9550 low. Decisive break there will resume larger down trend. Next target is 61.8% projection of 1.0512 to 0.9550 from 0.9864 at 0.9269. On the upside, above 0.9744 minor resistance will extend the corrective pattern from 0.9550 with another rising leg.
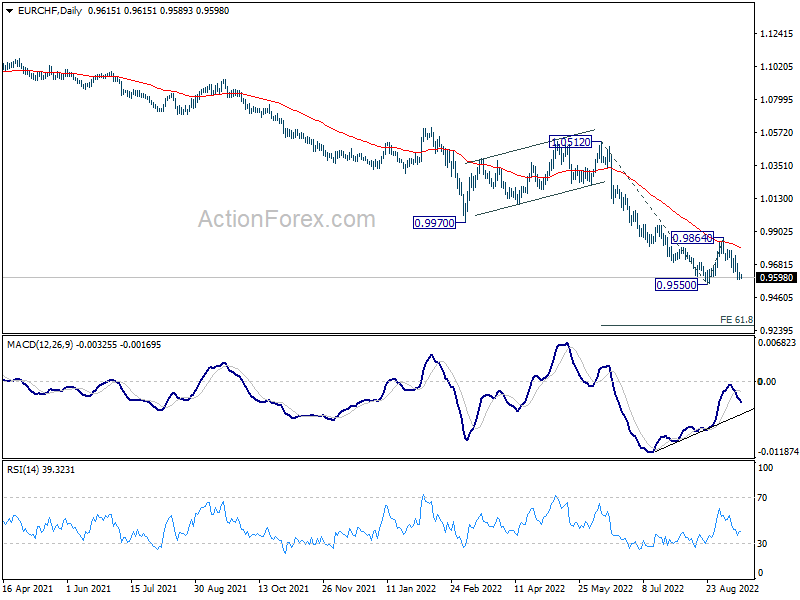
In the bigger picture, long term down trend from 1.2004 (2018 high) is still in progress. Next target is 138.2% projection of 1.2004 to 1.0505 to 1.1149 at 0.9033. On the upside, break of 0.9970 support turned resistance is needed to be the first sign of medium term bottoming. Otherwise, outlook will stay bearish in case of strong rebound.
Steady Post-Inflation Shock
Stock markets are a bit mixed on Thursday following a rollercoaster week in the run-up to, and aftermath of, the US inflation report.
Safe to say, investors got ahead of themselves in a desperate attempt to board the peak inflation train early. The collapse on Tuesday - carrying into Wednesday in Asia and Europe - looked quite severe on the face of it but it was simply an unwinding of positions built on the anticipation of a good set of numbers in the days leading up to it.
While the Fed is now almost certain to hike by 75 basis points next week and more in the months that follow than previously anticipated, the view still seems to be that Tuesday was a setback rather than a game changer. Confidence that we are at or near peak inflation is dented but not broken and this week serves as a reminder that as was the case on the way up, the path back to 2% will likely be littered with nasty surprises.
RBA will likely welcome labour market report
This will likely be the case for most central banks, not just the Fed, with the RBA seen to be in the early stages of its pivot towards slower tightening. After hiking rates by 50bps, markets are now pricing in a 25bps hike next month although as we've seen so often this year, that could quickly change with the data. The labour market figures today could support such a move, as employment rose a little less than expected while participation also rose, unexpectedly lifting the unemployment rate to 3.5%. The Aussie dollar rose after the release but has since given the bulk of that back.
PBOC leaves MLF unchanged and supports CNY
The PBOC's battle to support the yuan continued on Thursday as it left the 1-year MLF rate unchanged at 2.75% and set a stronger fix on the currency. The result was around 200 billion yuan being withdrawn from the banking system, with the central bank stating that it would "keep banking system liquidity reasonably ample". The dual threat of a slowing economy and tumbling currency against the dollar is posing quite the challenge for the central bank which is continuing to try and push back against both, with limited success.
Yen steady amid intervention warnings
The yen remains a key focus after a slew of intervention commentary yesterday which accompanied reports of a rate check by the BoJ. While officials have been keen to state that no warning of intervention will be forthcoming, nor perhaps even confirmation of it, the line in the sand around 145 against the dollar appears to have been drawn. The message was loud and clear and now it's just a case of whether markets will respect it. That's not always the case and we could see its resolve tested after 24 years without such action.
Oil steady after inventory data
Oil prices have steadied a little after rebounding strongly this past week. There are many forces dictating the price action in oil markets right now, with economic uncertainty right up there alongside a potentially unpredictable OPEC+. The stronger dollar is potentially another headwind, with the rally losing steam earlier this week as the greenback surged in the aftermath of the inflation release.
The inventory data on Wednesday didn't cause much of a wobble despite surpassing forecasts with a 2.442 million barrel build against expectations of something far more modest. Of course, this was still much smaller than what the API number indicated a day earlier so perhaps that limited the surprise factor.
Has the damage been done?
Gold is still hurting after the inflation data on Tuesday. It was just starting to find its feet again ahead of the data and the report delivered a crushing blow. The yellow metal is off around four-tenths of one percent this morning and comfortably below $1,700. The key level though is $1,680 and a significant break of this could be painful, with it having been a floor over the last couple of years. We could then see some support around $1,660 but at that point, the damage will have been done.
Will it be a "sell the fact" event?
Bitcoin has stabilised once more around $20,000 after Tuesday's bruising encounter with the US inflation data. As we saw elsewhere, the cryptocurrency had rallied in anticipation of something more favourable but it wasn't to be. With that now behind us, the question will become how the crypto space reacts to the Ethereum Merge. It's been a long time in the making and the question on traders' lips right now is will it be the next bullish catalyst for cryptos or a "sell the fact" event.
US Rail Strike Risk Weighs on Sentiment
US equities eked out small gains yesterday as dip buyers timidly came in, but risks remain tilted to the downside with the disappointing inflation figures, and the risk of the largest rail strike in the US since 1992.
Released yesterday, the US producer price data didn’t enchant investors. The headline figure fell for the second consecutive month and came in at 8.7%, slightly lower than the analyst expectations. Yet, the broader story was similar to the CPI read. The core PPI strengthen last month, hinting that most of the easing in producer inflation was due to cheaper energy prices – which however remain very volatile, and which, more importantly carries a decent upside risk.
The barrel of American crude flirted with the $90 mark yesterday, without however being able to clear resistance at this level. The recession worries, and prospects of slower global demand keep the oil bears in charge for now, while the bullish bets on tight supply remain on standby. But the winds could rapidly change direction.
For now, the latest EIA data revealed that the US crude inventories rose by 2.4 million barrels last week versus 1.9 million rise expected by analyst. The higher inventories hint at lower-than-expected demand, and help cool down the positive pressure.
So yes, we saw the S&P500 recover a part of losses yesterday, as Nasdaq gained 0.84%. But the risks remain clearly tilted to the downside, as the Federal Reserve (Fed) expectations will remain hawkish as long as we don’t see a material softening in inflation. And this week’s figures showed that we are not there just yet.
Plus, negotiations between the freight-rail companies and unions showed no progress to avoid an eventual rail strike by Friday, which could result in about 125’000 workers walk off their jobs. It is said that it would be the largest stoppage of its kind since 1992. And an eventual strike would not only cost the US economy about $2 billion per day but would also boost the inflation expectations for this month, and make sure that the hope of seeing inflation ease would be postponed by at least another month.
As a result, the US dollar remains relatively strong near the 20-year highs, the EURUSD consolidates below parity as the latest industrial production data, released yesterday showed a 2.3% decline in activity last month, versus 1% contraction expected by analysts, meaning that the energy crisis is took a bigger toll on the European industrial activity, and the crisis has not even, really, begun yet!
The European leaders are doing their best to get ahead of the game with the crisis. The European Union is now looking to raise more than 140 billion euros from energy firms to help households and businesses afford the otherwise unaffordable cost of energy.
Interestingly however, the European energy companies which should see their superprofits taxed, like BP or Total, didn’t react heavily to the news. BP closed the session slightly higher yesterday, while Total Energies rallied 2.5% on firm oil prices, whereas the FTSE and the EuroStoxx were under a decent selling pressure. The price action gives you an idea on how profitable the European energy companies are, despite the risk of being taxed their additional profits this year. Let’s all hope that they wouldn’t restrict output to pay less taxes, which, then, would backfire on politicians, and worsen the energy crisis by further weighing on supply.
Gold baffled
Gold is back below the $1700 mark, as improved risk appetite has again got investors to bypass the precious metal and opt for better yield assets yesterday. Gold continues being baffled by the hawkish Fed expectations – which push the dollar and US yields higher and weigh on gold, and by the dovish Fed expectations, which eases the strong dollar pressure, but get investors on board of riskier and better yielding assets. The price of an ounce could extend toward the $1650 in the continuation of the actual negative trend.
USD/JPY?
One pair we could see some material easing is the dollar-yen. The USDJPY was softer yesterday on news that the Bank of Japan (BoJ) conducted a rate check, which has been perceived as a preparation to intervene directly in the market to stop the depreciation in yen. If the BoJ intervenes, we could rapidly see the price of dollar-yen ease at least toward 125/130 region, which is April to June trading range. That would allow the BoJ to buy time, and take it easy on its rate policy, while preventing the dollar from pushing inflation into an undesired positive spiral in Japan.
EU Commission Reveals Proposals to Mitigate the Energy Crisis
Market movers today
We get lots of US data today with retail sales being the most interesting. Consensus looks for a 0.5% m/m increase in core retail sales (excl. autos and gas) in August, partly lifted by the rise in core consumer prices of 0.6% m/m.
US also releases business surveys for September from Philadelphia and New York (Empire index) giving more clues to the state of manufacturing.
Finally, US initial jobless claims, import prices and industrial production are due out.
In the Nordics focus will be on Prospera Inflation expectations out of Sweden.
The 60 second overview
Markets: After the very volatile Tuesday, following the higher than expected US CPI core numbers markets calmed down somewhat yesterday. US equity markets managed to close in green and equity futures point to a small positive opening both in Europe this morning. The VIX index edged slightly lower also indicating the calmer markets. Global longer-dated yields had a relatively volatile day but ended the day unchanged or slightly lower.
Energy: The EU Commission yesterday introduced a number proposals to mitigate the impact of the energy crisis. Recently, high margin calls on producers who have sold electricity at 'low' fixed priced have created a liquidity problem in the energy sector and triggered government guarantees in many countries. The Commission proposes that bank guarantees can be accepted as collateral and that the clearing threshold should be lifted. On the economic side the Commission proposes the introduction of windfall tax that should be used to shield consumers by raising EUR140bn for the member states. The cap is set at EUR 180 MWh of realized revenue. See full EU plan here. Finally, European Commission President von der Leyen said that a taskforce will be set up with Norway to look at the high gas prices.
New measures to shield consumers: France yesterday announced that it will limit gas and electricity price hikes next year to 15%, and in Denmark the government proposed a government guaranteed loan scheme, that would allow consumers to postpone the extra bill for up to five years. The budgetary impact in Denmark is small and in France the government says that a major part of the costs will be covered by the introduction of windfall taxes.
BoE: We expect BoE to hike the Bank Rate by another 50bp on Thursday 22 September, but acknowledge that it is a close call between 50bp and 75bp. In both November and December we expect further 50bp hikes followed by 25bp in February. Hence, we have lifted the end point of our projection to 3.5% from previous 2.5%, see Bank of England Update BoE preview: another 50bp rate hike in store, 14 September.
FI: Rising expectations for even more aggressive rate hikes resulted in front end rates higher while longer dated ended lower. €STR pricing now points to 135bp by year end, where markets have not 'respected' Lagarde's 75bp is not the norm. The deposit rate is priced to peak at 2.5% in spring next year. The 10-year rates were marginally lower on the day, while spreads widened marginally.
FX: After a volatile session Tuesday, yesterday proved rather quiet in FX markets with the biggest move being the sell-off in HUF and the rise in JPY. EUR/USD is back hovering around parity while SEK and NOK erased part of the early-week losses.
Nordic macro
Sweden: As expected, inflation came once again out far above Riksbank's latest forecast adding further pressure on delivering front-loaded rate hikes. We keep or call and expect the Riksbank to deliver 75bp next week although 100bp shouldn't be ruled out. Today Prospera's quarterly inflation survey will be out which also will be an importan input for the Riksbank regarding the size of the hike. The survey will likely show another leg up in both inflation and wage expectations. Our focus will be partly on 5y inflation expectations (2.2 % last) as these are important for Riksbank's assessment of inflation target credibility and partly on 2y wage expectations (average of Social Partners 2.7 % last) as these cover a significant part of the forthcoming wage agreements starting March-April next year. However, a larger increase would be needed to increase the probability for 100bp hike. Markets are currently pricing 87bp on the September meeting followed by 100bp in November.
Technical Outlook and Review
USD/JPY:
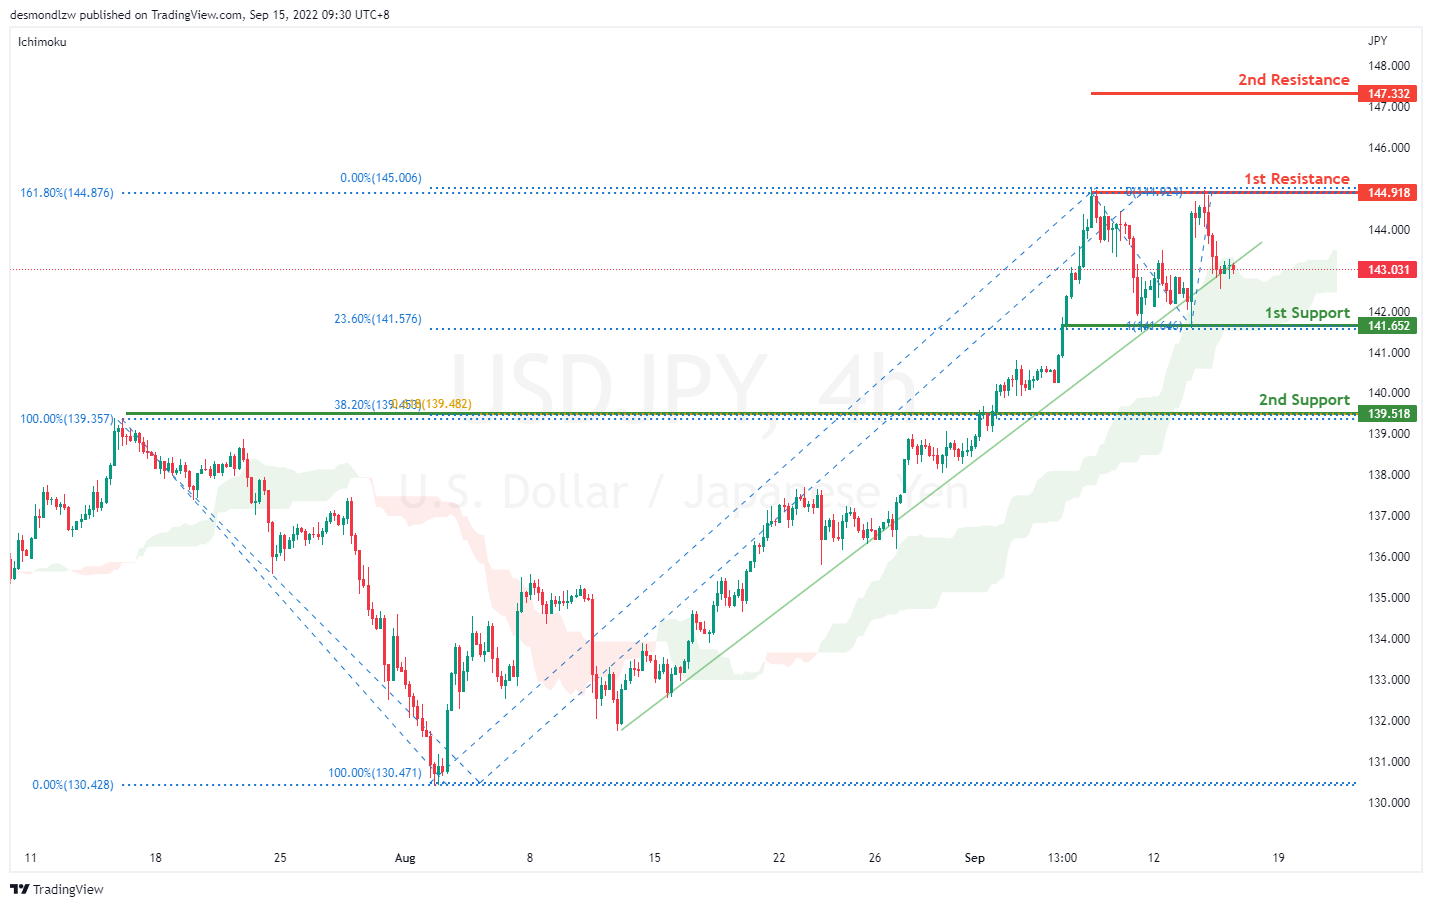
On the H4 chart, price is still respecting the ascending trend line. We are still bullish bias- Price is testing along the trend line and if bullish momentum continues, it should bring price to first resistance at 144.918 where the 161.8% extension sits. If it breaks this level, it should bring price to 147.332 where the previous swing high sits. Alternatively it could pull back to the first support at 141.652 where the 23.6% retracement and 100% projection sits then to the second support at 139.518 where the 38.2% retracement and overlapping support sits.
Areas of consideration:
- H4 time frame, 1st resistance at 144.918
- H4 time frame, 1st support at 141.652
DXY:
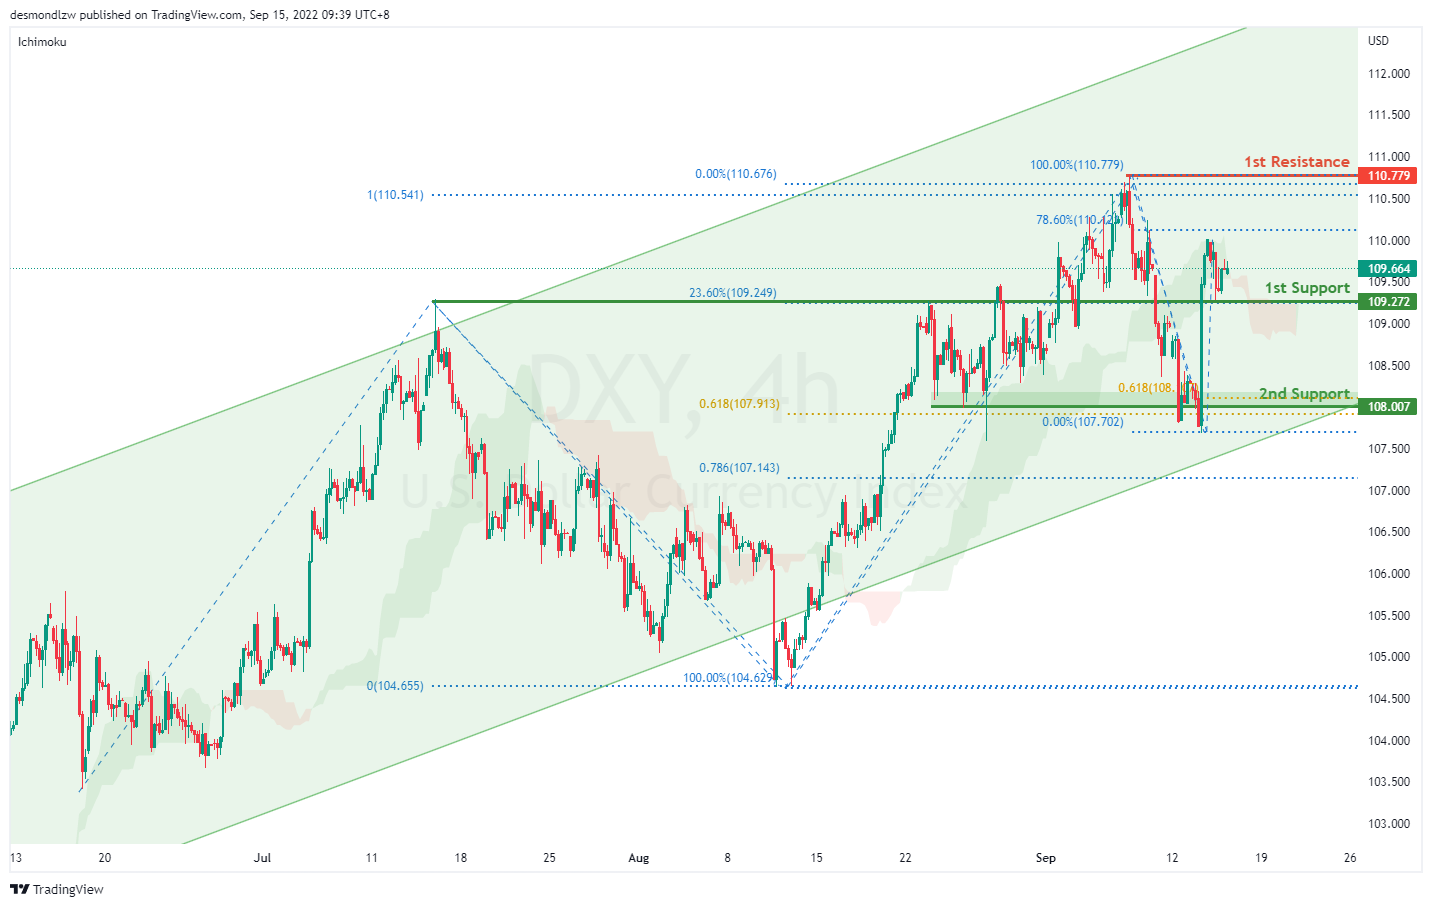
On the H4, price is still respecting the bullish channel- we are bullish bias. Price has rebounded off the support level and is moving toward the first resistance at 110.779 levels where the previous swing high sits. Alternatively, price could pull back to test the first support at 109.272 where the 23.6% retracement sits then the second support at 108.007 where the 61.8% projection, 61.8% retracement and previous swing low sits.
Areas of consideration:
- H4 time frame, 1st resistance at 110.779
- H4 time frame, 1st support at 109.272
EUR/USD:
On the H4, price is moving within the channel, we are currently bearish bias. Price seems like its moving to the first support at 0.9886 where the 61.8% projection and previous swing low sits. If bearish momentum continues, it should bring price to second support at 0.9799 where the 78.6% projection sits. Alternatively, if price pulls back it should test the first resistance at 1.0079 level where the 50% retracement and previous swing high sits then the second resistance at 1.0199 where the 61.8% retracement and previous swing high sits
Areas of consideration :
- H4 1st resistance at 1.0079
- H4 1st support at 0.9886

GBP/USD:
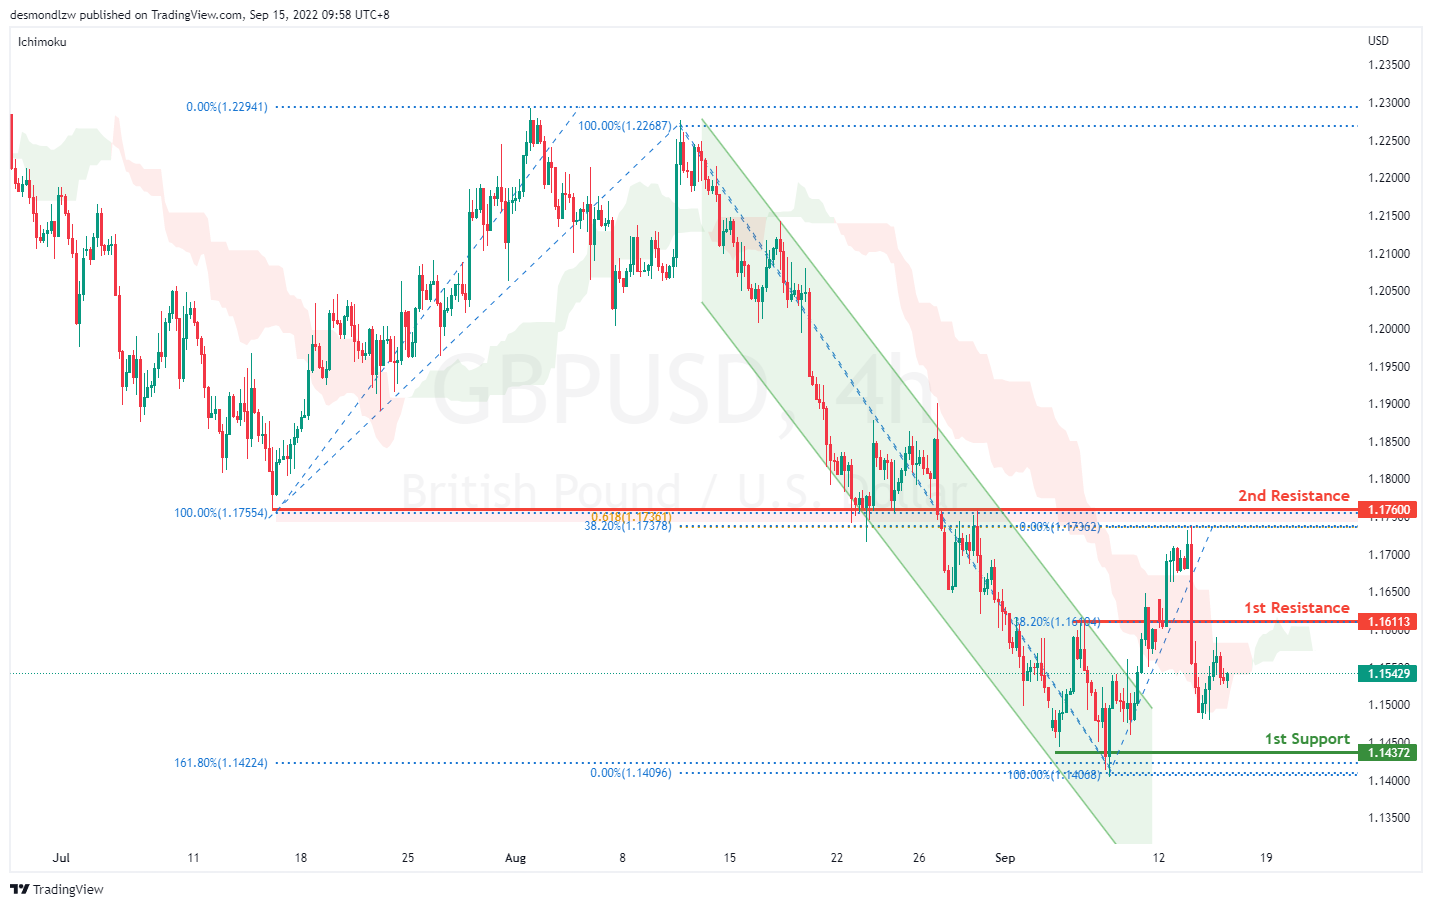
On the H4, prices are still moving in a bearish momentum hence we are bearish biassed. Prices seem to be moving toward the first support at 1.1437 where the 161.8% extension and previous swing low sits. Alternatively, price could pull back to test the first resistance at 1.1611 where the 38.2% retracement and overlapping support sits then the second resistance at 1.1760 where the 61.8% retracement and previous swing high sits
Areas of consideration:
- H4 1st resistance at 1.1611
- H4 1st support at 1.1437
USD/CHF:
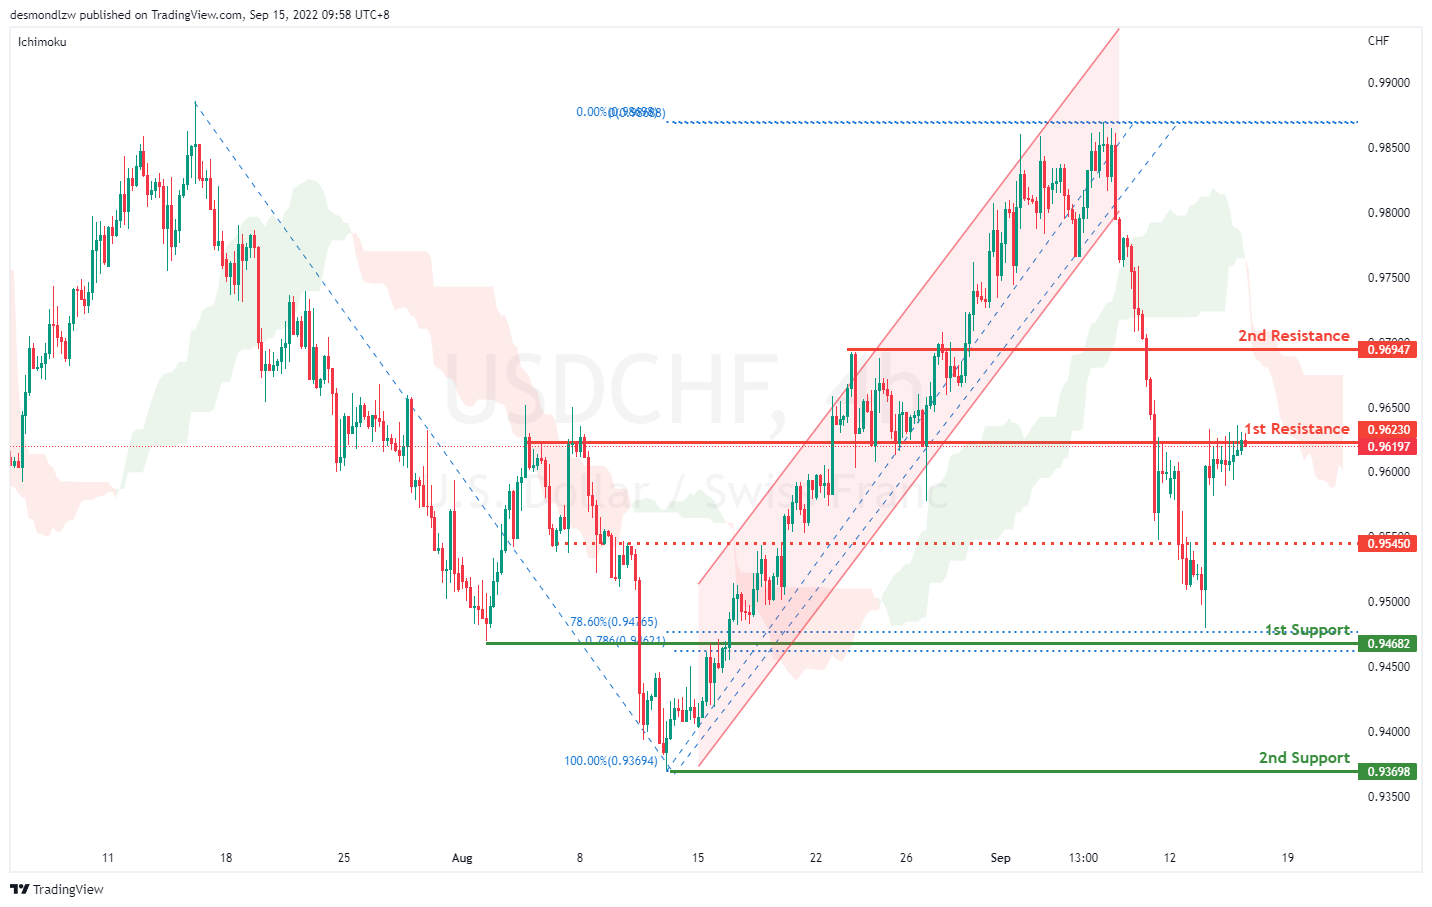
On the H4, prices have broken the ascending channel and we are currently bearish bias. Price is testing the first resistance at 0.9623 where the overlapping resistance and 50% retracement sit. If it breaks this level, it might test the second resistance at 0.9694 where the 38.2% retracement sits. Alternatively, price could pull back to test the first support at 0.9468 where the 78.6% retracement sit and then second support at 0.9369 where the previous swing low sits
Areas of consideration
- H4 1st support at 0.9468
- H4 1st resistance at 0.9623
XAU/USD (GOLD):
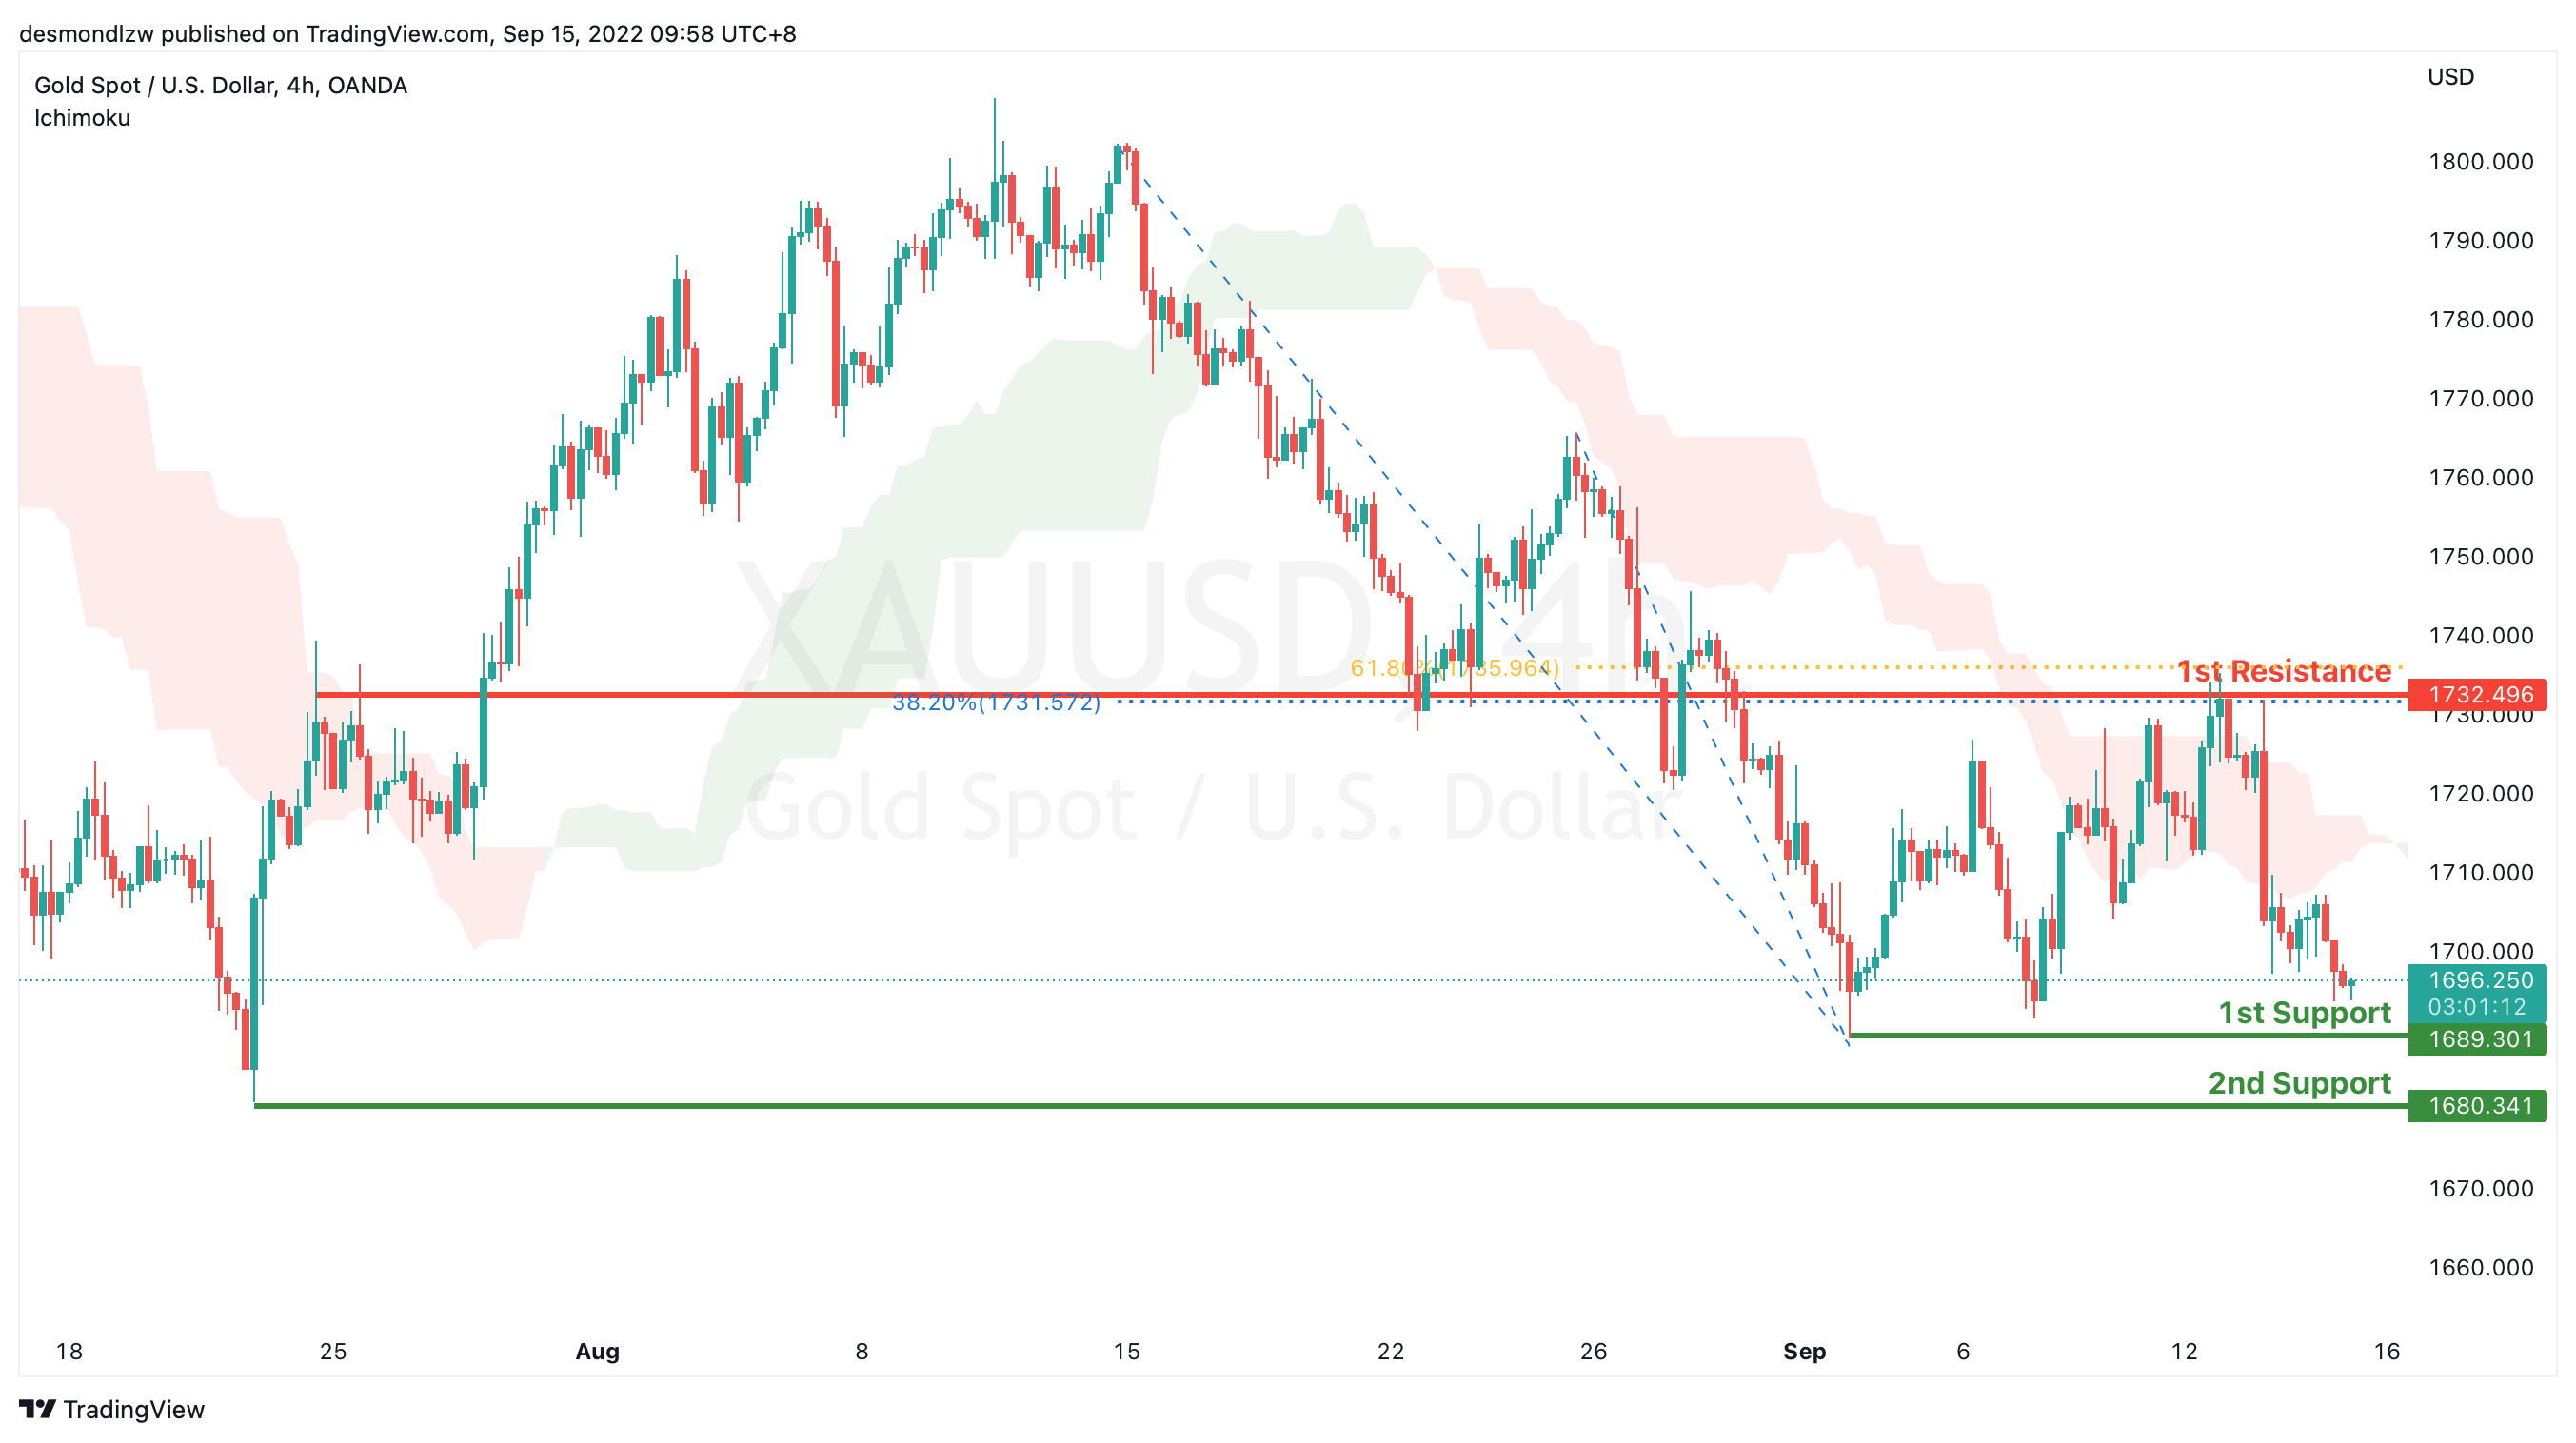
On the H4, with the price dropping from the 1st resistance and below ichimoku cloud, we have a bearish bias that the price may drop to the 1st support at 1689.301, which is in line with the swing low to the 2nd support at 1680.341, where the previous significant swing low is. Alternatively, the price may rise to the 1st resistance at 1732.496, which is in line with the 61.8% and 38.2% fibonacci retracement and overlap resistance.
Areas of consideration:
- H4 time frame, 1st support at 16989.301
- H4 time frame, 2nd support at 1680.341
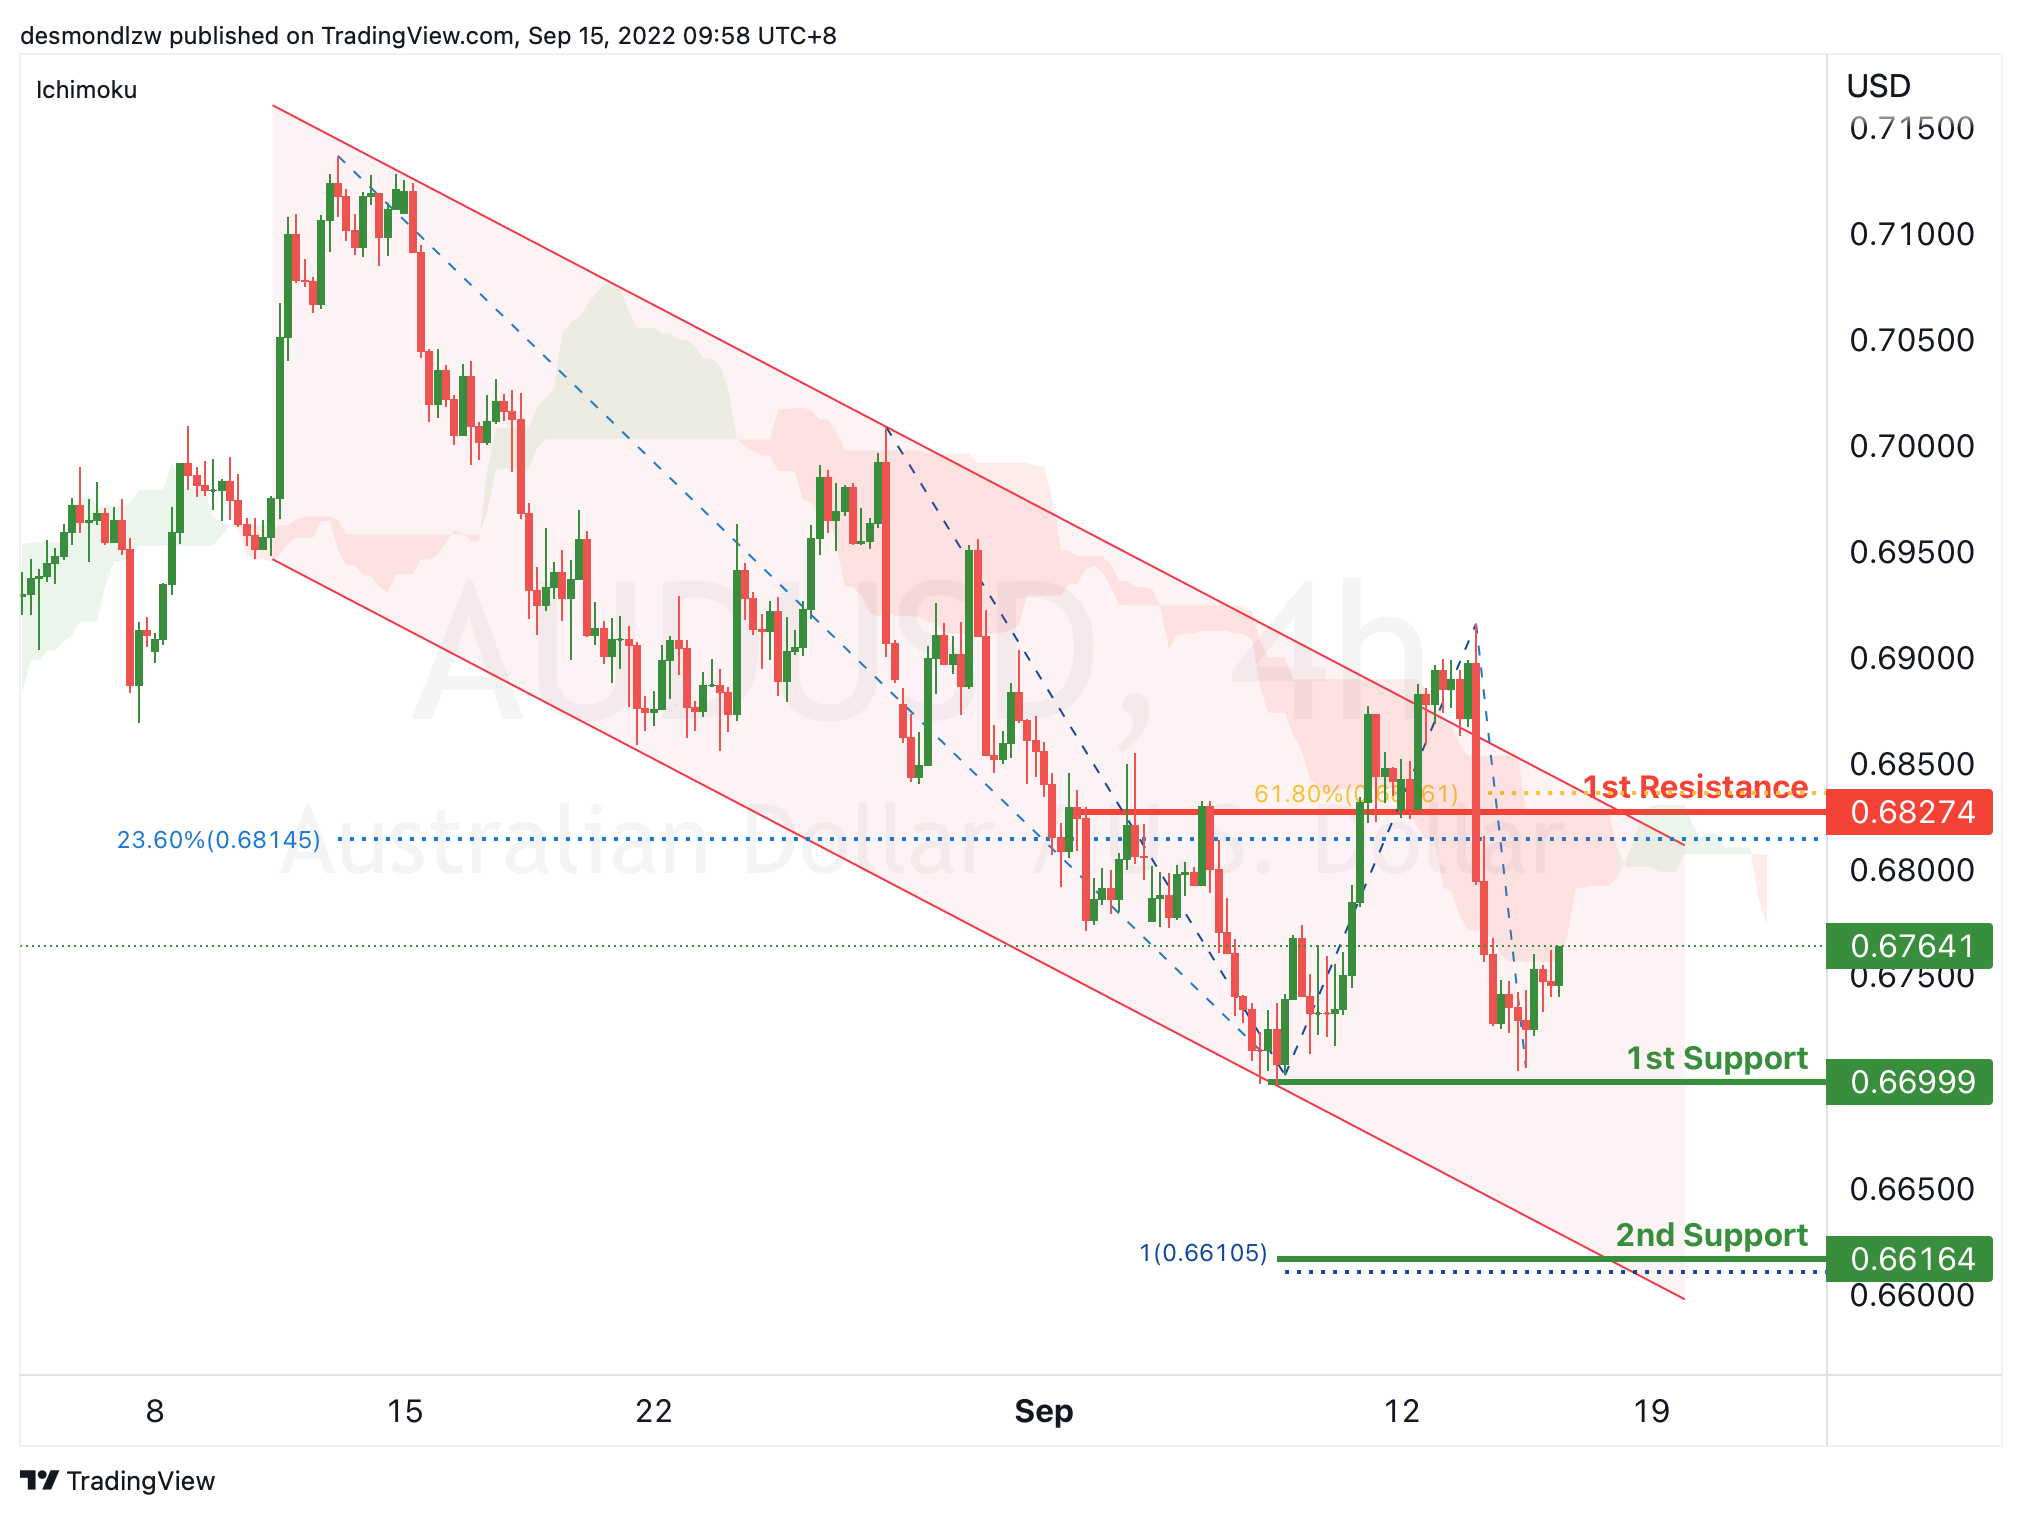
AUD/USD:
On the H4, with the price moving within the descending channel and below ichimoku cloud, we have a bearish bias that the price may drop to the 1st support at 0.66999, which is in line with the previous swing lows. If the 1st support level is broken, the 2nd support could be at 0.66164, where the 100% fibonacci projection is. Alternatively, the price may rise to the 1st resistance at 0.68274, which is in line with the 23.6% fibonacci retracement, 61.8% fibonacci retracement and overlap resistance.
Areas of consideration
- H4 1st support at 0.66999
- H4 2nd support at 0.66164
NZD/USD:
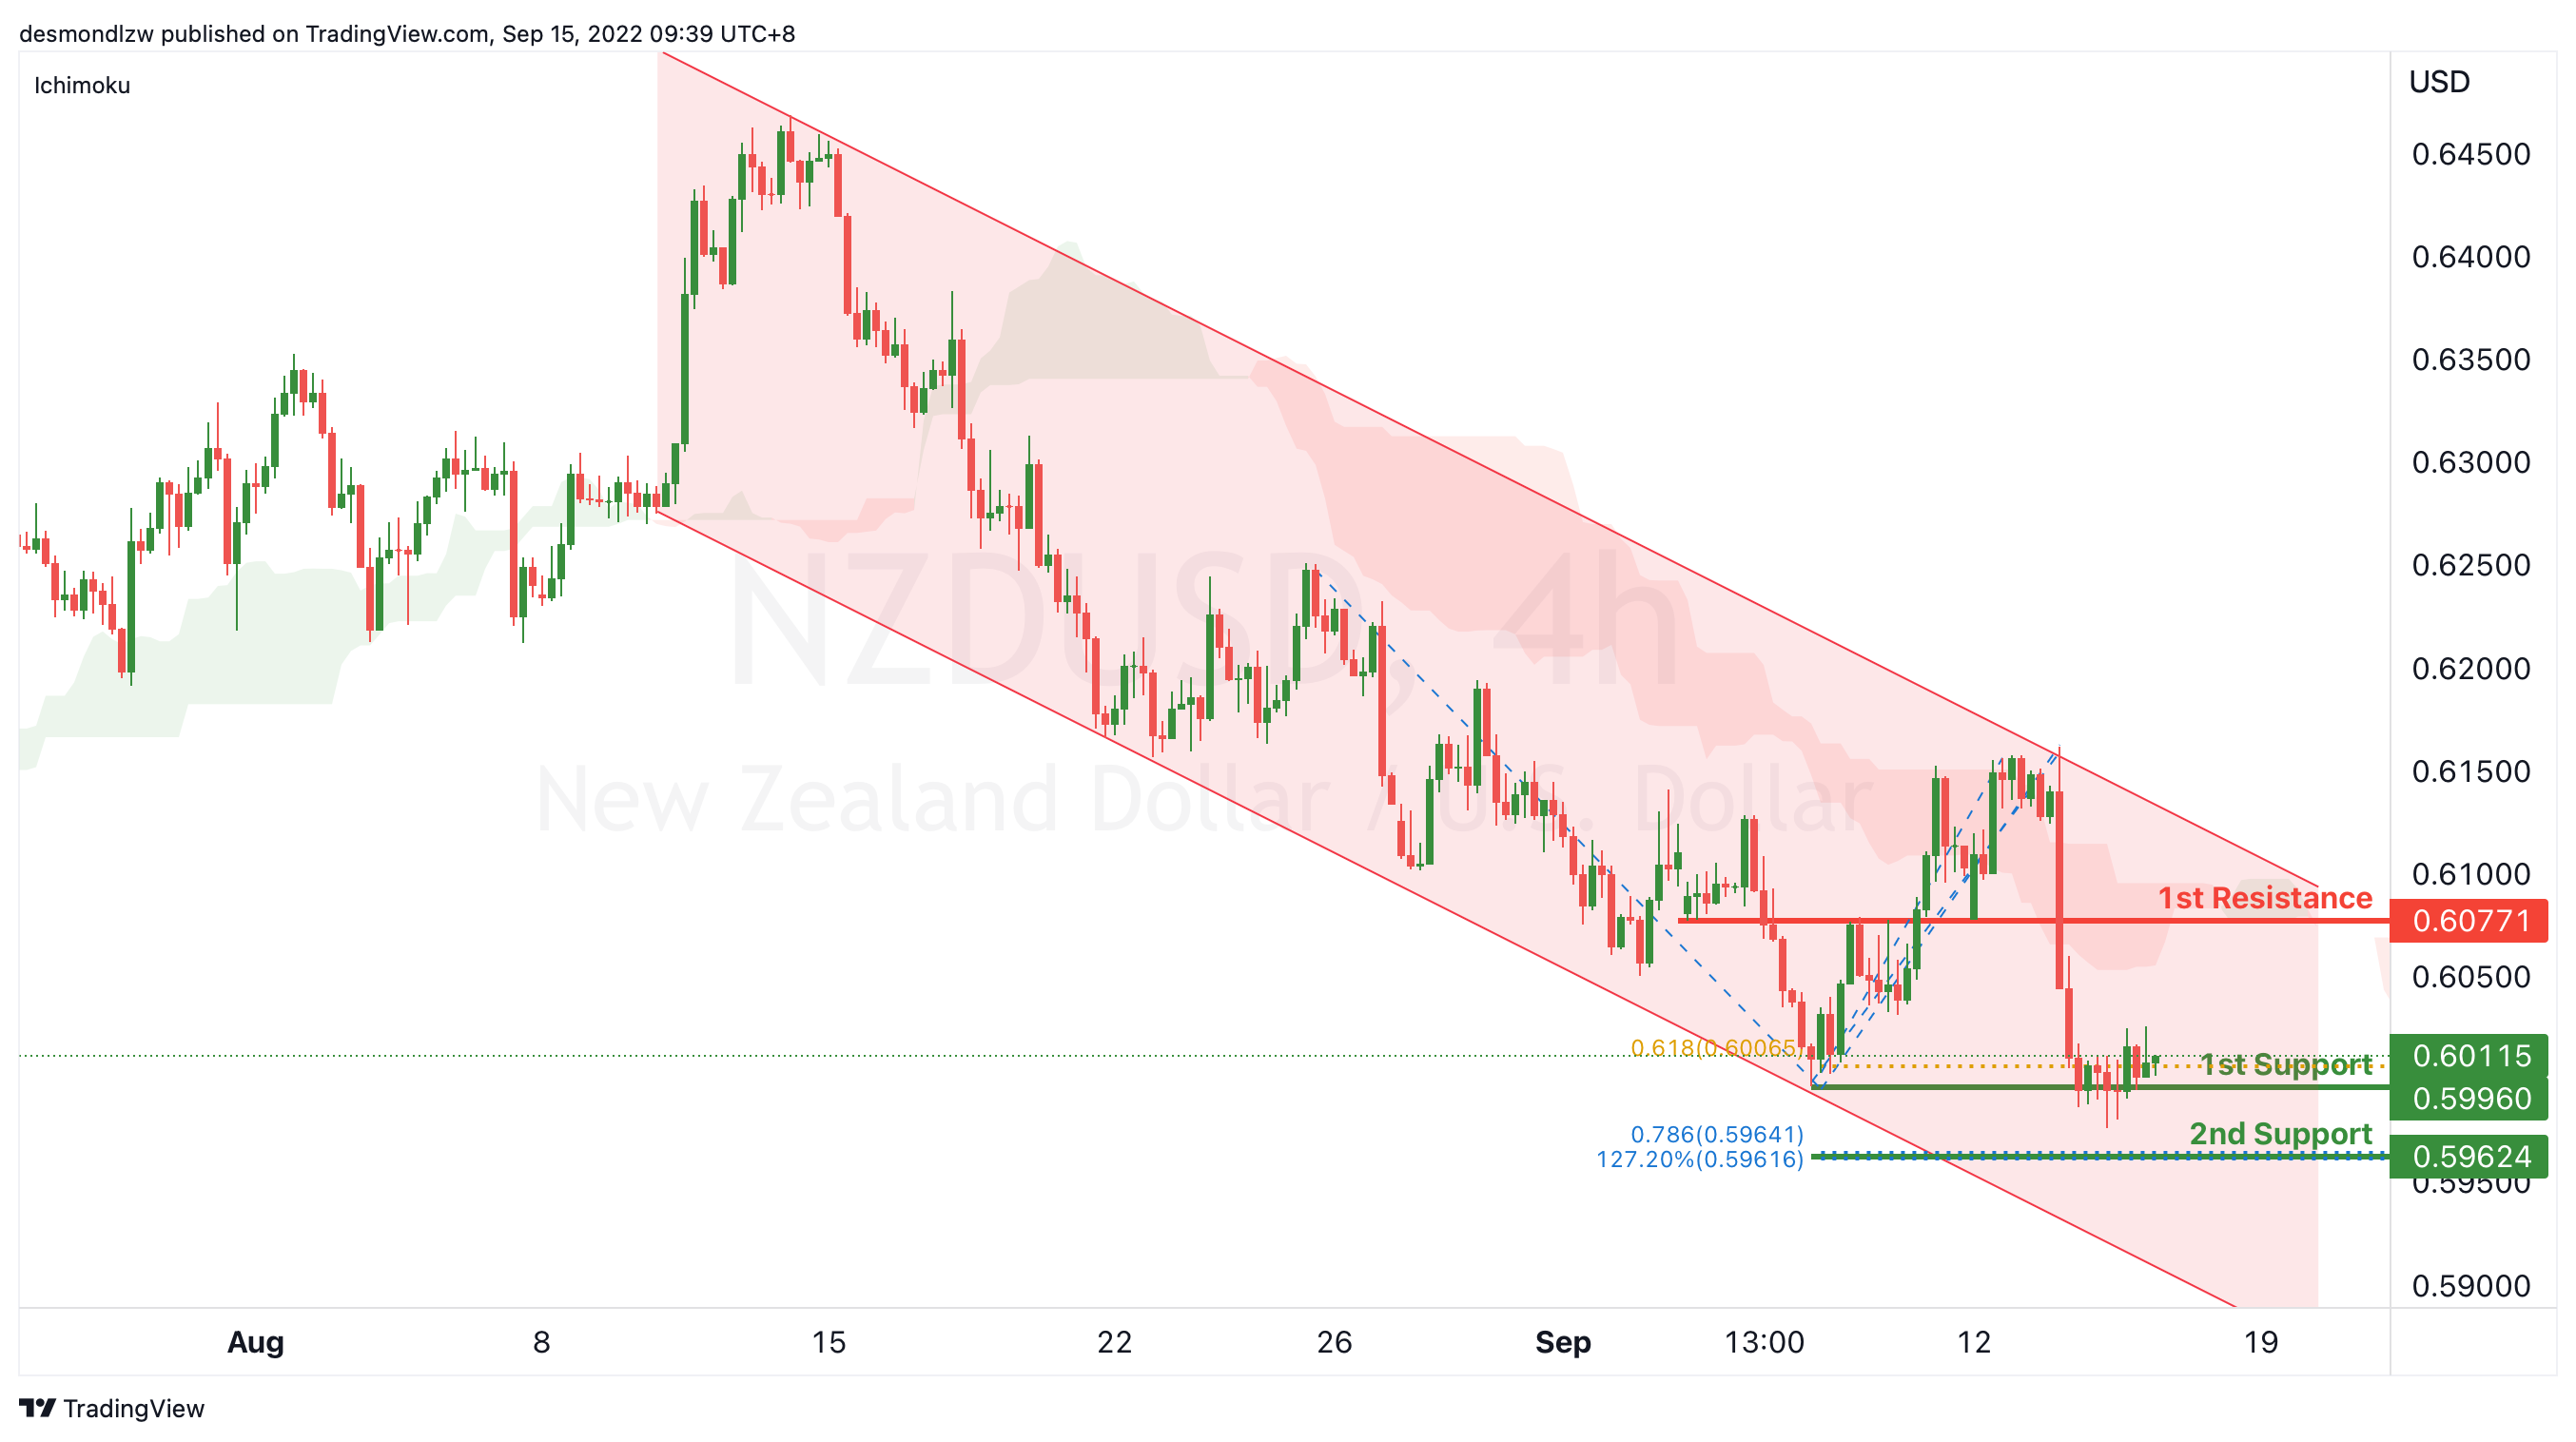
On the H4, with the price moving within the descending channel and below ichimoku cloud, we have a bearish bias that the price may drop from the 1st support at 0.59960, which is in line with the swing low and 61.8% fibonacci projection to the 2nd support at 0.59624, where the 78.6% fibonacci projection and 127.2% fibonacci extension are. Alternatively, the price may rise to the 1st resistance at 0.60771, which is in line with the overlap resistance, 61.8% fibonacci retracement.
Areas of consideration:
- H4 time frame, 1st support at 0.59960
- H4 time frame, 2nd support at 0.59624
USD/CAD:
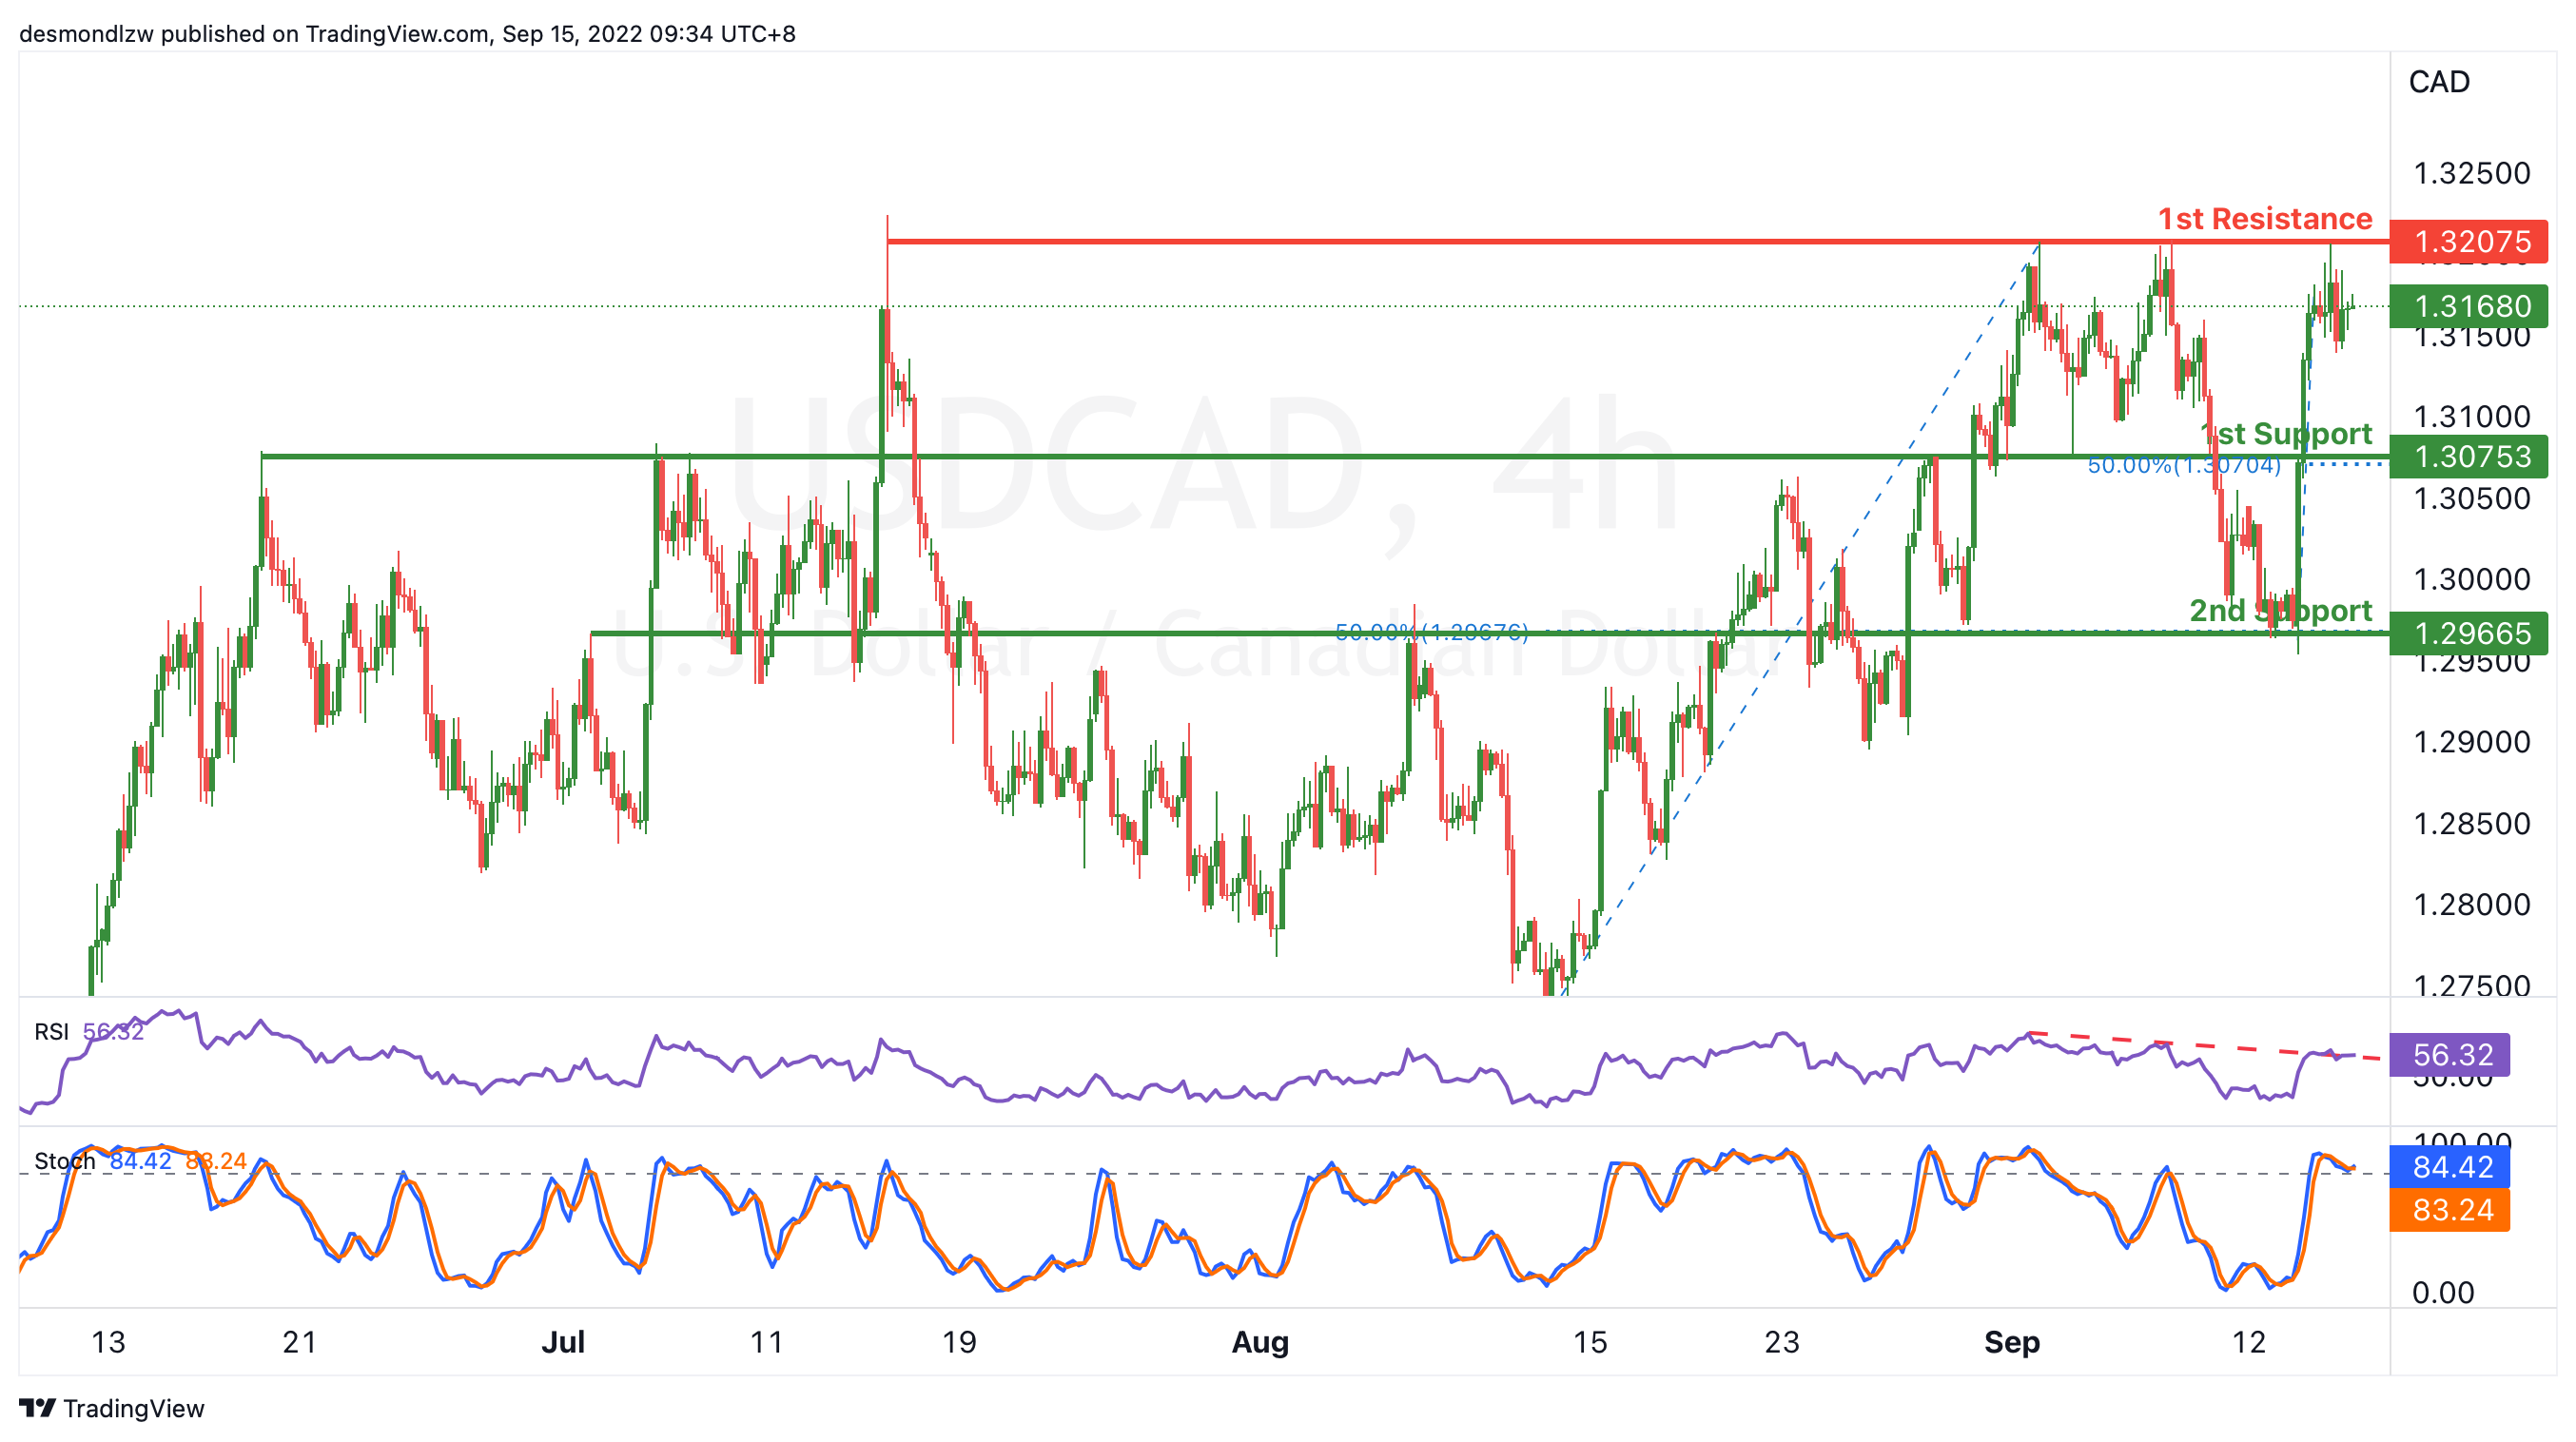
On the H4, the price the RSI is testing the descending trendline and stoch is over 80, we have a bearish bias that the price may pull back from the 1st resistance and drop to the 1st support at 1.30753, which is in line with the 50% fibonacci retracement and overlap support. If the 1st support is broken, the next support level could be at 1.29665, where the 50% fibonacci retracement and overlap support are. Alternatively, the price may continue the ascending trend and test the 1st resistance at 1.32075, which is in line with the swing highs.
Areas of consideration:
- H4 time frame, 1st resistance at 1.32075
- H4 time frame, 1st support at 1.30753
OIL:
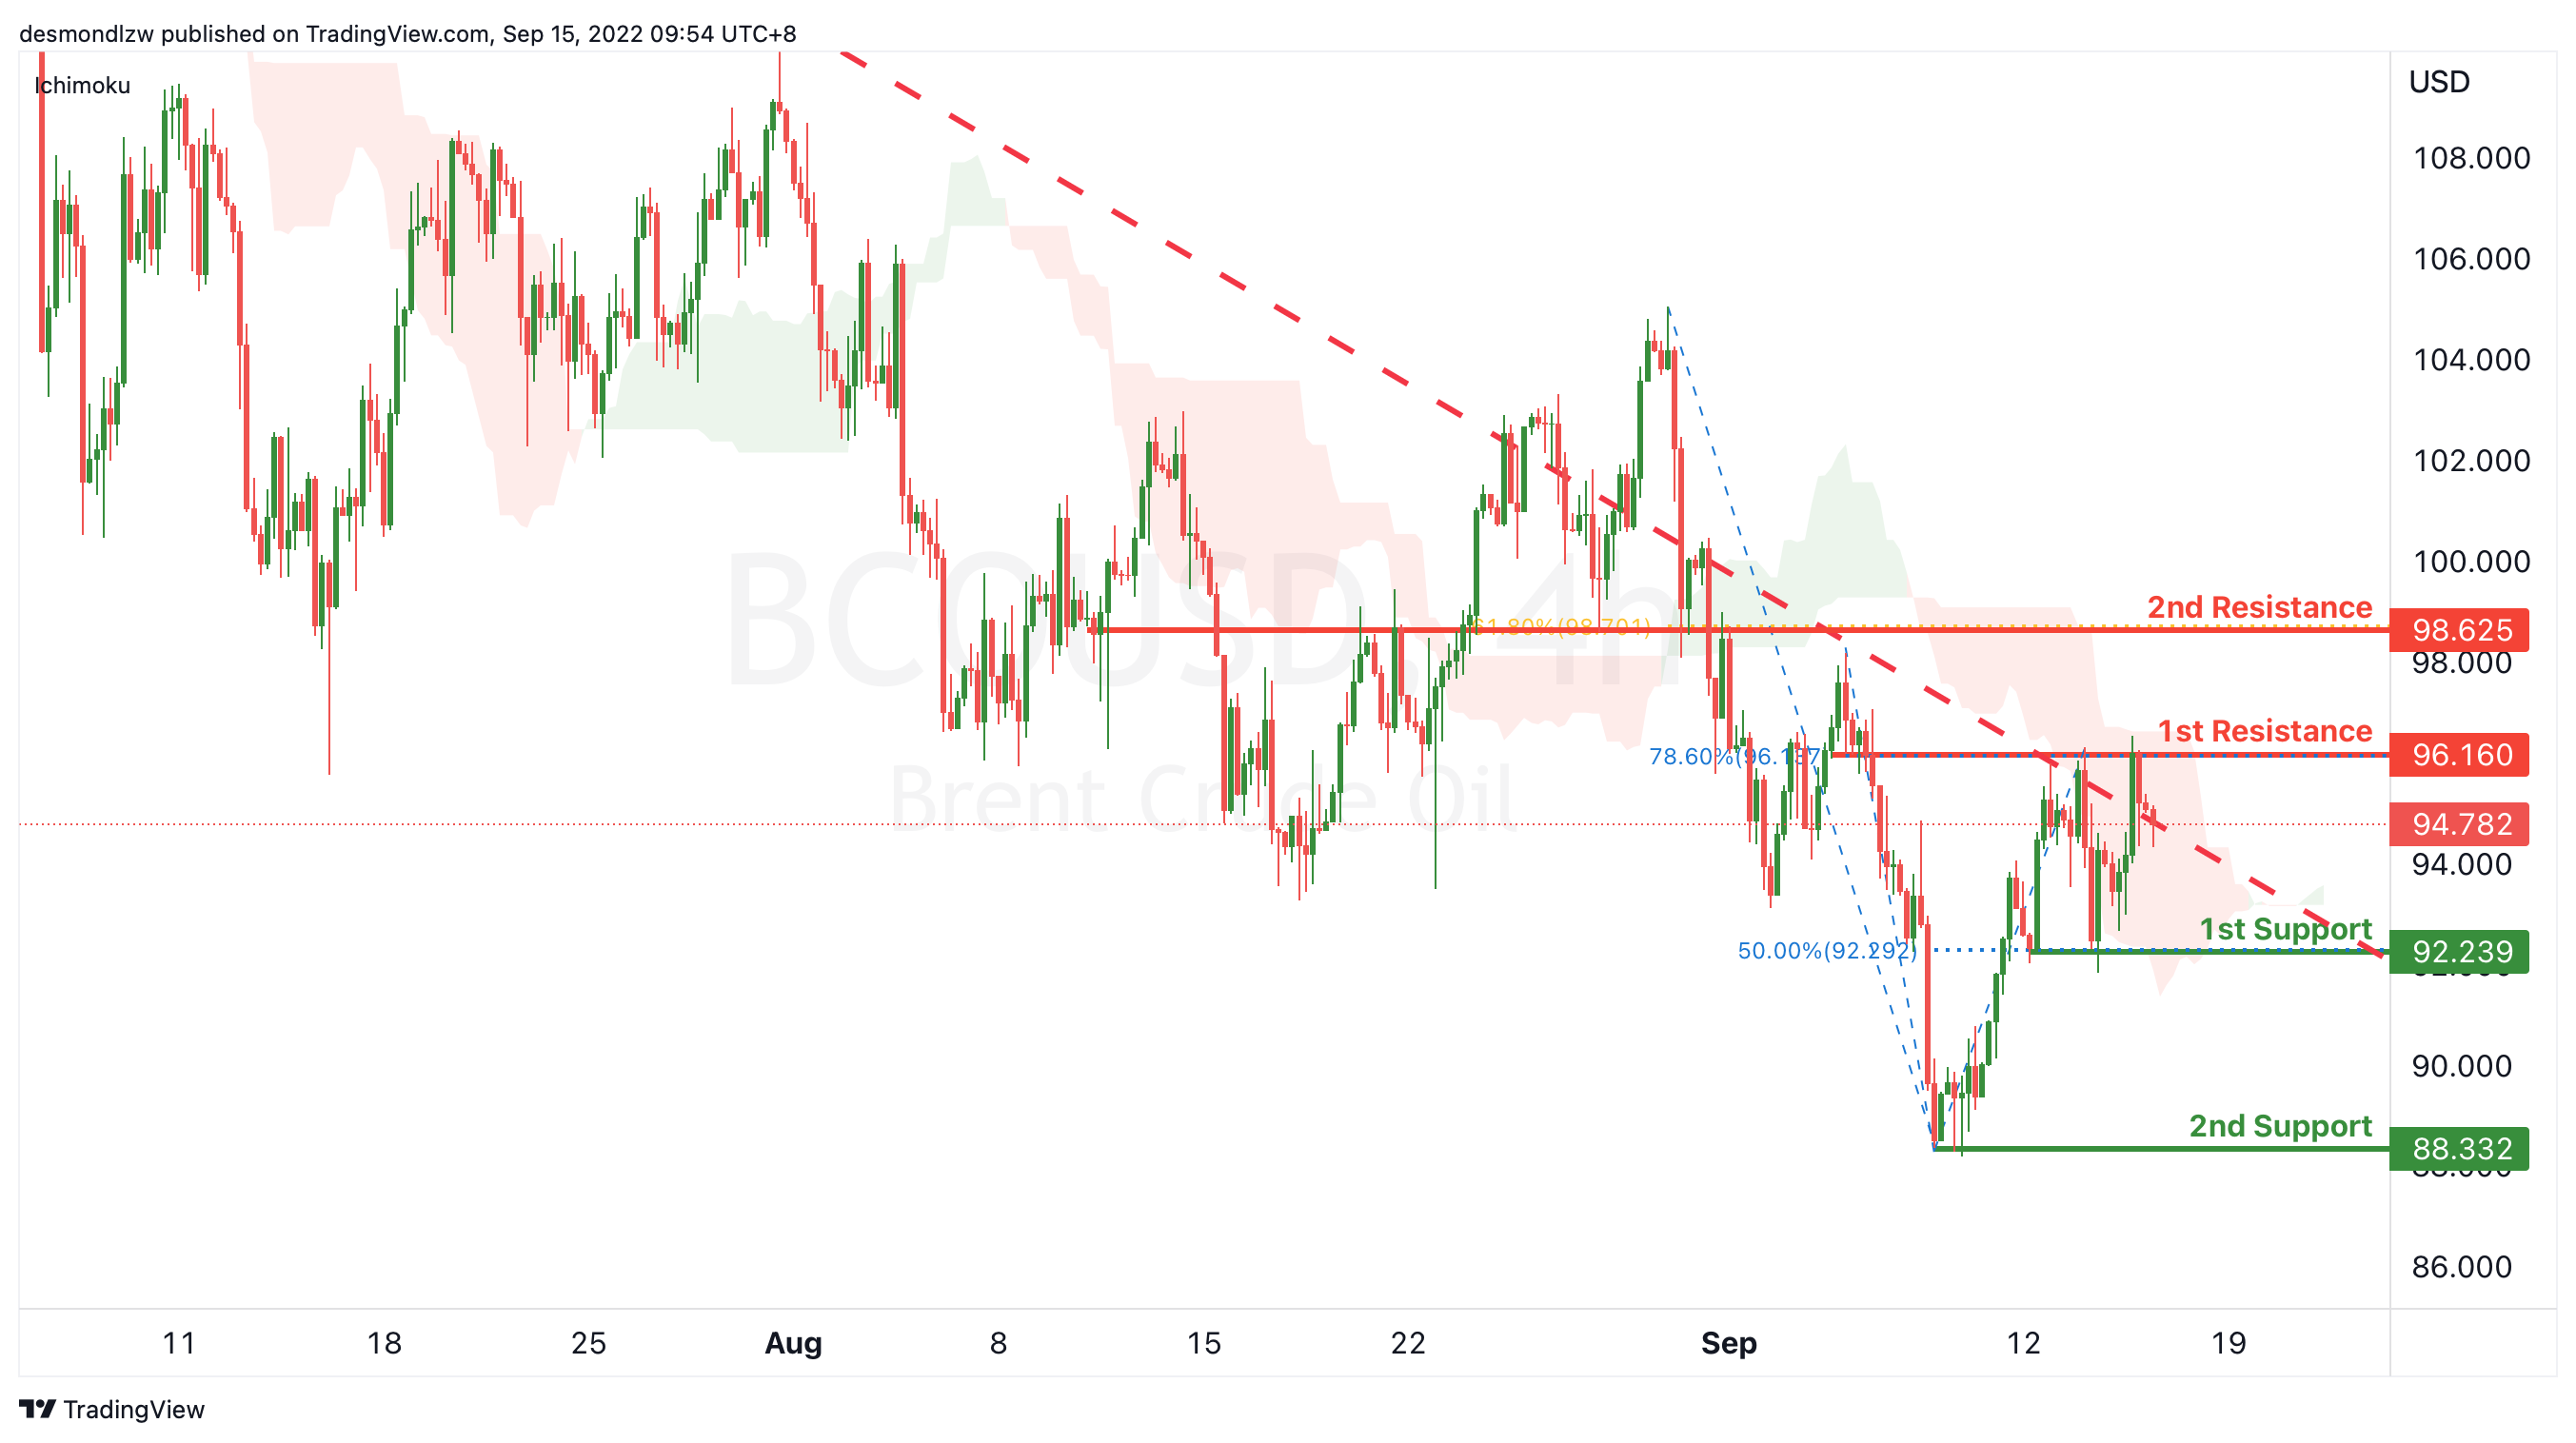
On the H4, with price below ichimoku, dropping from the 1st resistance and within the long term descending trendline, we have a weak bearish bias that the price may drop to the 1st support at 92.239, where the pullback support and 50% fibonacci retracement are. If the price can break this resistance level, the next support level could be at 88.332, which is in line with the swing low. Alternatively, the price may rise to the 1st resistance at 96.160, which is in line with the 78.6% fibonacci retracement and overlap resistance. If the 1st resistance is broken, the 2nd resistance could be at 98.625, which is in line with the 618% fibonacci retracement and overlap resistance.
Areas of consideration:
- H4 time frame, 1st resistance at 96.160
- H4 time frame, 1st support at 92.239
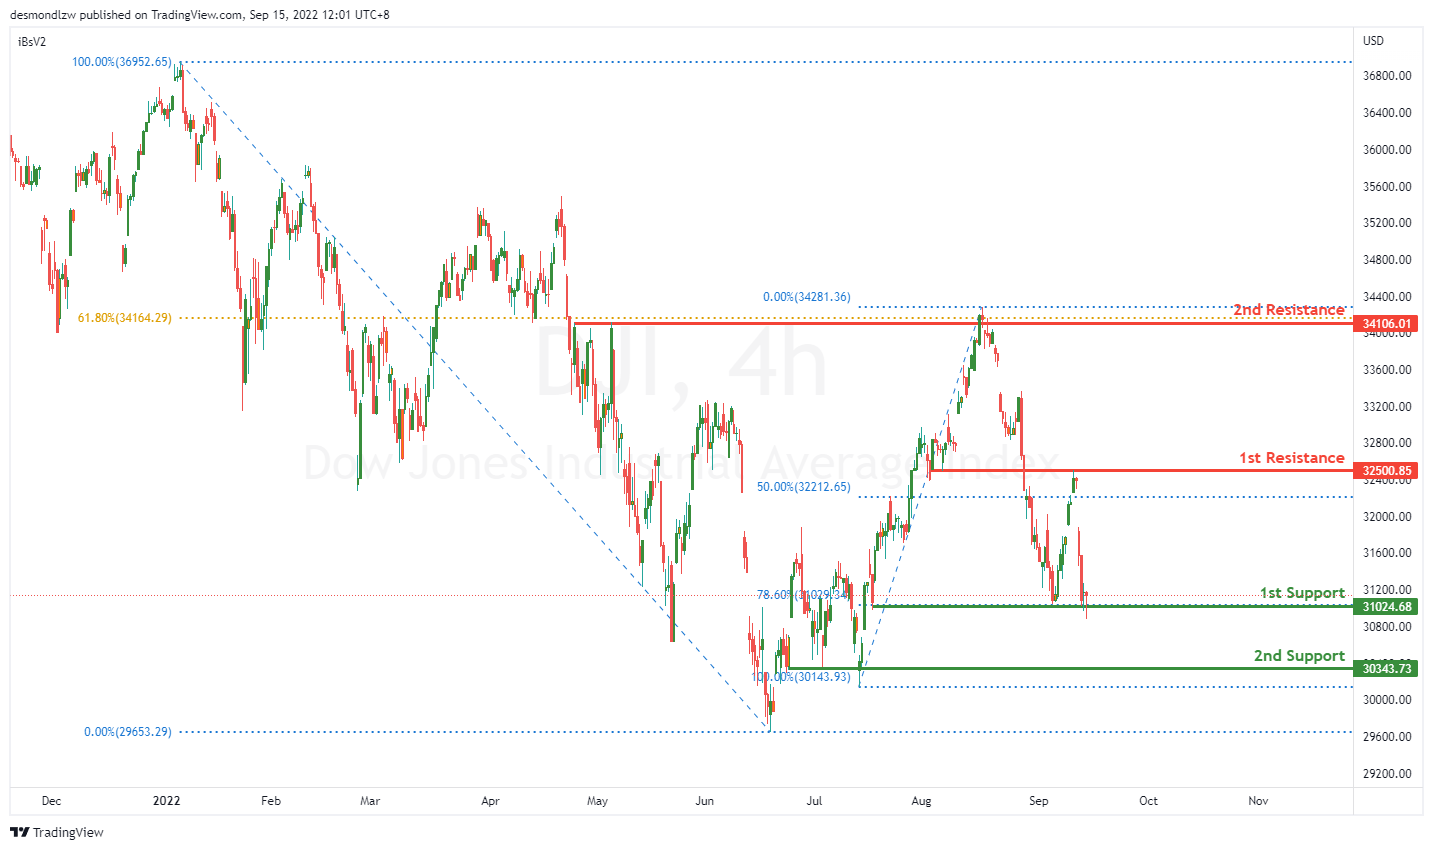
Dow Jones Industrial Average:
On the H4, price is reflected off nicely at the first resistance at 32500.85 where the 50% Fibonacci retracement is and broke right through the first support at 31029.34 where the 78.6% Fibonacci retracement is. Price might continue heading downwards towards the second support at 30343.73 where the previous swing low is.
Areas of consideration:
- H4 time frame, 1st support at 31029.34
- H4 time frame, 2nd support at 30343.73
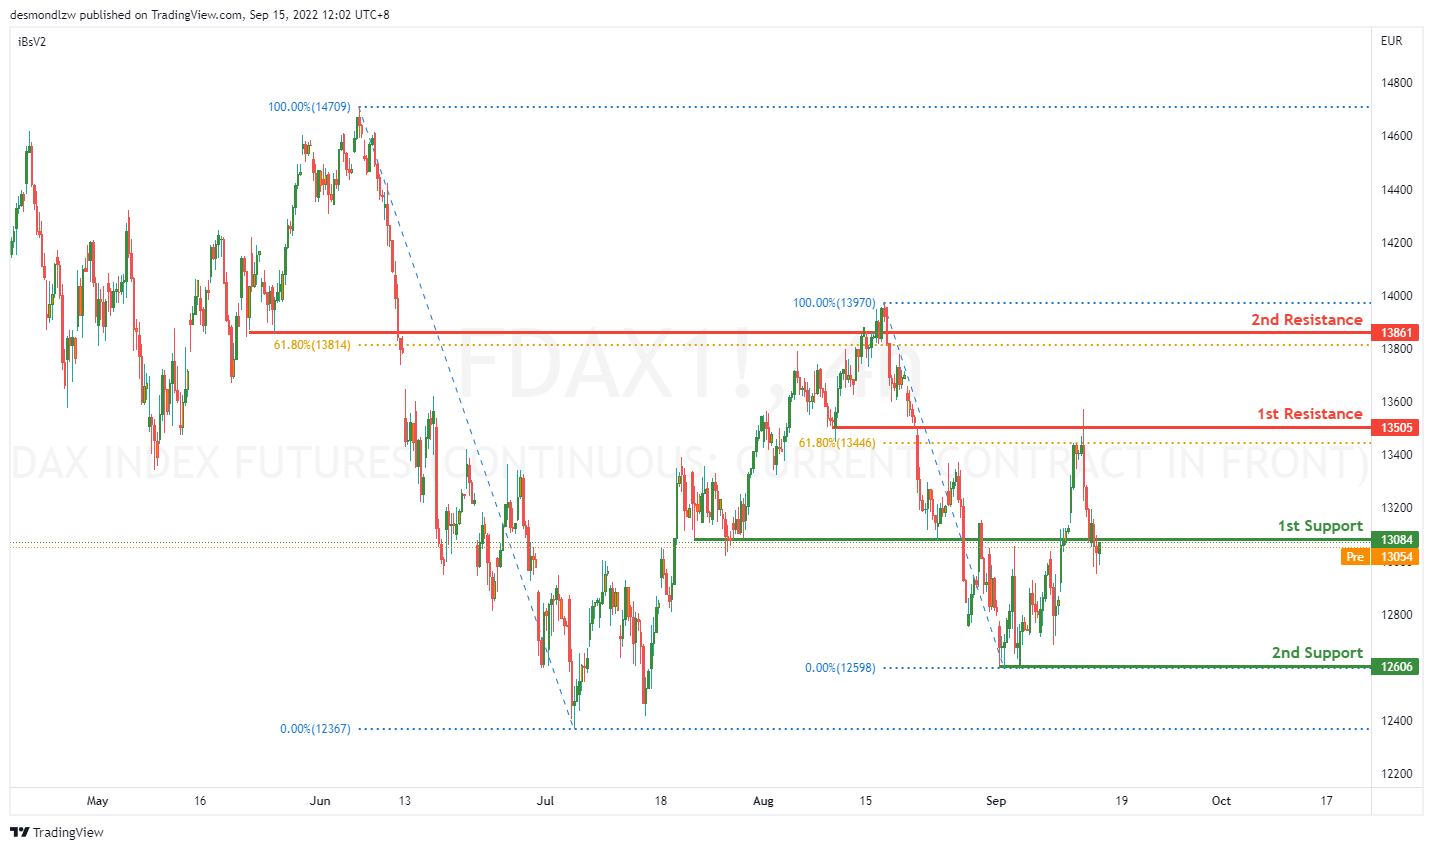
DAX:
On the H4, price has reflected of the first resistance at 13505 where the 61.8% retracement is and got a big reaction breaking through the first support at 13084. Price might continue going down towards the second support at 12606 where the swing low is.
Areas of consideration:
- H4 time frame, 1st support at 13084
- H4 time frame, 2nd support at 12606
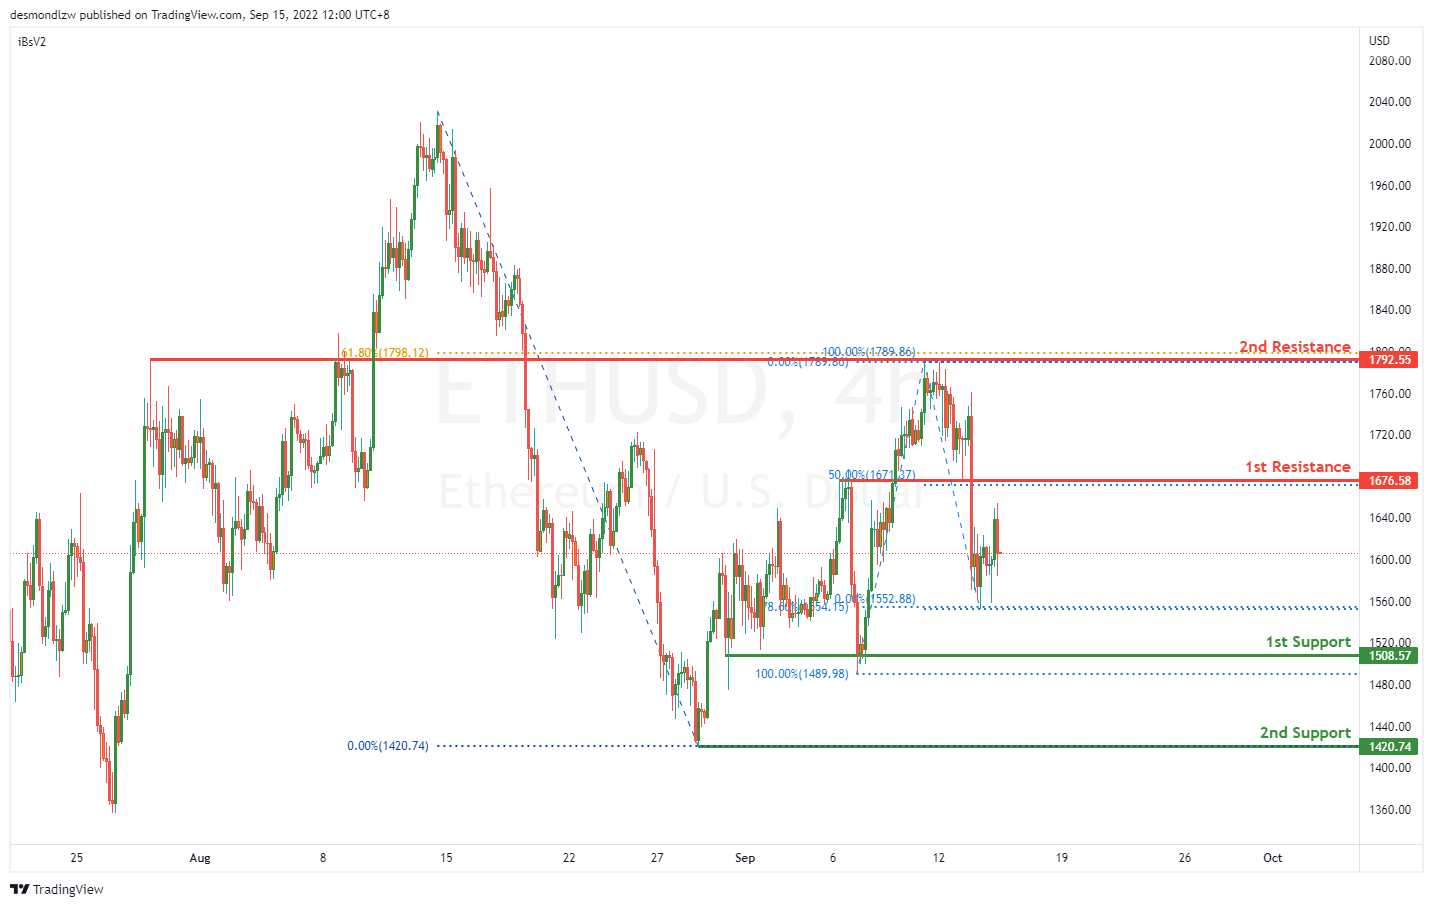
ETHUSD:
On the H4, price has reflected off the second resistance at 1789.8 where the 61.8% Fibonacci level is and pulled back hence we are currently bearish bias. Price look like it’s moving toward the first support at 1508.57 where the previous swing low is at. If bearish momentum continues it should bring price to the second support at 1420.74 where the previous swing low sits. Alternatively price just touched the 78.6% Fibonacci projection at 1554.15, so it could come back to test the first resistance at 1676.58 where the 50% retracement is.
Areas of consideration:
- H4 time frame, 1st resistance of 1676.58
- H4 time frame, 1st support at 1508.57
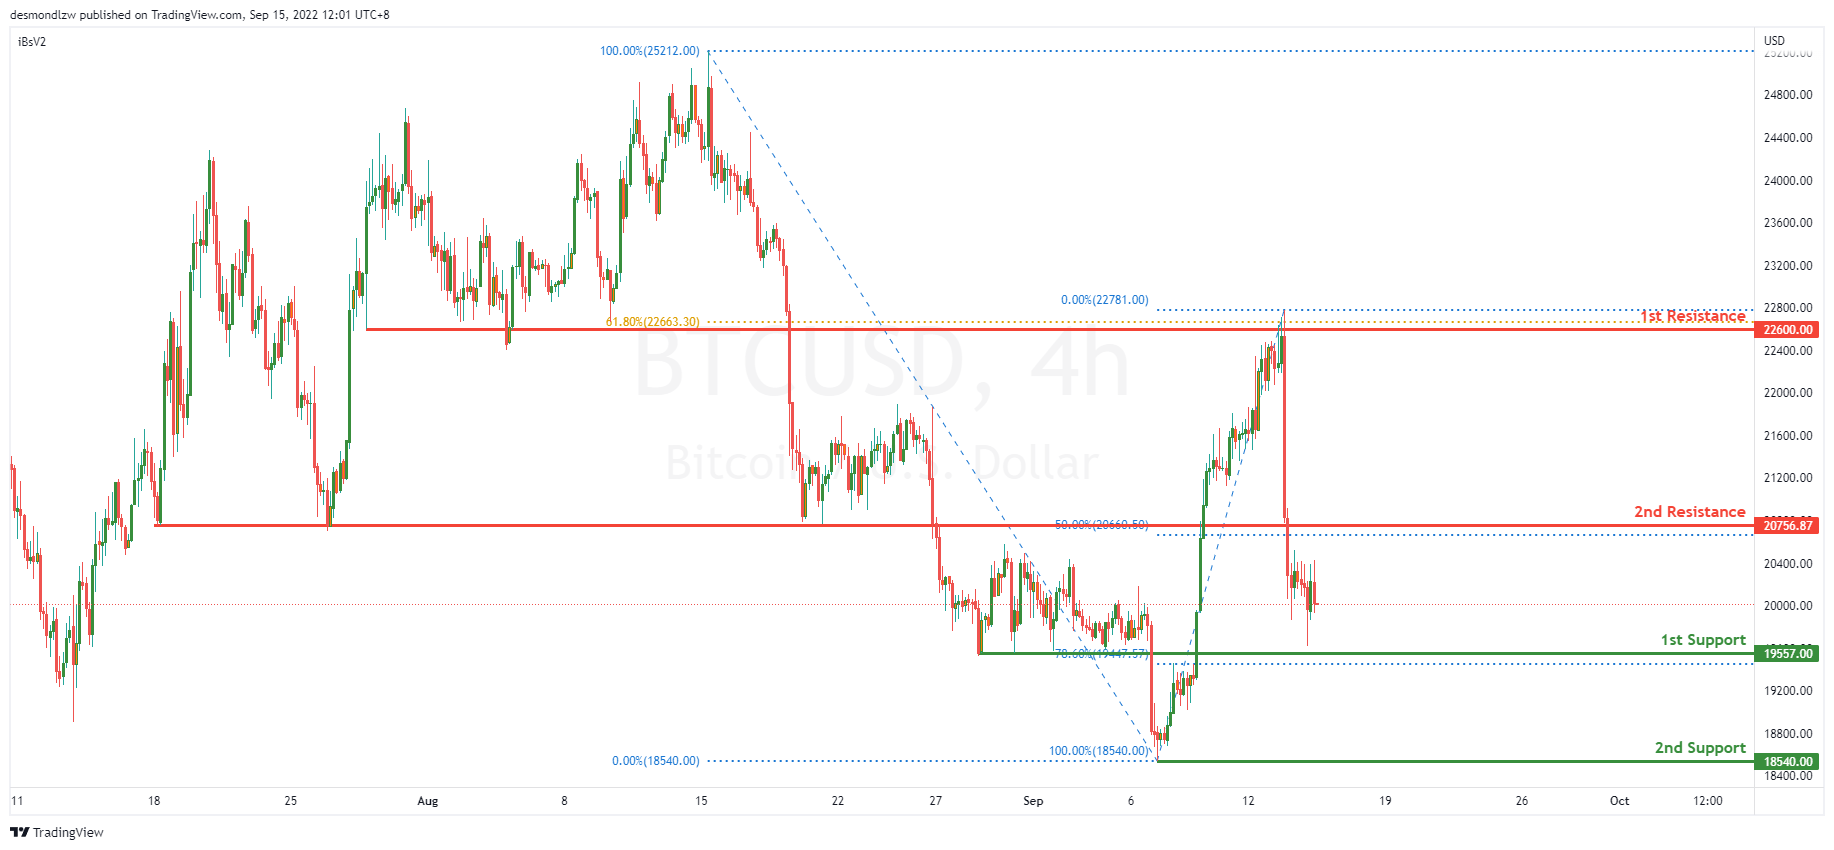
BTCUSD:
On the H4, price reflected off the first resistance at 22600.00, broke past the second resistance at 20756.87 and is moving in a bearish momentum hence we are bearish. Price is moving toward the first support at 19557.00 where the 78.6% retracement sits. If bearish momentum continues, it should bring price to the second support 18540.00 where the previous swing low sits. Alternatively, price could pull back to test the second resistance at 20756.87 where the 50% retracement is.
Areas of consideration:
- H4 time frame, 1st resistance of 22600.00
- H4 time frame, 1st support at 19557.00
S&P 500:
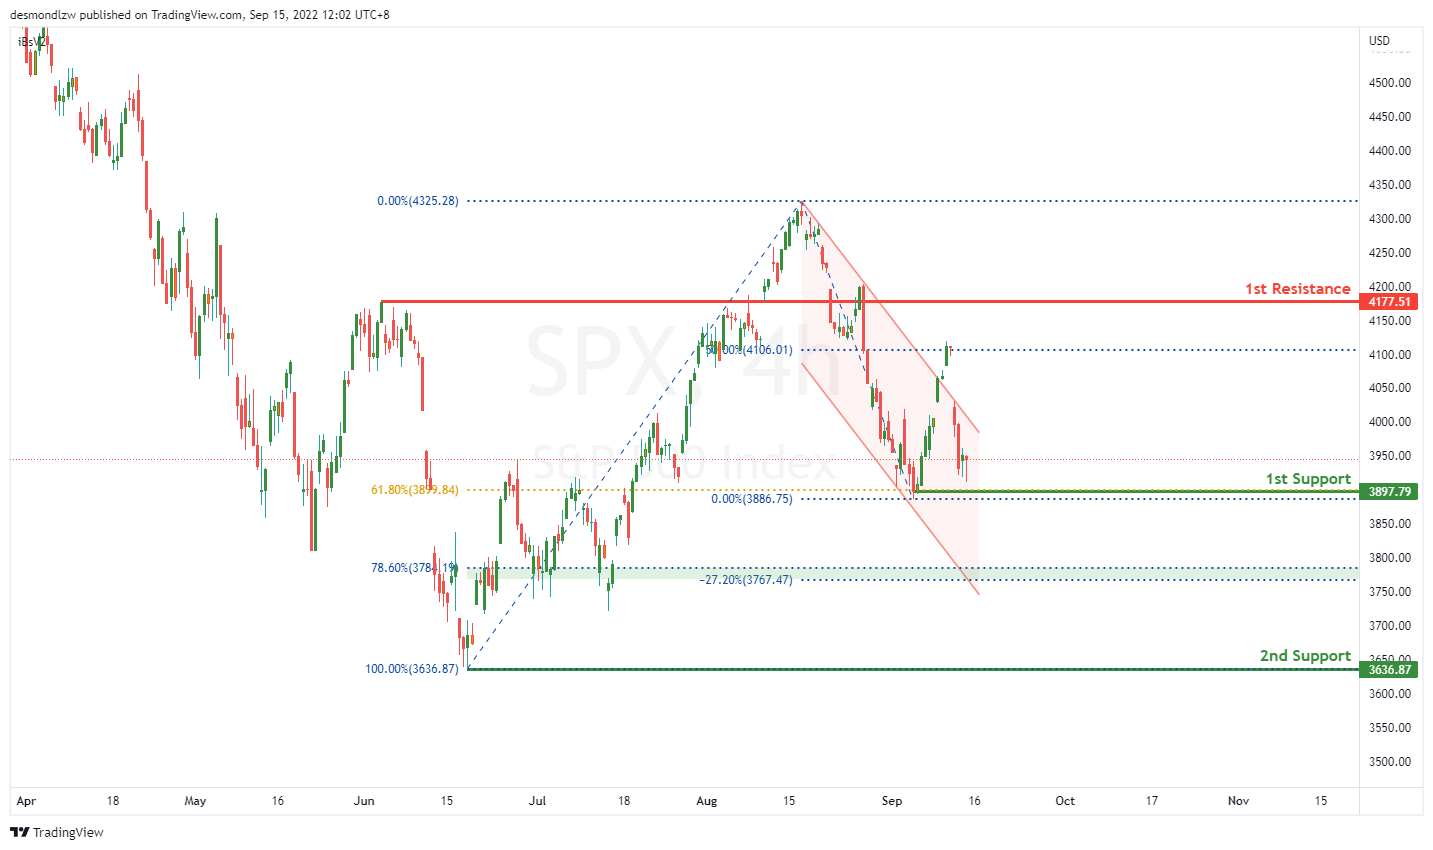
On the H4, the price reversed from the 4100 price area forming a bearish channel, with the price falling towards the 1st support are of 3900. With our bearish bias still valid, as price trades back towards the 61.8% Fibonacci retracement, look for price to test the 1st support area. If the price breaks below the 1st support level, the price could fall towards the 78.6% Fibonacci retracement level of 3784.19. There could be some pullback up towards the 1st Support level area else it could head towards the 2nd support of 3636.87. As the price falls towards the 2nd support, it could find some pullback towards the 78.6% Fibonacci retracement pullback support area.
Areas of consideration:
- H4 time frame, 1st support at 3900
- H4 time frame, 2nd support at 3636.87
EUR/USD Daily Outlook
Daily Pivots: (S1) 0.9949; (P) 0.9986; (R1) 1.0017; More...
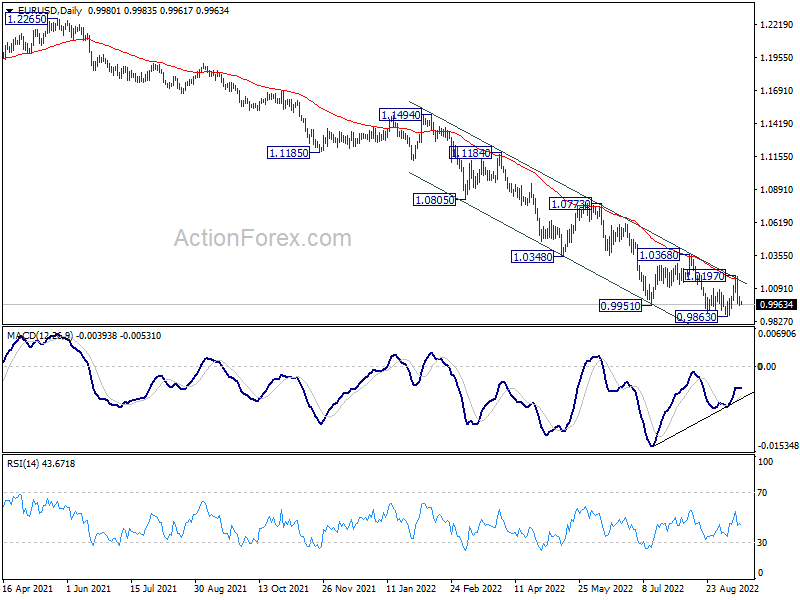
No change in EUR/USD's outlook and intraday bias stays mildly on the downside for retesting 0.9863 low first. Firm break there will resume larger down trend. On the upside, break of 1.0197 resistance will now raise the chance of larger trend reversal, and target 1.0368 resistance.
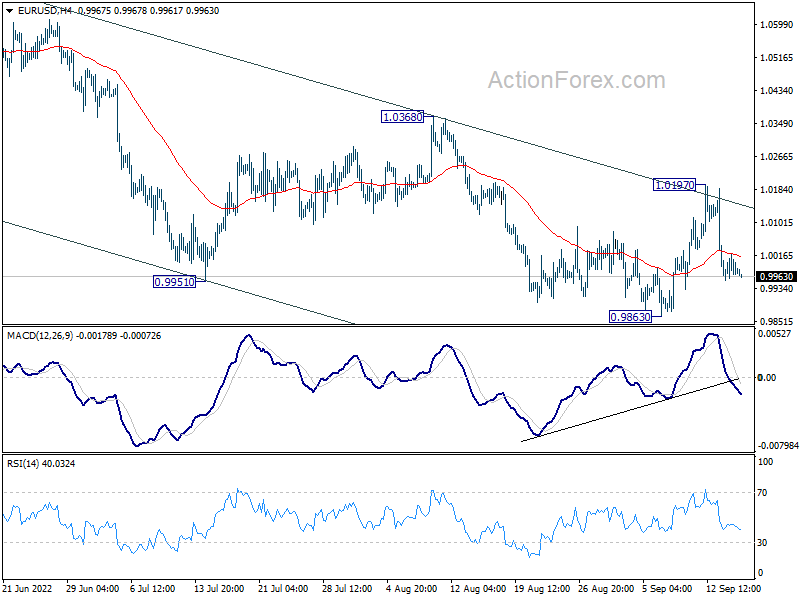
In the bigger picture, down trend from 1.6039 (2008 high) is still in progress. Next target is 100% projection of 1.3993 to 1.0339 from 1.2348 at 0.8694. In any case, outlook will stay bearish as long as 1.0368 resistance holds, in case of strong rebound. However, firm break of 1.0368 will confirm medium term bottom at 0.9863 already.