Sample Category Title
USD/JPY Mid-Day Outlook
Daily Pivots: (S1) 142.17; (P) 143.56; (R1) 144.57; More...
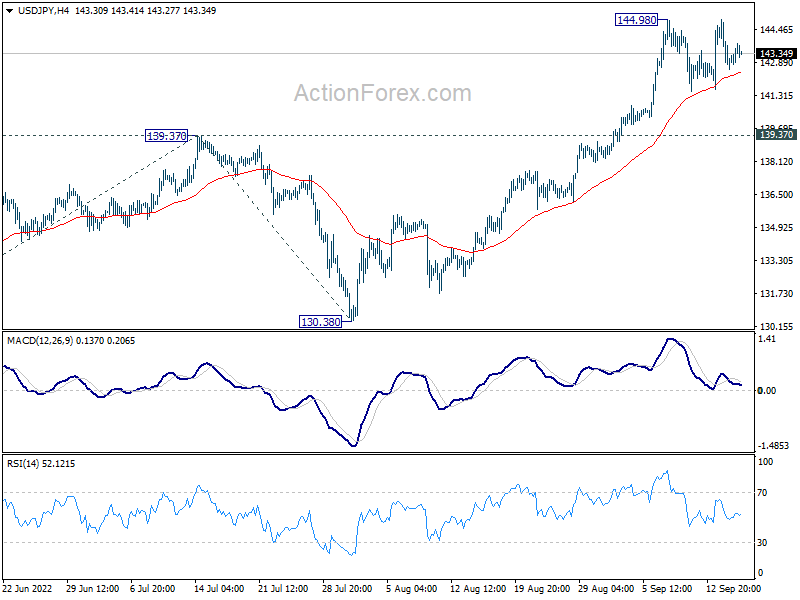
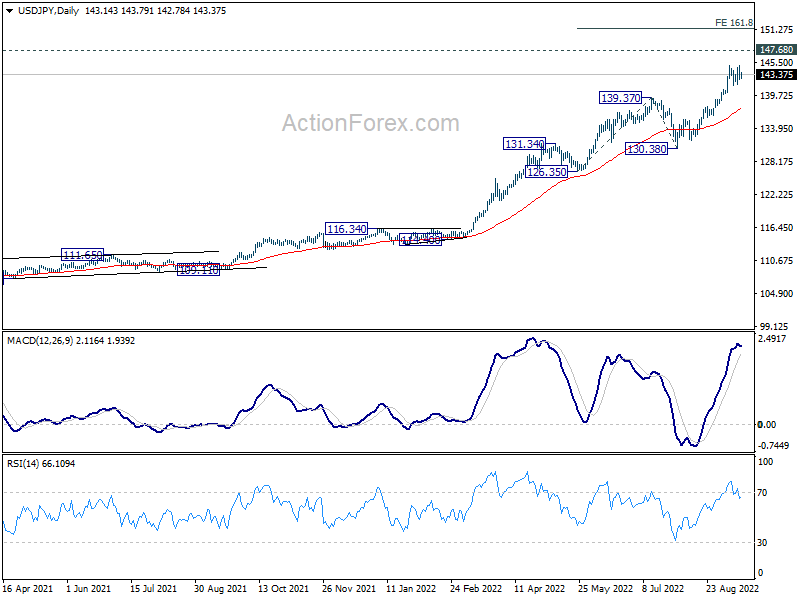
Range trading continues in USD/JPY and intraday bias stays neutral first. While deeper retreat cannot be ruled out, downside should be contained by 139.37 resistance turned support. On the upside, break of 144.98 will resume larger up trend to 147.68 long term resistance. Break there will target 161.8% projection of 126.35 to 139.37 from 130.38 at 151.44 next.
In the bigger picture, up trend from 101.18 is still in progress, as part of the whole up trend from 75.56 (2011 low). Further rise should be seen to 147.68 (1998 high). For now, break of 130.38 support is needed to be the first indication of medium term topping. Otherwise, outlook will stay bullish even in case of deep pull back.
Dollar Shrugs Mixed Retail Sales, GBP/CHF Breaks Pandemic Low
Dollar is staying largely in range after mixed retail sales data from the US. Today's focus turns to selloff in Sterling, in particular against Swiss Franc and Euro. Yen weakens mildly after yesterday's rebound quickly lost momentum. Commodity currencies are trading on the soft side. In other markets, major European indexes are mixed while US futures are nearly flat. Gold is back pressing key support level at around 1680. WTI crude oil is range bound.
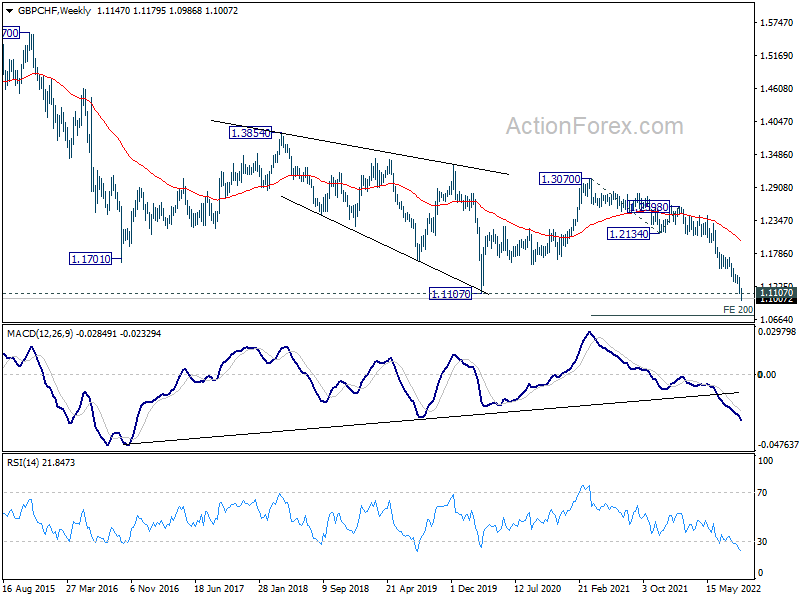
Technically, GBP/CHF break through pandemic low at 1.1107 this week and it's accelerating slightly. Next target is 200% projection of 1.3070 to 1.2134 from 1.2598 at 1.0726. The question is whether EUR/CHF would accelerate downward below 0.9550 low as down trend resumes. Or, EUR/GBP would finally break through 0.8721 resistance will strength to resume the rally from 0.8201.
In Europe, at the time of writing, FTSE is up 0.30%. DAX is down -0.17%. CAC is down -0.64%. Germany 10-year yield is down -0.007 at 1.709. Earlier in Asia, Nikkei rose 0.21%. Hong Kong HSI rose 0.44%. China Shanghai SSE dropped -1.16%. Singapore Strait Times rose 0.31%. Japan 10-year JGB yield dropped -0.0008 to 0.257.
US retail sales rose 0.3% mom in Aug, ex-auto sales down -0.3% mom
US retail sales rose 0.3% mom to USD 683.3B in August, above expectation of 0.0% mom. Ex-auto sales dropped -0.3% mom, below expectation of 0.0% mom. Ex-gasoline sales rose 0.8% mom. Ex-auto, ex-gasoline sales rose 0.3% mom.
Comparing with a year ago, total sales rose 9.1% yoy. Total sales for June through August were up 9.3% from the same period a year ago.
US initial jobless claims dropped to 213k
US initial jobless claims dropped -5k to 213k in the week ending September 10, below expectation of 227k. Four-week moving average of initial claims dropped -8k to 224k. Continuing claims rose 2k to 1403k in the week ending September 3. Four-week moving average of continuing claims dropped -7.75k to 1413k.
Also released, import price index dropped -1.0% mom in August. Empire State manufacturing index improved from -31.3 to -1.5. Philly Fed survey dropped from 6.2 to -9.9.
ECB de Guindos: Determined action essential to keep inflation expectations anchored
ECB Vice-President Luis de Guindos said in a speech, "monetary policy needs to be focused on price stability and on delivering our inflation target over the medium term. Determined action is essential to keep inflation expectations anchored, which in itself contributes to delivering price stability and avoids second-round effects in inflation. The main asset that central banks have is credibility, and this asset becomes even more important in times of high uncertainty."
On the economy, de Guindos said, "A period of heightened uncertainty is here to stay for a while, rendering decision-making more complex. Output growth is slowing down substantially and is expected to stagnate around year-end and remain low next year at less than 1%, while risks have intensified on the downside. This is set against a deteriorating inflation outlook with record-high inflation rates expected to stay elevated, well above our target, with risks primarily on the upside."
Eurozone exports rose 13.3% yoy in Jul, imports surged 44.0% yoy
Eurozone exports of goods rose 13.3% yoy to EUR 235.5B in July. Imports rose 44.0% yoy to EUR 269.5B. Trade deficit with the rest of the world came in at EUR -34B. Intra-Eurozone trade rose 24.0% yoy to EUR 224.8B.
In seasonally adjusted term, Eurozone exports dropped -1.7% mom to EUR 236.7B. Imports rose 1.5% mom to EUR 277.0B. Trade deficit widened to EUR -40.3B, larger than expectation of EUR -32.5B. Intra-Eurozone trade rose from EUR 225.1B to EUR 229.3B.
Japan reports record monthly trade deficit, on record increase in imports
Japan exports rose 22.1% yoy to JPY 8062B in August, driven by shipments of auto and chip-related equipment. Imports rose 49.9% yoy to JPY 10879B. That's the largest increase by value on record, since data became available back in 1979. The rise was driven by higher prices for energy including crude oil, coal, and LNG.
Trade deficit came in at JPY -2817B. That's the largest monthly trade deficit on record. That's also the 13th straight month of year-on-year trade shortfalls.
In seasonally adjusted term, exports dropped -0.7% mom to JPY 8379B. Imports rose 1.5% to JPY 10750B. Trade deficit came in at JPY -2371B.
Australia employment rose 33.5k in Aug, unemployment rate ticked up to 3.5%
Australia employment rose 33.5k in August, slightly smaller than expectation of 35.5k. Full-time jobs rose 58.8k while part-time jobs decreased -25.3k.
Unemployment rate ticked up from 3.4% to 3.5%, above expectation of 3.4%. Participation rate rose 0.2% from 66.4% to 66.6%. Monthly hours worked rose 0.8% mom.
New Zealand GDP grew 1.7% qoq in Q2, driven by services
New Zealand GDP grew 1.7% qoq in Q2, above expectation of 1.0% qoq, following a -0.2% qoq decline in Q1. Service industries rose 2.7% but goods producing industries dropped -3.8%. Primary industries rose 0.2%.
"The reopening of borders, easing of both domestic and international travel restrictions, and fewer domestic restrictions under the Orange traffic light setting supported growth in industries that had been most affected by the COVID-19 response measures," national accounts – industry and production senior manager Ruvani Ratnayake said.
"In the June 2022 quarter, households and international visitors spent more on transport, accommodation, eating out, and sports and recreational activities."
USD/JPY Mid-Day Outlook
Daily Pivots: (S1) 142.17; (P) 143.56; (R1) 144.57; More...
Range trading continues in USD/JPY and intraday bias stays neutral first. While deeper retreat cannot be ruled out, downside should be contained by 139.37 resistance turned support. On the upside, break of 144.98 will resume larger up trend to 147.68 long term resistance. Break there will target 161.8% projection of 126.35 to 139.37 from 130.38 at 151.44 next.
In the bigger picture, up trend from 101.18 is still in progress, as part of the whole up trend from 75.56 (2011 low). Further rise should be seen to 147.68 (1998 high). For now, break of 130.38 support is needed to be the first indication of medium term topping. Otherwise, outlook will stay bullish even in case of deep pull back.
Economic Indicators Update
| GMT | Ccy | Events | Actual | Forecast | Previous | Revised |
|---|---|---|---|---|---|---|
| 22:45 | NZD | GDP Q/Q Q2 | 1.70% | 1.00% | -0.20% | |
| 23:50 | JPY | Trade Balance (JPY) Aug | -2.37T | -2.08T | -2.13T | -2.16T |
| 01:00 | AUD | Consumer Inflation Expectations Sep | 5.40% | 5.90% | ||
| 01:30 | AUD | Employment Change Aug | 33.5K | 35.5K | -40.9K | |
| 01:30 | AUD | Unemployment Rate Aug | 3.50% | 3.40% | 3.40% | |
| 04:30 | JPY | Tertiary Industry Index M/M Jul | -0.60% | -0.10% | -0.20% | |
| 09:00 | EUR | Eurozone Trade Balance (EUR) Jul | -32.5B | -30.8B | ||
| 12:30 | USD | Initial Jobless Claims (Sep 9) | 227K | 222K | ||
| 12:30 | USD | Retail Sales M/M Aug | 0.00% | 0.00% | ||
| 12:30 | USD | Retail Sales ex Autos M/M Aug | 0.00% | 0.40% | ||
| 12:30 | USD | Import Price Index M/M Aug | -1.20% | -1.40% | ||
| 12:30 | USD | Empire State Manufacturing Index Sep | -15.25 | -31.3 | ||
| 12:30 | USD | Philadelphia Fed Manufacturing Survey Sep | 2.5 | 6.2 | ||
| 13:15 | USD | Industrial Production M/M Aug | 0.20% | 0.60% | ||
| 14:00 | USD | Business Inventories Jul | 0.80% | 1.40% | ||
| 14:30 | USD | Natural Gas Storage | 71B | 54B |
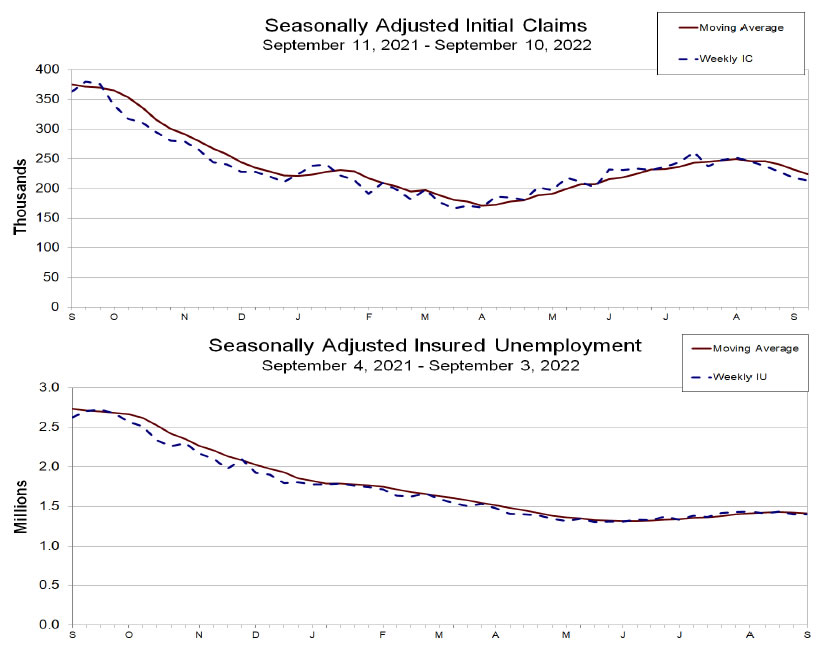
US initial jobless claims dropped to 213k
US initial jobless claims dropped -5k to 213k in the week ending September 10, below expectation of 227k. Four-week moving average of initial claims dropped -8k to 224k.
Continuing claims rose 2k to 1403k in the week ending September 3. Four-week moving average of continuing claims dropped -7.75k to 1413k.
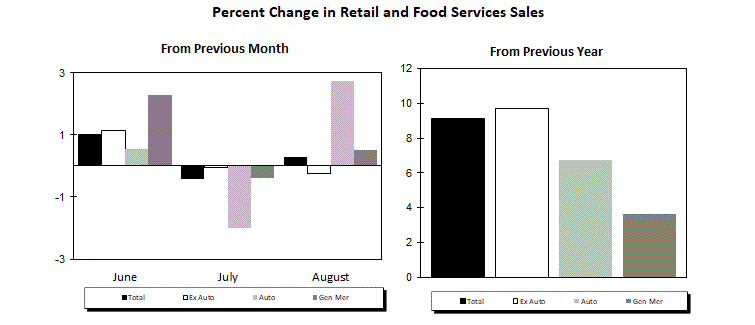
US retail sales rose 0.3% mom in Aug, ex-auto sales down -0.3% mom
US retail sales rose 0.3% mom to USD 683.3B in August, above expectation of 0.0% mom. Ex-auto sales dropped -0.3% mom, below expectation of 0.0% mom. Ex-gasoline sales rose 0.8% mom. Ex-auto, ex-gasoline sales rose 0.3% mom.
Comparing with a year ago, total sales rose 9.1% yoy. Total sales for June through August were up 9.3% from the same period a year ago.
Can the EU’s Energy Plan Rescue the Euro from the Doldrums?
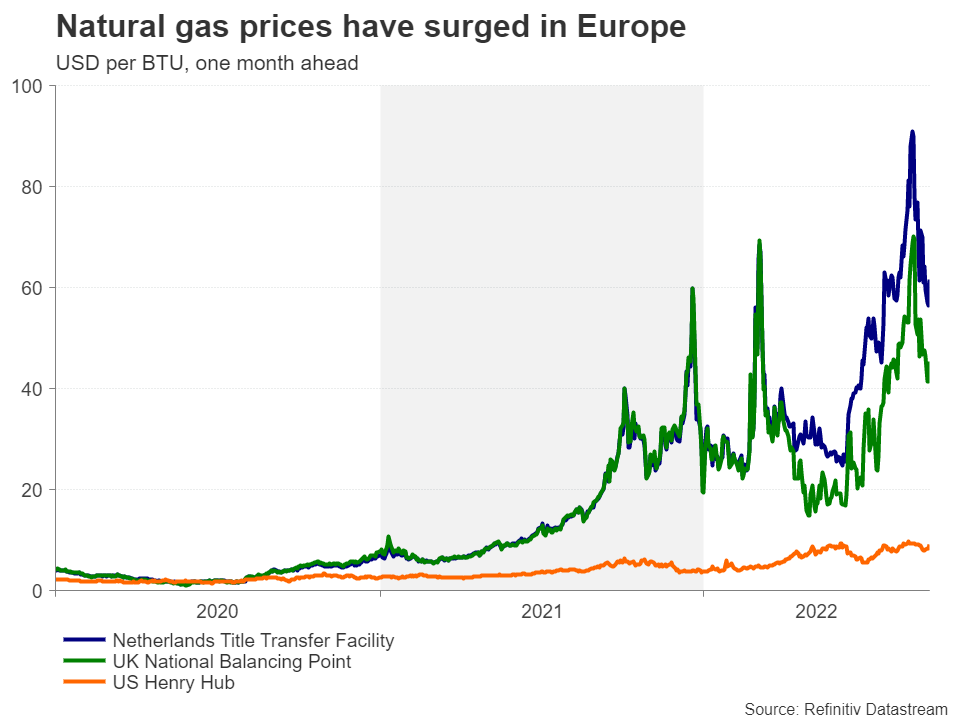
The euro has been besieged on several fronts this year. Having already been on the backfoot due to the widening monetary policy divergence with the United States, the euro then had to contend with the immediate fallout of the war in Ukraine as harsh sanctions were slapped on Russia. But it is the ensuing energy crisis that now poses the biggest threat to the single currency as Europe is heading towards what could be the bleakest winter since the end of World War II. However, the European Union’s proposals to ease the pain of the energy crunch have offered some hope that an economic catastrophe can be averted.
On the backfoot
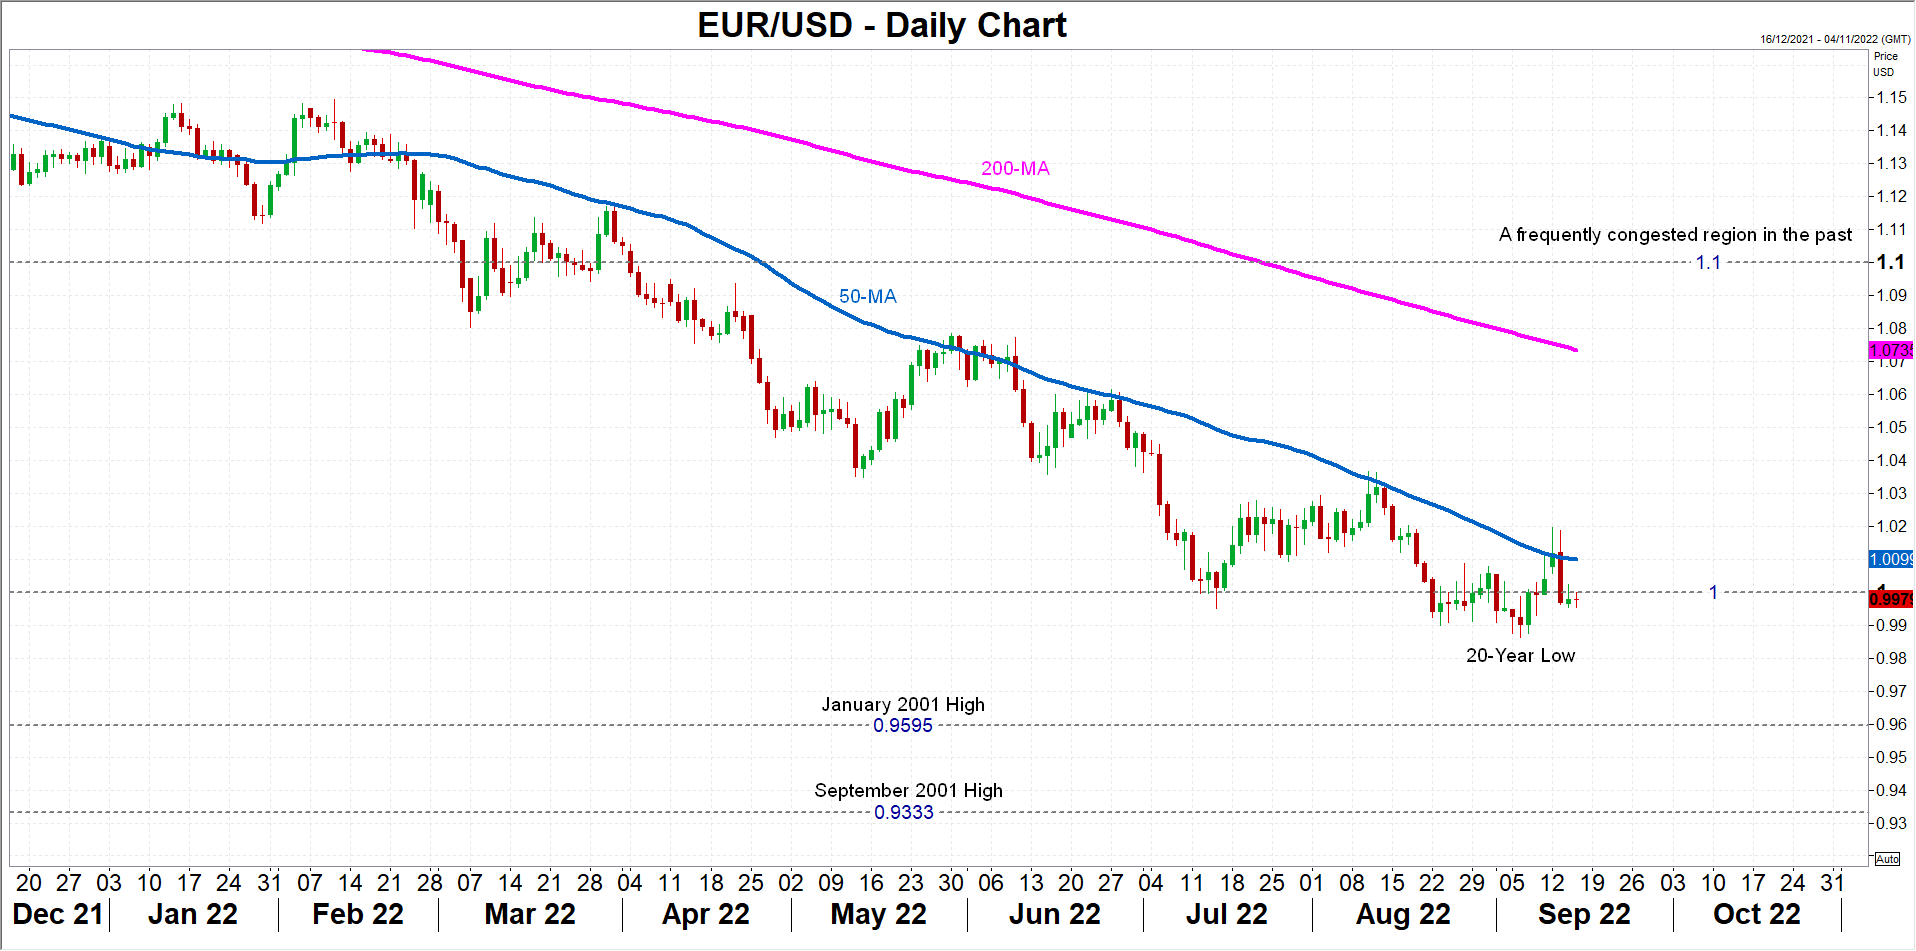
Although the euro does not have the misfortune of holding the title of the worst performing currency, it has nonetheless lost about 12% of its value against the US dollar in the year-to-date, extending the 8% decline from 2021. Hence, it was inevitable that it would reach parity sooner or later and the pair has been repeatedly testing that region for the past month. Much of the weakness can be attributed to dollar strength as the Fed has out-hawked the European Central Bank at every turn ever since the era of pandemic stimulus drew to a close.
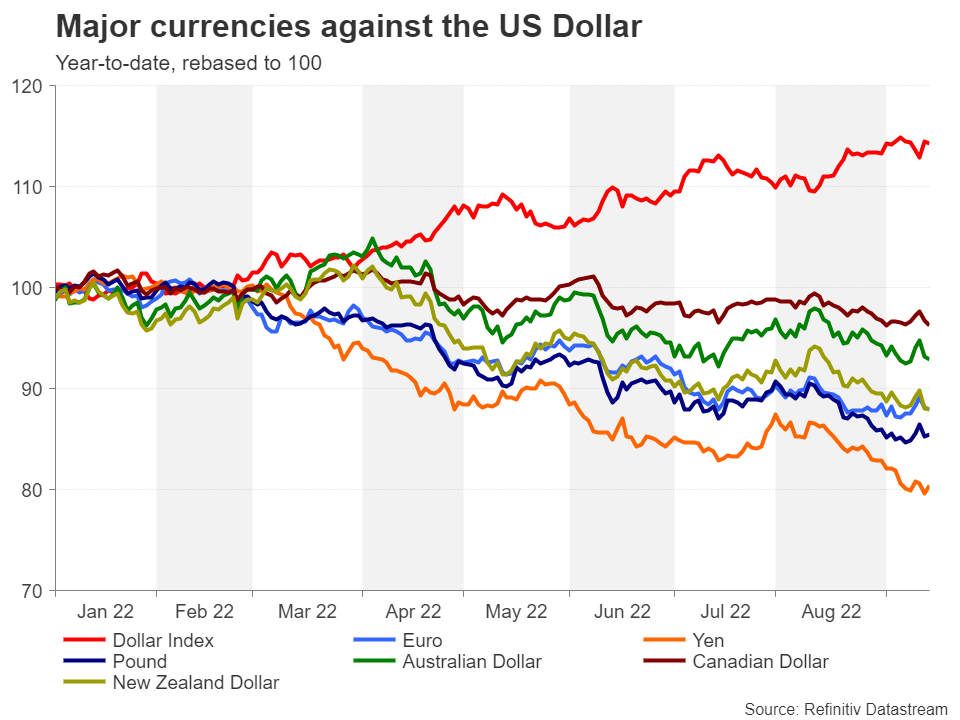
However, Europe’s economic troubles keep piling up and investors are increasingly gloomy about the outlook. Decades-high inflation has forced the ECB to hike interest rates at a time when households are being squeezed from the soaring cost of living, while businesses – still reeling from supply chain disruptions – face rising borrowing costs. But the situation escalated after Russia began to slowly turn off the gas taps to Europe.
Solving the gas crisis
Prior to the Ukraine conflict, Russia was Europe’s largest source of natural gas, supplying about 40% of its needs. But that share has fallen to just 9%, partly because European governments have been trying to wean off Russian gas and partly because Moscow has decided to use its exports as leverage to get the sanctions lifted by restricting the supplies that flow through the various pipelines from Russia.
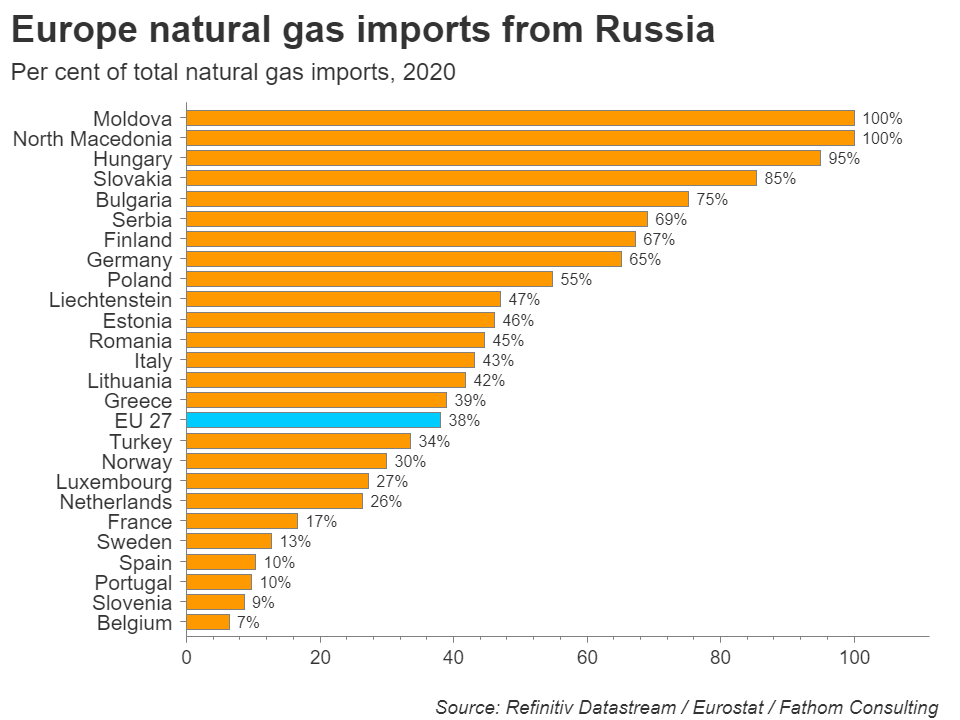
With the war unlikely to end anytime soon and the sanctions against Russia having failed to cripple its economy as intended, Moscow is in a position to maintain pressure on its European neighbors. So what does the EU plan to do about it?
Energy rationing is on the cards
The European Commission has announced a series of proposals to be discussed by member states at a summit on September 30. The EU wants to cap the revenue of non-gas electricity generators such as wind, solar and nuclear plants at 180 euros per megawatt. In addition, the Commission is proposing a windfall tax on fossil fuel producers. The proceeds in both cases would be redistributed to member states to be used as funds to support the most vulnerable households and businesses.
Moreover, the EU wants countries to reduce electricity consumption by at least 5% during peak hours and is also considering offering emergency credit lines to energy companies that are having liquidity problems.
However, plans for a price cap on Russian gas appear to have been shelved as there’s unlikely to be any agreement on it as some member states are worried this could prompt Moscow to completely cut off all gas flows to Europe.
Time is running out
With none of the above proposals involving a direct reduction in electricity bills and the decision on how the funds will be used to be up to individual member states, there are some doubts as to how effective these measures will be. This is assuming also that they don’t subsequently get watered down before they are finalized by EU leaders, who are not expected to approve the package before the European Council meeting on October 20-21.
Undoubtedly, investors are worried that time is running out for a meaningful response before the colder months set in.
Recession seems likely in Germany
Europe’s powerhouse – Germany – is already showing signs of strain. Its economy grew by just 0.1% in the second quarter and business sentiment has plunged since March. The uncertainty generated by the war in Ukraine, surging raw material and energy costs, rising interest rates, and now, a slowdown in its main trading partner China have dealt a huge blow to German exporters.
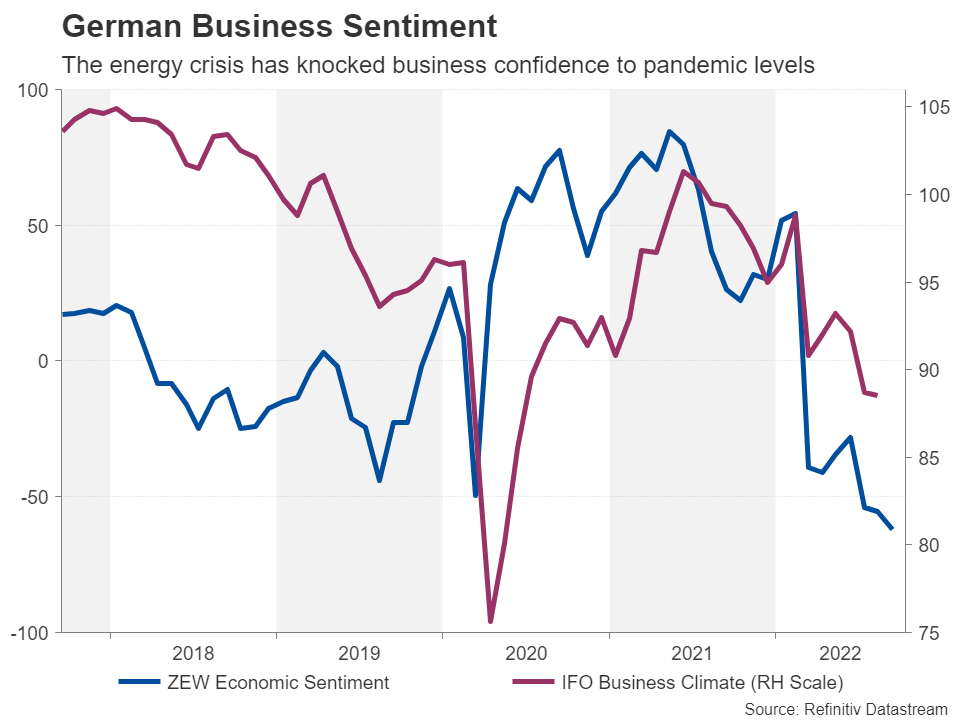
Against this backdrop, Germany is in bigger danger of a recession than other Eurozone countries and given that its economic outlook has a greater weighting in pricing risk and shaping sentiment towards the euro, it’s no wonder there is so much pessimism surrounding the currency.
Euro is staring down below parity
Making matters worse is fresh evidence that inflation in America is proving even stickier than anticipated, which can only translate to the Fed staying hawkish for longer. Unless the EU is able to put together an energy package that not only goes far enough in addressing the squeeze on customers from skyrocketing electricity bills but can also be enacted quickly and effectively, the euro will probably struggle to turn its fortunes around.
If the euro stays in its bearish trajectory, the next downward phase could see the peaks of 0.9595 from January 2001 and 0.9333 from September 2001 being revisited.
Can Europe avoid freezing this winter?
However, despite the odds now being stacked so decisively against the euro and even if the EU’s energy plan were to boost the Eurozone economy only marginally, the storm clouds may clear up a lot sooner than many are anticipating.
For one, gas storage facilities across Europe are currently filled at 84% capacity, which is above the average level of this time of the year. Although this may still not be sufficient for Europe to get through the winter if it’s a very cold one, it does provide hope that the situation might not turn out to be as dire as is being feared.
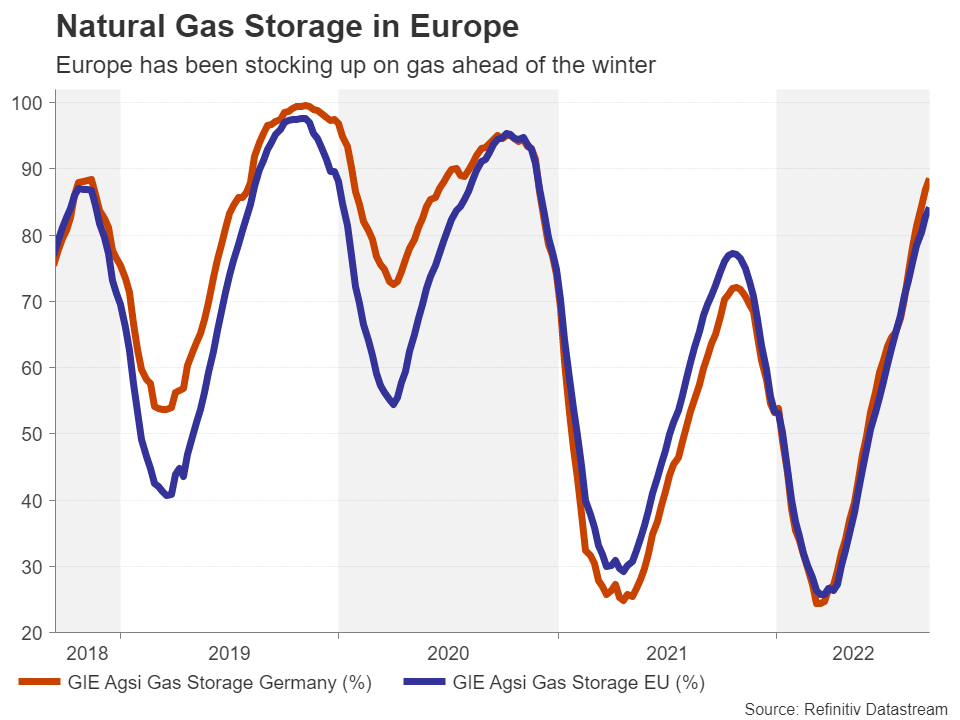
It’s also worth keeping in mind that part of the reason for such high natural gas prices at the moment is that all countries are rushing to secure supplies before winter arrives and once that wave passes and barring any further restrictions from Russia, there is potential for prices to tumble quite dramatically from current levels.
Energy crunch could last years
The euro’s other best hope of course is that inflation in the US does finally begin to drop more substantially in the next few months and the Fed’s tightening cycle comes to an earlier end. This could secure the euro a foothold above parity and in a more bullish outcome, help it stabilize in the historically popular region around $1.10.
But even if doomsday never comes and blackouts are avoided this winter, triggering some sort of a relief rally for the euro, the energy crunch will not necessarily be over. Europe could find itself in exactly the same predicament next winter if Russian supply is not restored. Much will depend on how quickly the EU is able to substitute gas with alternative sources of energy as well as beef up its infrastructure to increase storage capacity and handle more seaborne liquified natural gas.
Australian Dollar Yawns after Jobs Report
The Australian dollar is showing little movement today after the solid Australian employment report.
Australian employment rebounds
The Australian labour market remains resilient, as indicated by a solid August employment report. The increase in employment of 33.5 thousand was very close to the consensus of 35 thousand, with the gain of 58.8 thousand full-time jobs especially impressive. The release was within expectations and the Australian dollar’s response has been muted. The unemployment rate ticked higher to 3.5%, up from 3.4%.
The employment data likely will not change things for the RBA, which meets on October 6th. The RBA has delivered 50bp rate hikes four straight times, but may be looking to ease its tightening and guide the economy to a soft landing. If the RBA needs an excuse to hike by 25bp, it could hang its hat on the slight rise in the unemployment rate.
Australia’s Inflation Expectations slowed to 5.4% in August, marking a third consecutive decline. This is a dose of good news for the RBA, which wants to ensure that inflation expectations do not become unanchored in an environment of red-hot inflation.
In the US, the August inflation report resulted in plenty of volatility, as stock markets fell sharply before recovering. The US dollar rose sharply after inflation came in at 8.3%, higher than the forecast of 8.1%. The markets have been forced to recalibrate after assuming that inflation had peaked and the Fed would make a U-turn on policy. The Fed has been consistent in its hawkish message, and it seems that the markets are finally listening. The FOMC is expected to raise rates by 75bp, with market pricing showing plenty of fluctuation. Currently, there is a 74% likelihood of a 75bp increase, with a 26% of a massive 100pt hike. Gone is the anticipation of a “modest” 50bp rise, as the Fed is expected to continue to stay aggressive until inflation shows unmistakable signs that it has peaked and is moving lower. The Fed is saying that inflation will be brought down to the 2% target in 2023, but it looks like the road to low inflation will have bumps along the way, as the battle with inflation has been difficult and that is likely to continue to be the case.
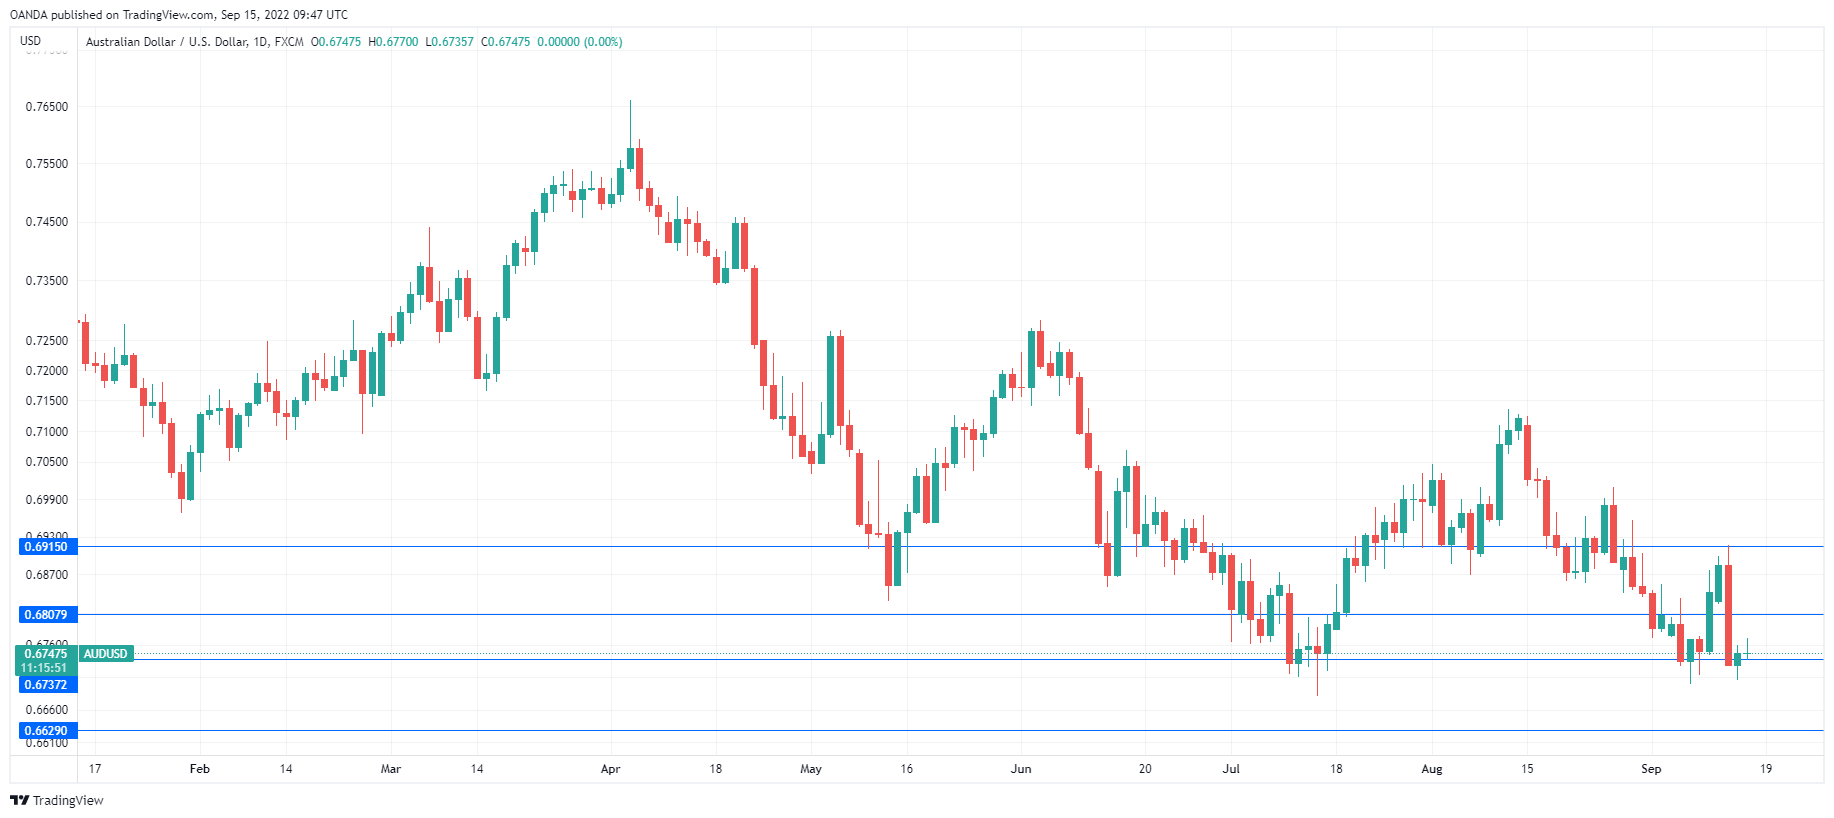
AUD/USD Technical
- AUD/USD has weak support at 0.6737, followed by support at 0.6629
- There is resistance at 0.6807 and 0.6915
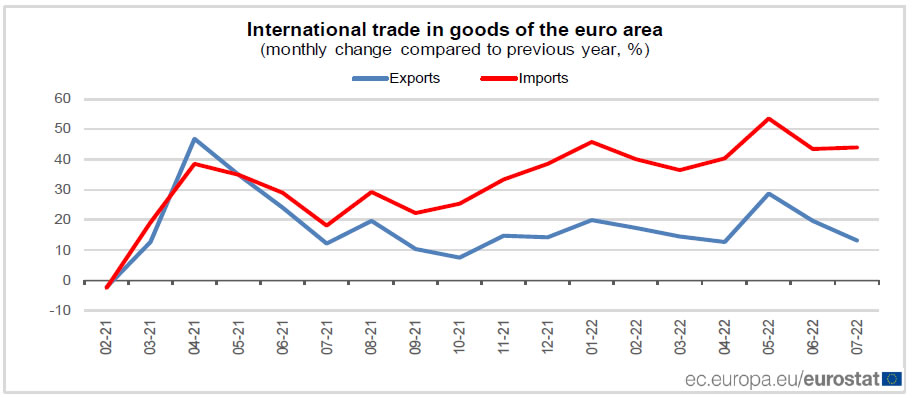
Eurozone exports rose 13.3% yoy in Jul, imports surged 44.0% yoy
Eurozone exports of goods rose 13.3% yoy to EUR 235.5B in July. Imports rose 44.0% yoy to EUR 269.5B. Trade deficit with the rest of the world came in at EUR -34B. Intra-Eurozone trade rose 24.0% yoy to EUR 224.8B.
In seasonally adjusted term, Eurozone exports dropped -1.7% mom to EUR 236.7B. Imports rose 1.5% mom to EUR 277.0B. Trade deficit widened to EUR -40.3B, larger than expectation of EUR -32.5B. Intra-Eurozone trade rose from EUR 225.1B to EUR 229.3B.
ECB de Guindos: Determined action essential to keep inflation expectations anchored
ECB Vice-President Luis de Guindos said in a speech, "monetary policy needs to be focused on price stability and on delivering our inflation target over the medium term. Determined action is essential to keep inflation expectations anchored, which in itself contributes to delivering price stability and avoids second-round effects in inflation. The main asset that central banks have is credibility, and this asset becomes even more important in times of high uncertainty."
On the economy, de Guindos said, "A period of heightened uncertainty is here to stay for a while, rendering decision-making more complex. Output growth is slowing down substantially and is expected to stagnate around year-end and remain low next year at less than 1%, while risks have intensified on the downside. This is set against a deteriorating inflation outlook with record-high inflation rates expected to stay elevated, well above our target, with risks primarily on the upside."
Bitcoin Won’t Give Up $20K
Market picture
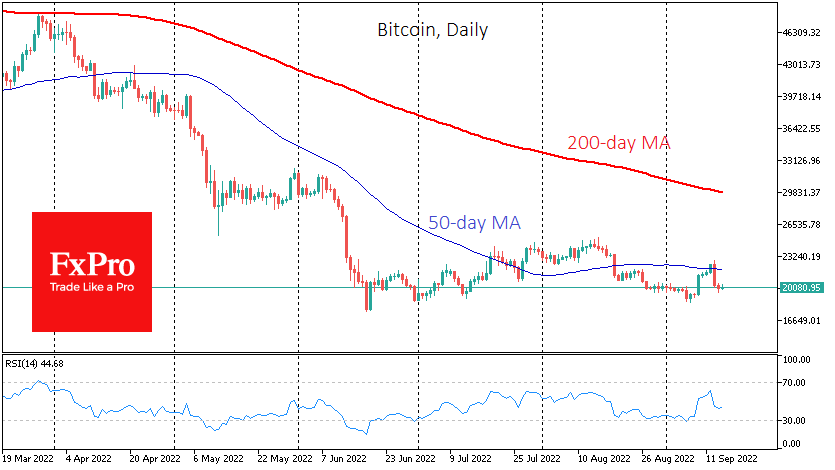
Bitcoin has lost 1.2% in the last 24 hours, trading at $20.1K. The plunge below a meaningful round level late Wednesday afternoon did not last long. Ethereum pulled down 0.3% to $1610 while the crypto community awaits the market’s reaction to The Merge (move to PoS algorithm). We can describe sentiment across the crypto market as a cautious wait-and-see.
Short-term Bitcoin momentum indicates that sellers wanted to swing the market yesterday and snap stop orders at the end of the day, taking advantage of a period of reduced liquidity on Wednesday. As we see, it failed, and BTCUSD returned precisely to where it started its local decline. However, the balance of power is now on the bears’ side, as the global risk demand is suppressed, and critical technical levels (50- and 200-day MA, 200-week MA) are above the price.
News background
Major US companies Charles Schwab, Citadel and Fidelity have announced the launch of digital asset exchange EDX Markets (EDXM), which will be available to retail and institutional investors.
Another recalculation resulted in a 3.45% increase in bitcoin mining complexity to 32.05 trillion hashes, the highest in the network’s history.
Network service provider Cloudflare announced that its gateways support the upcoming transition of the Ethereum network to the Proof-of-Stake (PoS) consensus algorithm on September 15.
Bloomberg Intelligence expert Mike McGlone believes the crypto market will begin a bullish trend after The Merge update. In his opinion, ETH’s move to PoS will have a revolutionary impact on cryptocurrencies and the entire financial system.
Changpeng Zhao, chief executive of cryptocurrency exchange Binance, said the EU’s crypto-asset regulation principles could become the global standard for the entire industry.
Ethereum Quiet Within a Triangle Range
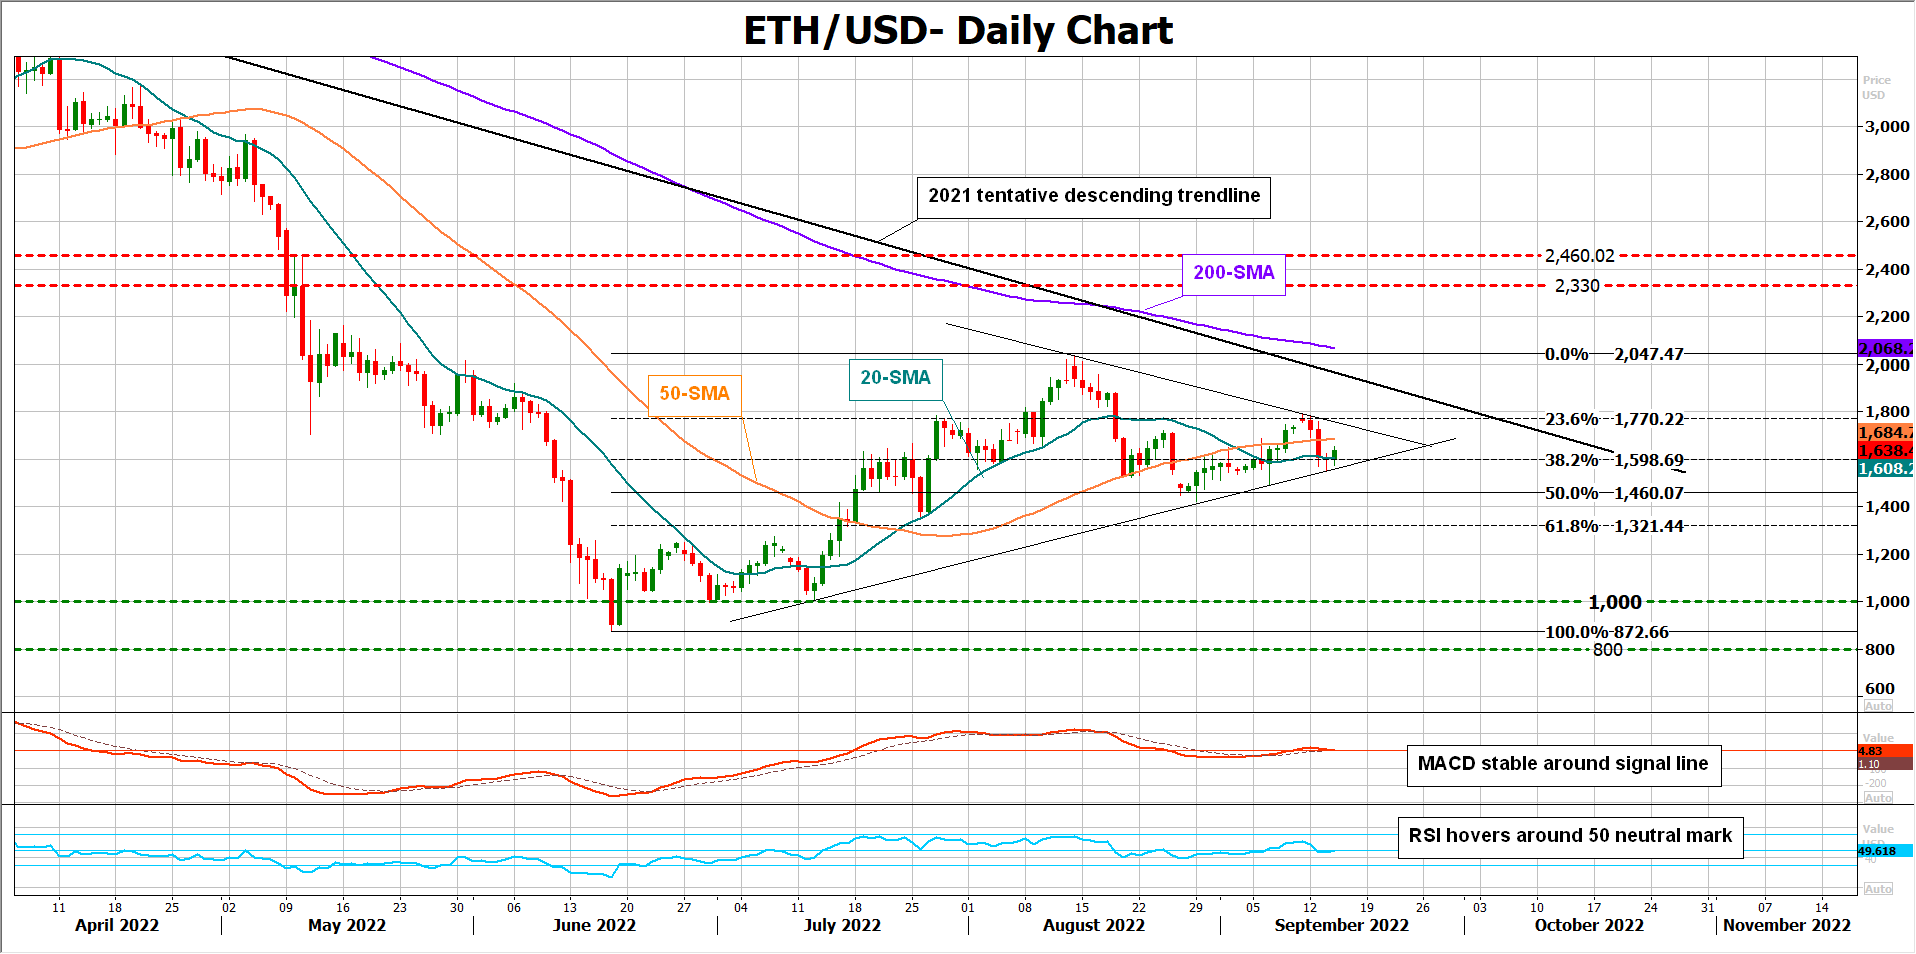
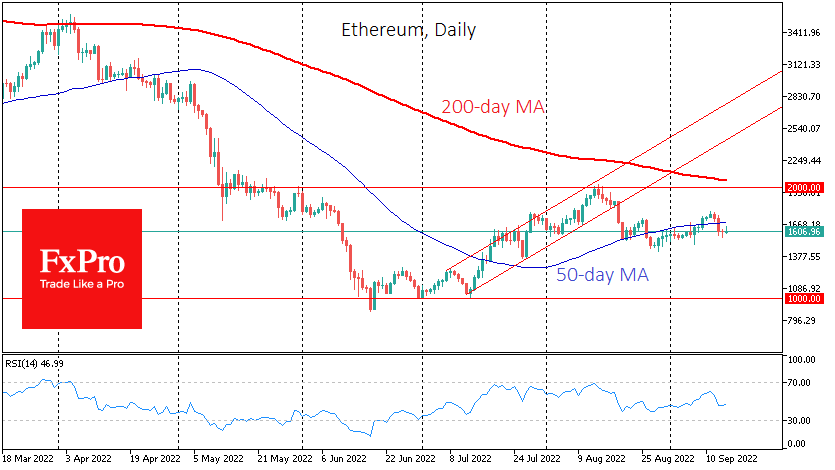
Ethereum (ETHUSD) has been in the red so far this week, gradually retreating after almost touching the 1,800 round level. Despite the soft negative mood, the short-term bias has not switched to the bearish side yet, as the second most popular crypto keeps trading within a symmetrical triangle.
The momentum indicators are also reflecting a wait-and-see attitude among traders given the sideways trajectory in the RSI and the MACD.
The 38.2% Fibonacci retracement of the latest upleg is currently canceling selling pressures around 1,600. If it gets defeated, with the price closing below the triangle, the spotlight will immediately turn to the 50% Fibonacci of 1,460, while the 61.8% Fibonacci of 1,321 could be of greater importance since any violation at this point may directly squeeze the price towards the 1,000 psychological mark. Even lower, the bears will aim for a downtrend resumption below the 800 number.
For the bulls to take the lead, the price will need to advance above the triangle and the 23.6% Fibonacci of 1,770. If that turns out to be the case, all attention will shift to the critical area of 1,975-2,047, formed by the 2021 tentative descending trendline and the 200-day simple moving average (SMA). Declaring another victory here, the bulls could pick up steam towards the 2,330 – 2,460 resistance area.
All in all, the horizontal trajectory in Ethereum suggests some patience until a clear breakout happens above 1,770 or below 1,600.