

Sample Category Title
Technical Outlook and Review
USD/JPY:
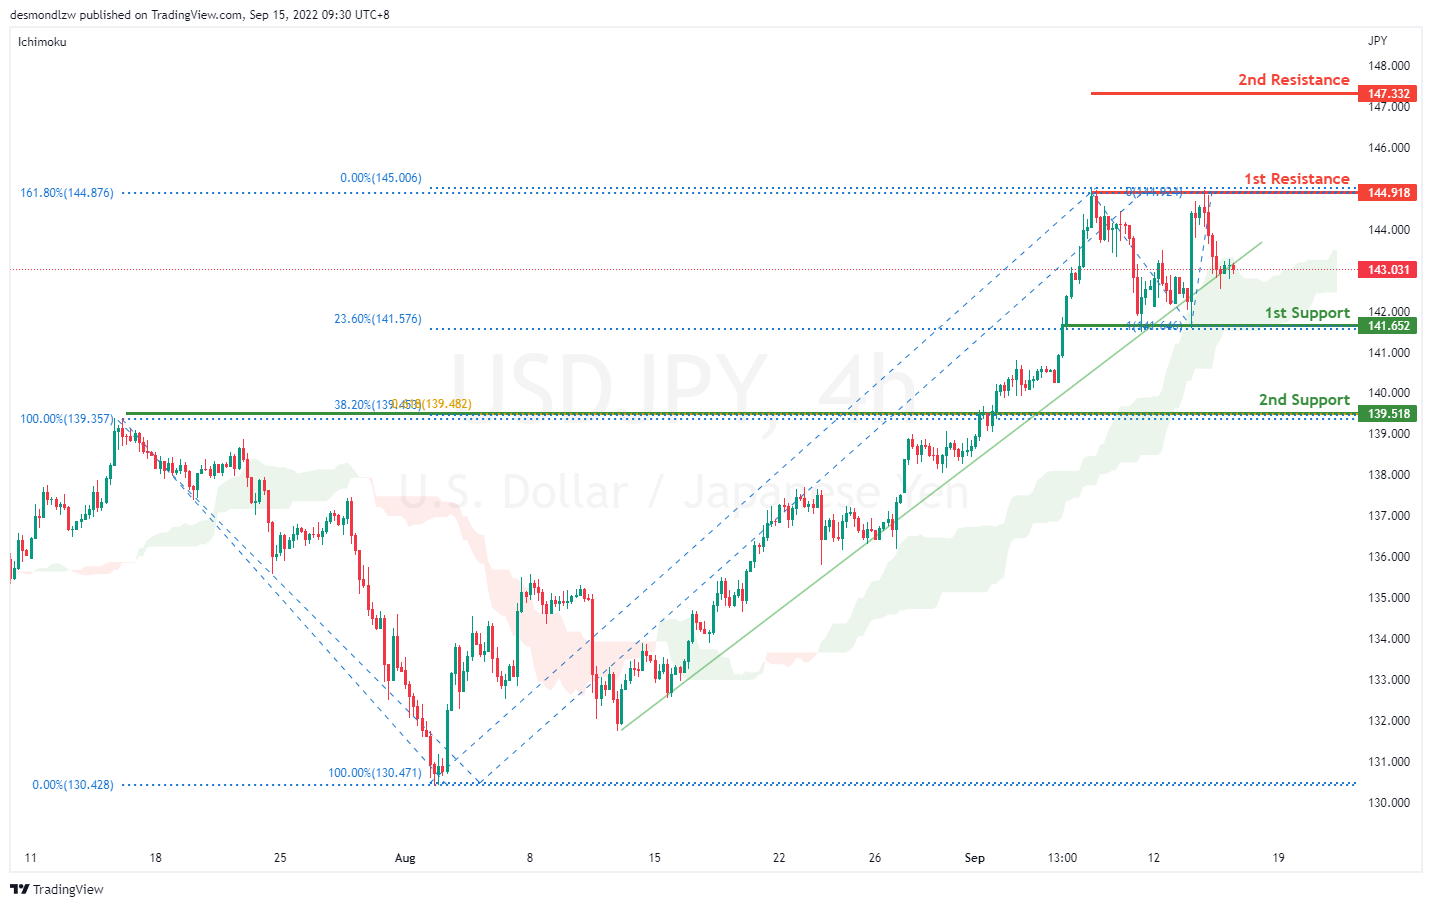
On the H4 chart, price is still respecting the ascending trend line. We are still bullish bias- Price is testing along the trend line and if bullish momentum continues, it should bring price to first resistance at 144.918 where the 161.8% extension sits. If it breaks this level, it should bring price to 147.332 where the previous swing high sits. Alternatively it could pull back to the first support at 141.652 where the 23.6% retracement and 100% projection sits then to the second support at 139.518 where the 38.2% retracement and overlapping support sits.
Areas of consideration:
- H4 time frame, 1st resistance at 144.918
- H4 time frame, 1st support at 141.652
DXY:
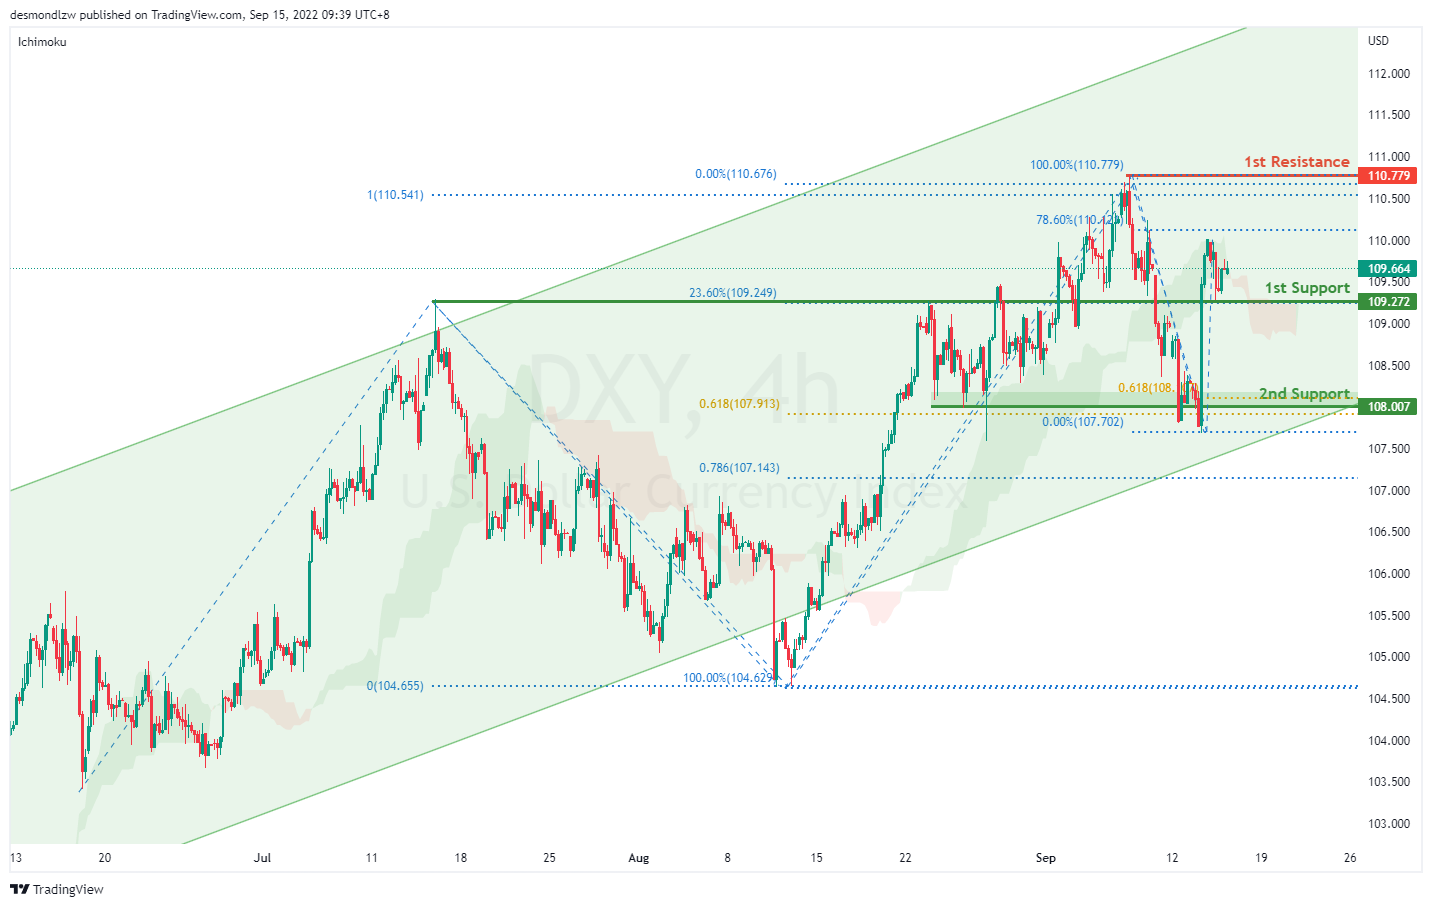
On the H4, price is still respecting the bullish channel- we are bullish bias. Price has rebounded off the support level and is moving toward the first resistance at 110.779 levels where the previous swing high sits. Alternatively, price could pull back to test the first support at 109.272 where the 23.6% retracement sits then the second support at 108.007 where the 61.8% projection, 61.8% retracement and previous swing low sits.
Areas of consideration:
- H4 time frame, 1st resistance at 110.779
- H4 time frame, 1st support at 109.272
EUR/USD:
On the H4, price is moving within the channel, we are currently bearish bias. Price seems like its moving to the first support at 0.9886 where the 61.8% projection and previous swing low sits. If bearish momentum continues, it should bring price to second support at 0.9799 where the 78.6% projection sits. Alternatively, if price pulls back it should test the first resistance at 1.0079 level where the 50% retracement and previous swing high sits then the second resistance at 1.0199 where the 61.8% retracement and previous swing high sits
Areas of consideration :
- H4 1st resistance at 1.0079
- H4 1st support at 0.9886

GBP/USD:
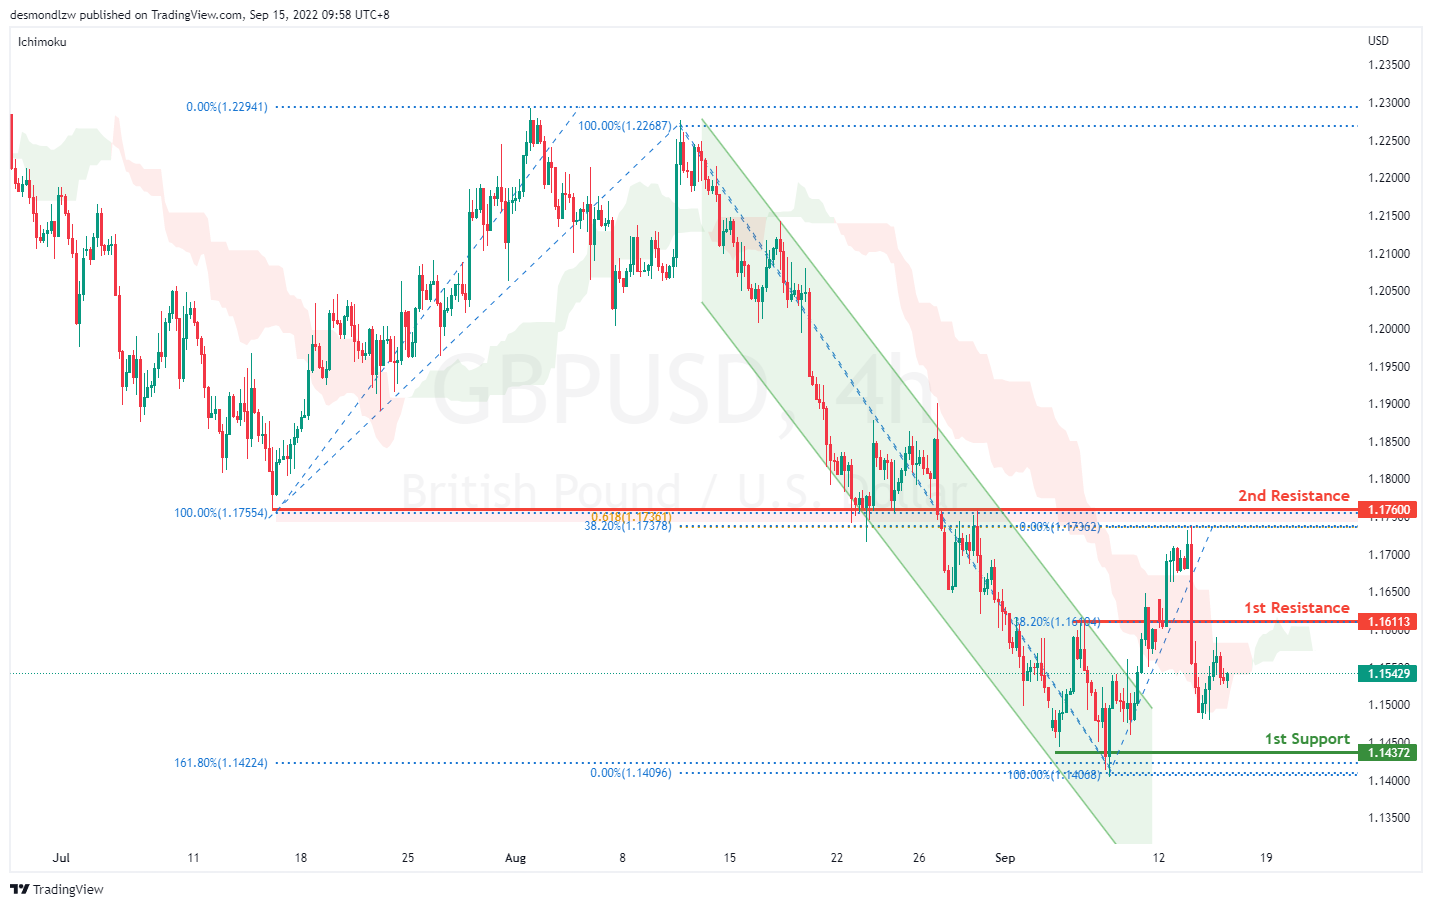
On the H4, prices are still moving in a bearish momentum hence we are bearish biassed. Prices seem to be moving toward the first support at 1.1437 where the 161.8% extension and previous swing low sits. Alternatively, price could pull back to test the first resistance at 1.1611 where the 38.2% retracement and overlapping support sits then the second resistance at 1.1760 where the 61.8% retracement and previous swing high sits
Areas of consideration:
- H4 1st resistance at 1.1611
- H4 1st support at 1.1437
USD/CHF:
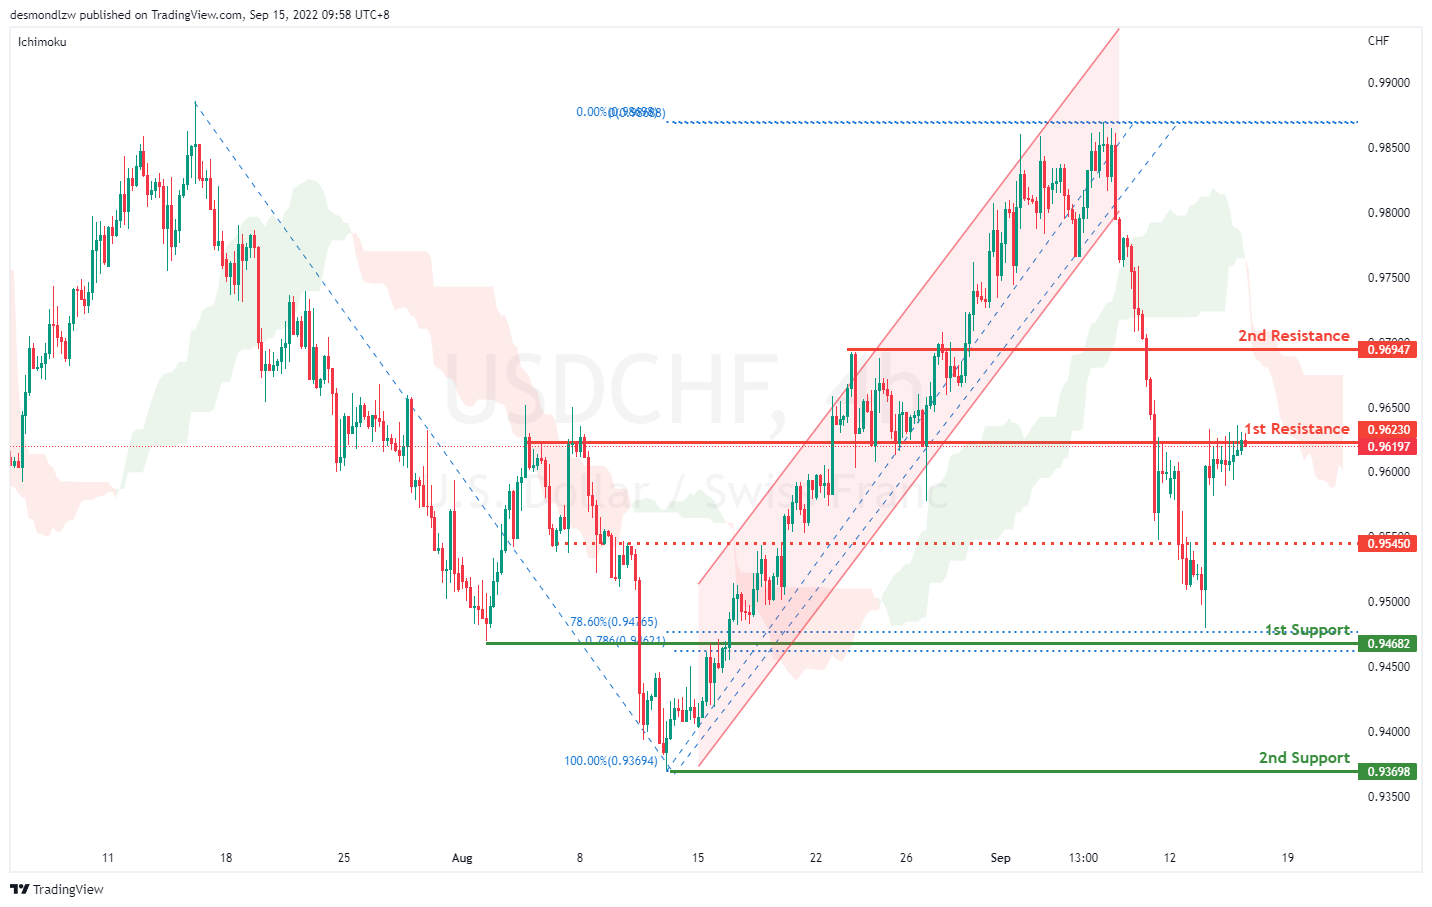
On the H4, prices have broken the ascending channel and we are currently bearish bias. Price is testing the first resistance at 0.9623 where the overlapping resistance and 50% retracement sit. If it breaks this level, it might test the second resistance at 0.9694 where the 38.2% retracement sits. Alternatively, price could pull back to test the first support at 0.9468 where the 78.6% retracement sit and then second support at 0.9369 where the previous swing low sits
Areas of consideration
- H4 1st support at 0.9468
- H4 1st resistance at 0.9623
XAU/USD (GOLD):
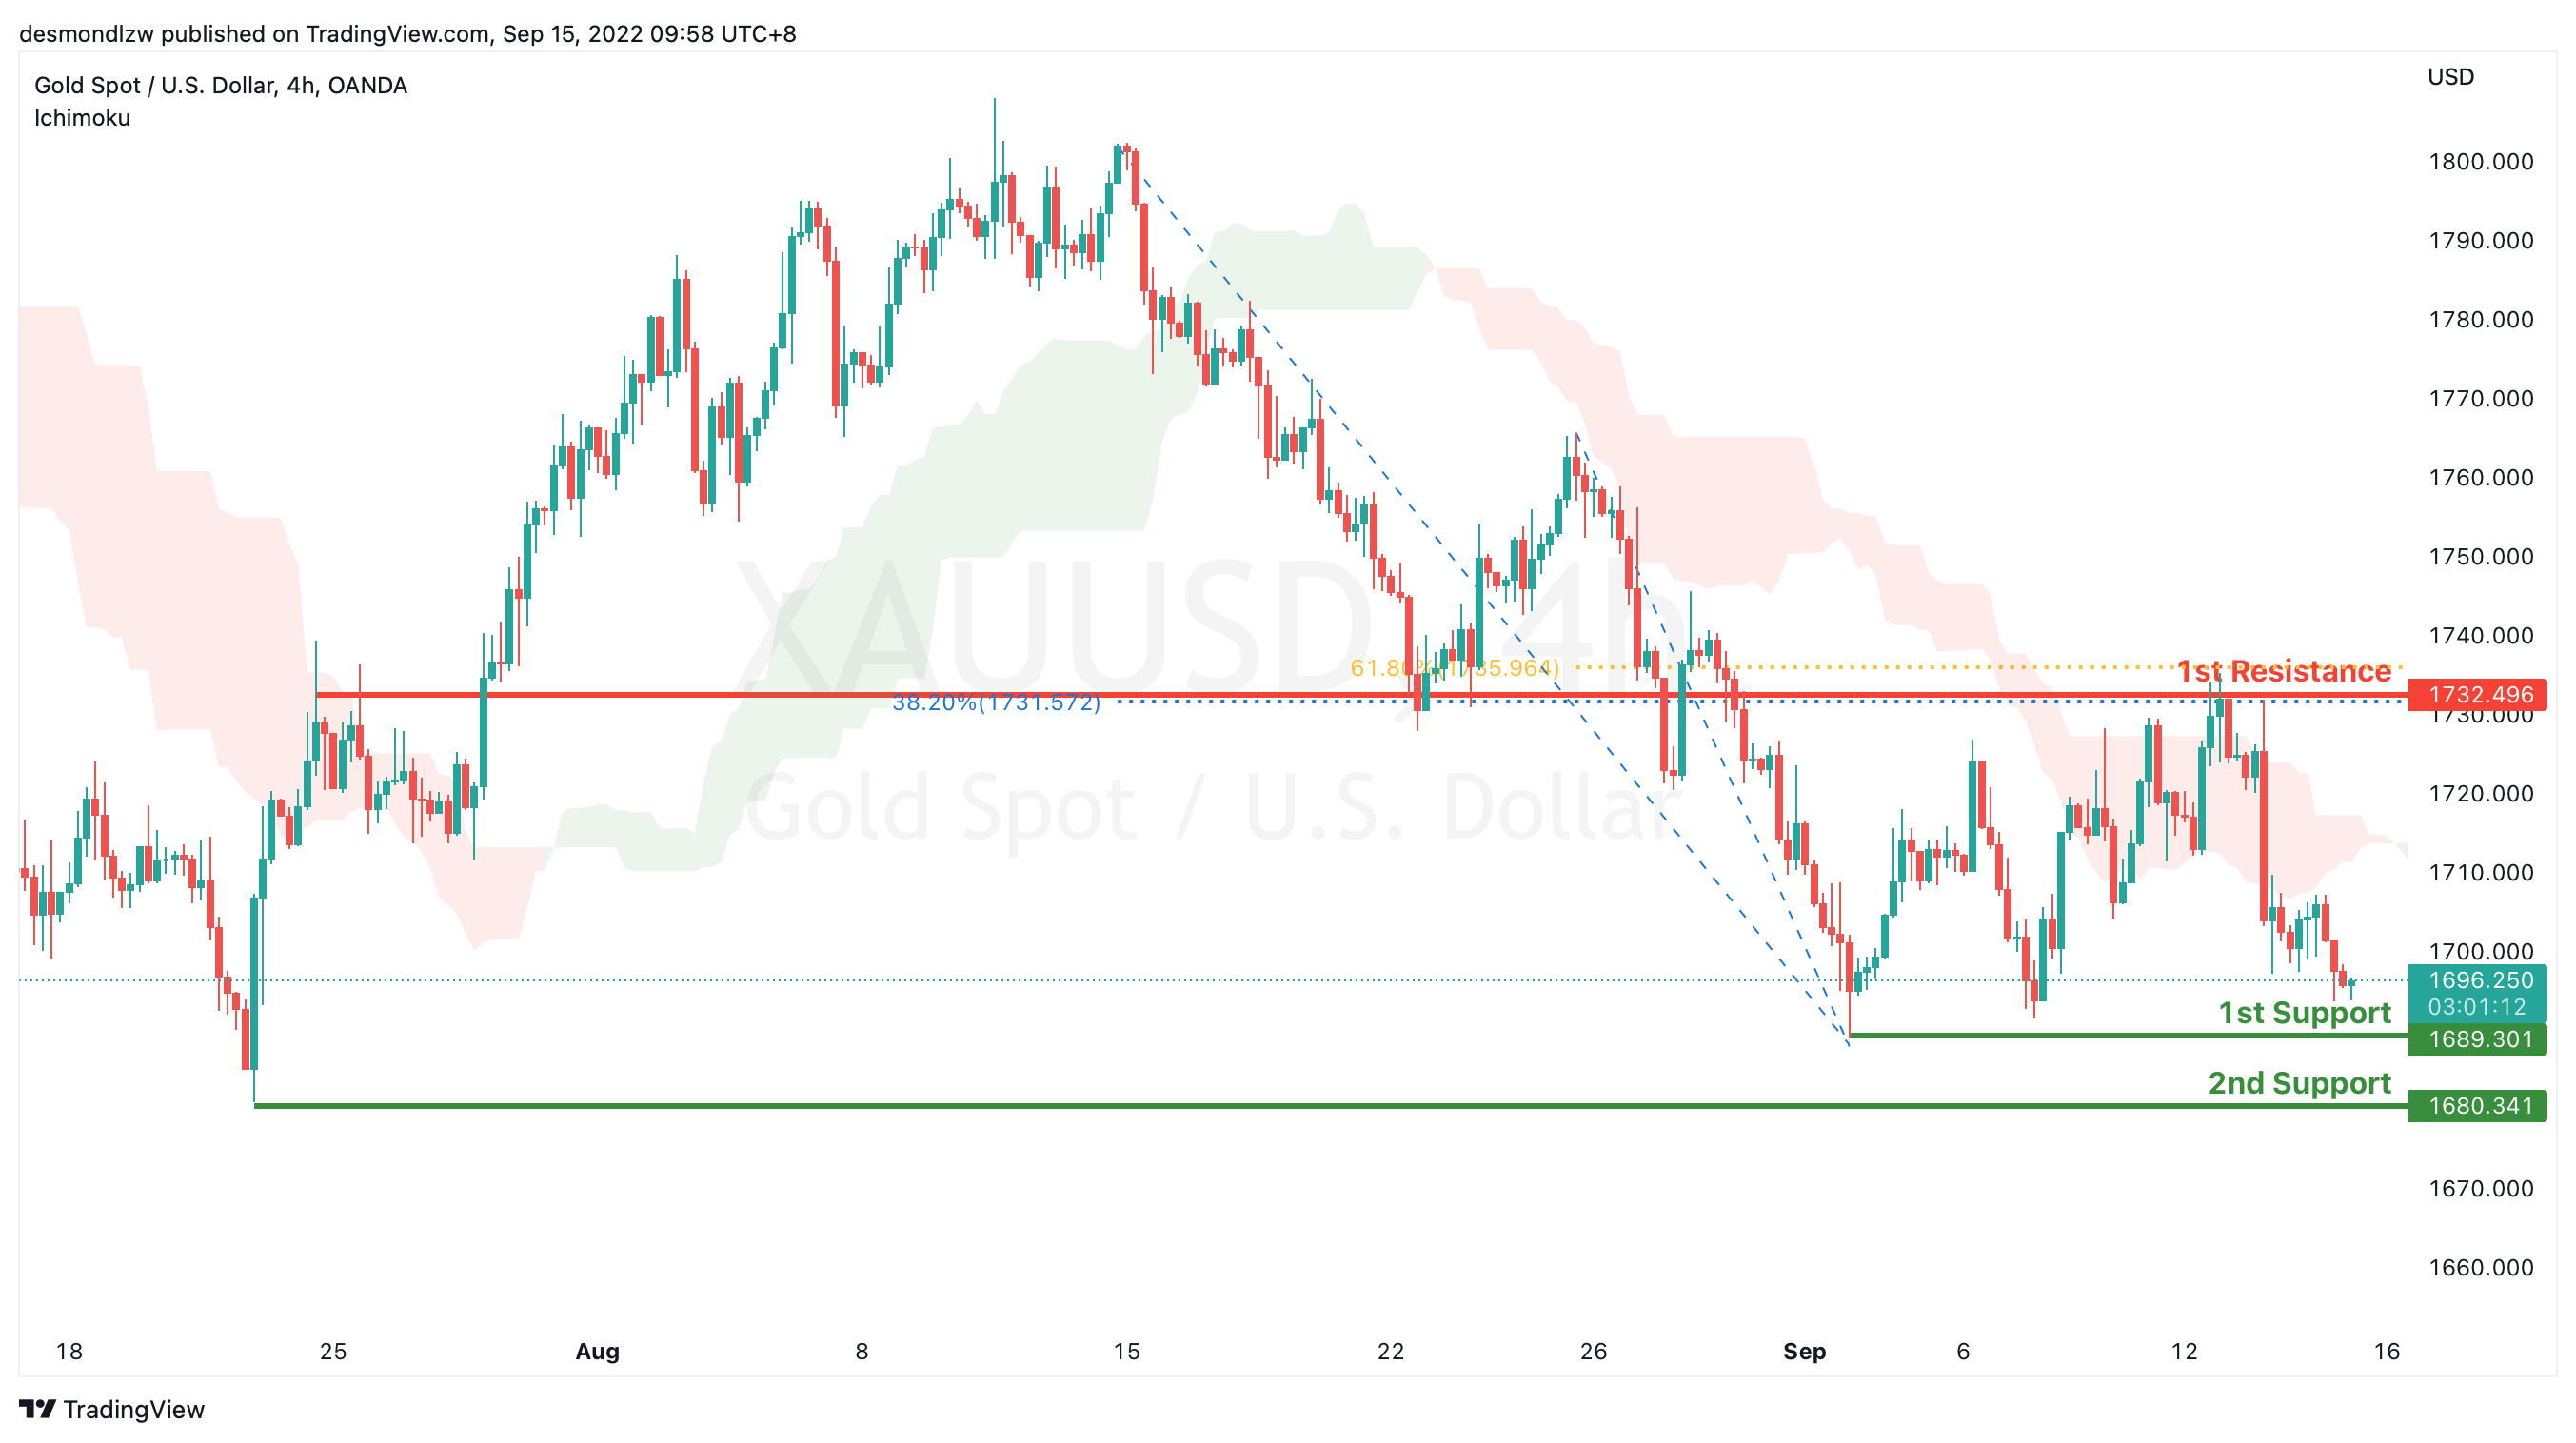
On the H4, with the price dropping from the 1st resistance and below ichimoku cloud, we have a bearish bias that the price may drop to the 1st support at 1689.301, which is in line with the swing low to the 2nd support at 1680.341, where the previous significant swing low is. Alternatively, the price may rise to the 1st resistance at 1732.496, which is in line with the 61.8% and 38.2% fibonacci retracement and overlap resistance.
Areas of consideration:
- H4 time frame, 1st support at 16989.301
- H4 time frame, 2nd support at 1680.341
AUD/USD:
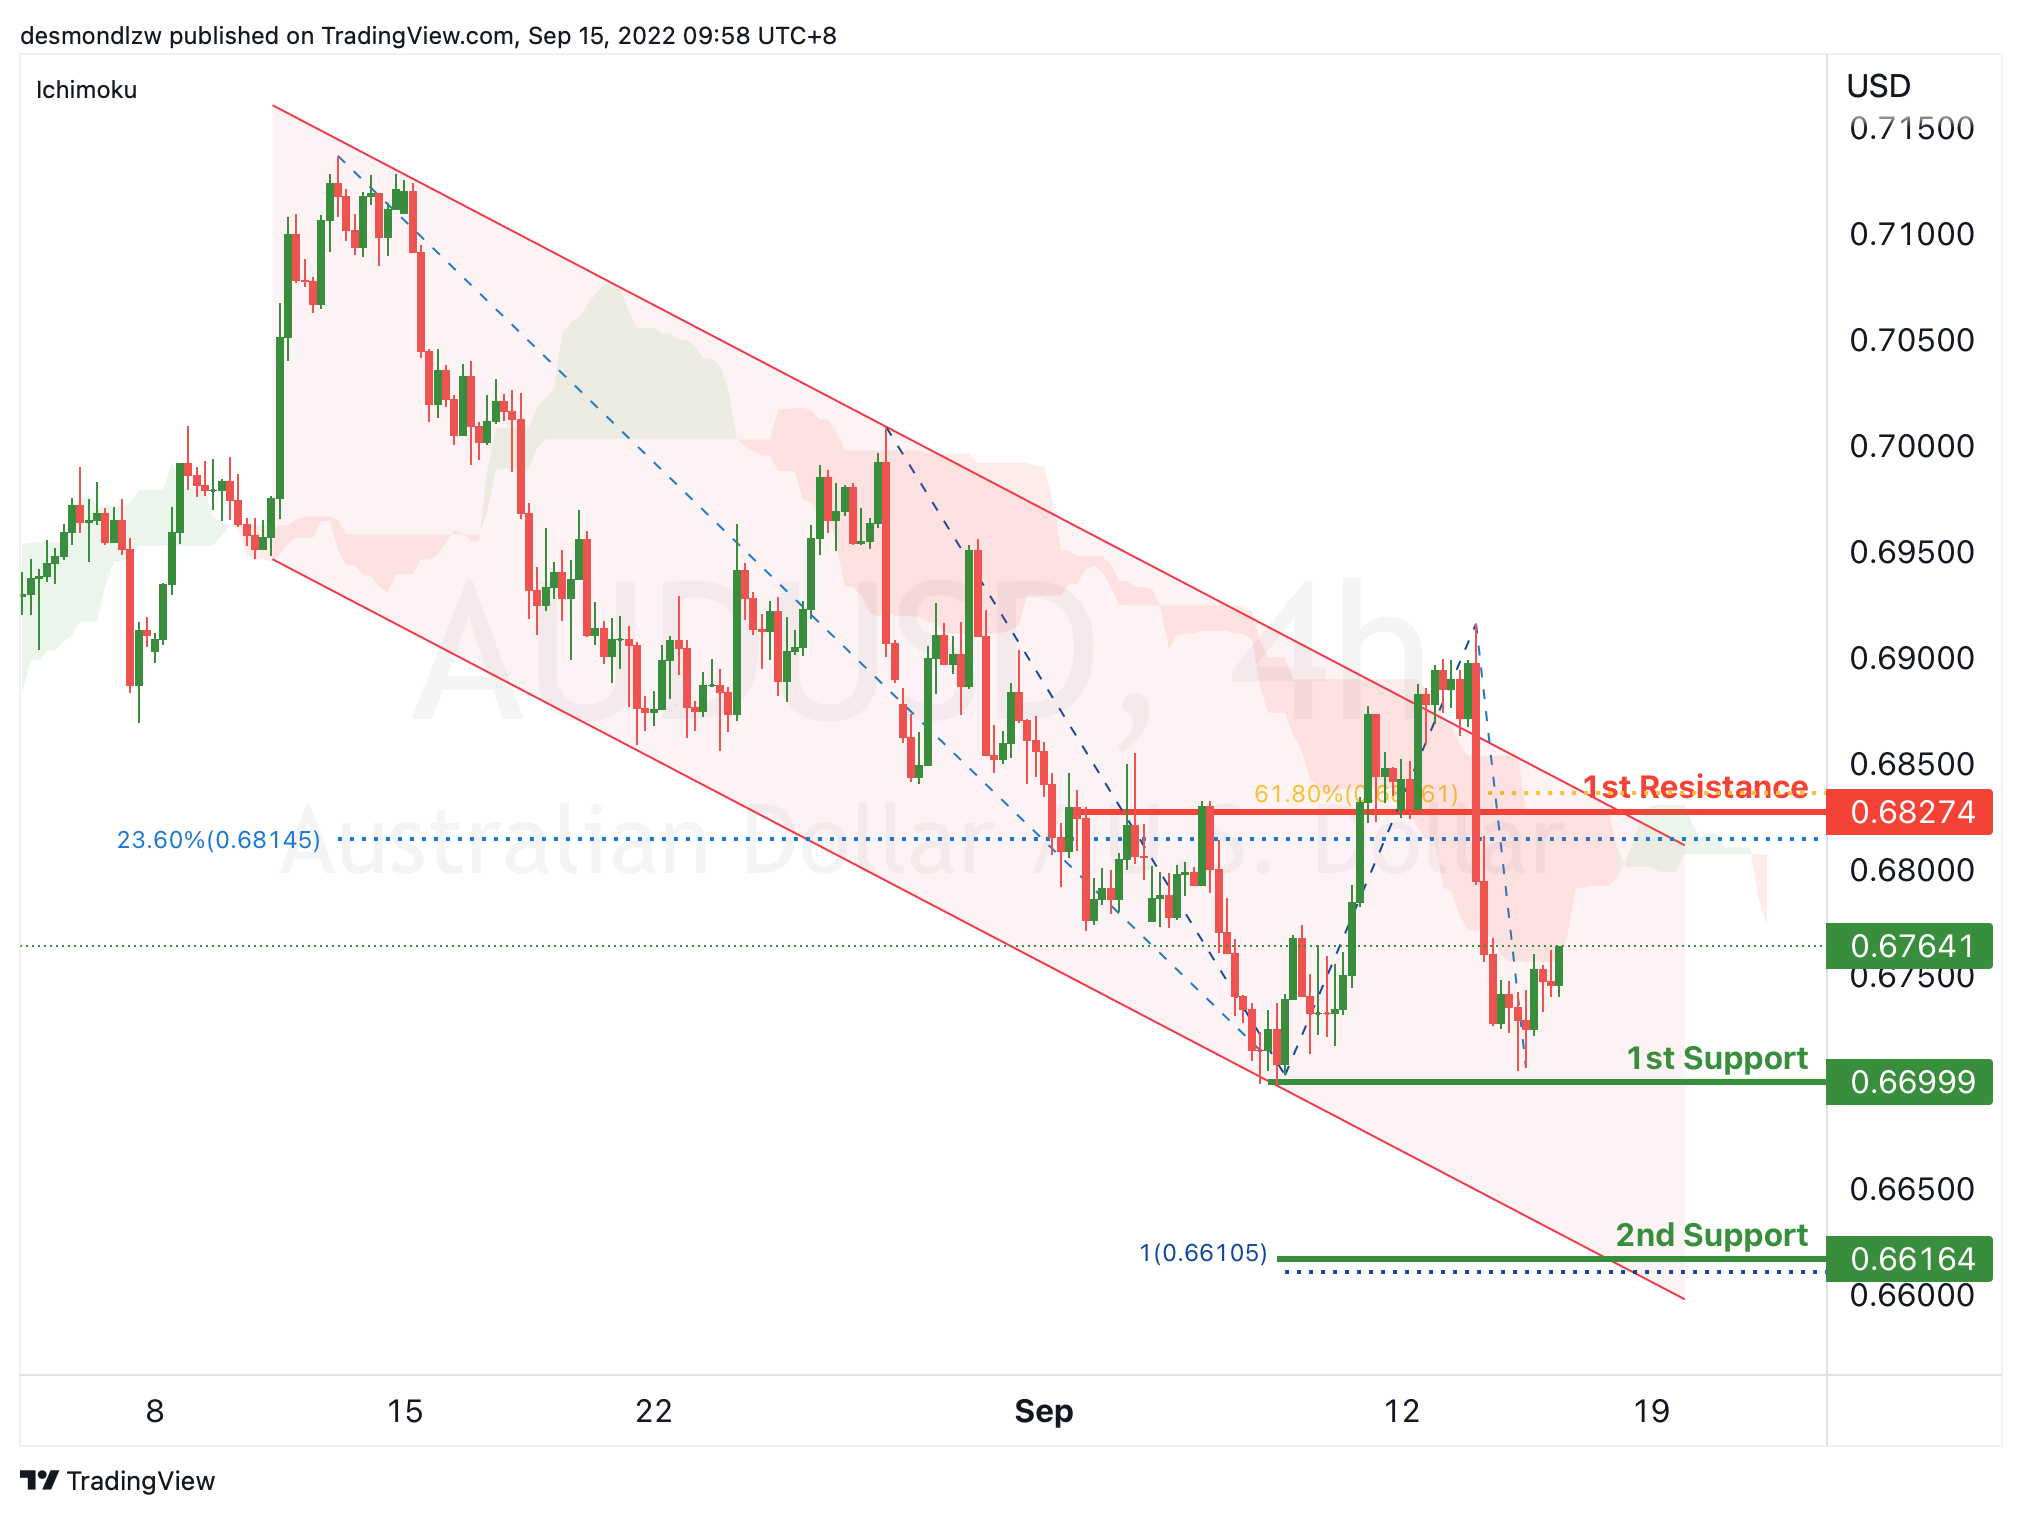
On the H4, with the price moving within the descending channel and below ichimoku cloud, we have a bearish bias that the price may drop to the 1st support at 0.66999, which is in line with the previous swing lows. If the 1st support level is broken, the 2nd support could be at 0.66164, where the 100% fibonacci projection is. Alternatively, the price may rise to the 1st resistance at 0.68274, which is in line with the 23.6% fibonacci retracement, 61.8% fibonacci retracement and overlap resistance.
Areas of consideration
- H4 1st support at 0.66999
- H4 2nd support at 0.66164
NZD/USD:
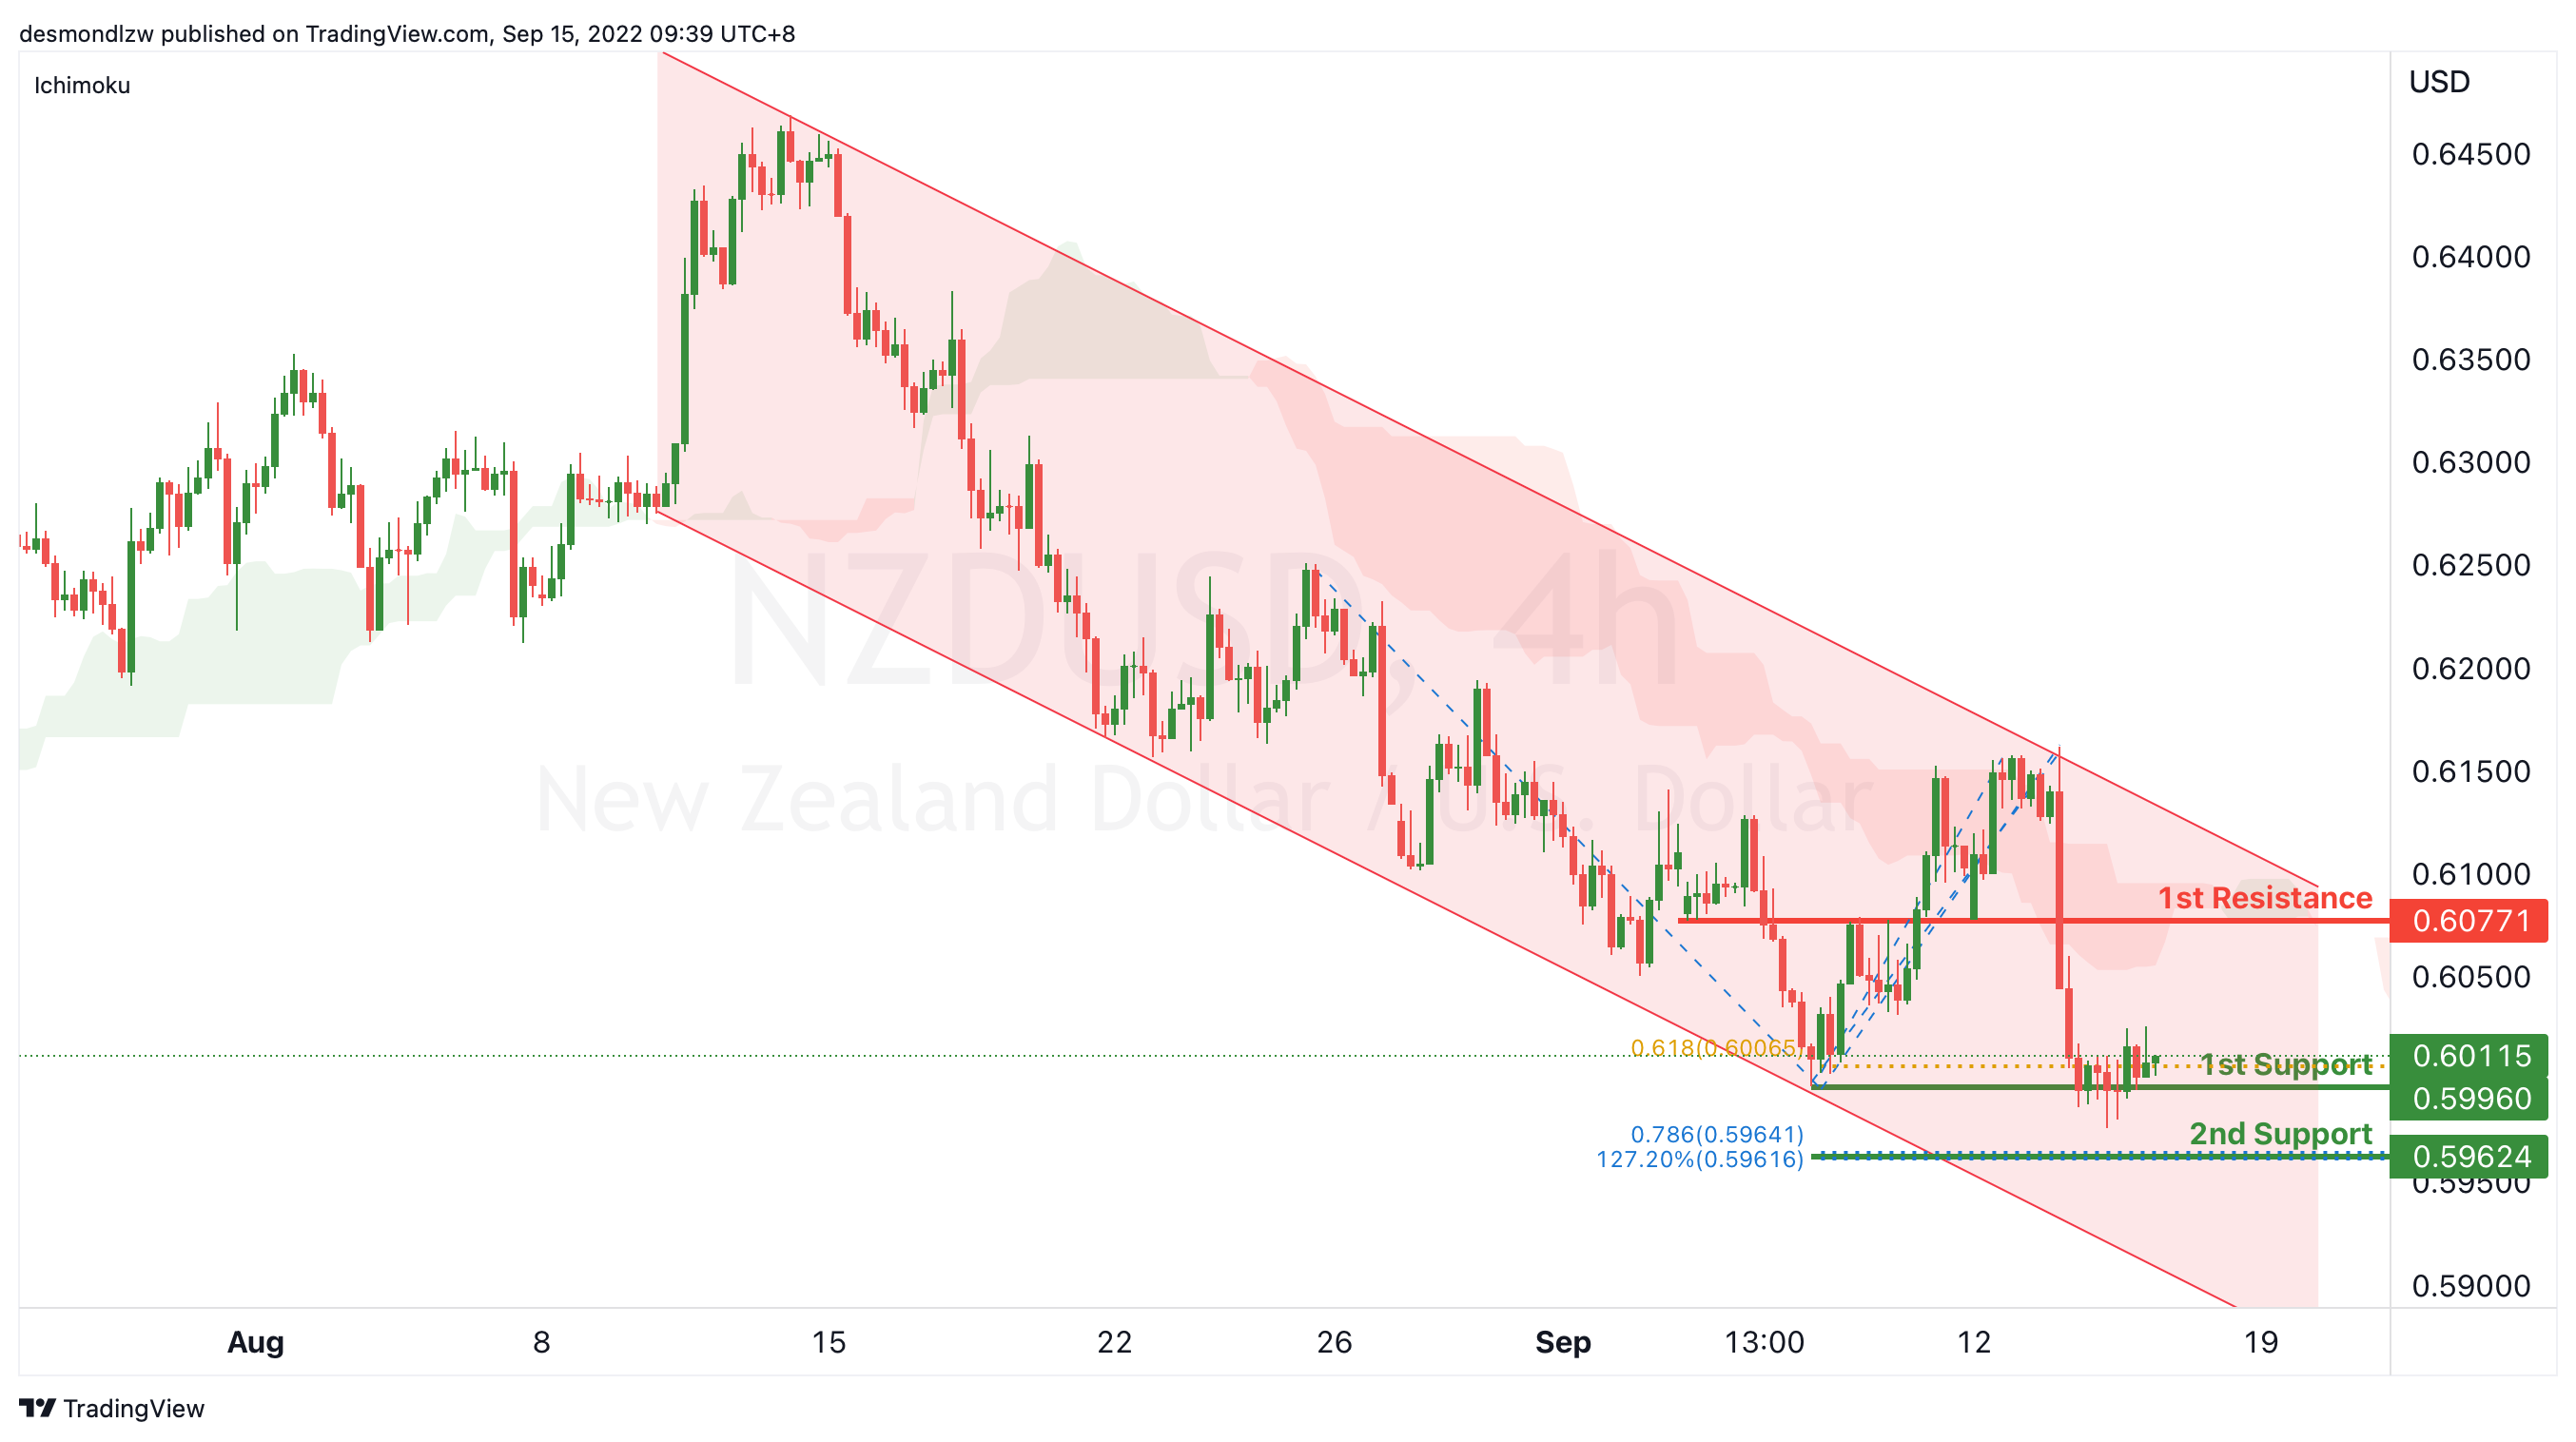
On the H4, with the price moving within the descending channel and below ichimoku cloud, we have a bearish bias that the price may drop from the 1st support at 0.59960, which is in line with the swing low and 61.8% fibonacci projection to the 2nd support at 0.59624, where the 78.6% fibonacci projection and 127.2% fibonacci extension are. Alternatively, the price may rise to the 1st resistance at 0.60771, which is in line with the overlap resistance, 61.8% fibonacci retracement.
Areas of consideration:
- H4 time frame, 1st support at 0.59960
- H4 time frame, 2nd support at 0.59624
USD/CAD:
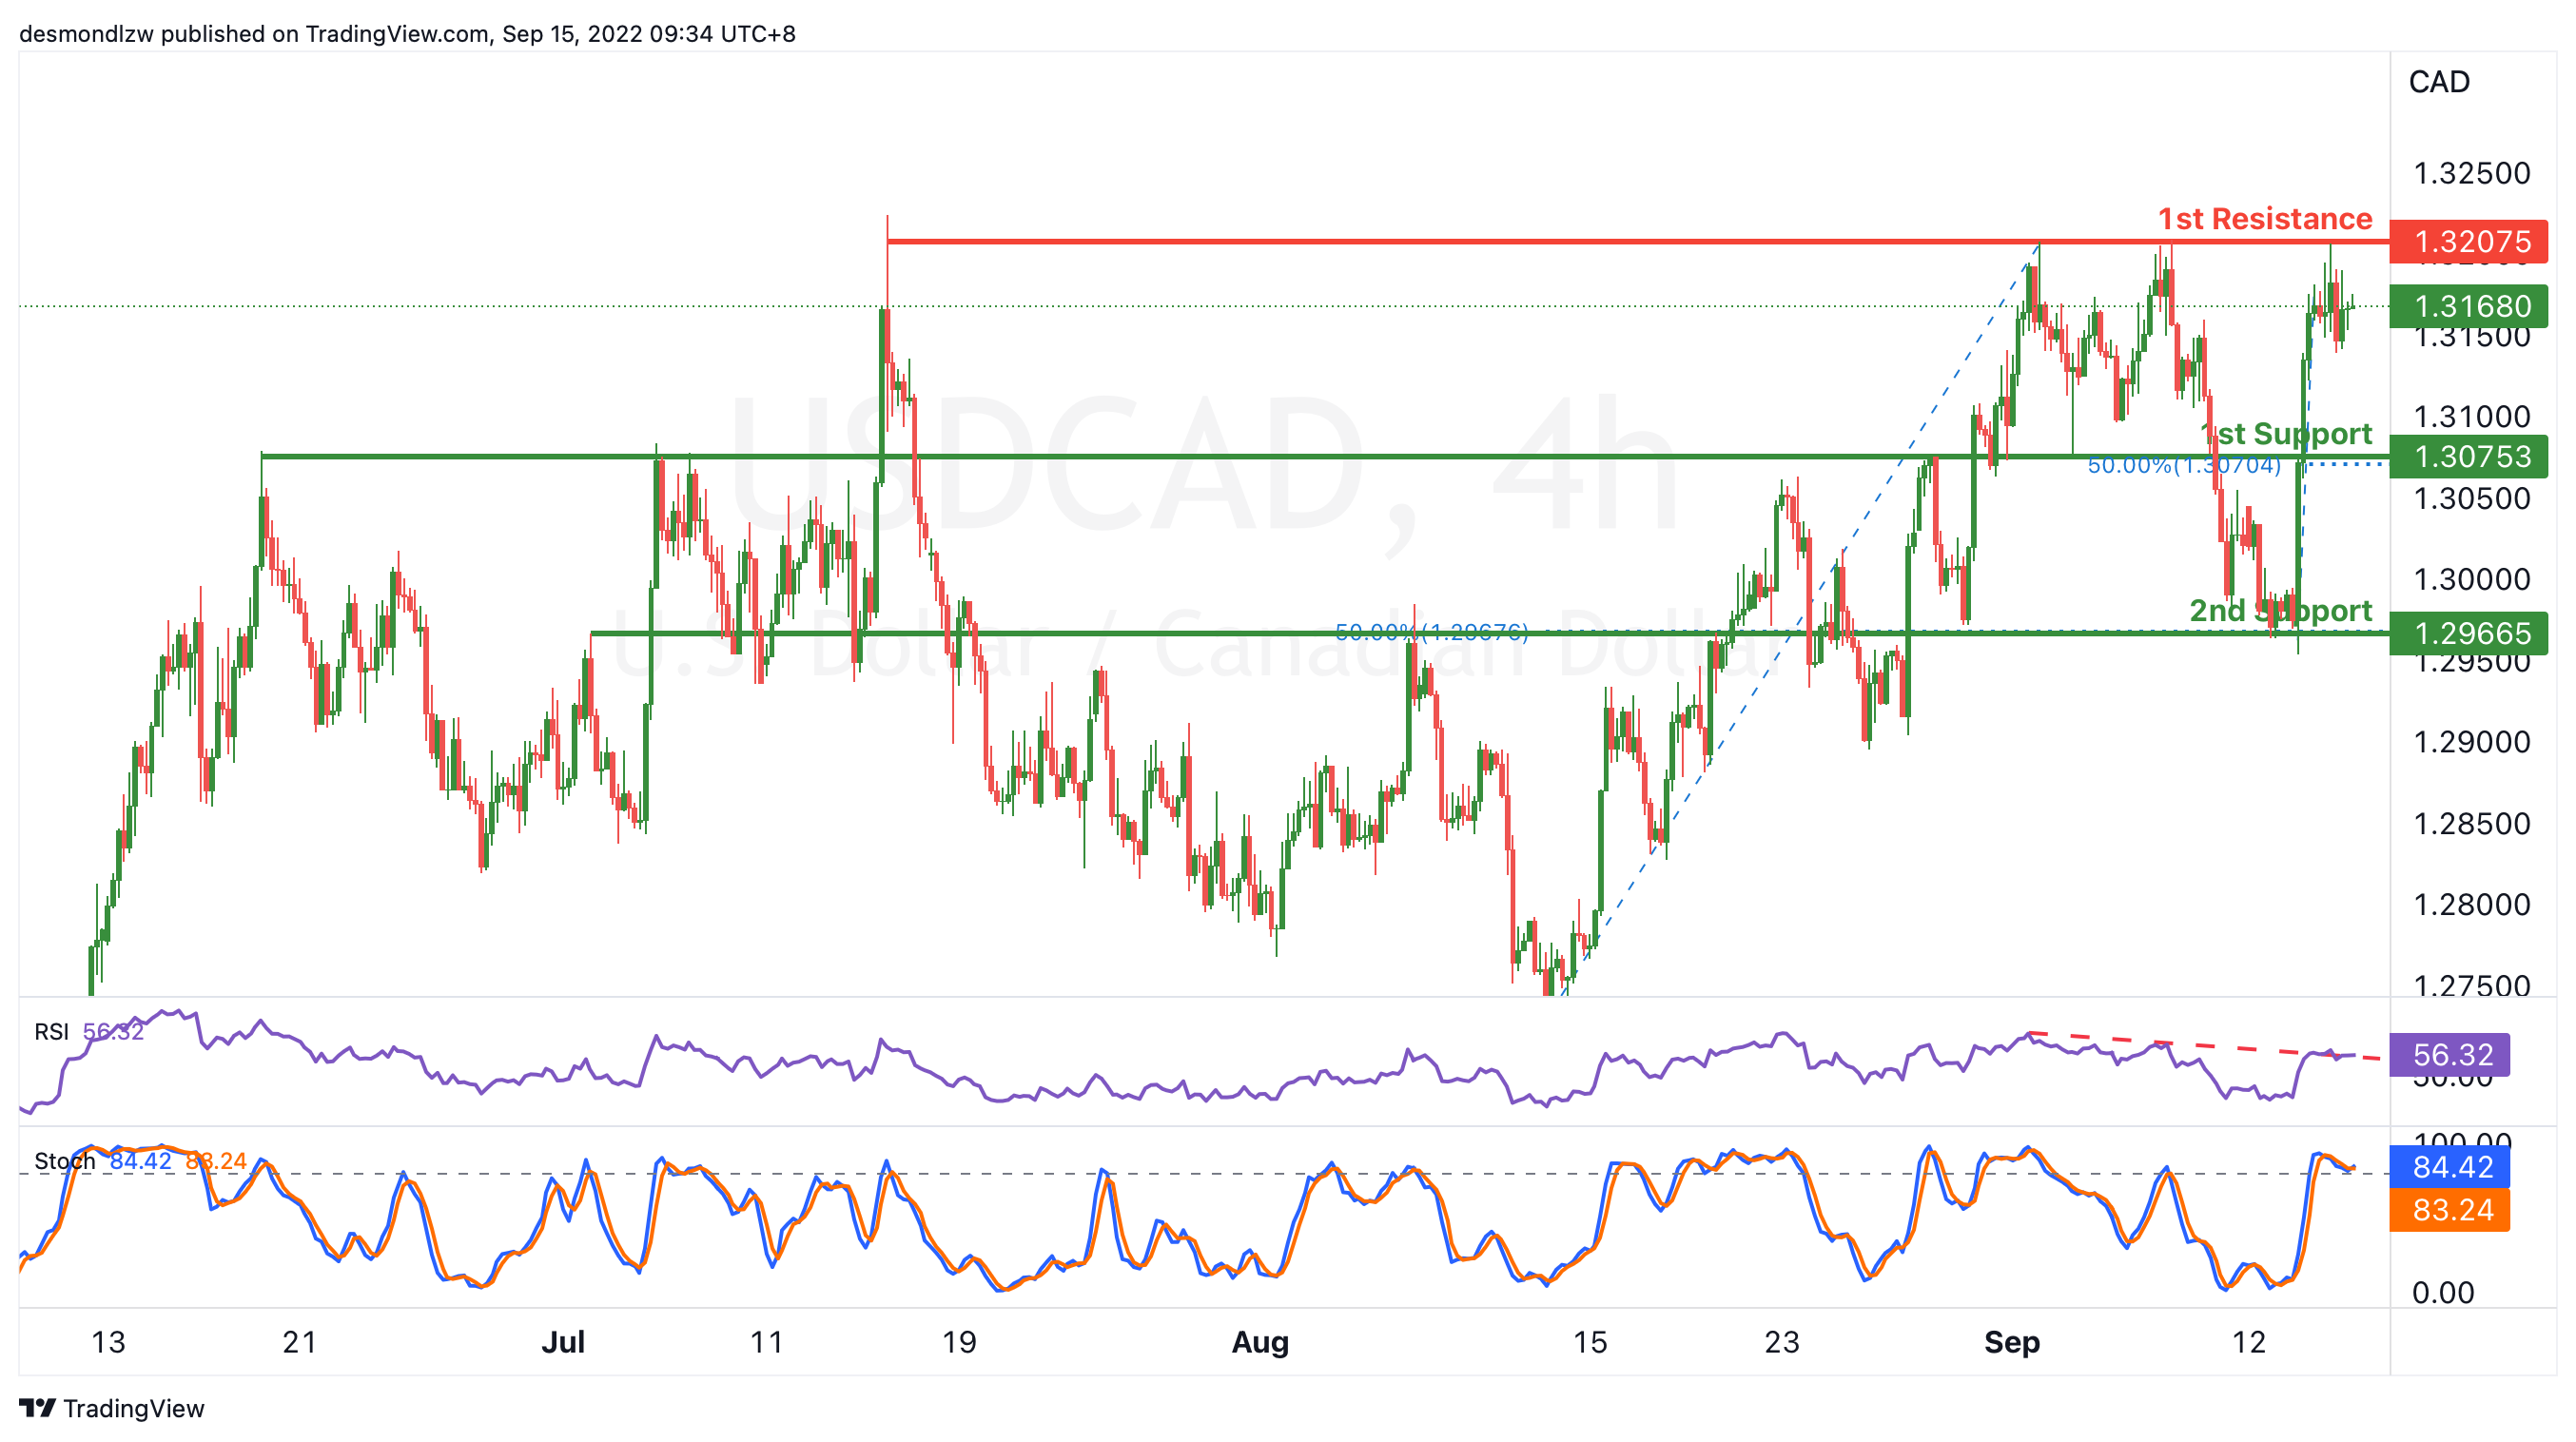
On the H4, the price the RSI is testing the descending trendline and stoch is over 80, we have a bearish bias that the price may pull back from the 1st resistance and drop to the 1st support at 1.30753, which is in line with the 50% fibonacci retracement and overlap support. If the 1st support is broken, the next support level could be at 1.29665, where the 50% fibonacci retracement and overlap support are. Alternatively, the price may continue the ascending trend and test the 1st resistance at 1.32075, which is in line with the swing highs.
Areas of consideration:
- H4 time frame, 1st resistance at 1.32075
- H4 time frame, 1st support at 1.30753
OIL:
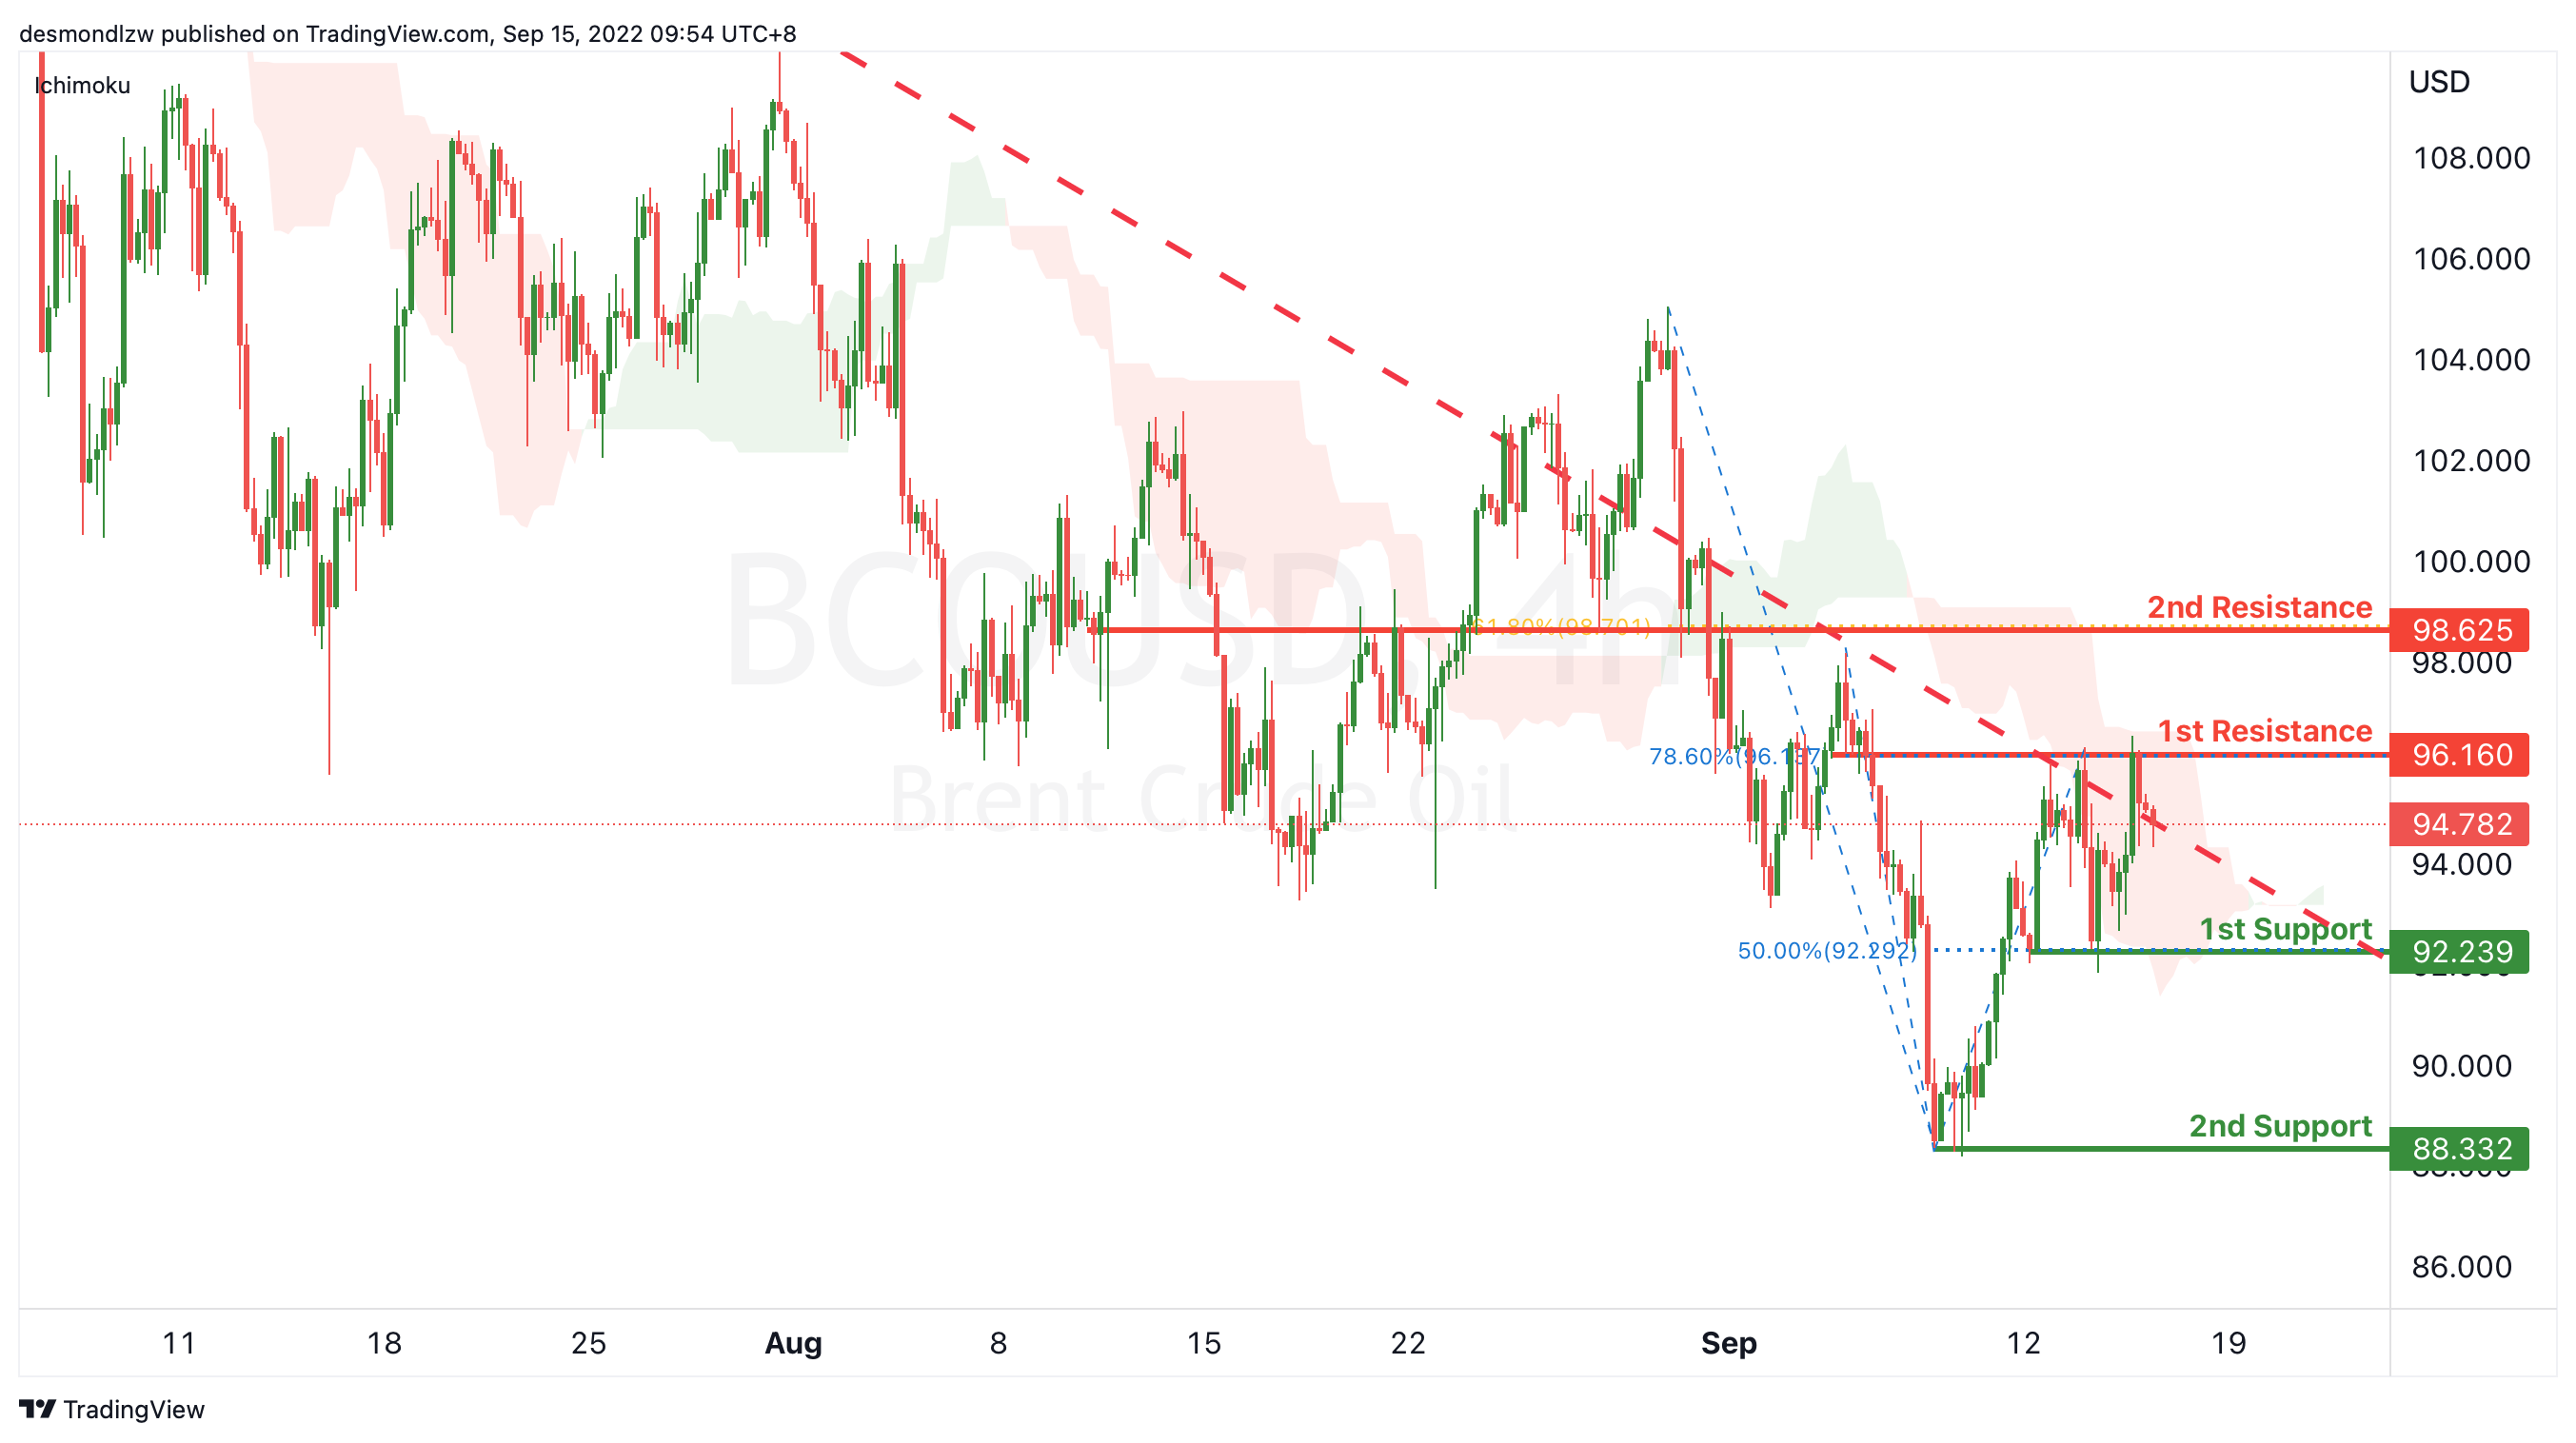
On the H4, with price below ichimoku, dropping from the 1st resistance and within the long term descending trendline, we have a weak bearish bias that the price may drop to the 1st support at 92.239, where the pullback support and 50% fibonacci retracement are. If the price can break this resistance level, the next support level could be at 88.332, which is in line with the swing low. Alternatively, the price may rise to the 1st resistance at 96.160, which is in line with the 78.6% fibonacci retracement and overlap resistance. If the 1st resistance is broken, the 2nd resistance could be at 98.625, which is in line with the 618% fibonacci retracement and overlap resistance.
Areas of consideration:
- H4 time frame, 1st resistance at 96.160
- H4 time frame, 1st support at 92.239
Dow Jones Industrial Average:
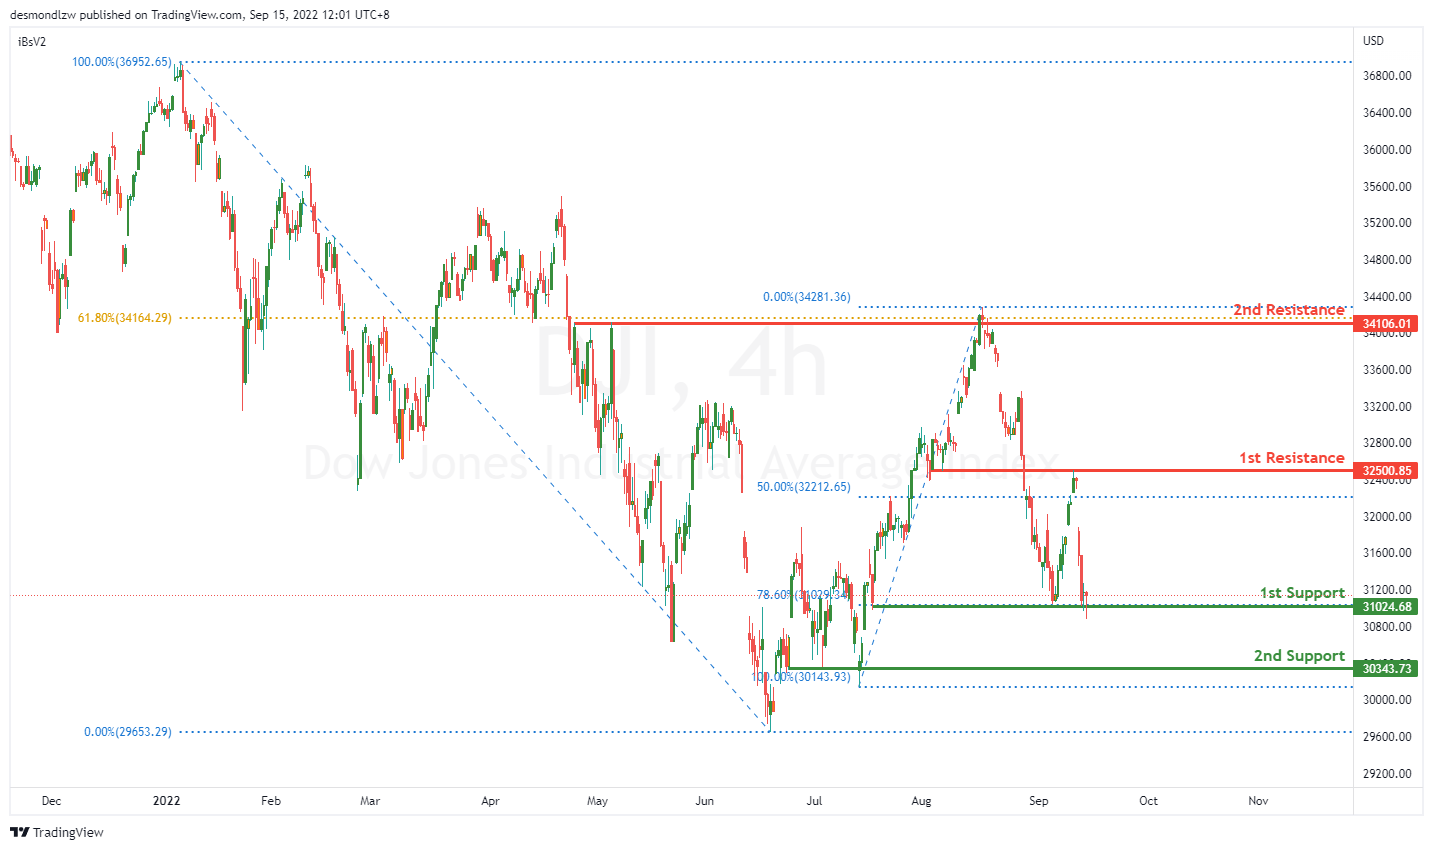
On the H4, price is reflected off nicely at the first resistance at 32500.85 where the 50% Fibonacci retracement is and broke right through the first support at 31029.34 where the 78.6% Fibonacci retracement is. Price might continue heading downwards towards the second support at 30343.73 where the previous swing low is.
Areas of consideration:
- H4 time frame, 1st support at 31029.34
- H4 time frame, 2nd support at 30343.73
DAX:
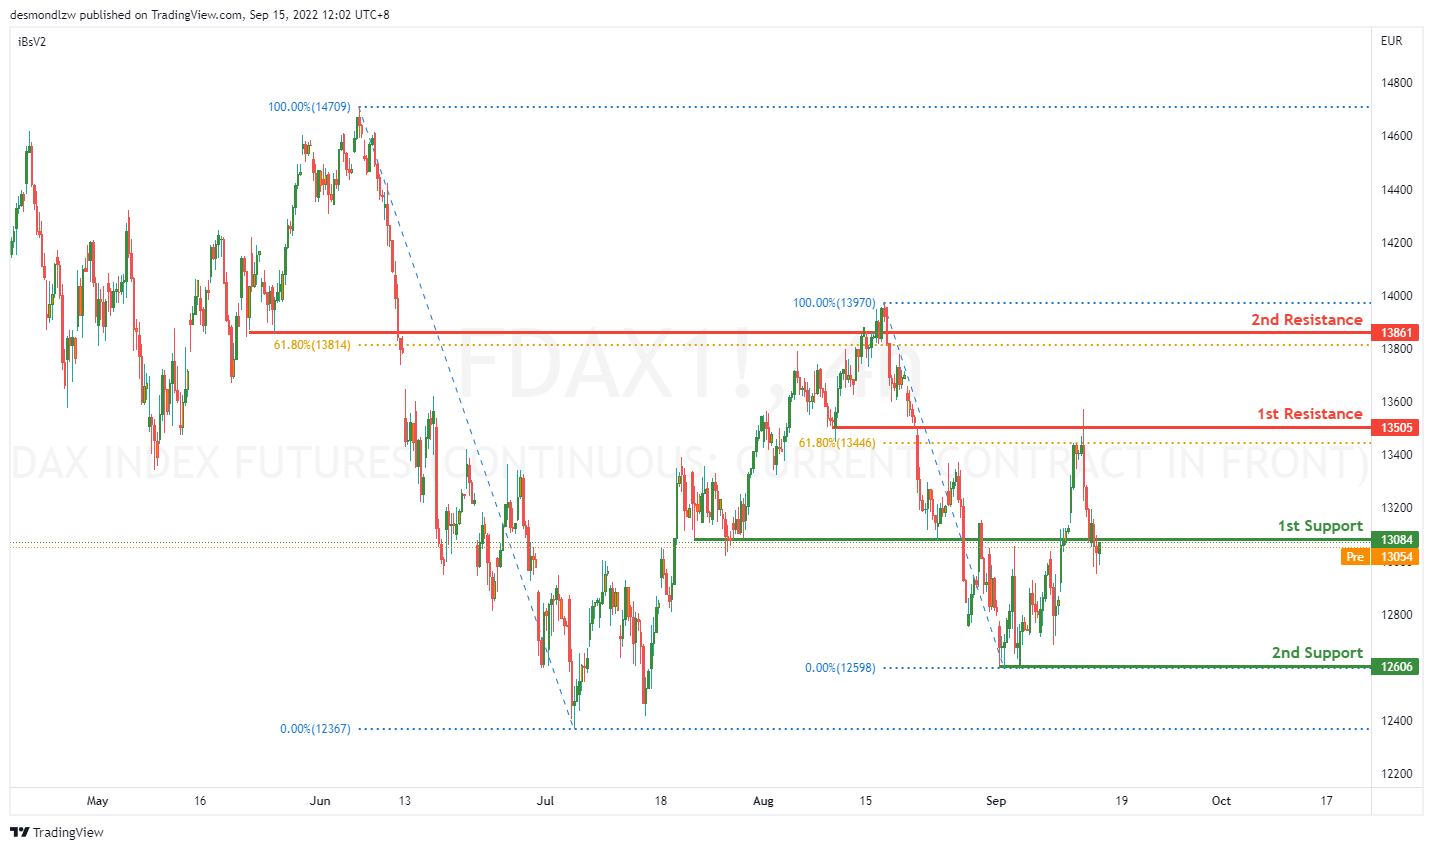
On the H4, price has reflected of the first resistance at 13505 where the 61.8% retracement is and got a big reaction breaking through the first support at 13084. Price might continue going down towards the second support at 12606 where the swing low is.
Areas of consideration:
- H4 time frame, 1st support at 13084
- H4 time frame, 2nd support at 12606
ETHUSD:
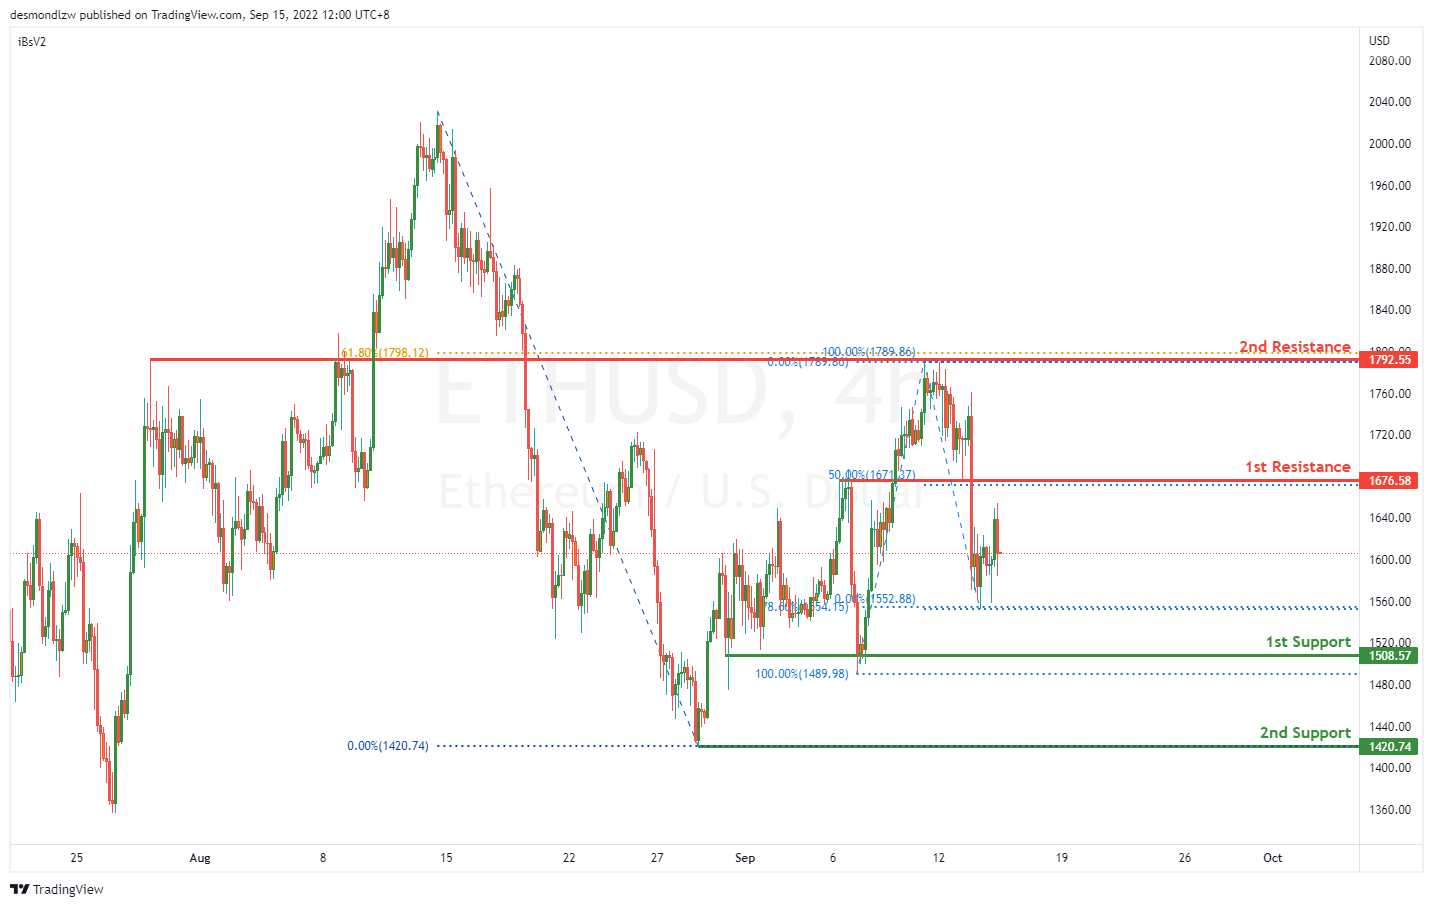
On the H4, price has reflected off the second resistance at 1789.8 where the 61.8% Fibonacci level is and pulled back hence we are currently bearish bias. Price look like it’s moving toward the first support at 1508.57 where the previous swing low is at. If bearish momentum continues it should bring price to the second support at 1420.74 where the previous swing low sits. Alternatively price just touched the 78.6% Fibonacci projection at 1554.15, so it could come back to test the first resistance at 1676.58 where the 50% retracement is.
Areas of consideration:
- H4 time frame, 1st resistance of 1676.58
- H4 time frame, 1st support at 1508.57
BTCUSD:
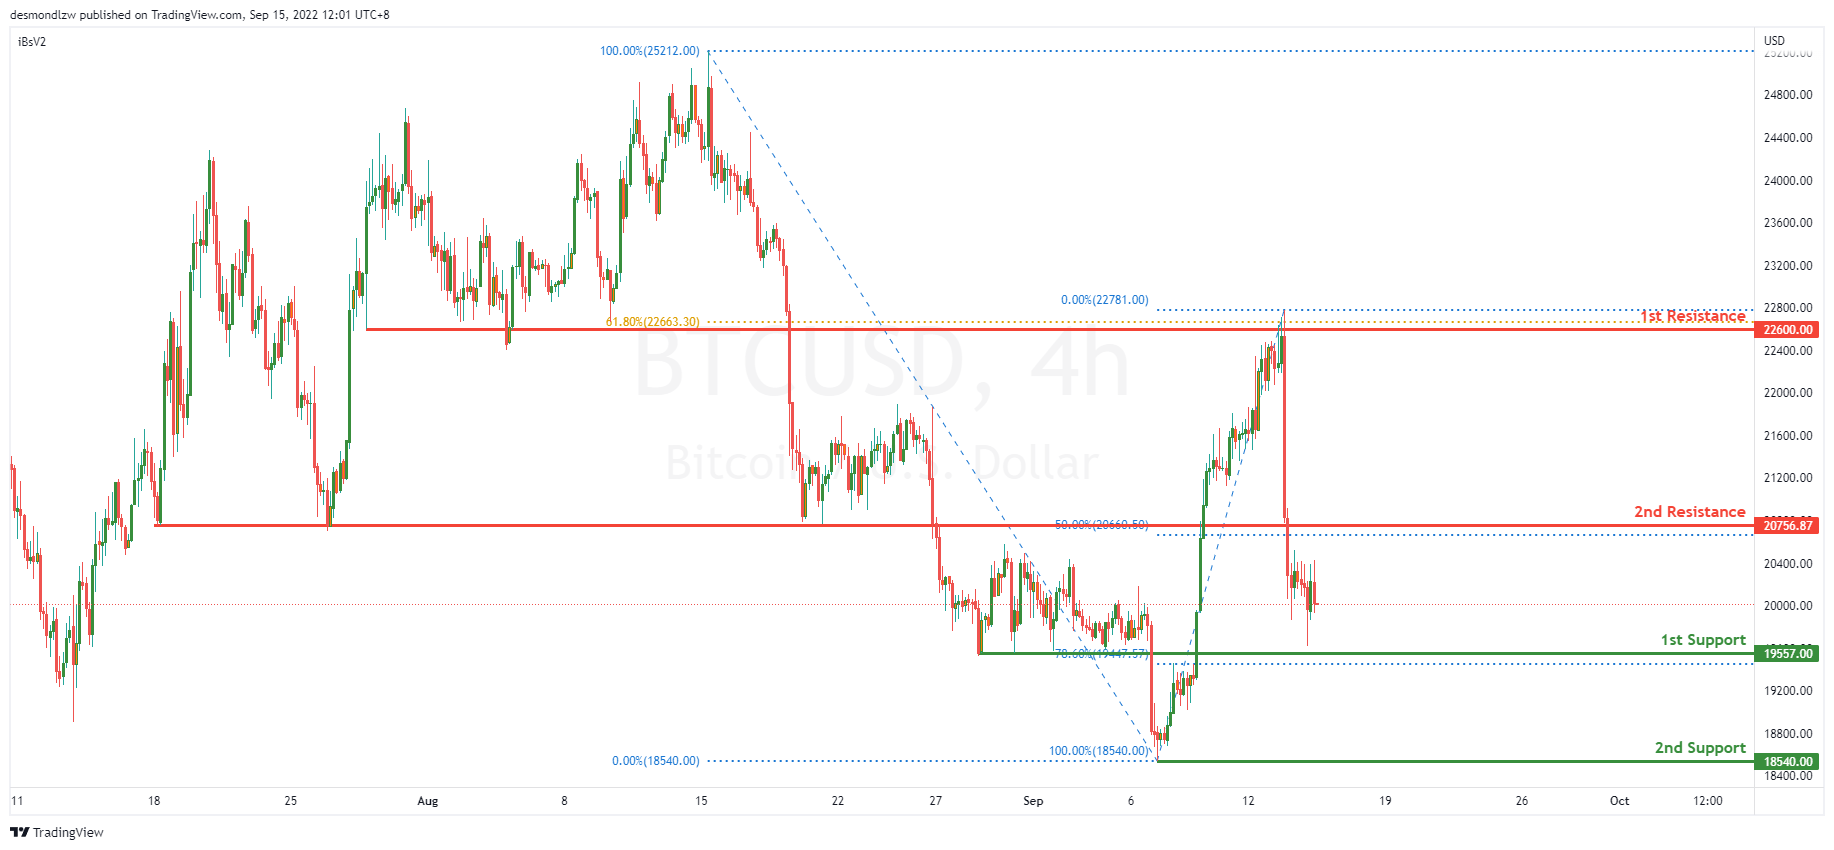
On the H4, price reflected off the first resistance at 22600.00, broke past the second resistance at 20756.87 and is moving in a bearish momentum hence we are bearish. Price is moving toward the first support at 19557.00 where the 78.6% retracement sits. If bearish momentum continues, it should bring price to the second support 18540.00 where the previous swing low sits. Alternatively, price could pull back to test the second resistance at 20756.87 where the 50% retracement is.
Areas of consideration:
- H4 time frame, 1st resistance of 22600.00
- H4 time frame, 1st support at 19557.00
S&P 500:
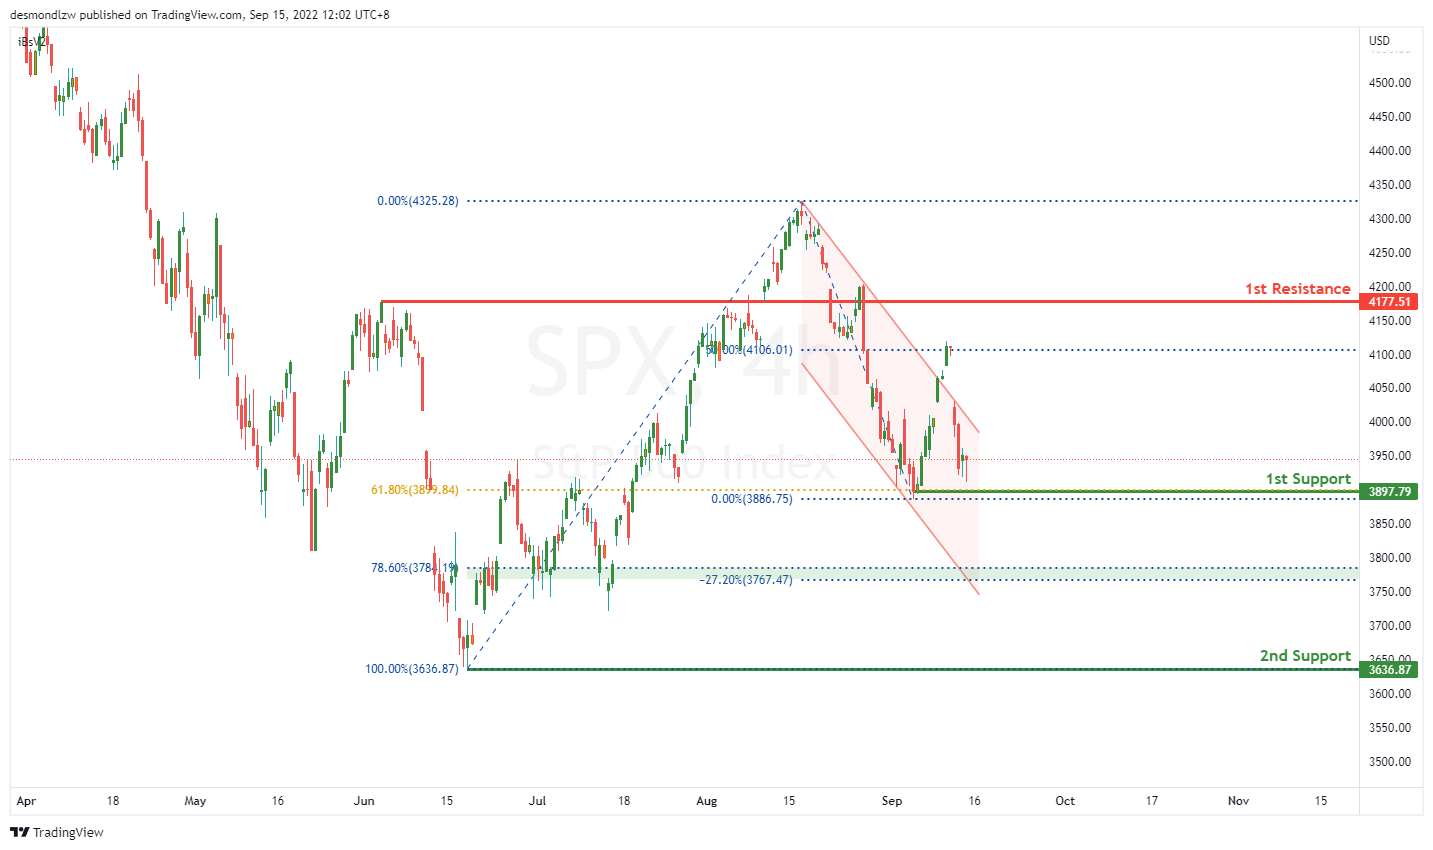
On the H4, the price reversed from the 4100 price area forming a bearish channel, with the price falling towards the 1st support are of 3900. With our bearish bias still valid, as price trades back towards the 61.8% Fibonacci retracement, look for price to test the 1st support area. If the price breaks below the 1st support level, the price could fall towards the 78.6% Fibonacci retracement level of 3784.19. There could be some pullback up towards the 1st Support level area else it could head towards the 2nd support of 3636.87. As the price falls towards the 2nd support, it could find some pullback towards the 78.6% Fibonacci retracement pullback support area.
Areas of consideration:
- H4 time frame, 1st support at 3900
- H4 time frame, 2nd support at 3636.87
EUR/USD Daily Outlook
Daily Pivots: (S1) 0.9949; (P) 0.9986; (R1) 1.0017; More...
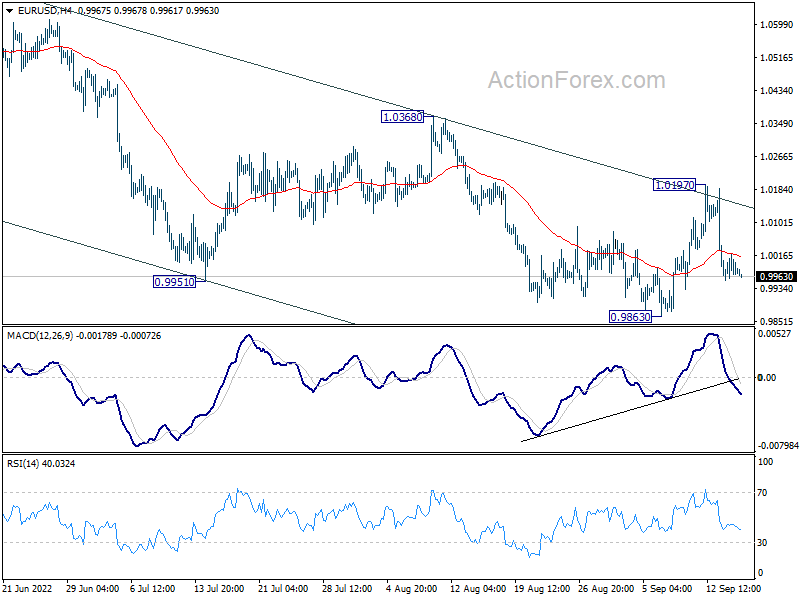
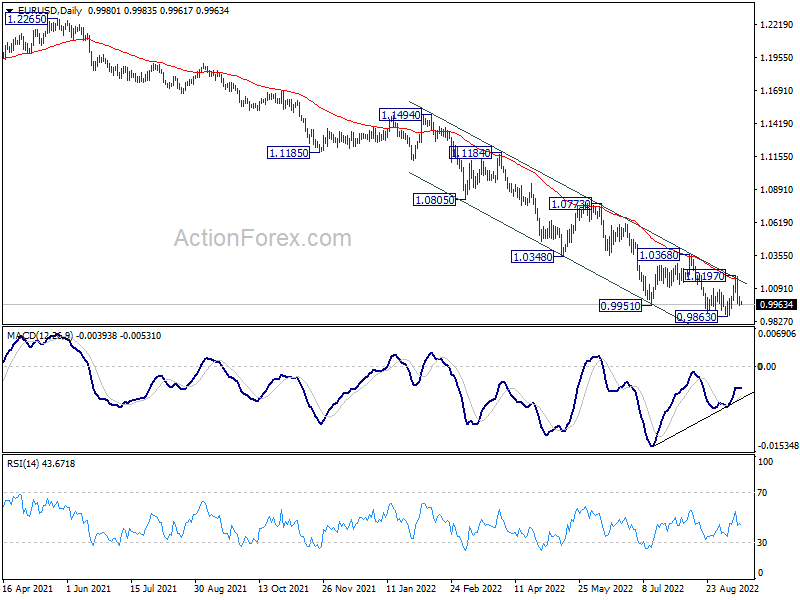
No change in EUR/USD's outlook and intraday bias stays mildly on the downside for retesting 0.9863 low first. Firm break there will resume larger down trend. On the upside, break of 1.0197 resistance will now raise the chance of larger trend reversal, and target 1.0368 resistance.
In the bigger picture, down trend from 1.6039 (2008 high) is still in progress. Next target is 100% projection of 1.3993 to 1.0339 from 1.2348 at 0.8694. In any case, outlook will stay bearish as long as 1.0368 resistance holds, in case of strong rebound. However, firm break of 1.0368 will confirm medium term bottom at 0.9863 already.
GBP/USD Daily Outlook
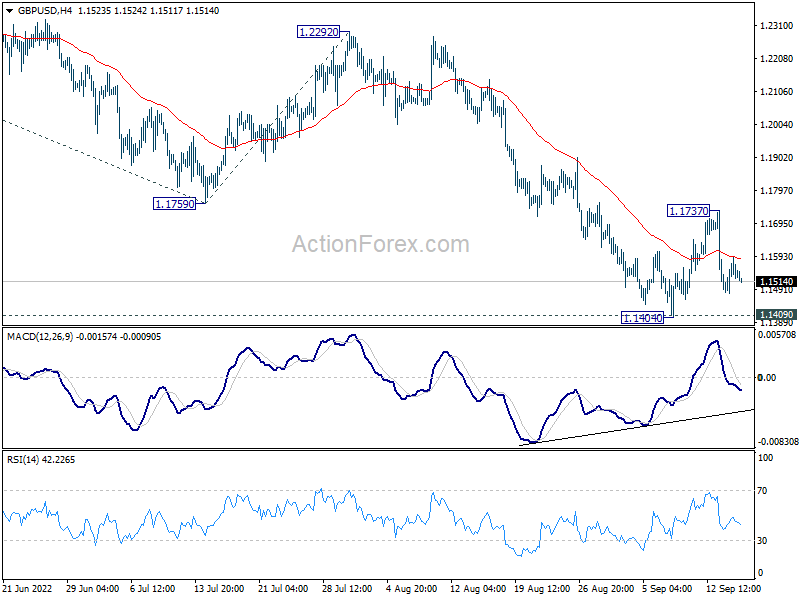
Daily Pivots: (S1) 1.1483; (P) 1.1537; (R1) 1.1593; More...
Intraday bias in GBP/USD remains neutral for the moment. On the downside, decisive break of 1.1404/9 will resume larger down trend. Next target is 61.8% projection of 1.3748 to 1.1759 from 1.2292 at 1.1063. On the upside, above 1.1737 minor resistance will resume the rebound from 1.1404 to 55 day EMA (now at 1.1904).
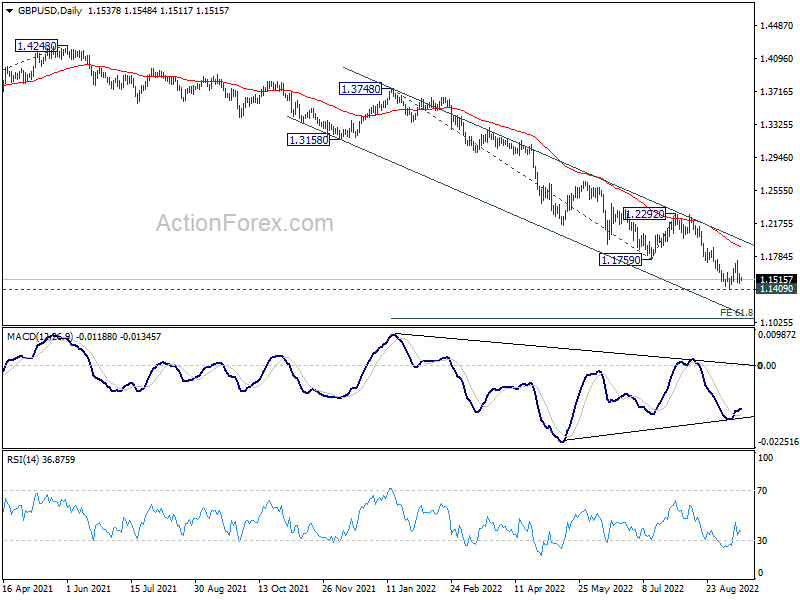
In the bigger picture, based on current momentum, fall from 1.4248 (2018 high) is probably resuming long term down trend from 2.1161 (2007 high). Sustained break of 1.1409 will target 61.8% projection of 1.7190 (2014 high) to 1.1409 (2020 low) from 1.4248 (2021 high) at 1.0675. This will remain the favored case for now as long as 1.2292 resistance holds.
USD/CHF Daily Outlook
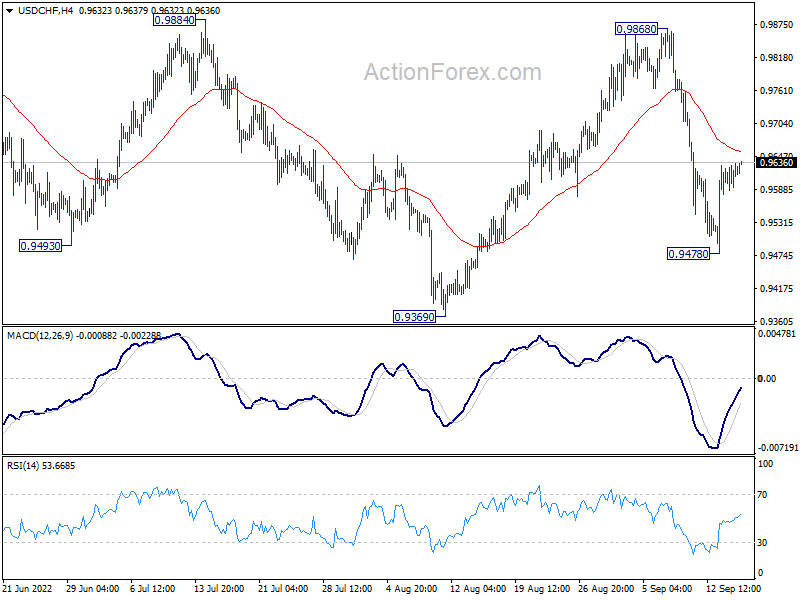
Daily Pivots: (S1) 0.9596; (P) 0.9617; (R1) 0.9644; More...
Intraday bias in USD/CHF remains neutral and outlook is unchanged. The pair is still in corrective pattern from 1.0063. Below 0.9478 will extend the fall from 0.9868 towards 0.9369 support. On the upside, firm break of 4 hour 55 EMA (now at 0.9654) will target 0.9868 resistance first. Further break there will argue that larger up trend is ready to resume through 1.0063.
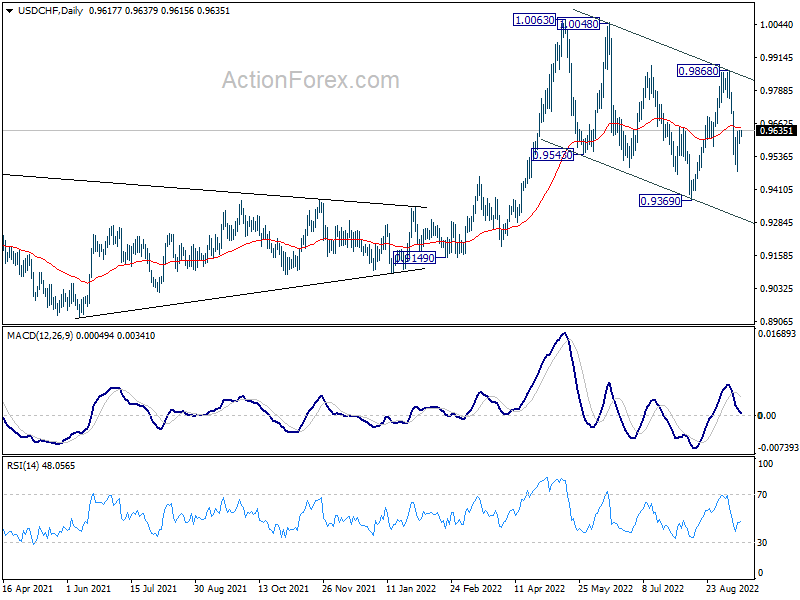
In the bigger picture, current development suggests that up trend from 0.8756 (2021 low) is still in progress. Sustained break of 1.0063 will target 100% projection of 0.9149 to 1.0063 from 0.9369 at 1.0283, and then 1.0342 (2016 high). For now, this will remain the favored case as long as 0.9369 support holds, even in case of deep pull back.
USD/JPY Daily Outlook
Daily Pivots: (S1) 142.17; (P) 143.56; (R1) 144.57; More...
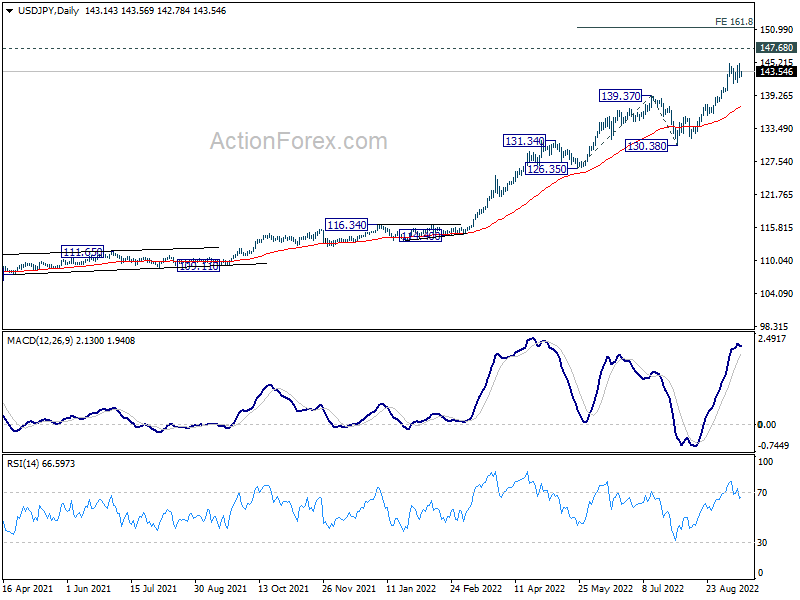
Intraday bias in USD/JPY remains neutral for the moment. While deeper retreat cannot be ruled out, downside should be contained by 139.37 resistance turned support. On the upside, break of 144.98 will resume larger up trend to 147.68 long term resistance. Break there will target 161.8% projection of 126.35 to 139.37 from 130.38 at 151.44 next.
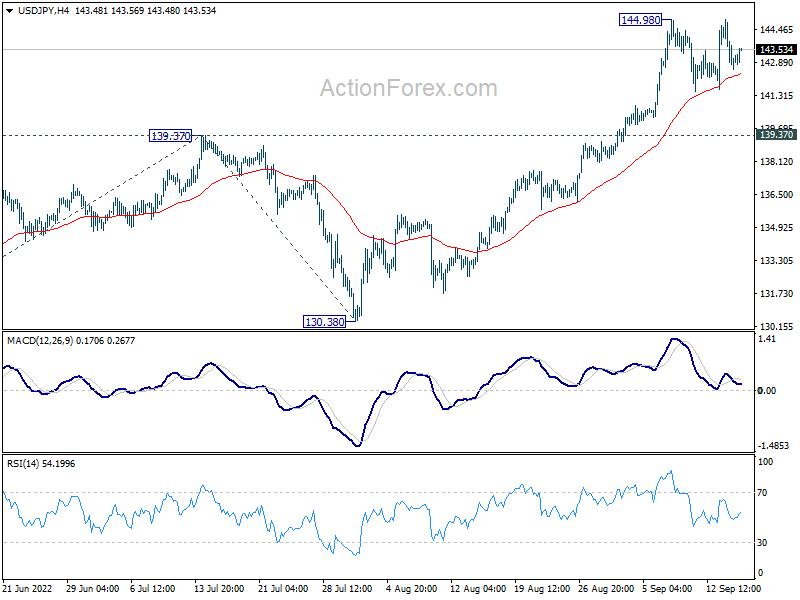
In the bigger picture, up trend from 101.18 is still in progress, as part of the whole up trend from 75.56 (2011 low). Further rise should be seen to 147.68 (1998 high). For now, break of 130.38 support is needed to be the first indication of medium term topping. Otherwise, outlook will stay bullish even in case of deep pull back.
USD/CAD Daily Outlook
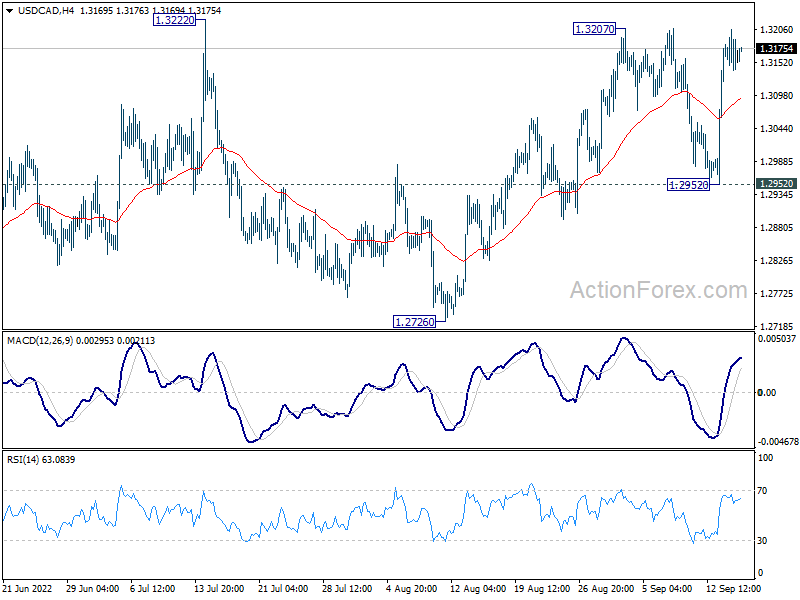
Daily Pivots: (S1) 1.3135; (P) 1.3171; (R1) 1.3202; More...
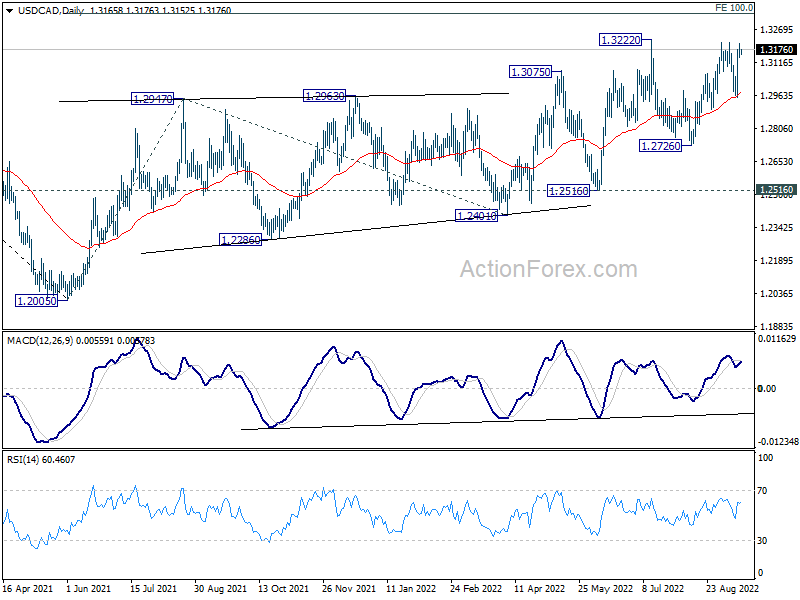
Intraday bias in USD/CAD remains neutral at this point. On the upside, decisive break of 1.3222 will resume larger up trend from 1.2005. Next target is 100% projection of 1.2005 to 1.2947 from 1.2401 at 1.3343. On the downside, however, break of 1.2952 will extend the corrective pattern from 1.3222 with another falling leg, back towards 1.2726 support instead.
In the bigger picture, down trend from 1.4667 (2020 high) should have completed at 1.2005, after defending 1.2061 long term cluster support. Rise from there should target 61.8% retracement of 1.4667 to 1.2005 (2021 low) at 1.3650. This will remain the favored case now as long as 1.2516 support holds.
AUD/USD Daily Report
Daily Pivots: (S1) 0.6715; (P) 0.6738; (R1) 0.6770; More...
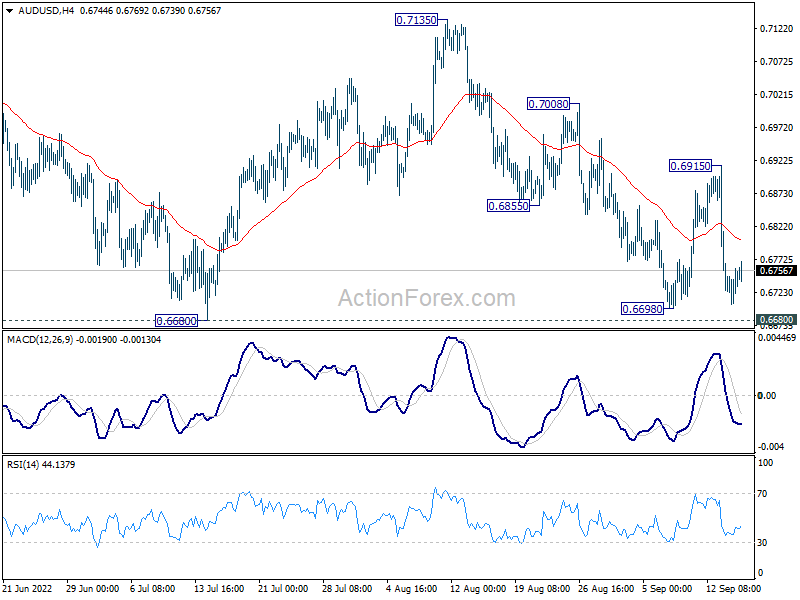
Intraday bias in AUD/USD stays neutral first. Prior rejection by 55 day EMA is a near term bearish sign. Decisive break of 0.6680 will resume larger down trend. Next target will be 0.6461 long term fibonacci level. On the upside, break of 0.6915 resistance will be a near term bullish signal, and bring stronger rally through 0.7008 towards 0.7135 resistance.
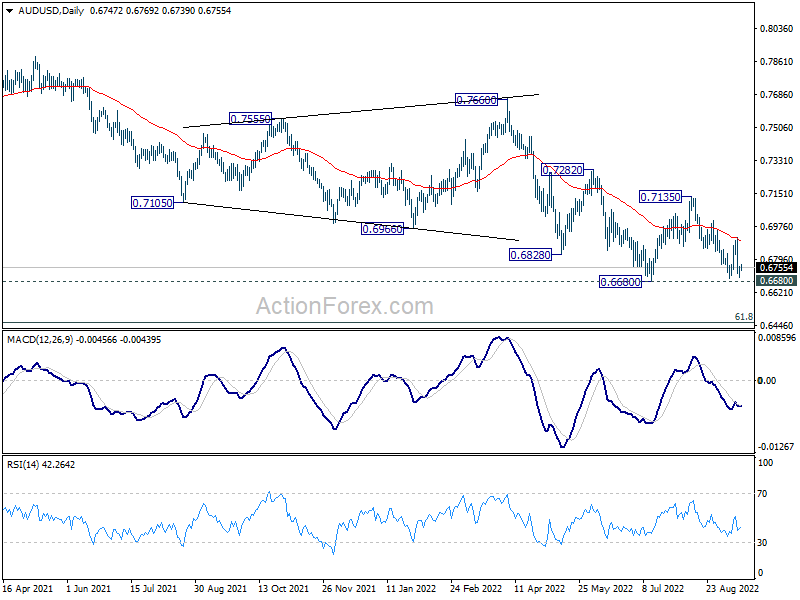
In the bigger picture, price actions from 0.8006 (2021 high) is seen more as a corrective pattern to rise from 0.5506 (2020 low). Or it could also be a bearish impulsive move. In either case, outlook will remain bearish as long as 0.7135 resistance holds. Next target is 61.8% retracement of 0.5506 to 0.8006 at 0.6461.
Dollar Still in Driving Seat as Markets Await Next Moves
The markets are overall steady in Asia today. Yen attempted a rebound yesterday but there was no follow through buying so far. Dollar's rally also lacks sustained push. While commodity currencies are staying as the worst performer for the week, there is sign of some live against Euro. But that's probably more due to Swiss Franc's pressure on the common currency than other reason. Trades will look into reactions to US retail sales data as next guidance.
Technically, near term outlook in Dollar is staying bullish in general, and upside break out is in favor. The levels to watch include 0.9863 support in EUR/USD, 1.1404 support in GBP/USD, 0.6698 support in AUD/USD, 144.98 resistance in USD/JPY, and 1.3207 resistance in USD/CAD. Judging from current sentiment, AUD/USD and USD/CAD has the potential to take the lead.
In Asia, at the time of writing, Nikkei is up 0.18%. Hong Kong HSI is up 0.46%. China Shanghai SSE is down -1.01%. Singapore Strait Times is up 0.44%. Japan 10-year JGB yield is down -0.0014 at 0.256. Overnight DOW rose 30.12%. S&P 500 rose 0.34%. NASDAQ rose 0.74%. 10-year yield dropped -0.010 to 3.412.
ECB Lane: Larger increment of interest rates appropriate
ECB Chief Economist Philip Lane said in a speech that risks to the inflation outlook are "primarily on the upside". Major short term risk is a "further disruption of energy supplies". Over the medium term, inflation may turn out to be higher than expected because of a "persistent worsening of the production capacity", further increases in "energy and food prices", and rise in "inflation expectations above our target" or higher "anticipated wage rises.
"In the context of a long projected period with inflation far above target, the net upside risks to inflation and taking into account that the current setting of the key policy rates is still highly accommodative, it was appropriate to take a major step that frontloads the transition from the prevailing highly-accommodative level of policy rates towards levels that will support a timely return of inflation to our target," he said, about last week's 75bps rate hike".
"In calibrating a multi-step transition path, the appropriate size of an individual increment will be larger, the wider the gap to the terminal rate and the more skewed the risks to the inflation target, he added.
Japan reports record monthly trade deficit, on record increase in imports
Japan exports rose 22.1% yoy to JPY 8062B in August, driven by shipments of auto and chip-related equipment. Imports rose 49.9% yoy to JPY 10879B. That's the largest increase by value on record, since data became available back in 1979. The rise was driven by higher prices for energy including crude oil, coal, and LNG.
Trade deficit came in at JPY -2817B. That's the largest monthly trade deficit on record. That's also the 13th straight month of year-on-year trade shortfalls.
In seasonally adjusted term, exports dropped -0.7% mom to JPY 8379B. Imports rose 1.5% to JPY 10750B. Trade deficit came in at JPY -2371B.
Australia employment rose 33.5k in Aug, unemployment rate ticked up to 3.5%
Australia employment rose 33.5k in August, slightly smaller than expectation of 35.5k. Full-time jobs rose 58.8k while part-time jobs decreased -25.3k.
Unemployment rate ticked up from 3.4% to 3.5%, above expectation of 3.4%. Participation rate rose 0.2% from 66.4% to 66.6%. Monthly hours worked rose 0.8% mom.
New Zealand GDP grew 1.7% qoq in Q2, driven by services
New Zealand GDP grew 1.7% qoq in Q2, above expectation of 1.0% qoq, following a -0.2% qoq decline in Q1. Service industries rose 2.7% but goods producing industries dropped -3.8%. Primary industries rose 0.2%.
"The reopening of borders, easing of both domestic and international travel restrictions, and fewer domestic restrictions under the Orange traffic light setting supported growth in industries that had been most affected by the COVID-19 response measures," national accounts – industry and production senior manager Ruvani Ratnayake said.
"In the June 2022 quarter, households and international visitors spent more on transport, accommodation, eating out, and sports and recreational activities."
Looking ahead
Eurozone will release trade balance in European session. Main focus is on US retail sales later in the day. Jobless claims, import price index, Empire State manufacturing, Philly Fed survey, industrial production, and business inventories will also be featured.
AUD/USD Daily Report
Daily Pivots: (S1) 0.6715; (P) 0.6738; (R1) 0.6770; More...
Intraday bias in AUD/USD stays neutral first. Prior rejection by 55 day EMA is a near term bearish sign. Decisive break of 0.6680 will resume larger down trend. Next target will be 0.6461 long term fibonacci level. On the upside, break of 0.6915 resistance will be a near term bullish signal, and bring stronger rally through 0.7008 towards 0.7135 resistance.
In the bigger picture, price actions from 0.8006 (2021 high) is seen more as a corrective pattern to rise from 0.5506 (2020 low). Or it could also be a bearish impulsive move. In either case, outlook will remain bearish as long as 0.7135 resistance holds. Next target is 61.8% retracement of 0.5506 to 0.8006 at 0.6461.
Economic Indicators Update
| GMT | Ccy | Events | Actual | Forecast | Previous | Revised |
|---|---|---|---|---|---|---|
| 22:45 | NZD | GDP Q/Q Q2 | 1.70% | 1.00% | -0.20% | |
| 23:50 | JPY | Trade Balance (JPY) Aug | -2.37T | -2.08T | -2.13T | -2.16T |
| 01:00 | AUD | Consumer Inflation Expectations Sep | 5.40% | 5.90% | ||
| 01:30 | AUD | Employment Change Aug | 33.5K | 35.5K | -40.9K | |
| 01:30 | AUD | Unemployment Rate Aug | 3.50% | 3.40% | 3.40% | |
| 04:30 | JPY | Tertiary Industry Index M/M Jul | -0.60% | -0.10% | -0.20% | |
| 09:00 | EUR | Eurozone Trade Balance (EUR) Jul | -32.5B | -30.8B | ||
| 12:30 | USD | Initial Jobless Claims (Sep 9) | 227K | 222K | ||
| 12:30 | USD | Retail Sales M/M Aug | 0.00% | 0.00% | ||
| 12:30 | USD | Retail Sales ex Autos M/M Aug | 0.00% | 0.40% | ||
| 12:30 | USD | Import Price Index M/M Aug | -1.20% | -1.40% | ||
| 12:30 | USD | Empire State Manufacturing Index Sep | -15.25 | -31.3 | ||
| 12:30 | USD | Philadelphia Fed Manufacturing Survey Sep | 2.5 | 6.2 | ||
| 13:15 | USD | Industrial Production M/M Aug | 0.20% | 0.60% | ||
| 14:00 | USD | Business Inventories Jul | 0.80% | 1.40% | ||
| 14:30 | USD | Natural Gas Storage | 71B | 54B |
Japan reports record monthly trade deficit, on record increase in imports
Japan exports rose 22.1% yoy to JPY 8062B in August, driven by shipments of auto and chip-related equipment. Imports rose 49.9% yoy to JPY 10879B. That's the largest increase by value on record, since data became available back in 1979. The rise was driven by higher prices for energy including crude oil, coal, and LNG.
Trade deficit came in at JPY -2817B. That's the largest monthly trade deficit on record. That's also the 13th straight month of year-on-year trade shortfalls.
In seasonally adjusted term, exports dropped -0.7% mom to JPY 8379B. Imports rose 1.5% to JPY 10750B. Trade deficit came in at JPY -2371B.
First Impressions: NZ GDP, June Quarter 2022
New Zealand's GDP rebounded by 1.7% in the June quarter, close to our forecast and the RBNZ’s expectation. Services grew strongly as tourists started to return.
- Quarterly change: +1.7% (last: -0.2%, Westpac f/c: +1.6%, market f/c: +1.0%)
- Annual change: +0.4% (Last +1.0%)
- Annual average change: +1.0% (Last: +5.0%)
New Zealand’s GDP rose by 1.7% in the June quarter, much in line with our 1.6% forecast, as well as the 1.8% rise that the Reserve Bank expected in its August Monetary Policy Statement. In contrast, the result beat the median market forecast for a 1% rise.
The bounce in the June quarter followed an (unrevised) 0.2% dip in the March quarter. Our assessment at the time was that this was due to disruptions to activity from the peak of the Omicron wave, and the absence of the usual uplift in tourist spending at that time of year. Both of those effects were reversed out in the June quarter; indeed, the border reopening led to a strong lift in tourists during what would normally have been the seasonal lull.
That was evident in the spectacular quarterly gains recorded in some sectors: 30% in accommodation and dining out, 20% in transport, 20% in arts and recreation, and 4.7% in administrative services (a group that includes travel agencies).
Even with the strong overall result, it’s important to note that there are parts of the economy that were in decline. Retail sales were down 3.7%, mining shrank by another 8%, non-food manufacturing (excluding petroleum, due to the Marsden Point refinery closure) fell by 1.3%, and construction saw a surprising 2.4% fall.
The overall picture is a normalisation of the economy as both New Zealand and the world have moved beyond Covid restrictions. Generally speaking, the parts of the economy that have been running hot in the last couple of years – when people switched their spending away from services and towards physical goods – now face a return to more sustainable levels of activity. At the same time, travel spending in particular – which was a sizeable net positive for New Zealand before the border closure – is just starting its recovery.
With today’s result very much in line with the RBNZ’s expectation, there are no obvious implications for the interest rate outlook. The heart of the issue is that the economy is running above its non-inflationary capacity. Higher interest rates will work to close that gap over time, but the challenge is in managing that process. Doing too little means that inflation could become stubbornly persistent; too much could mean an unnecessary period of weak activity and high unemployment. We agree with the RBNZ that a 4% peak in the Official Cash Rate would give the best chance of striking that balance.