

Sample Category Title
AUD/USD Daily Report
Daily Pivots: (S1) 0.6674; (P) 0.6722; (R1) 0.6748; More...
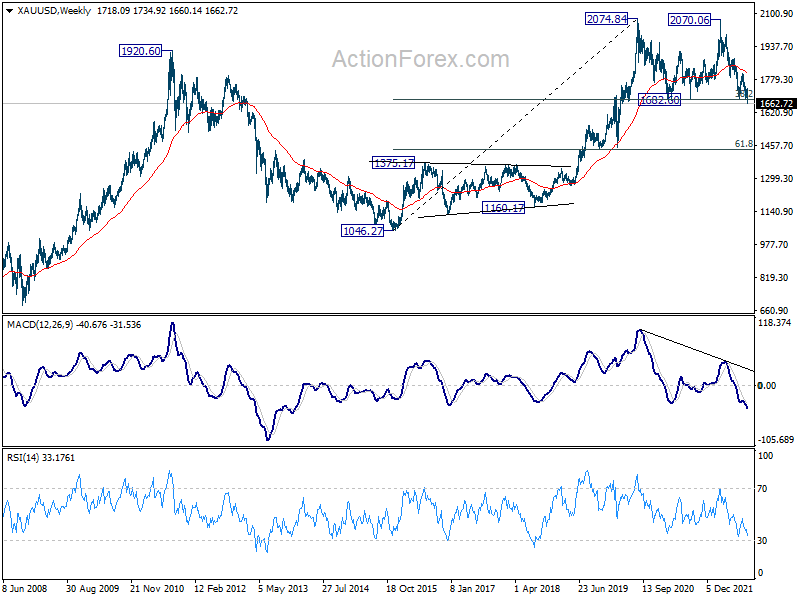
Intraday bias in AUD/USD remains neutral for the moment, and outlook stays bearish with prior rejection by 55 day EMA. Decisive break of 0.6680 will resume larger down trend. Next target will be 0.6461 long term fibonacci level. On the upside, break of 0.6915 resistance will be a near term bullish signal, and bring stronger rally through 0.7008 towards 0.7135 resistance.
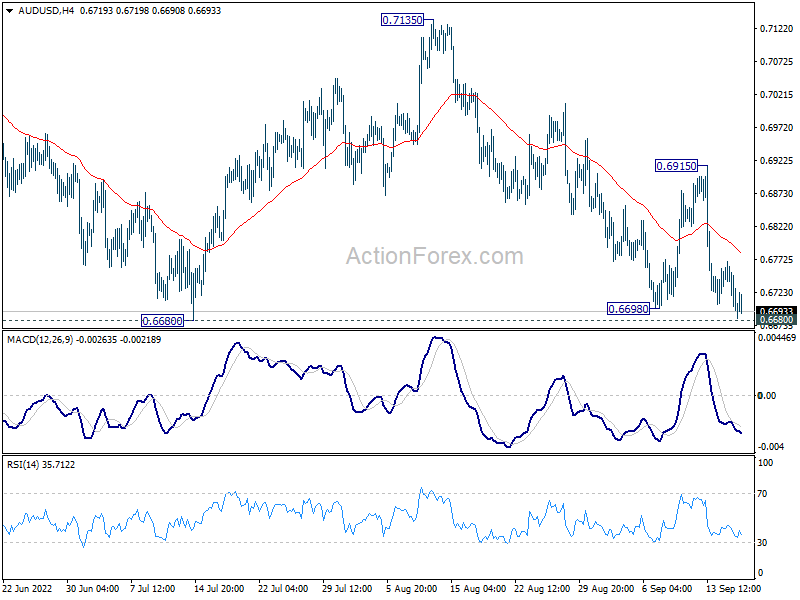
In the bigger picture, price actions from 0.8006 (2021 high) is seen more as a corrective pattern to rise from 0.5506 (2020 low). Or it could also be a bearish impulsive move. In either case, outlook will remain bearish as long as 0.7135 resistance holds. Next target is 61.8% retracement of 0.5506 to 0.8006 at 0.6461.
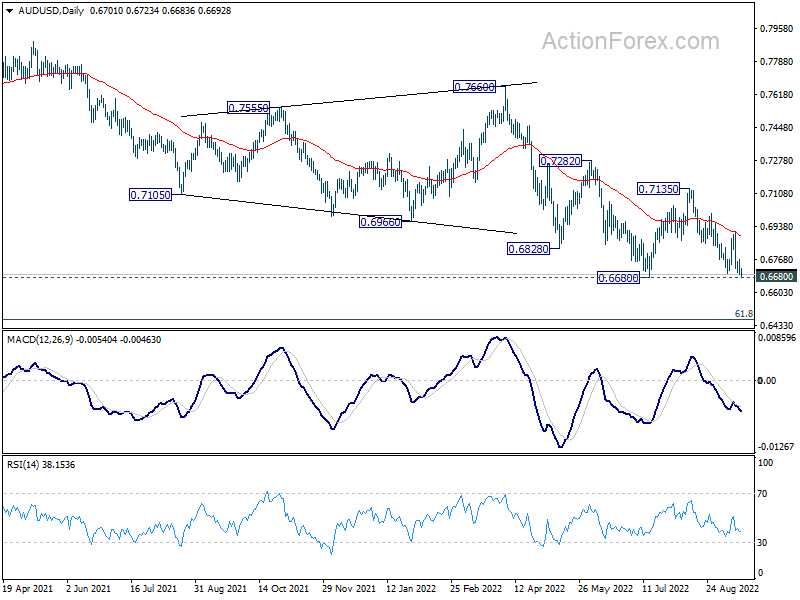
UK retail sales volume dropped -1.6% mom in Aug, sales value also down -1.7% mom
UK retail sales volume dropped -1.6% mom, -5.4% yoy in August, worst than expectation of -0.6% mom, -4.2% yoy. Ex-fuel sales volume dropped -1.6% mom, -5.0% yoy, versus expectation of -0.7% mom, -3.4% yoy.
Retail sales value also dropped -1.7% mom while ex-fuel sales value dropped -1.4% mom. On a year earlier, headline sales value rose 5.4% yoy while ex-fuel sales value rose 3.7% yoy.
Dollar Supported by Risk Aversion, Gold Breaks Down
Overall, Dollar remains the strongest one for the week, followed by Swiss Franc and then Yen. Risk aversion support these currencies, on the expectation of another jumbo rate hike by Fed next week. Commodity currencies are the worst performers with Kiwi having an underhand. Euro and Sterling are mixed for now, with Euro having a slight advantage, but that could easily flip.
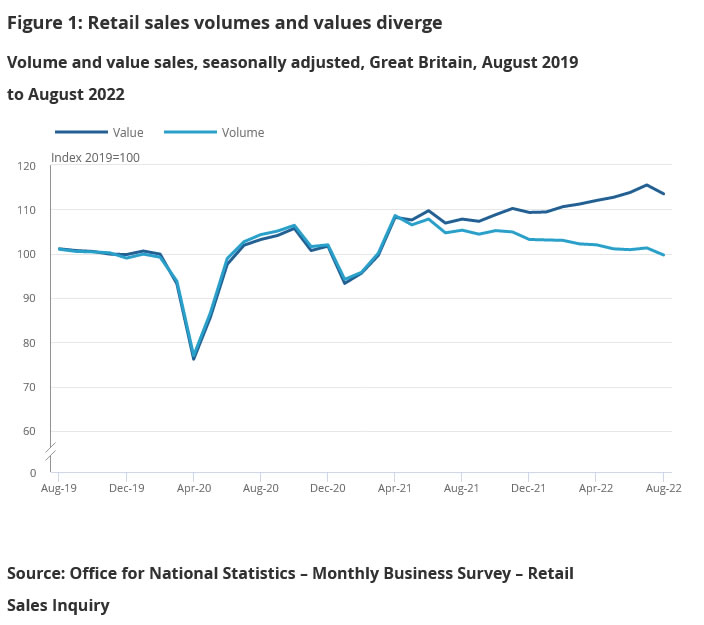
Technically, a big move came yesterday as Gold dived through key cluster support at around 1680 (which coincides with 38.% retracement of 1046.27 to 2074.84). A long term double top pattern should be formed with tops at 2074.84 and 2070.06. A weekly close below 1680 will affirm this bearish case. The stage would then be set for deeper fall to 61.8% retracement at 1439.18 in Q4. Downside momentum could intensify if US 10-year yield could break through 3.483 high decisively to resume medium term up trend.
In Asia, at the time of writing, Nikkei is down -1.07%. Hong Kong HSI is down -0.52%. China Shanghai SSE is down -1.38%. Singapore Strait Times is down -0.06%. Japan 10-year JGB yield is up 0.0028 at 0.260. Overnight, DOW dropped -0.56%. S&P 500 fell -1.13%. NASDAQ lost -1.43%. 10-year yield rose 0.047 to 3.459.
RBA Lowe: Rate at 2.35% is still too low
RBA Governor Philip Lowe told the House of Representatives Standing Committee on Economics, interest rate at 2.35% is "still too low". He added that over the longer term, the cash rate "should at least average the mid point of the inflation target", which is 2.5%, if not a bit higher. Also, an average interest rate of about 3% was "possible", and we'll cycle around some number between 2.5 and 3.5."
Lowe also warned that the longer inflation stays above 3%, "the more difficult it's going to become" for Australians. If that. happens "then we have higher interest rates and a recession, which is damaging. "So we've got two difficult kind of positions at the moment: some pain now and hopefully real wages start rising again next year against the risk of not doing anything, just sitting on our hands and having inflation stay higher."
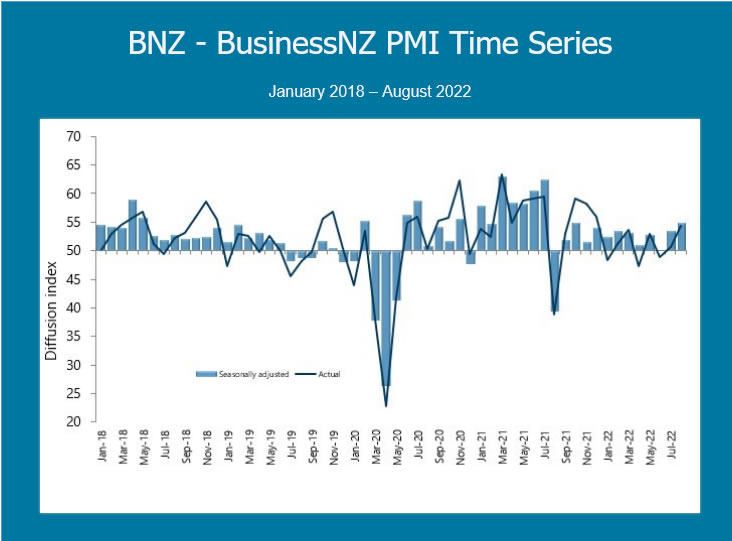
NZ BusinessNZ manufacturing rose to 54.9, improving tone around underlying growth
New Zealand BusinessNZ Performance of Manufacturing Index rose slightly from 53.5 to 54.9 in August. Production rose from 50.8 to 54.6. Employment rose from 52.9 to 53.6. New orders rose from 50.8 to 59.2. Finished stocks rose from 48.7 to 50.8. Deliveries rose from 50.1 to 53.7.
BNZ Senior Economist, Craig Ebert stated " that manufacturing production, in general, was holding its own in Q2, rather than drooping, was portrayed in the PMI readings for April May and June. And in July and August the PMI has moved on to suggest an improving tone around underlying growth."
China data beat, but USD/CNH stays above 7
China industrial production rose 4.2% yoy in August, above expectation of 4.0% yoy. Retail sales rose 5.4% yoy, above expectation of 3.2% yoy. That's the fastest pace since January-February period this year. Fixed asset investment rose 5.8% ytd yoy, above expectation of 5.6%.
"The economy held out against multiple unexpected headwinds in August and showed a positive recovery with the help of more additional supportive policies," the NBS said in a statement. "The manufacturing needs are steady and rising, employment and prices are stable, most indices are better than last month."
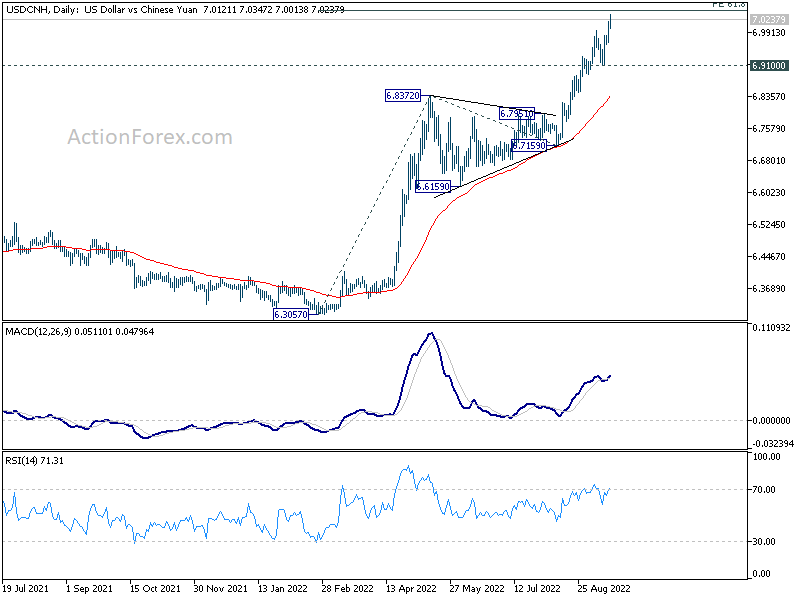
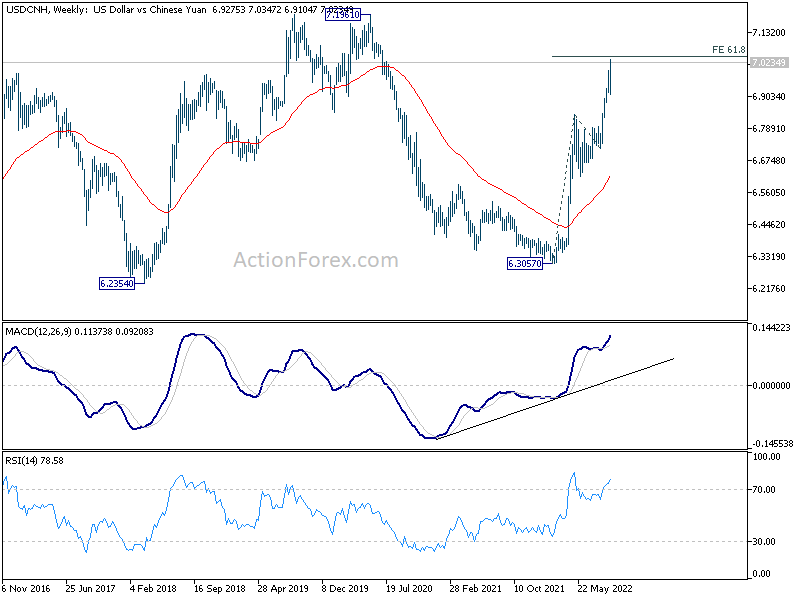
The set of better than expected data provided little support to the decline Yuan, with USD/CNH breaking through 7 psychological resistance this week. There is no sign of topping in the pair yet. USD/CNH is on track to 61.8% projection of 6.3057 to 6.8372 from 6.7159 at 7.0444. Firm break there will set the stage for pandemic high at 7.1961.
Elsewhere
UK retail sales dropped -1.6% mom in August, versus expectation of -0.6% mom. Ex-fuel sales dropped -1.6% mom, below expectation of -0.7% mom.
Looking ahead, Italy trade balance and Eurozone CPI final will be released in European session. Later in the day, Canada will release wholesales sales. US will release U of Michigan consumer sentiment.
USD/CAD Daily Outlook
Daily Pivots: (S1) 1.3175; (P) 1.3208; (R1) 1.3261; More...
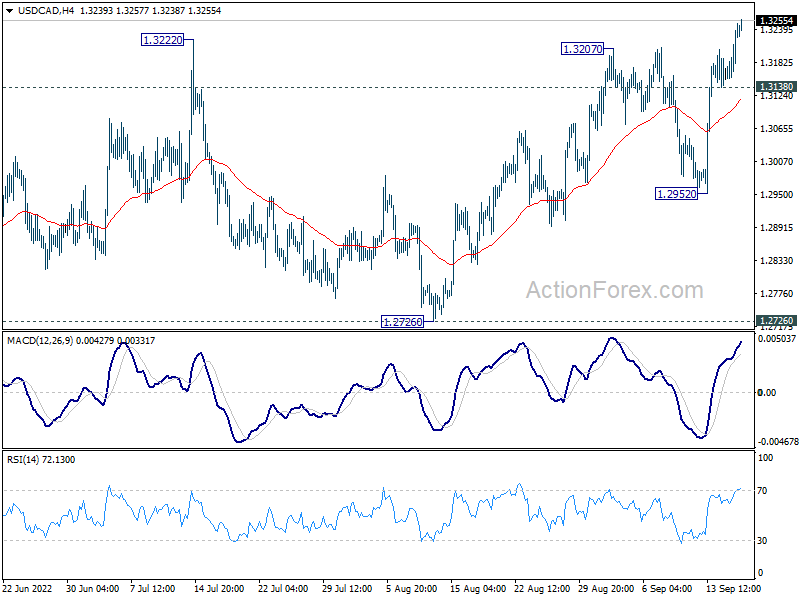
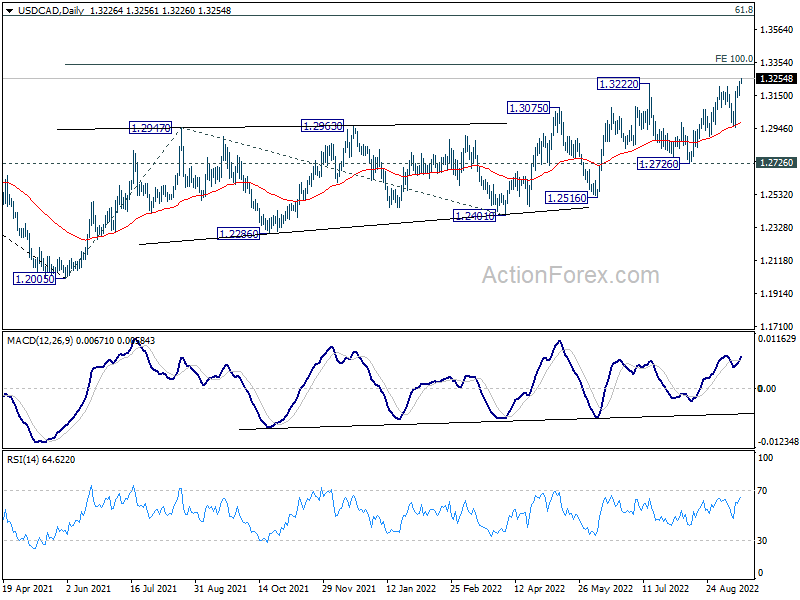
USD/CAD's break of 1.3222 resistance confirms resumption of up trend from 1.2005. Intraday bias is back on the upside. Next target is 100% projection of 1.2005 to 1.2947 from 1.2401 at 1.3343. On the downside, below 1.3238 minor support will turn intraday bias neutral first. But retreat should be contained well above 1.2952 support to bring another rally.
In the bigger picture, down trend from 1.4667 (2020 high) should have completed at 1.2005, after defending 1.2061 long term cluster support. Rise from there should target 61.8% retracement of 1.4667 to 1.2005 (2021 low) at 1.3650. This will remain the favored case now as long as 1.2726 support holds.
Economic Indicators Update
| GMT | Ccy | Events | Actual | Forecast | Previous | Revised |
|---|---|---|---|---|---|---|
| 22:30 | NZD | Business NZ PMI Aug | 54.9 | 52.7 | ||
| 02:00 | CNY | Retail Sales Y/Y Aug | 5.40% | 3.20% | 2.70% | |
| 02:00 | CNY | Industrial Production Y/Y Aug | 4.20% | 4.00% | 3.80% | |
| 02:00 | CNY | Fixed Asset Investment (YTD) Y/Y Aug | 5.80% | 5.60% | 5.70% | |
| 06:00 | GBP | Retail Sales M/M Aug | -1.60% | -0.60% | 0.30% | |
| 06:00 | GBP | Retail Sales Y/Y Aug | -5.40% | -4.20% | -3.40% | -3.20% |
| 06:00 | GBP | Retail Sales ex-Fuel M/M Aug | -1.60% | -0.70% | 0.40% | |
| 06:00 | GBP | Retail Sales ex-Fuel Y/Y Aug | -5.00% | -3.40% | -3.00% | |
| 08:00 | EUR | Italy Trade Balance (EUR) Jul | -1.50B | -2.17B | ||
| 09:00 | EUR | Eurozone CPI Y/Y Aug F | 9.10% | 9.10% | ||
| 09:00 | EUR | Eurozone CPI Core Y/Y Aug F | 4.30% | 4.30% | ||
| 12:30 | CAD | Wholesale Sales M/M Jul | 0.30% | 0.10% | ||
| 14:00 | USD | Michigan Consumer Sentiment Index Sep P | 59.8 | 58.2 |
USD/CAD Daily Outlook
Daily Pivots: (S1) 1.3175; (P) 1.3208; (R1) 1.3261; More...
USD/CAD's break of 1.3222 resistance confirms resumption of up trend from 1.2005. Intraday bias is back on the upside. Next target is 100% projection of 1.2005 to 1.2947 from 1.2401 at 1.3343. On the downside, below 1.3238 minor support will turn intraday bias neutral first. But retreat should be contained well above 1.2952 support to bring another rally.
In the bigger picture, down trend from 1.4667 (2020 high) should have completed at 1.2005, after defending 1.2061 long term cluster support. Rise from there should target 61.8% retracement of 1.4667 to 1.2005 (2021 low) at 1.3650. This will remain the favored case now as long as 1.2726 support holds.
China data beat, but USD/CNH stays above 7
China industrial production rose 4.2% yoy in August, above expectation of 4.0% yoy. Retail sales rose 5.4% yoy, above expectation of 3.2% yoy. That's the fastest pace since January-February period this year. Fixed asset investment rose 5.8% ytd yoy, above expectation of 5.6%.
"The economy held out against multiple unexpected headwinds in August and showed a positive recovery with the help of more additional supportive policies," the NBS said in a statement. "The manufacturing needs are steady and rising, employment and prices are stable, most indices are better than last month."
The set of better than expected data provided little support to the decline Yuan, with USD/CNH breaking through 7 psychological resistance this week. There is no sign of topping in the pair yet. USD/CNH is on track to 61.8% projection of 6.3057 to 6.8372 from 6.7159 at 7.0444. Firm break there will set the stage for pandemic high at 7.1961.
NZ BusinessNZ manufacturing rose to 54.9, improving tone around underlying growth
New Zealand BusinessNZ Performance of Manufacturing Index rose slightly from 53.5 to 54.9 in August. Production rose from 50.8 to 54.6. Employment rose from 52.9 to 53.6. New orders rose from 50.8 to 59.2. Finished stocks rose from 48.7 to 50.8. Deliveries rose from 50.1 to 53.7.
BNZ Senior Economist, Craig Ebert stated " that manufacturing production, in general, was holding its own in Q2, rather than drooping, was portrayed in the PMI readings for April May and June. And in July and August the PMI has moved on to suggest an improving tone around underlying growth."
RBA Lowe: Rate at 2.35% is still too low
RBA Governor Philip Lowe told the House of Representatives Standing Committee on Economics, interest rate at 2.35% is "still too low". He added that over the longer term, the cash rate "should at least average the mid point of the inflation target", which is 2.5%, if not a bit higher. Also, an average interest rate of about 3% was "possible", and we'll cycle around some number between 2.5 and 3.5."
Lowe also warned that the longer inflation stays above 3%, "the more difficult it's going to become" for Australians. If that. happens "then we have higher interest rates and a recession, which is damaging. "So we've got two difficult kind of positions at the moment: some pain now and hopefully real wages start rising again next year against the risk of not doing anything, just sitting on our hands and having inflation stay higher."
Cliff Notes: A Wild Ride for Global Markets
Key insights from the week that was.
This week, Australian data provided a constructive view on the economic outlook. Global financial markets meanwhile were jolted by the US’ strong August CPI report.
Beginning first with consumer sentiment, the Westpac-MI survey reported a bounce in confidence, the headline index gaining 3.9%. Coming at a time of high uncertainty around the cost of living, the domestic rate outlook and global growth, this is a pleasing result. Though, at 84.4, the index remains near historic lows typically only seen during recessions and major economic disturbances. Arguably, the key difference between now and these other periods is that the Australian labour market is extremely tight, with the unemployment rate at 50-year lows. Nominal wage growth is also strengthening, which is perhaps, in part, why ‘family finance expectations for the year ahead’ rose 5% in September even as ‘family finances versus a year ago’ declined 5% to a 10-year low. Notably, ‘time to buy a major household item’ is still 34% below average and our quarterly ‘wisest place for savings’ questions point to intense risk aversion.
Chief Economist Bill Evans provided a full discussion of the implications of the latest sentiment readings for the economy in a video update mid-week. The outlook for the housing market heading into spring was also a key theme of our latest Market Outlook in Conversation podcast.
According to NAB’s latest business survey, Australian firms are drawing strength and optimism from current circumstances, with conditions up 1pt to +20 and confidence up 2pts to +10 in August – both well above average reads. Importantly, the momentum in business conditions looks to be broad based by state and industry. Views on utilisation also continue to point towards labour and capital being at full capacity. Thankfully for inflation, upstream cost pressures moderated somewhat in August, although they remain at very elevated levels, having reached a record high in July.
Despite still being impacted by COVID-19 absences, August’s employment print indicates the labour market remains in robust health. At 33.5k, job growth in the month was able to offset much of the decline observed in July (-40.9k). And a solid increase in participation led to the up-tick in the unemployment rate to 3.5%. A stronger result would have arguably been possible had illness not affected hours and the number of workers available. These impediments should subside in coming months, giving room for further gains before 2022’s rate hikes slow the economy and consequently labour demand into 2023.
The August overseas arrivals and departures release meanwhile marked two key developments: a ‘normalisation’ of overseas travel towards typical seasonal trends; and hints that momentum in visa arrivals is beginning to build. On the latter, the lack of net positive visa arrivals has been a key contributor to labour market tightness. It is therefore promising to see the ‘temporary work’ group of visa arrivals post a solid net gain of 10.3k in August. With more resources dedicated to reducing visa processing backlogs, the return of foreign labour should, in time, go some way towards alleviating Australia’s labour supply constraints.
Over in New Zealand, as anticipated by Westpac, Q2 GDP was strong, gaining 1.7% as the service sector benefitted from the return of international tourists. The result also confirms that the 0.2% decline of Q1 was due to temporary factors, particularly disruptions related to the omicron wave of COVID-19 which have now largely passed. The Q2 result supports our expectation that the RBNZ will continue to hike into year end to a peak cash rate of 4.0%. This is necessary to bring demand and supply into line and mitigate inflation risks.
Turning then to the US. August’s strong core CPI print got all the headlines this week, but the dataflow was decidedly mixed overall.
Against an expectation of a 0.3% gain for the month, August’s 0.6% rise for the core CPI was a shock to markets, particularly as they had prepared for a downside surprise. With the recent hawkish rhetoric of FOMC members still fresh in their minds, market participants bid the US dollar aggressively straight after the release, while bonds and equities sold off in an equally volatile fashion. Westpac and the market now expect at least 175bps of hikes into year-end by the FOMC, taking the fed funds rate to a peak of 4.125% (Westpac) or above (market).
Westpac sees the flow of decisions as most likely being a 75bp hike in September followed by a 50bp increase at both the November and December meetings. The market however is pricing a greater risk of an accelerated delivery during September and November, with 150bps priced for those two meetings, as well as the need for additional tightening in late-2022 or early 2023, with around 215bps priced by March 2023.
Arguably, the FOMC sees a need to act with such vigour to keep real yields along the yield curve materially above zero – currently 5-10 year real yields are around 1.0%. To do so, nominal yields need to be kept around current levels into year end, and the anticipated 2023 decline managed to a pace proportional to the fall in medium-term inflation expectations. Maintaining real yields around 1.0% well into 2023 should give the FOMC comfort that the remaining risks related to inflation will pass.
Our concern however is that the hit to output from the fight against inflation will endure. Currently we see an output gap circa 3.0% of GDP by end-2023, likely increasing to 3.5% come end-2024 given rate cuts are only expected to commence in 2024 once inflation has abated. If this forecast eventuates, it will prove a material negative for US productivity, profitability and income into the medium-term as well as a material hindrance to the US’ emission reduction ambition to 2030 and beyond – as discussed in our September Market Outlook.
Notably, the activity data released this week has highlighted that the risks to US growth lay to the downside. Control group retail sales were much weaker than expected in August (0.0% against 0.5% consensus) and the July growth rate was halved to 0.4%. Industrial production also contracted 0.2% in August (0.0% consensus), while recent readings from the regional federal reserve surveys point to increasingly fragile conditions and growing uncertainty over the outlook.
As a result, the latest estimate of Q3 GDP from the Atlanta Fed’s GDPnow nowcast is just 0.5% annualised, less than a quarter of the decline in activity experienced over H1 2022. At the turn of the year and through 2023, financial markets are likely to increasingly factor in these risks for the US, particularly FX markets given the US dollar’s historically-elevated starting level.
Technical Outlook and Review
USD/JPY:
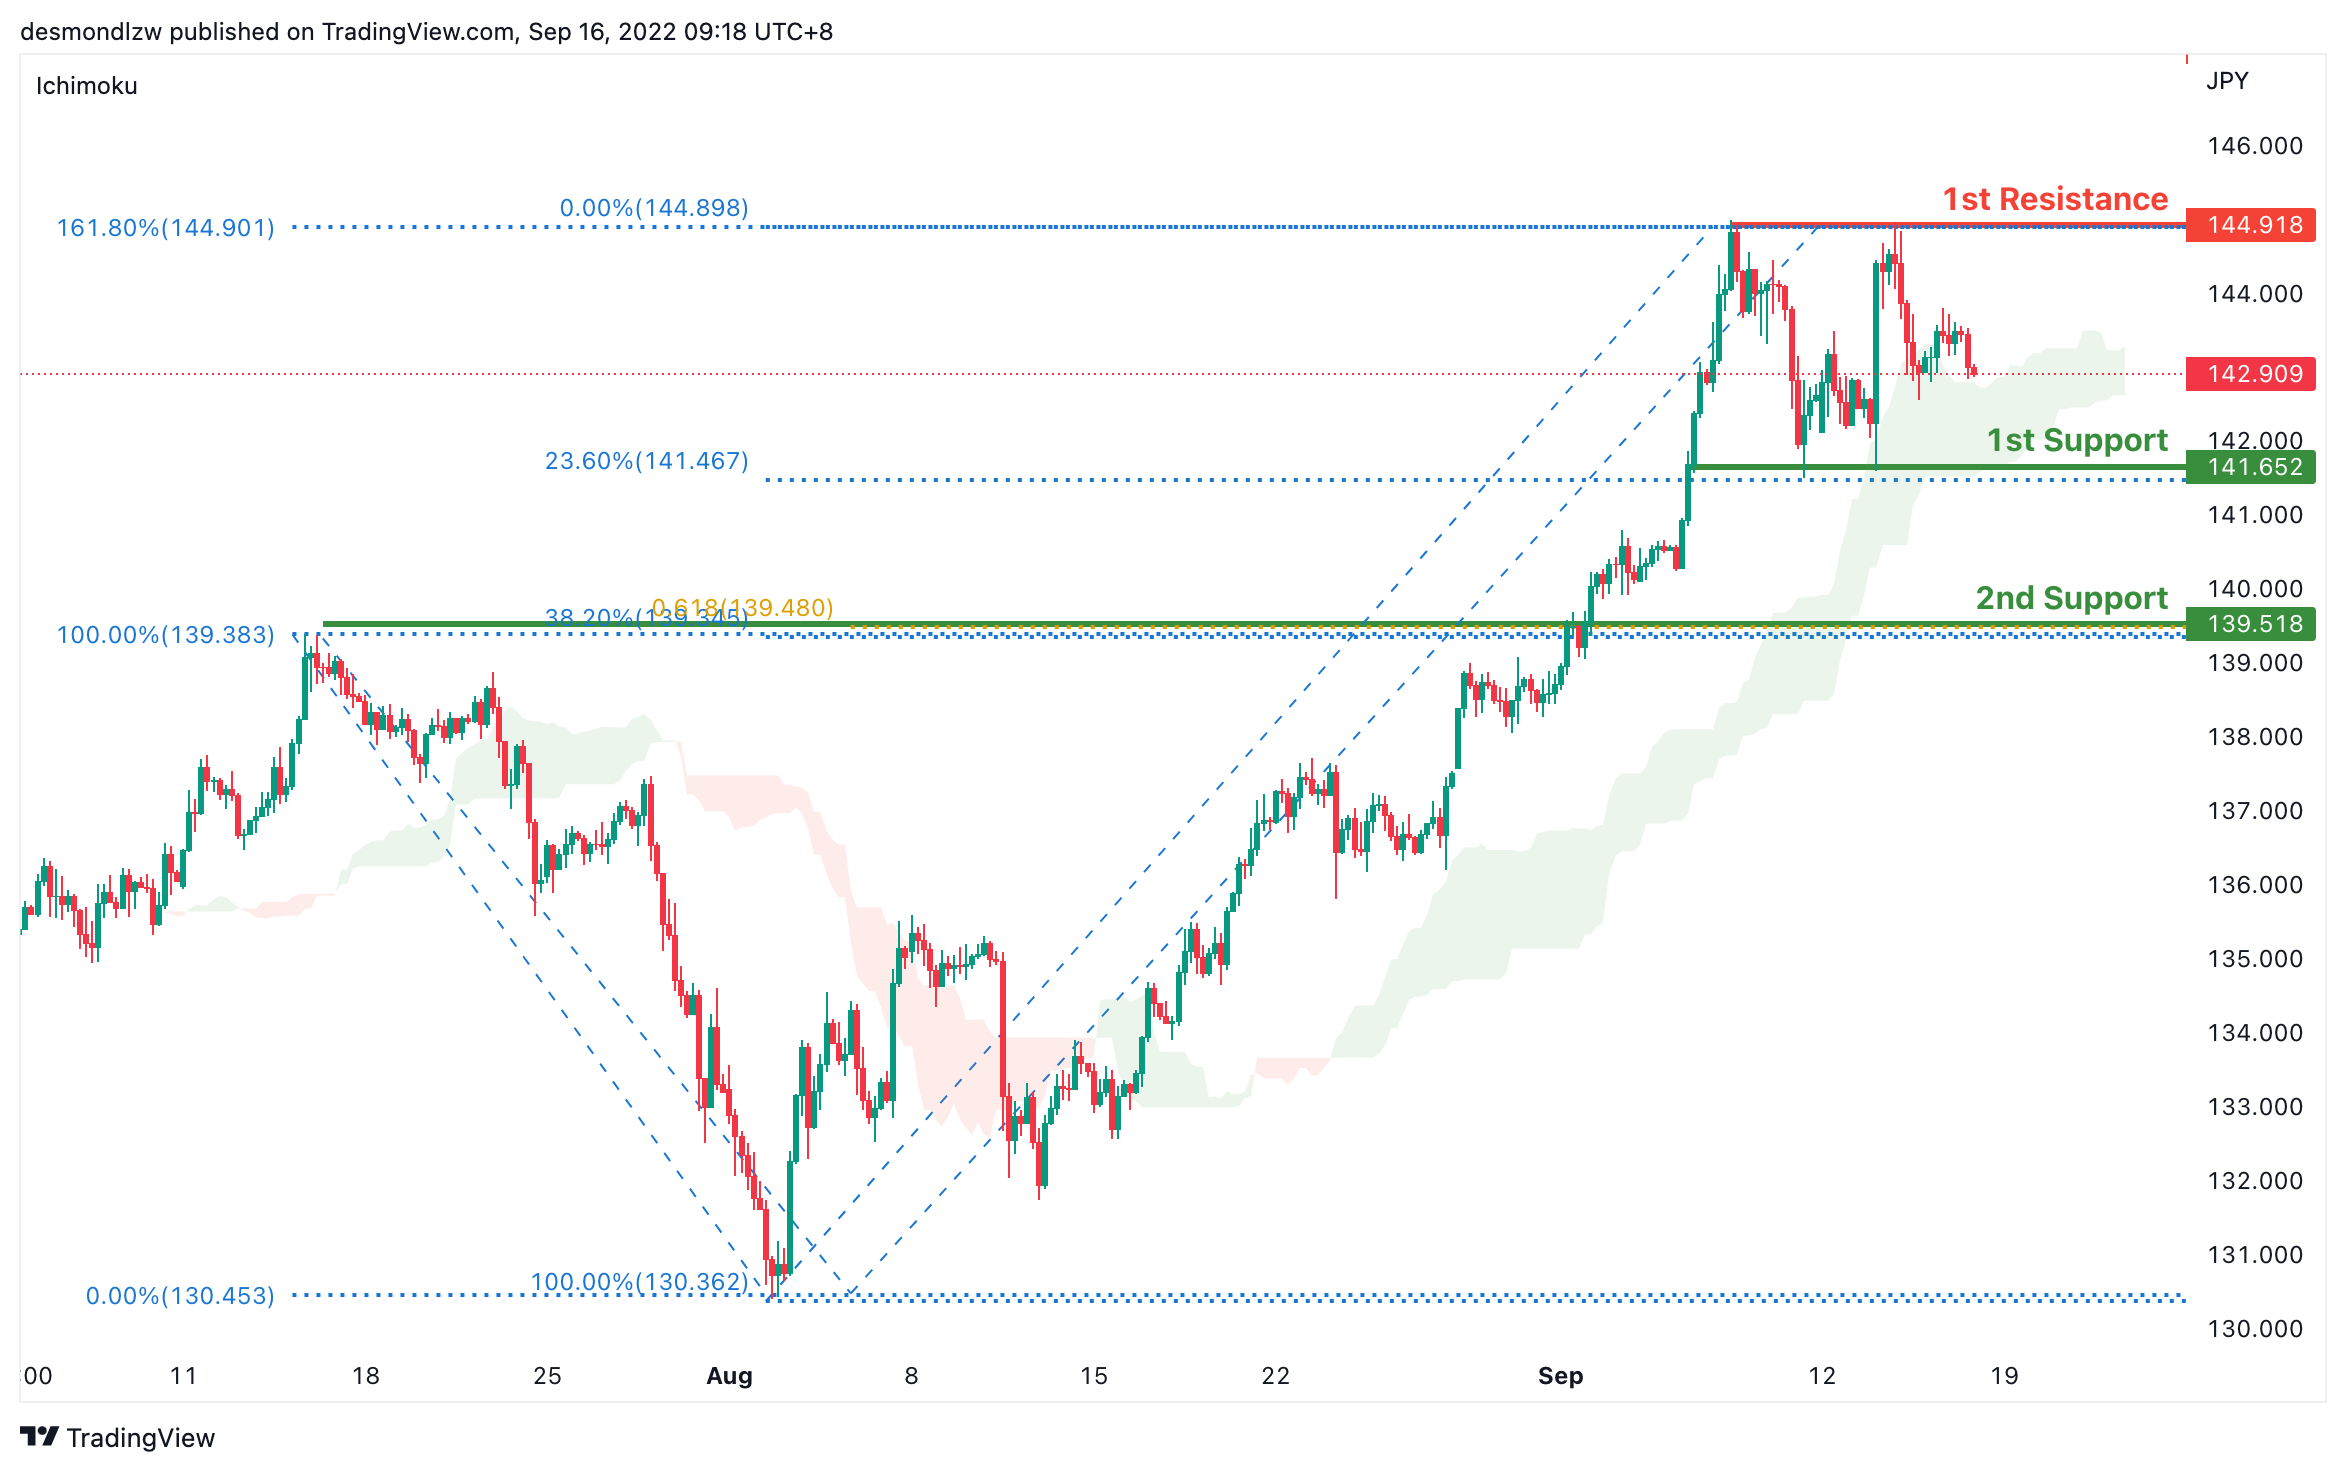
On the H4 chart, price is still respecting the ascending momentum. We are still bullish bias- Price is testing above the previous low and if bullish momentum continues, it should bring price to first resistance at 144.918 where the 161.8% extension sits. If it breaks this level, it should bring price to 147.332 where the previous swing high sits. Alternatively it could pull back to the first support at 141.652 where the 23.6% retracement and 100% projection sits then to the second support at 139.518 where the 38.2% retracement and overlapping support sits.
Areas of consideration:
- H4 time frame, 1st resistance at 144.918
- H4 time frame, 1st support at 141.652
DXY:
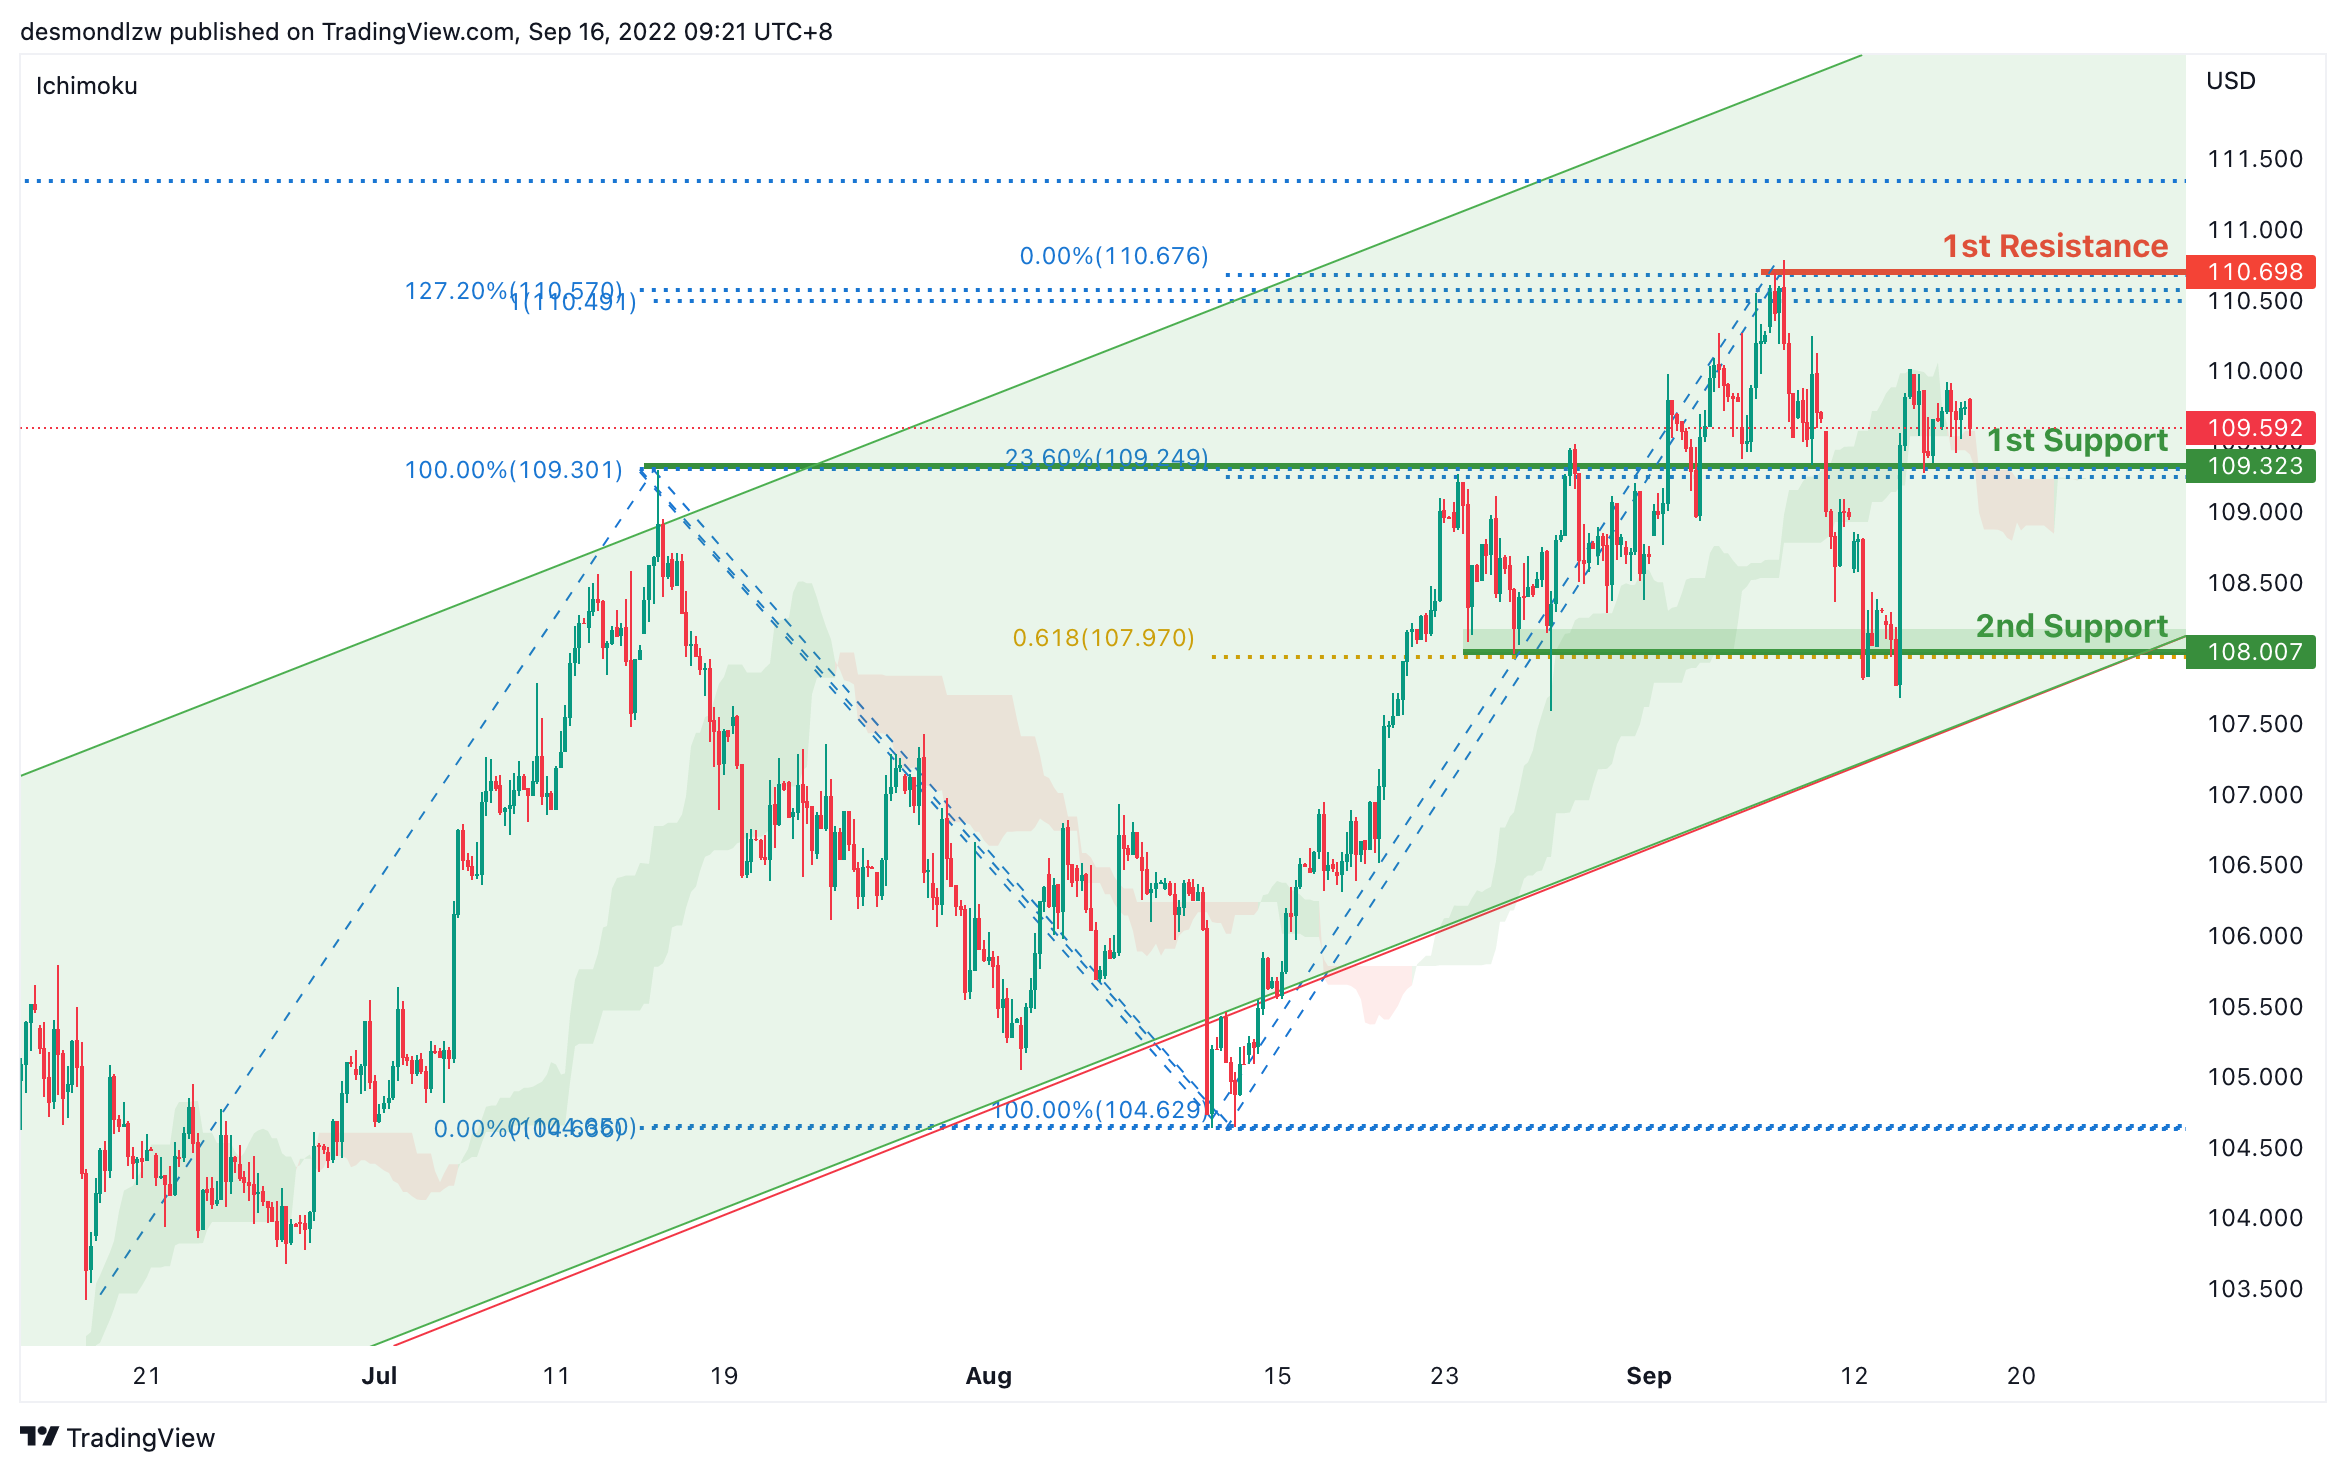
On the H4, price is still respecting the bullish channel and has failed to break the first support- we are bullish bias. Price has rebounded off the support level and is moving toward the first resistance at 110.698 levels where the previous swing high sits. Alternatively, price could pull back to test the first support at 109.323 where the 23.6% retracement sits then the second support at 108.007 where the 61.8% projection, 61.8% retracement and previous swing low sits.
Areas of consideration:
- H4 time frame, 1st resistance at 110.698
- H4 time frame, 1st support at 109.323
EUR/USD:
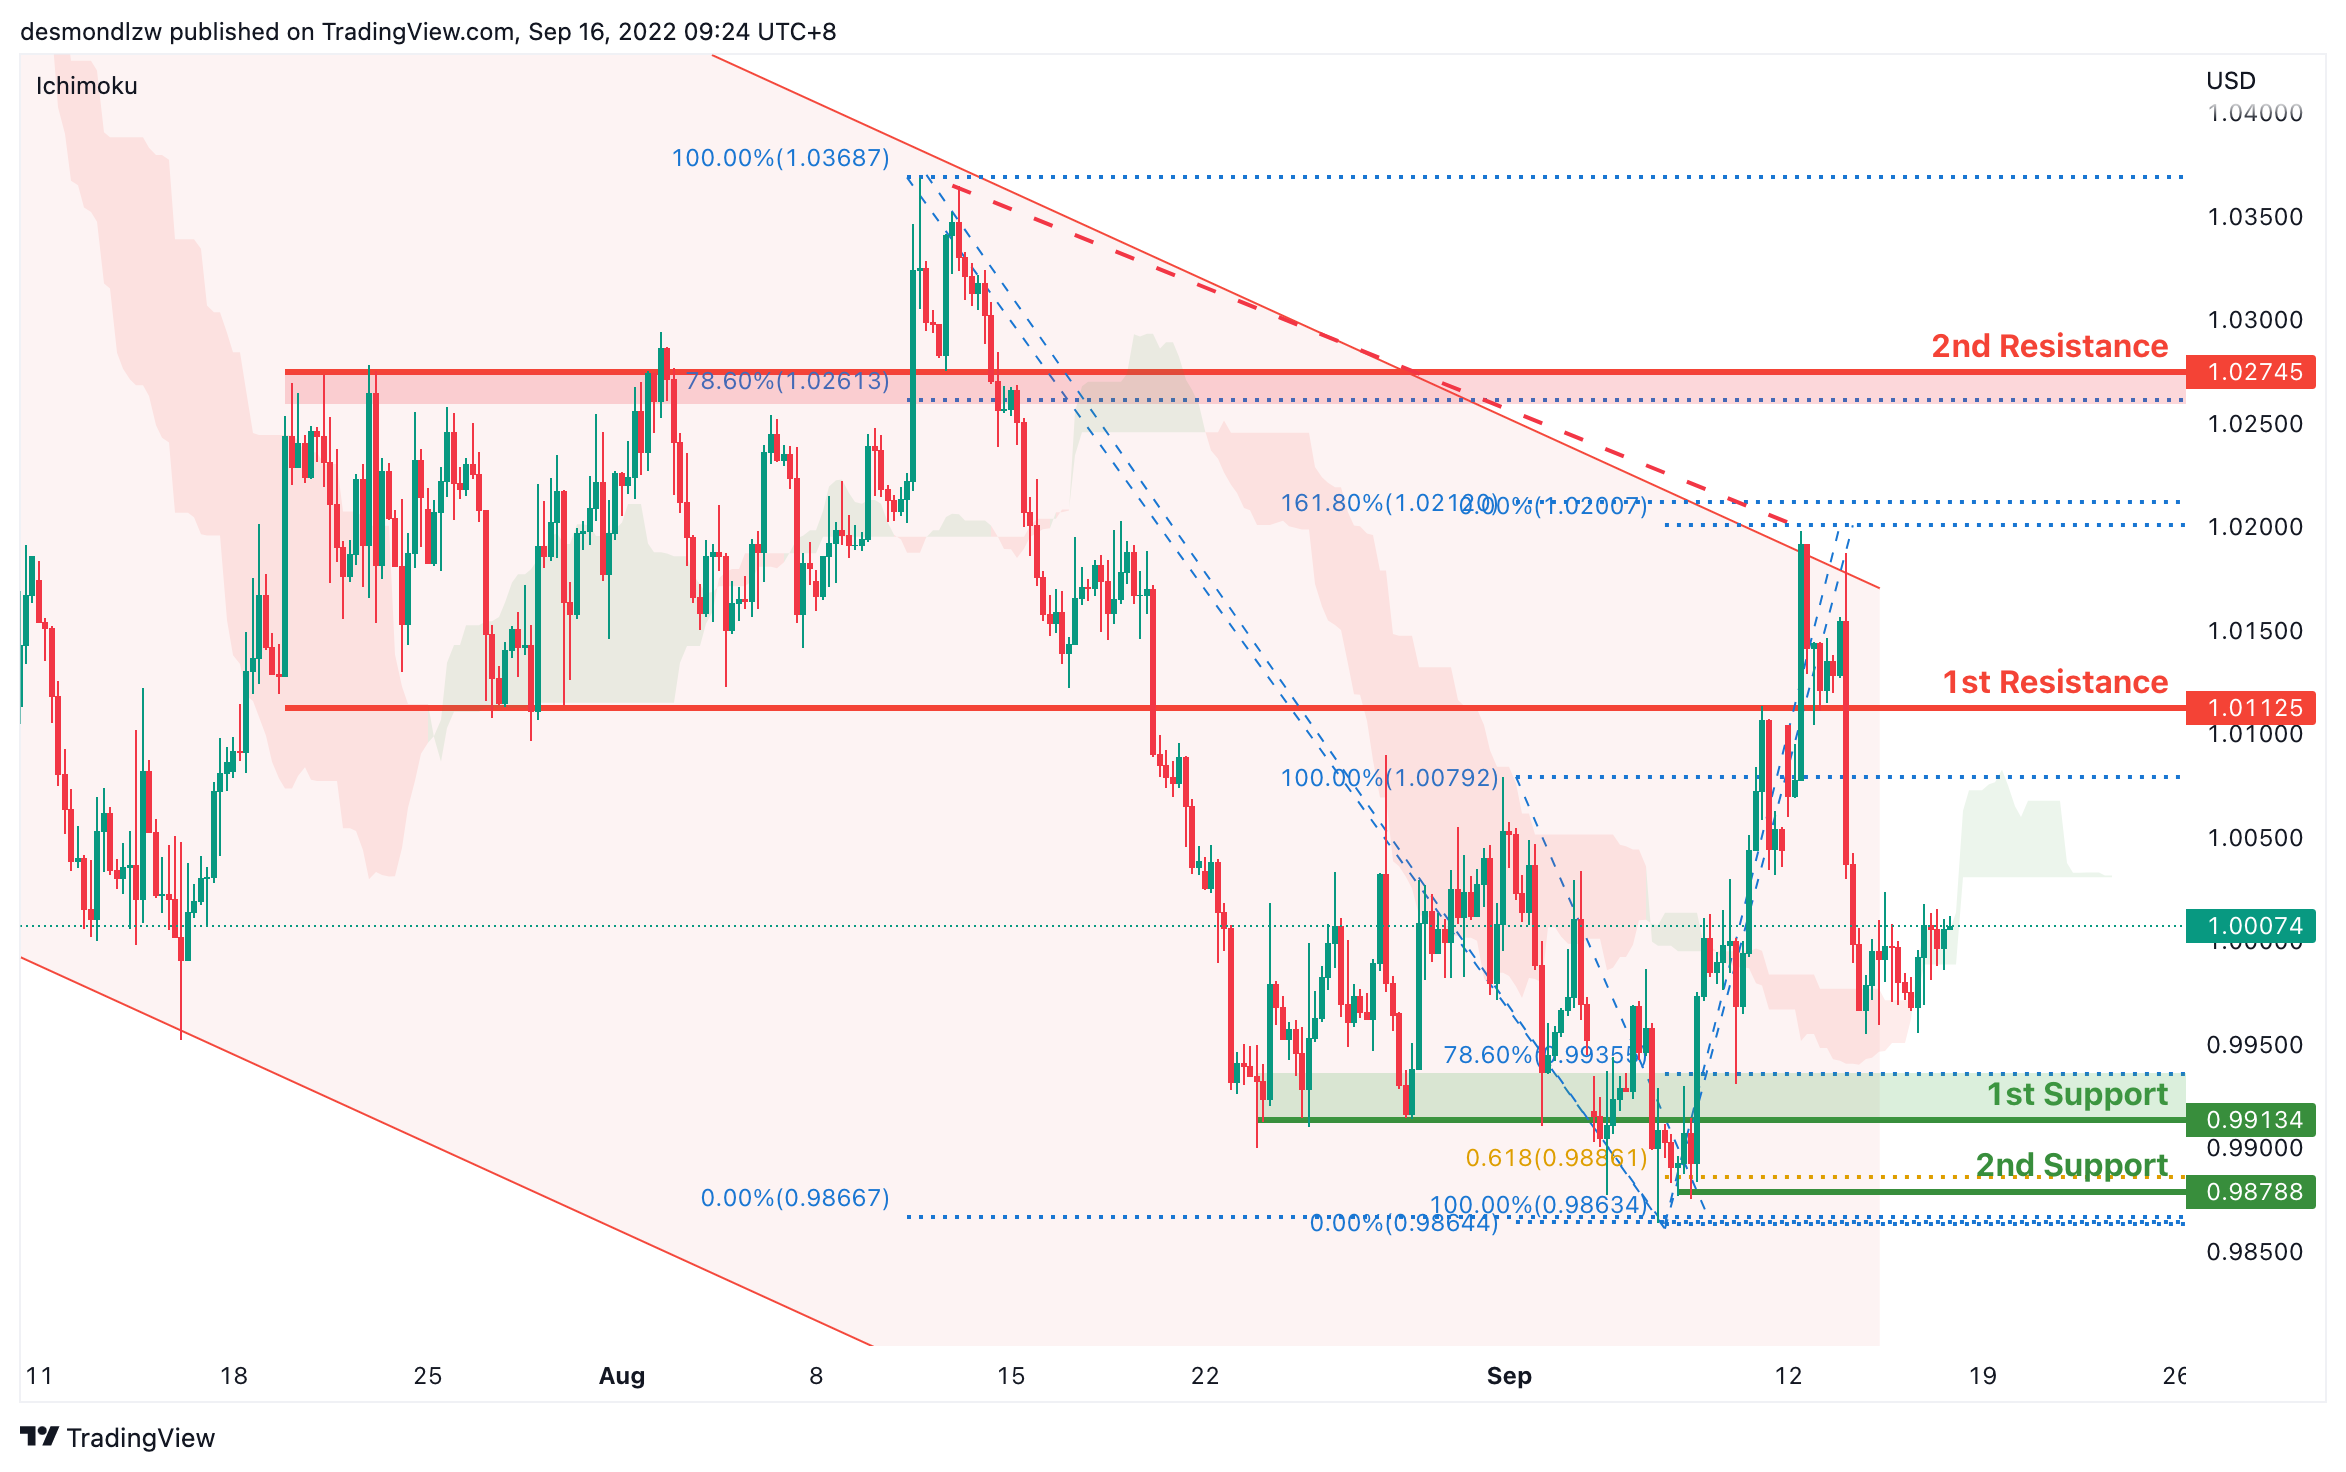
On the H4, price is moving within the channel, we are currently bullish bias as price fails to break the first support. Price seems like its moving to first resistance at 1.0112 level where the previous swing low sits. If bullish momentum continues, it should bring price to second resistance at 1.0274 where the 78.6% retracement and previous swing high sits. Alternatively, price could pull back to test the first support at 0.9913 where the 78.6% projection and previous swing low sits, subsequently the second support at 0.9878 where the previous swing low sits.
Areas of consideration :
- H4 1st resistance at 1.0112
- H4 1st support at 0.99134
GBP/USD:
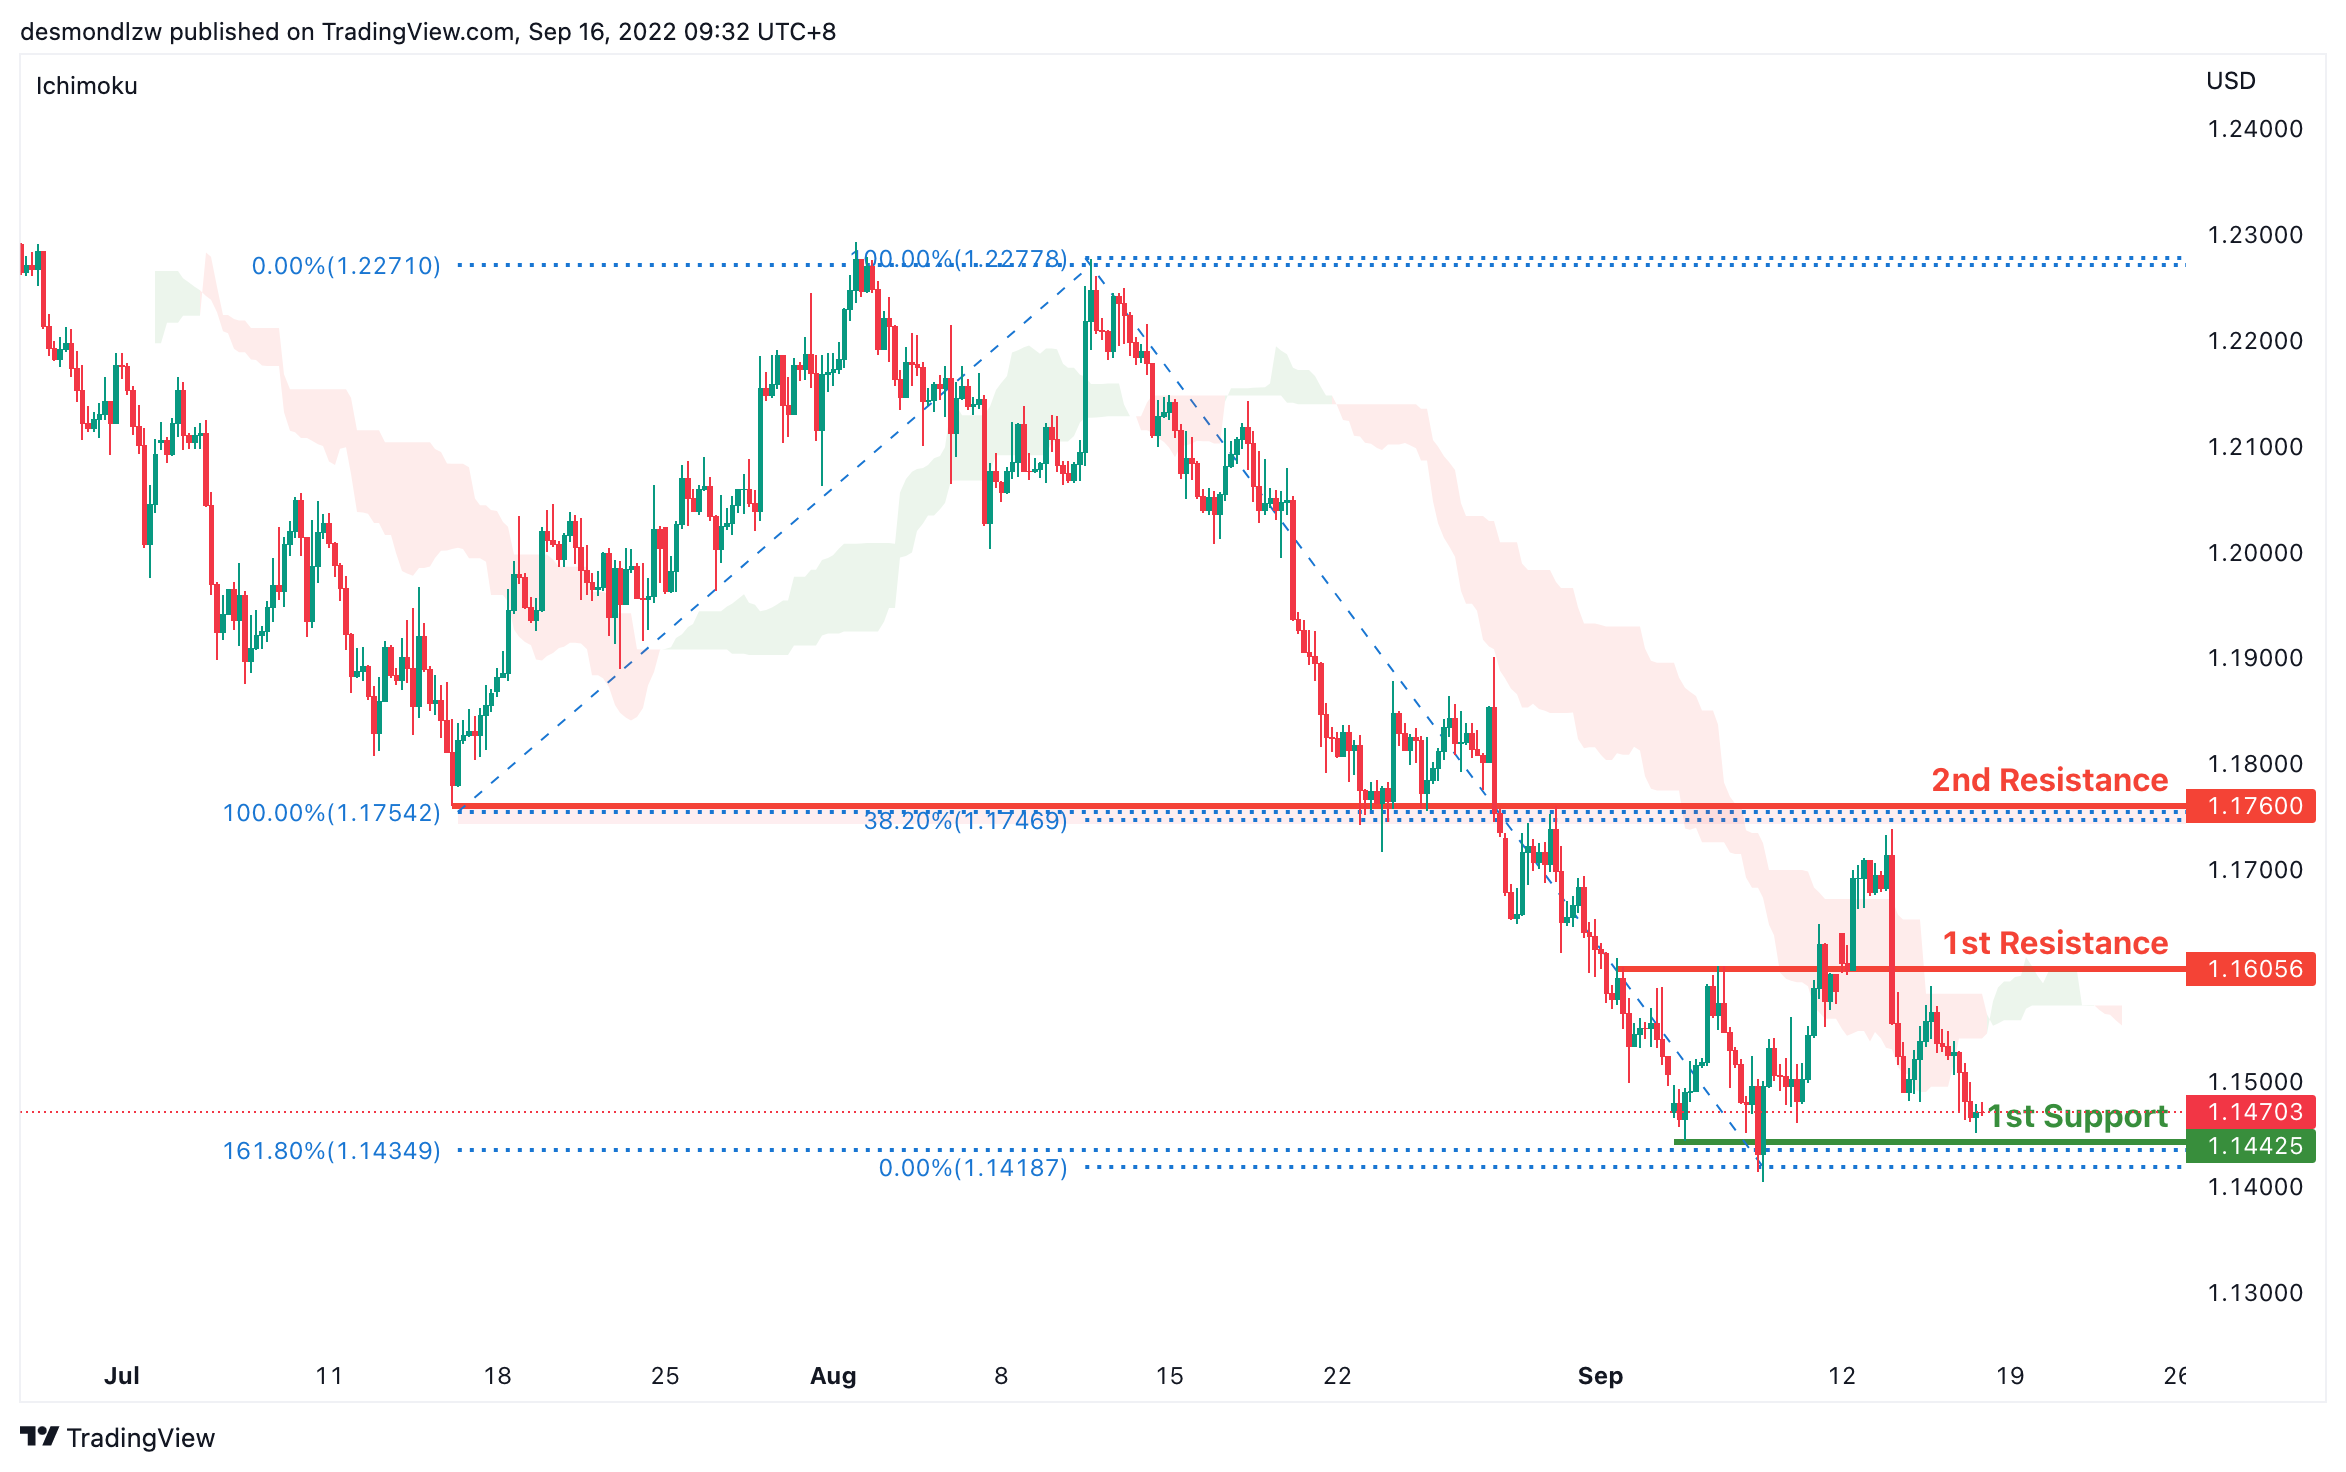
On the H4, prices are still moving in a bearish momentum hence we are bearish biassed. Prices seem to be moving toward the first support at 1.1442 where the 161.8% extension and previous swing low sits. Alternatively, price could pull back to test the first resistance at 1.1605 where the 23.6% retracement and overlapping support sits then the second resistance at 1.1760 where the 38.2% retracement and previous swing high sits
Areas of consideration:
- H4 1st resistance at 1.1605
- H4 1st support at 1.1442
USD/CHF:
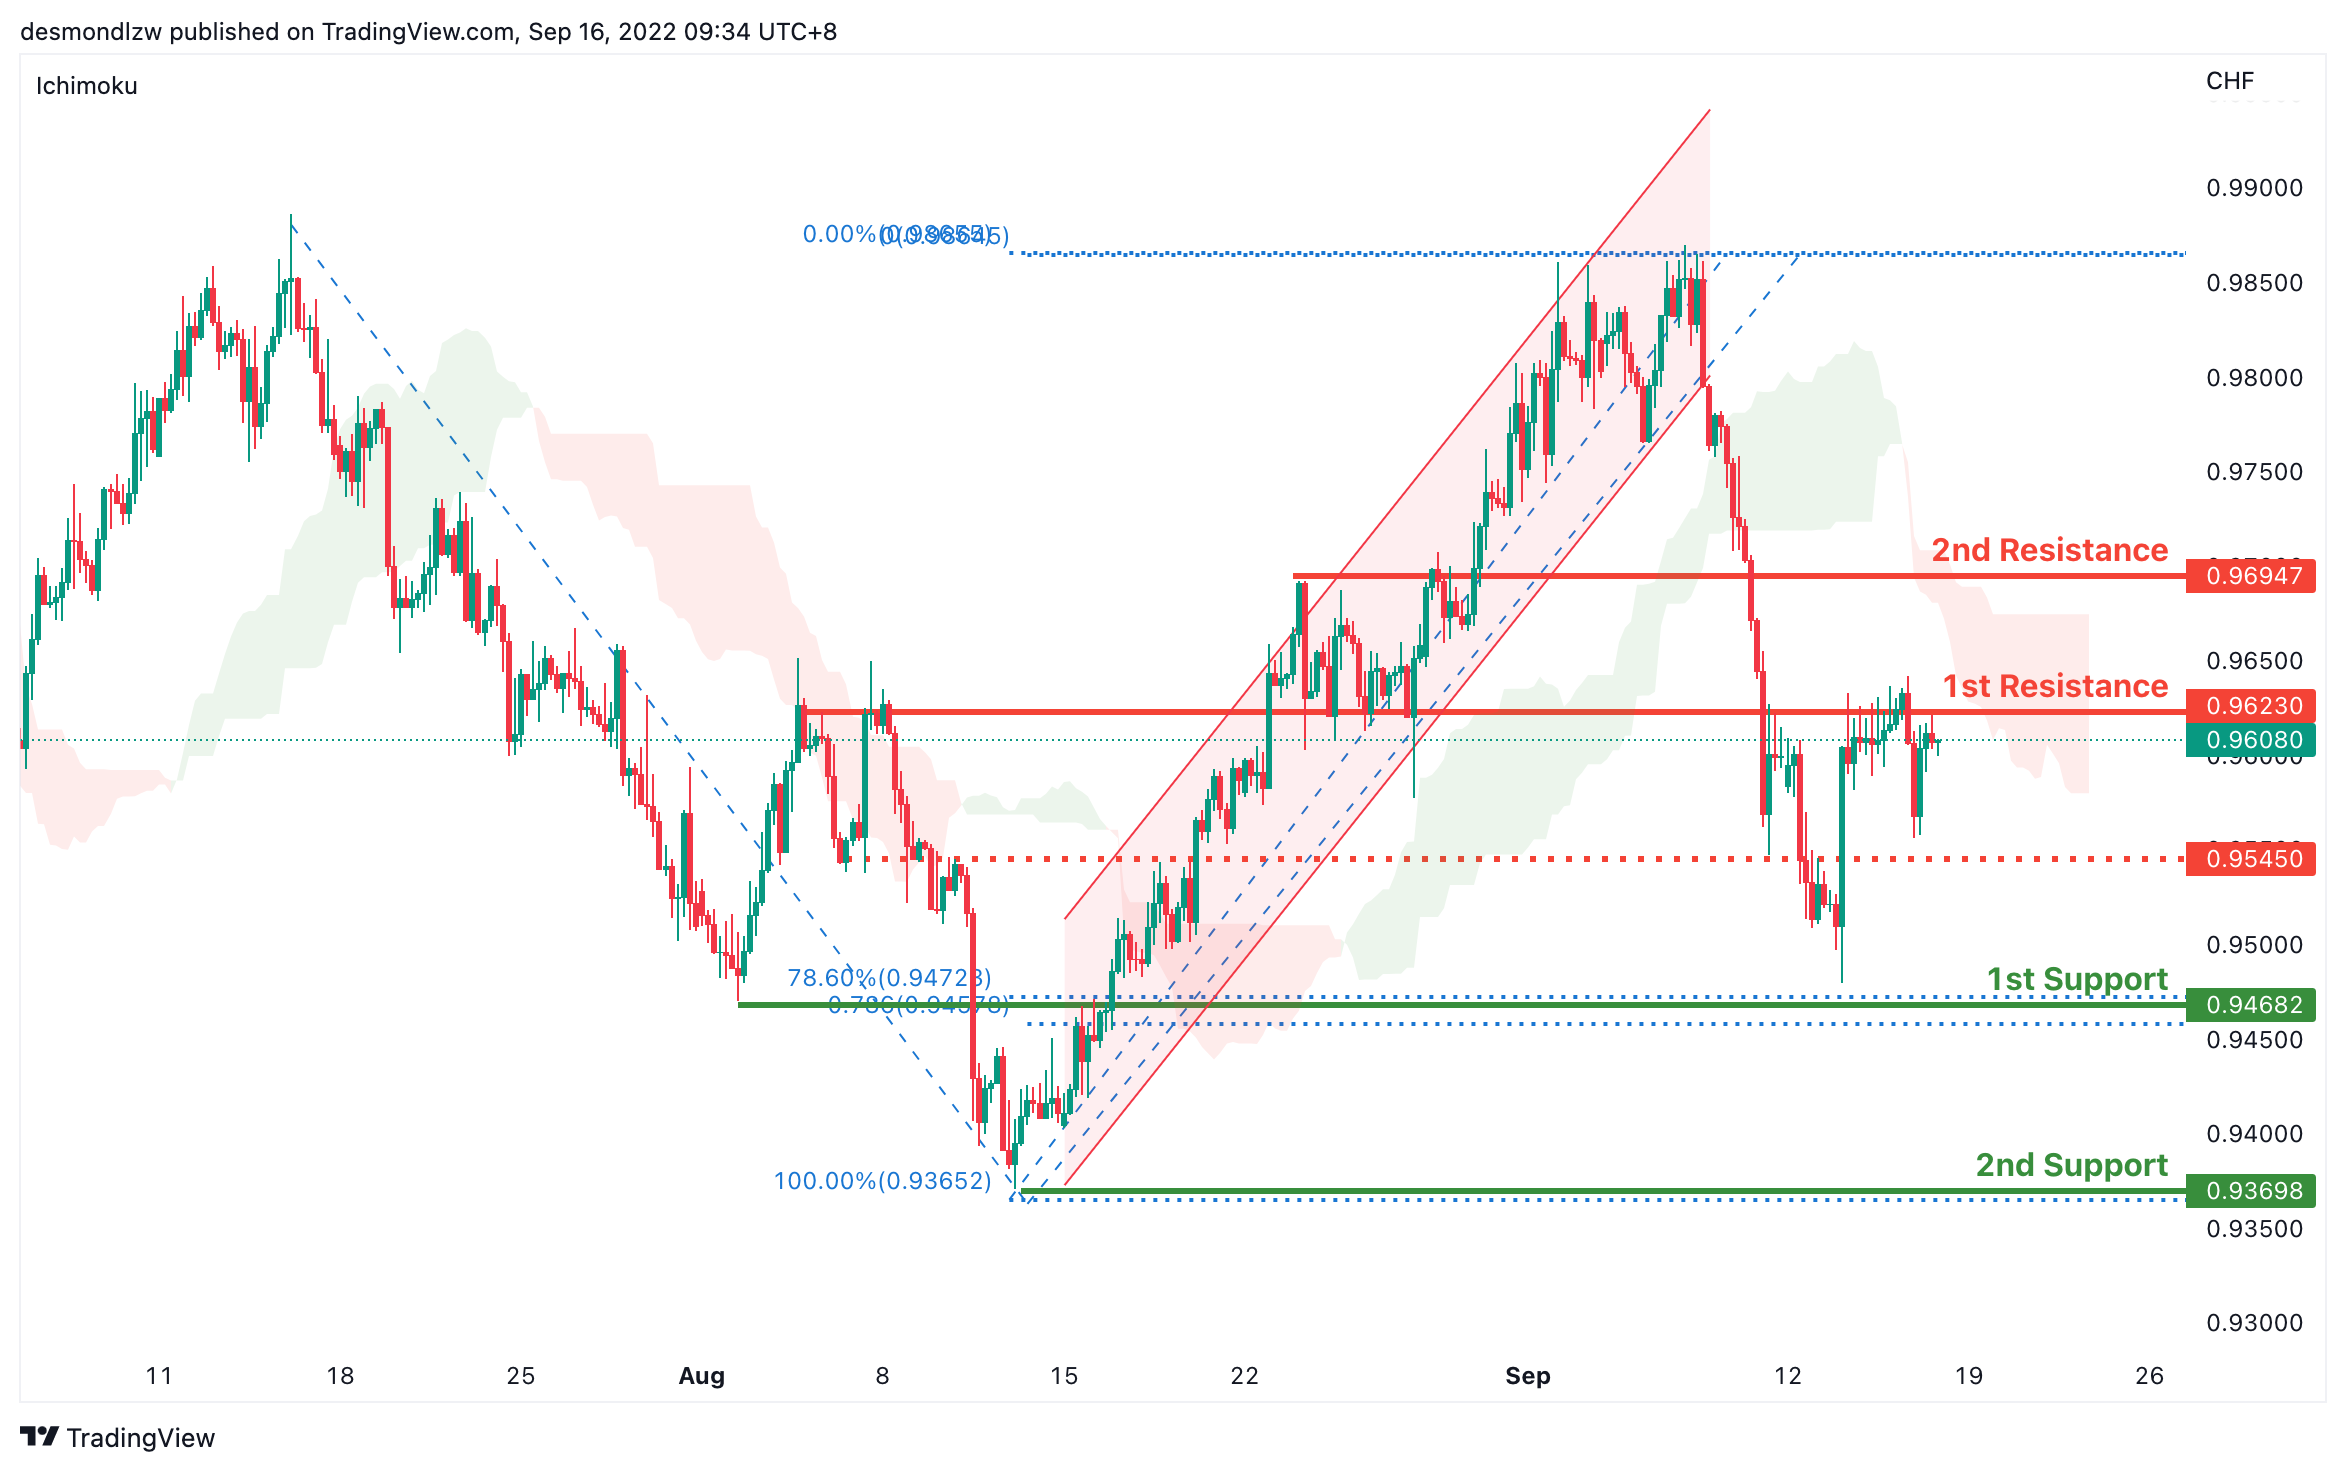
On the H4, prices have broken the ascending channel and we are currently bearish bias. Price is testing the first resistance at 0.9623 where the overlapping resistance and 50% retracement sit. If it breaks this level, it might test the second resistance at 0.9694 where the 38.2% retracement sits. Alternatively, price could pull back to test the first support at 0.9468 where the 78.6% retracement sit and then second support at 0.9369 where the previous swing low sits
Areas of consideration
- H4 1st support at 0.9468
- H4 1st resistance at 0.9623
XAU/USD (GOLD):
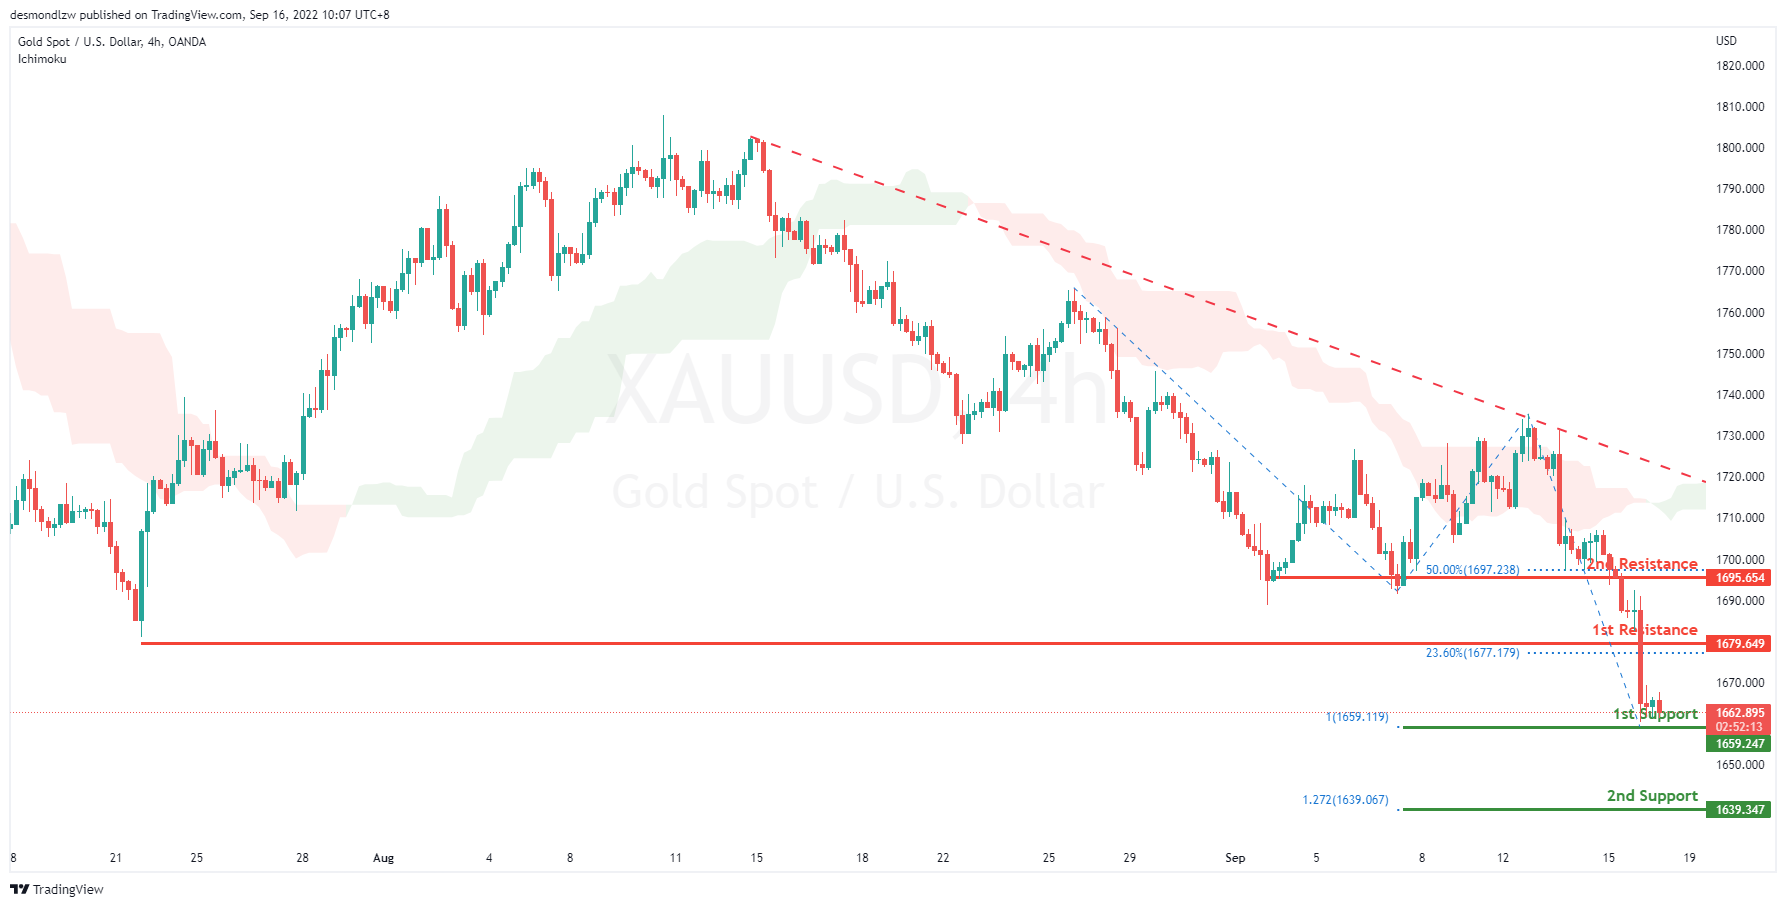
On the H4, with the price moving within the descending trendline and below ichimoku cloud, we have a bearish bias that the price may drop from the 1st support at 1662.740, which is in line with the 100% fibonacci projection to the 2nd support at 1639.347, where the 127.2% fibonacci projection is. Alternatively, the price may rise to the 1st resistance at 1679.649, which is in line with the 23.6% fibonacci retracement and pullback resistance. If the 1st resistance is broken, the 2nd resistance could be at 1695.654, which is in line with the 50% fibonacci retracement and overlap resistance.
Areas of consideration:
- H4 time frame, 1st support at 1662.740
- H4 time frame, 2nd support at 1639.347
AUD/USD:
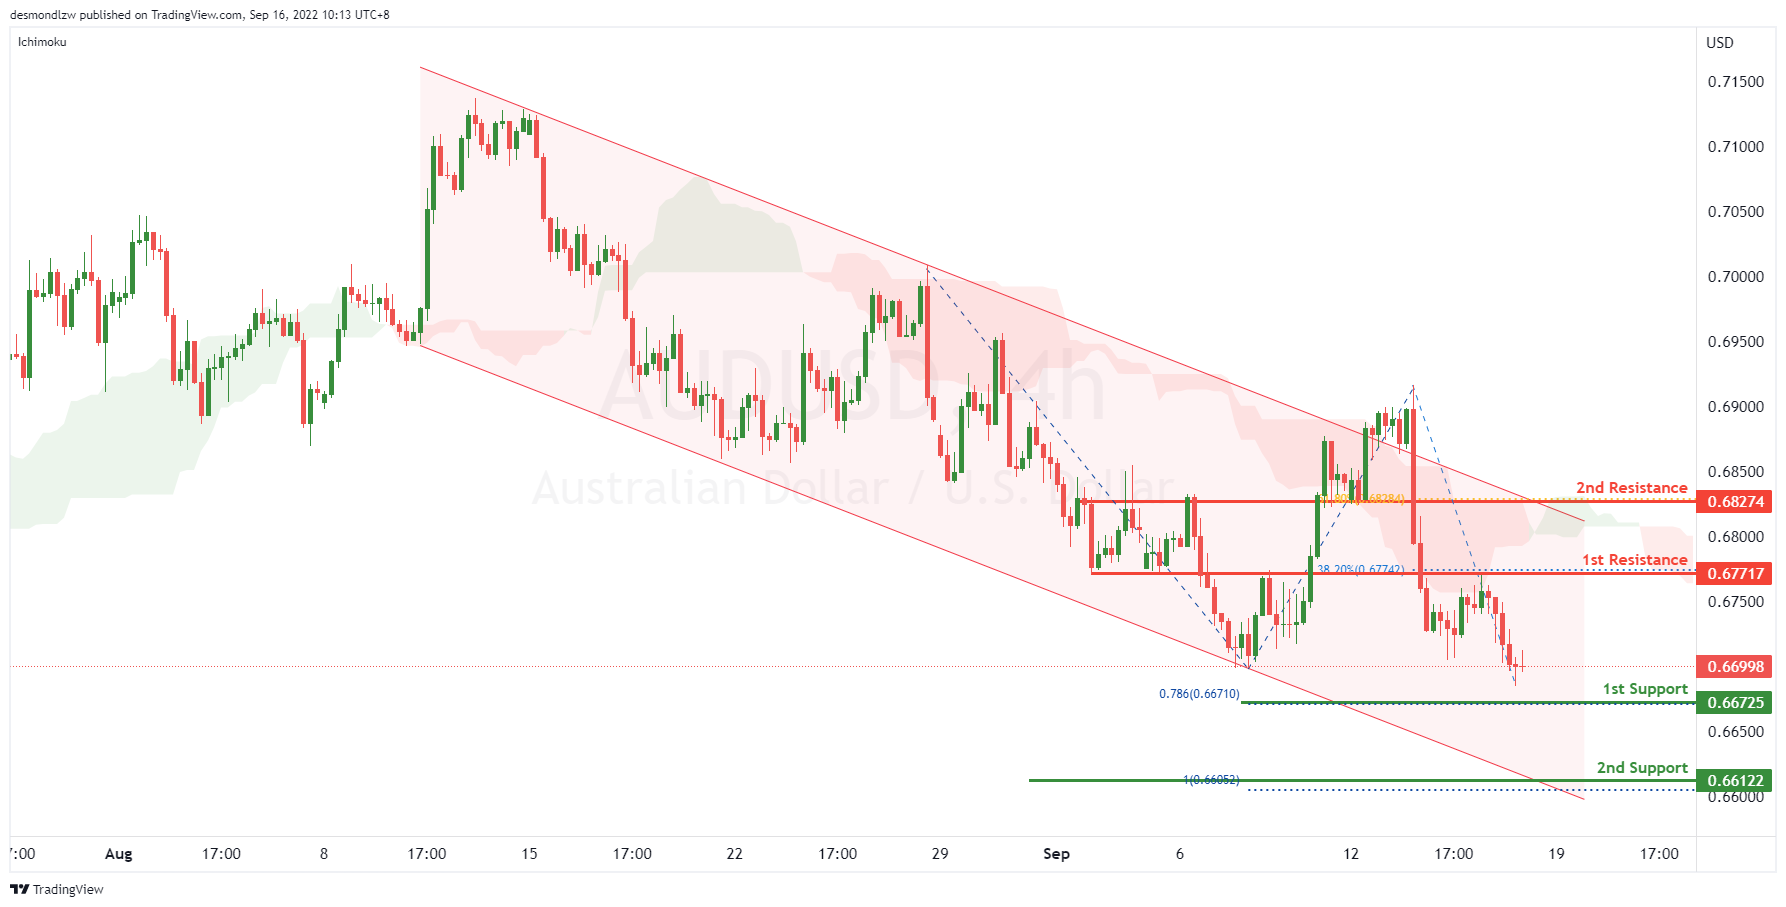
On the H4, with the price moving within the descending channel and below ichimoku cloud, we have a bearish bias that the price may drop to the 1st support at 0.66725, which is in line with the 78.6% fibonacci projection. If the 1st support level is broken, the 2nd support could be at 0.66122, where the 100% fibonacci projection is. Alternatively, the price may rise to the 1st resistance at 0.67717, which is in line with the 38.2% fibonacci retracement and overlap resistance. If the 1st resistance is broken, the next resistance level could be at 0.68274, where the overlap resistance and 61.8% fibonacci retracement are.
Areas of consideration
- H4 1st support at 0.66725
- H4 2nd support at 0.66122
NZD/USD:
On the H4, with the price moving within the descending channel and below ichimoku cloud, we have a bearish bias that the price may drop to the 1st support at 0.59099, where the 100% fibonacci projection and 161.8% fibonacci extension are. Alternatively, the price may rise to the 1st resistance at 0.60373, which is in line with the pullback resistance and 38.2% fibonacci retracement. If the 1st resistance is broken, the 2nd resistance could be at 0.60788, which is in line with the overlap support and 61.8% fibonacci retracement.
Areas of consideration:
- H4 time frame, current price
- H4 time frame, 1st support at 0.59099

USD/CAD:
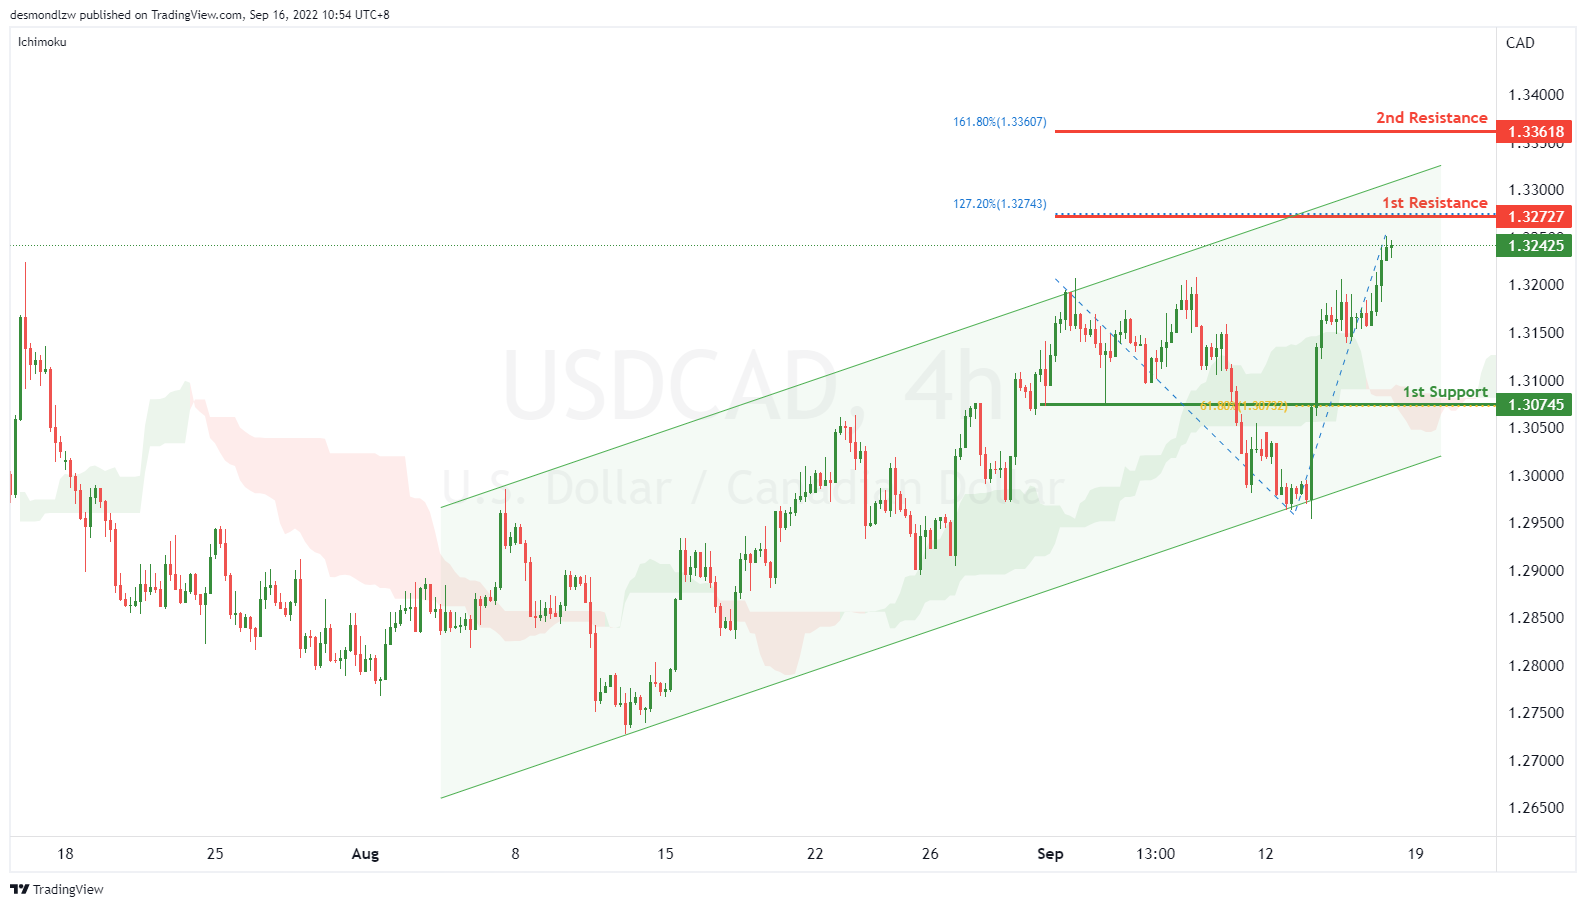
On the H4, with the price moving within the ascending channel and above ichimoku cloud, we have ab bullish bias that the price may rise from to the 1st resistance at 1.32727, which is in line with the 127.2% fibonacci extension to the 2nd resistance at 1.33618, where the 161.8% fibonacci extension is. Alternatively, the price may drop to the 1st support at 1.30745, which is in line with the 61.8% fibonacci retracement and overlap support.
Areas of consideration:
- H4 time frame, 1st resistance at 1.32727
- H4 time frame, 2nd resistance at 1.33618
OIL:
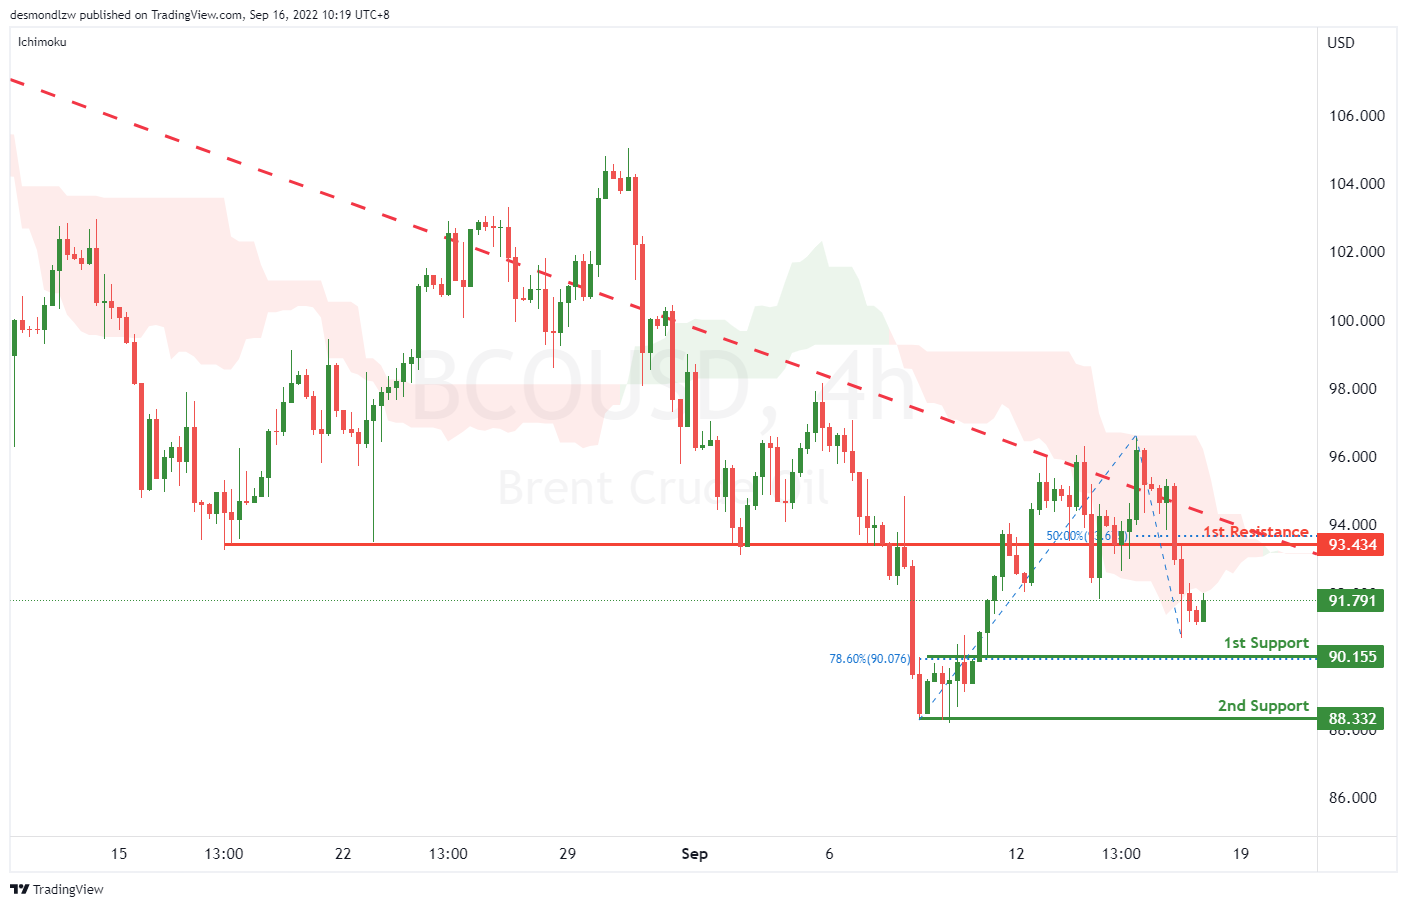
On the H4, with price below ichimoku and moving within the long term descending trendline, we have a bearish bias that the price may drop to the 1st support at 90.155, which is in line with the 78.6% fibonacci retracement. If the price broke the 1st support, the 2nd support could be at 88.332, which is in line with the swing low. Alternatively, the price may rise to the 1st resistance at 93.434, where the 50% fibonacci retracement and overlap resistance are.
Areas of consideration:
- H4 time frame, 1st resistance at 96.160
- H4 time frame, 1st support at 92.239
Dow Jones Industrial Average:
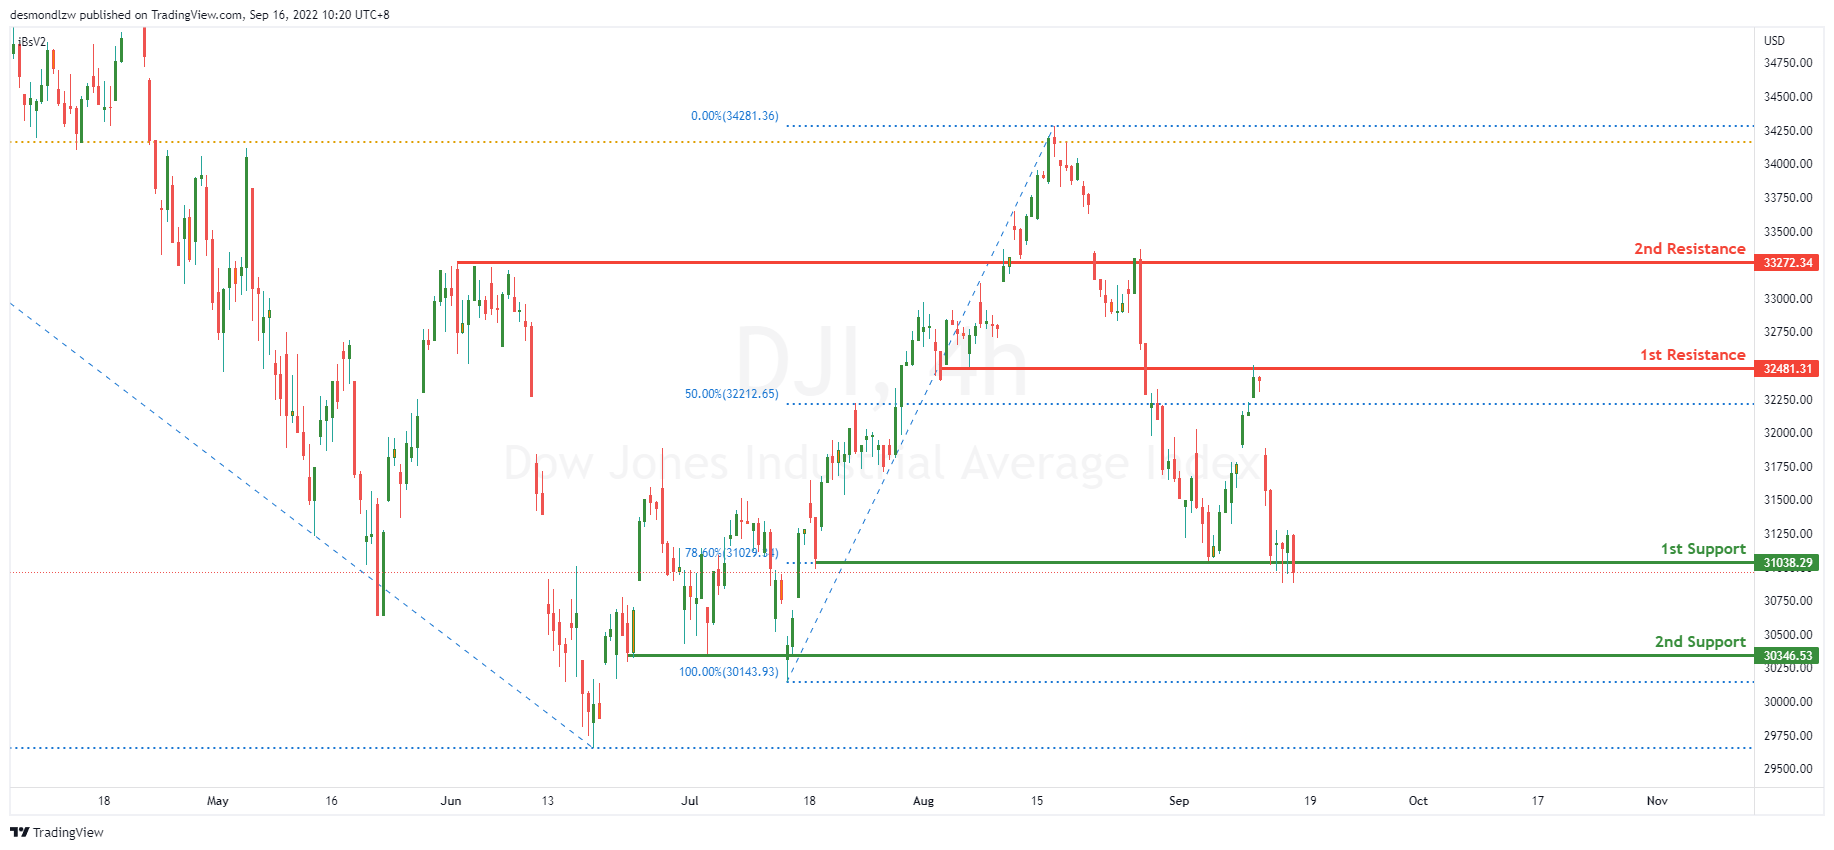
On the H4, price is reflected off nicely at the first resistance at 32500.85 where the 50% Fibonacci retracement is and broke right through the first support at 31029.34 where the 78.6% Fibonacci retracement is. Price might continue heading downwards towards the second support at 30343.73 where the previous swing low is.
Areas of consideration:
- H4 time frame, 1st support at 31029.34
- H4 time frame, 2nd support at 30343.73
DAX:
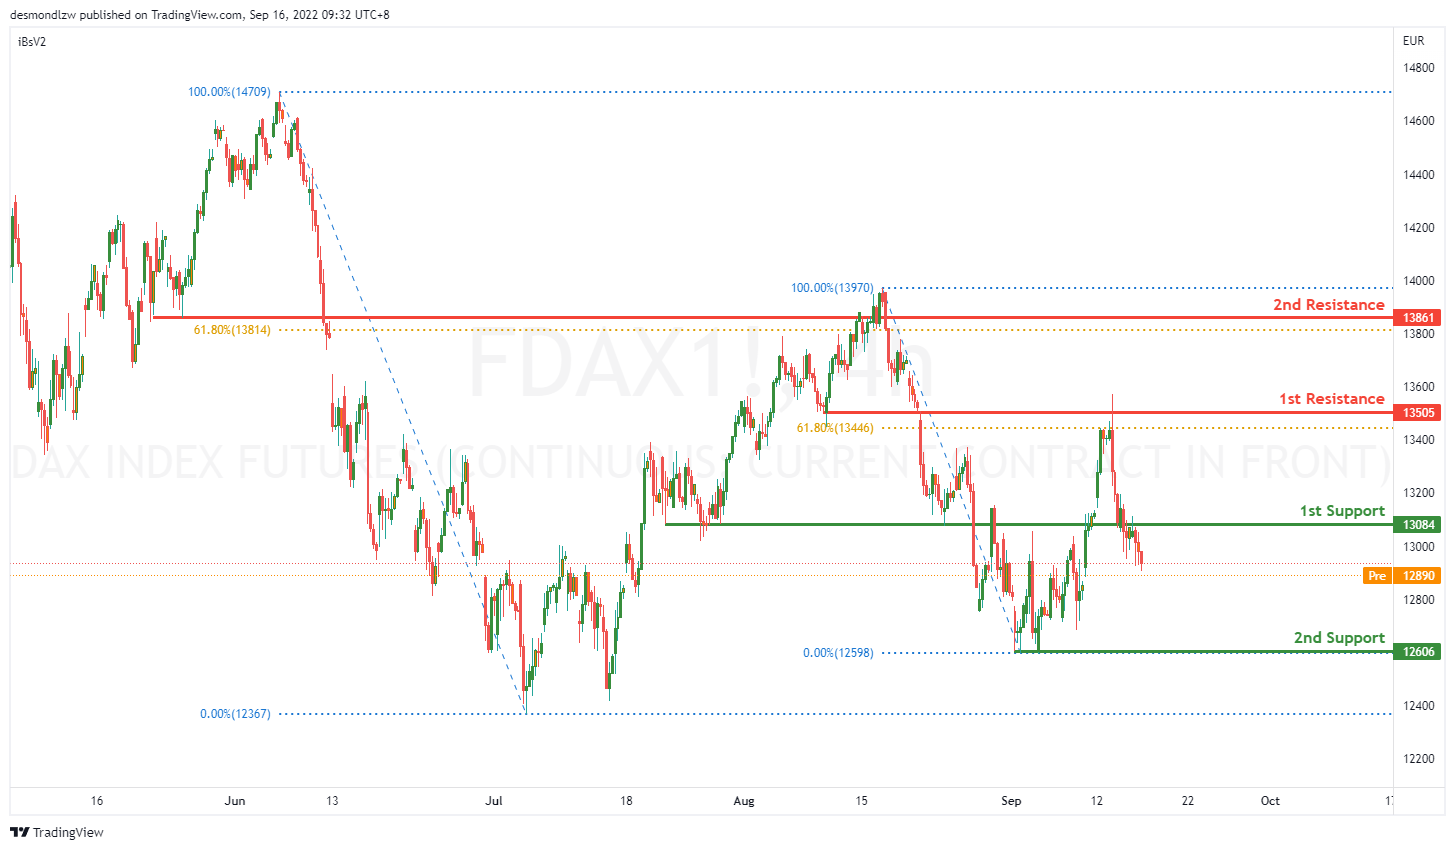
On the H4, price has reflected of the first resistance at 13505 where the 61.8% retracement is and got a big reaction breaking through the first support at 13084. Price might continue going down towards the second support at 12606 where the swing low is.
Areas of consideration:
- H4 time frame, 1st support at 13084
- H4 time frame, 2nd support at 12606
ETHUSD:
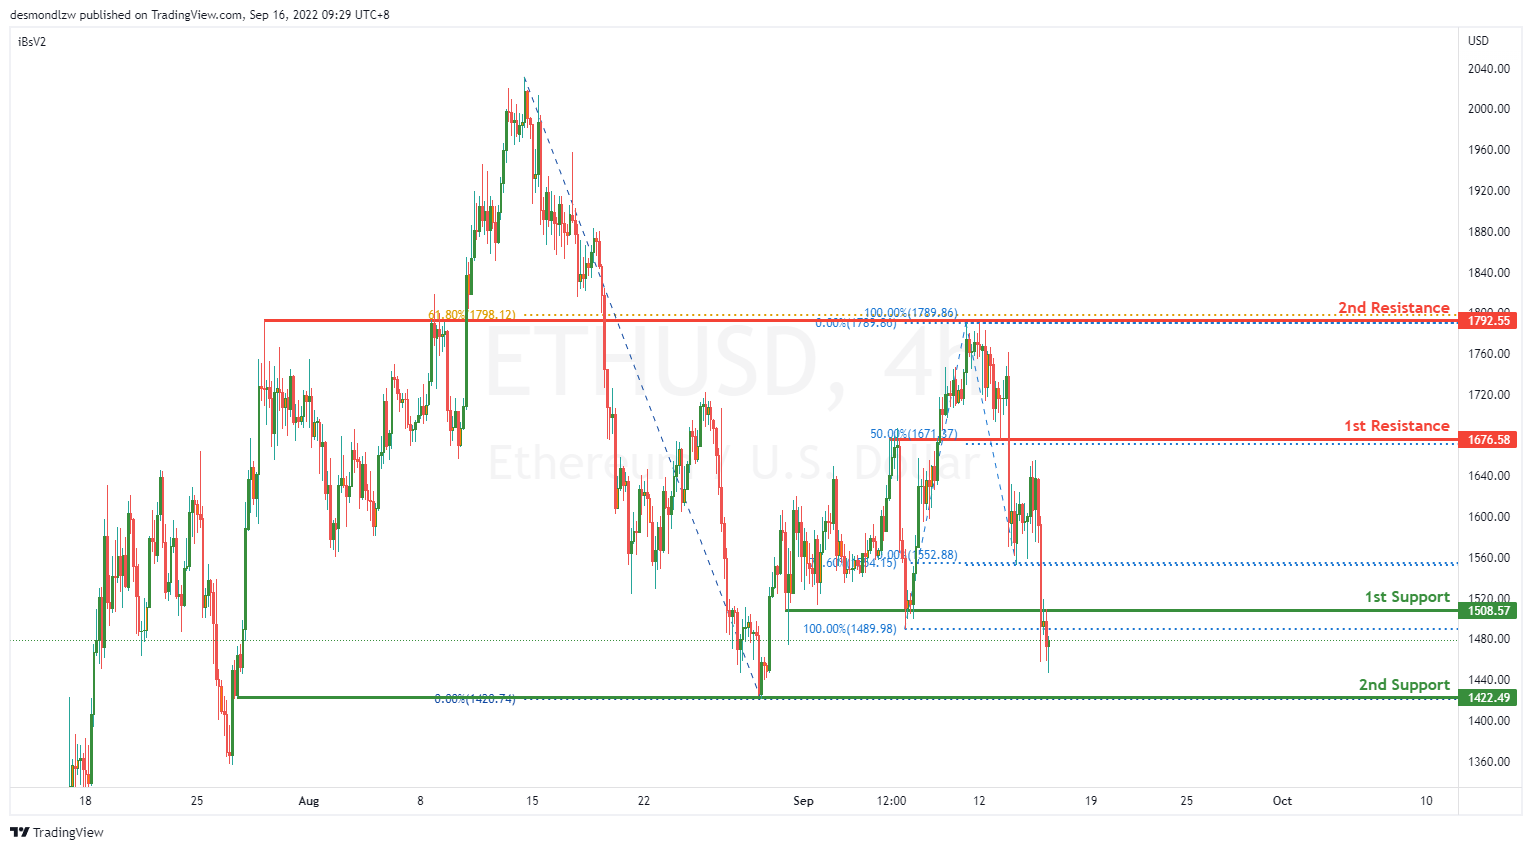
On the H4, price has reflected off the second resistance at 1789.8 where the 61.8% Fibonacci level is and pulled back hence we are currently bearish bias. Price has pushed through the first support at 1508.57 where the previous swing low is at. If bearish momentum continues it should bring price to the second support at 1420.74 where the previous swing low sits.
Areas of consideration:
- H4 time frame, 1st resistance of 1676.58
- H4 time frame, 1st support at 1508.57
BTCUSD:
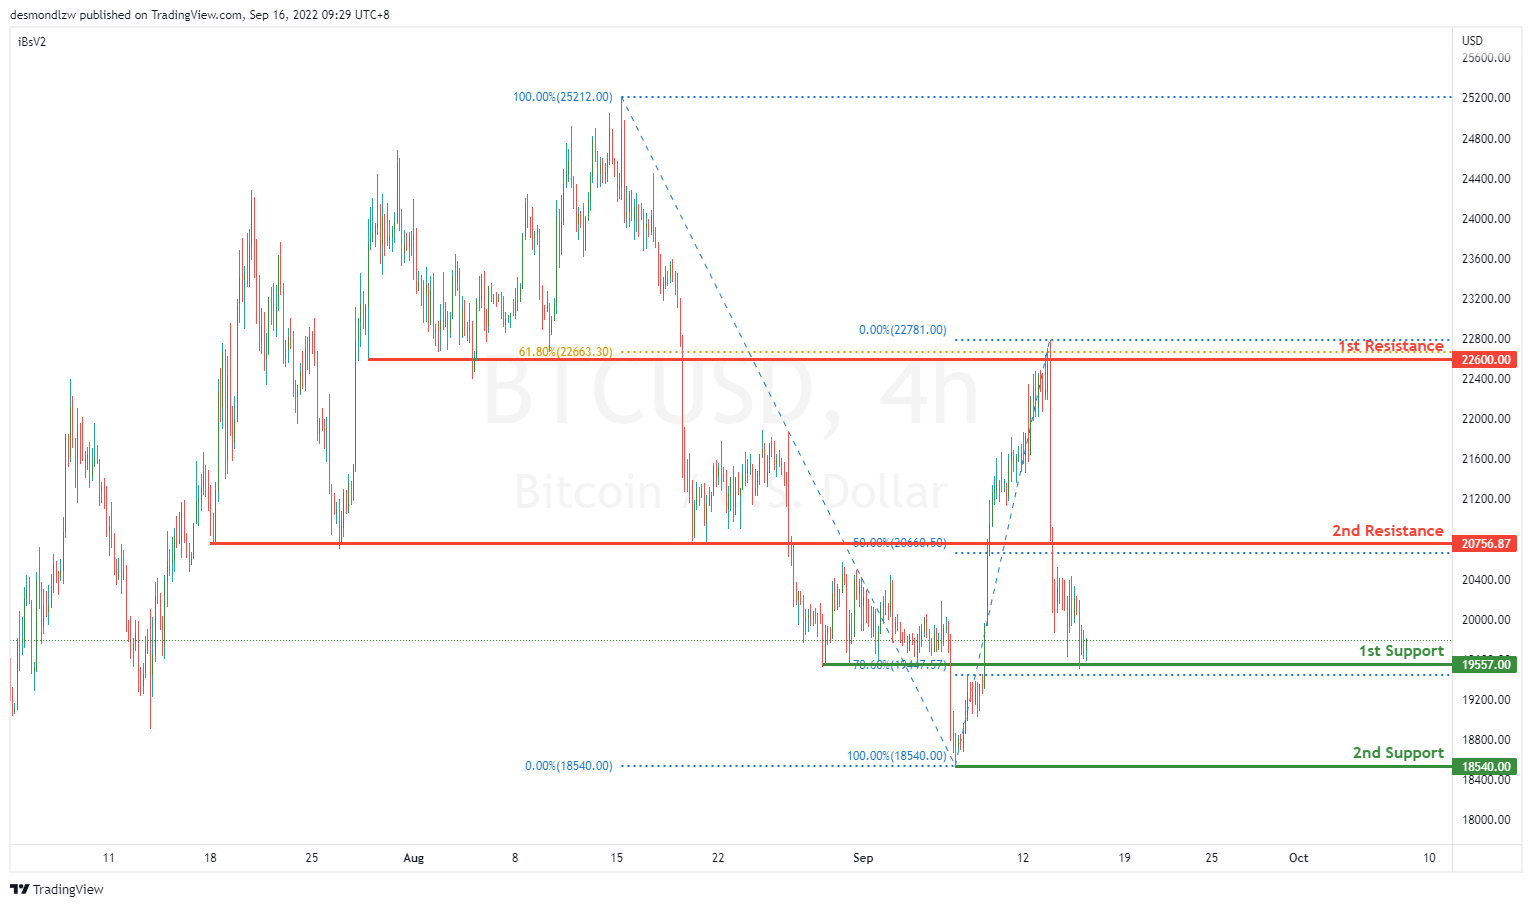
On the H4, price reflected off the first resistance at 22600.00, broke past the second resistance at 20756.87 and is moving in a bearish momentum hence we are bearish. Price has moved and tapped the first support at 19557.00 where the 78.6% retracement sits. If bearish momentum continues, it should bring price to the second support 18540.00 where the previous swing low sits. Alternatively, price could pull back to test the second resistance at 20756.87 where the 50% retracement is.
Areas of consideration:
- H4 time frame, 1st resistance of 22600.00
- H4 time frame, 1st support at 19557.00
S&P 500:
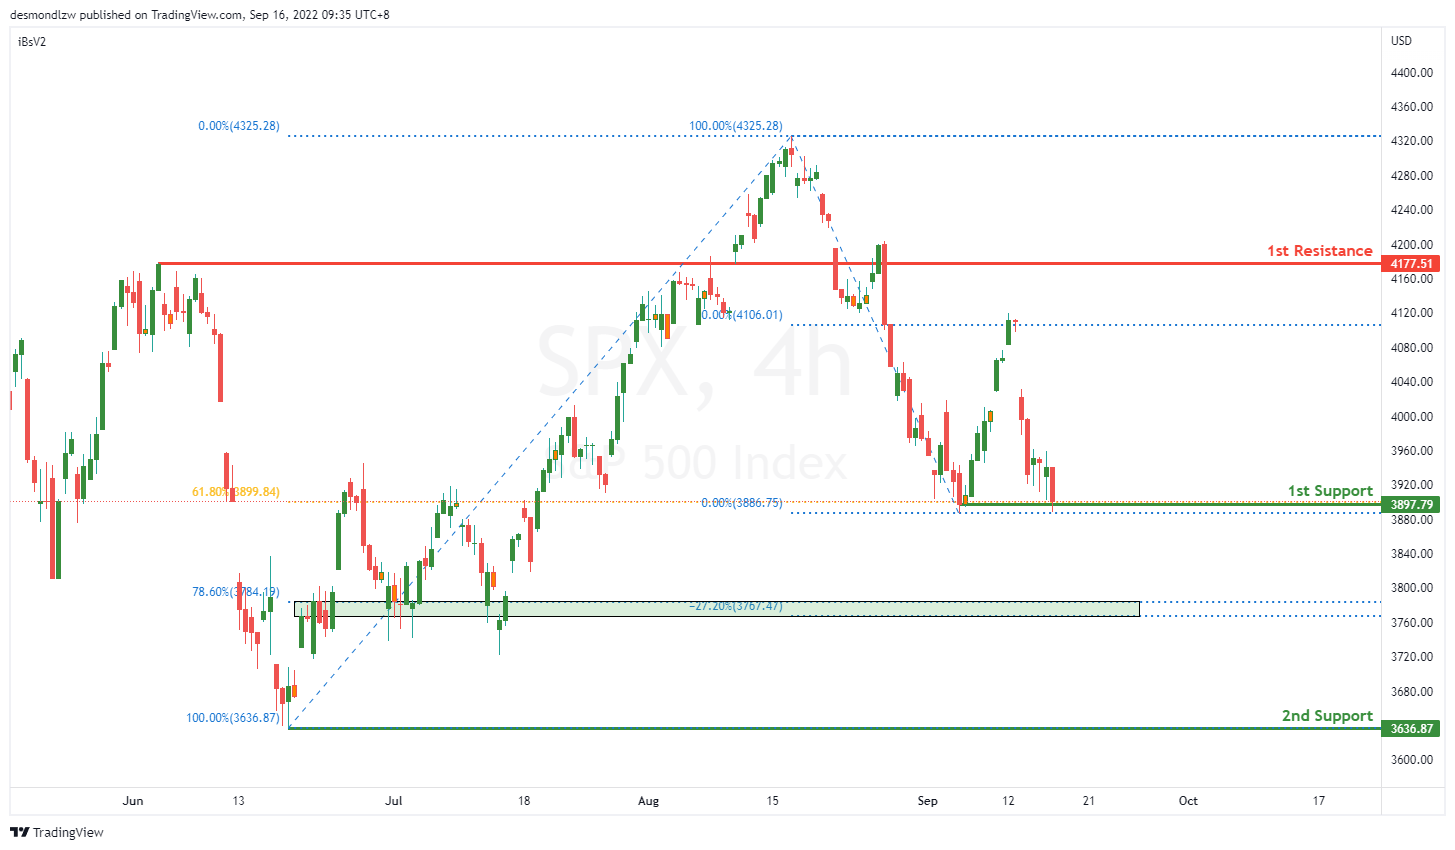
On the H4, the price reversed from the 4100 price area forming a bearish channel, with the price falling towards the 1st support are of 3900. With our bearish bias still valid, as price trades back towards the 61.8% Fibonacci retracement, look for price to test the 1st support area. If the price breaks below the 1st support level, the price could fall towards the 78.6% Fibonacci retracement level of 3784.19. There could be some pullback up towards the 1st Support level area else it could head towards the 2nd support of 3636.87. As the price falls towards the 2nd support, it could find some pullback towards the 78.6% Fibonacci retracement pullback support area.
Areas of consideration:
- H4 time frame, 1st support at 3900
- H4 time frame, 2nd support at 3636.87
USD/JPY Could Correct Gains, Gold Takes A Hit
Key Highlights
- USD/JPY seems to be forming a double top near 145.00.
- It is testing a major bullish trend line at 142.85 on the 4-hours chart.
- Gold price declined heavily below the $1,680 support zone.
- GBP/USD is at a risk of more losses below the 1.1420 level.
USD/JPY Technical Analysis
The US Dollar made another attempt to clear the 145.00 resistance zone against the Japanese Yen. However, USD/JPY struggled to continue higher and corrected lower.
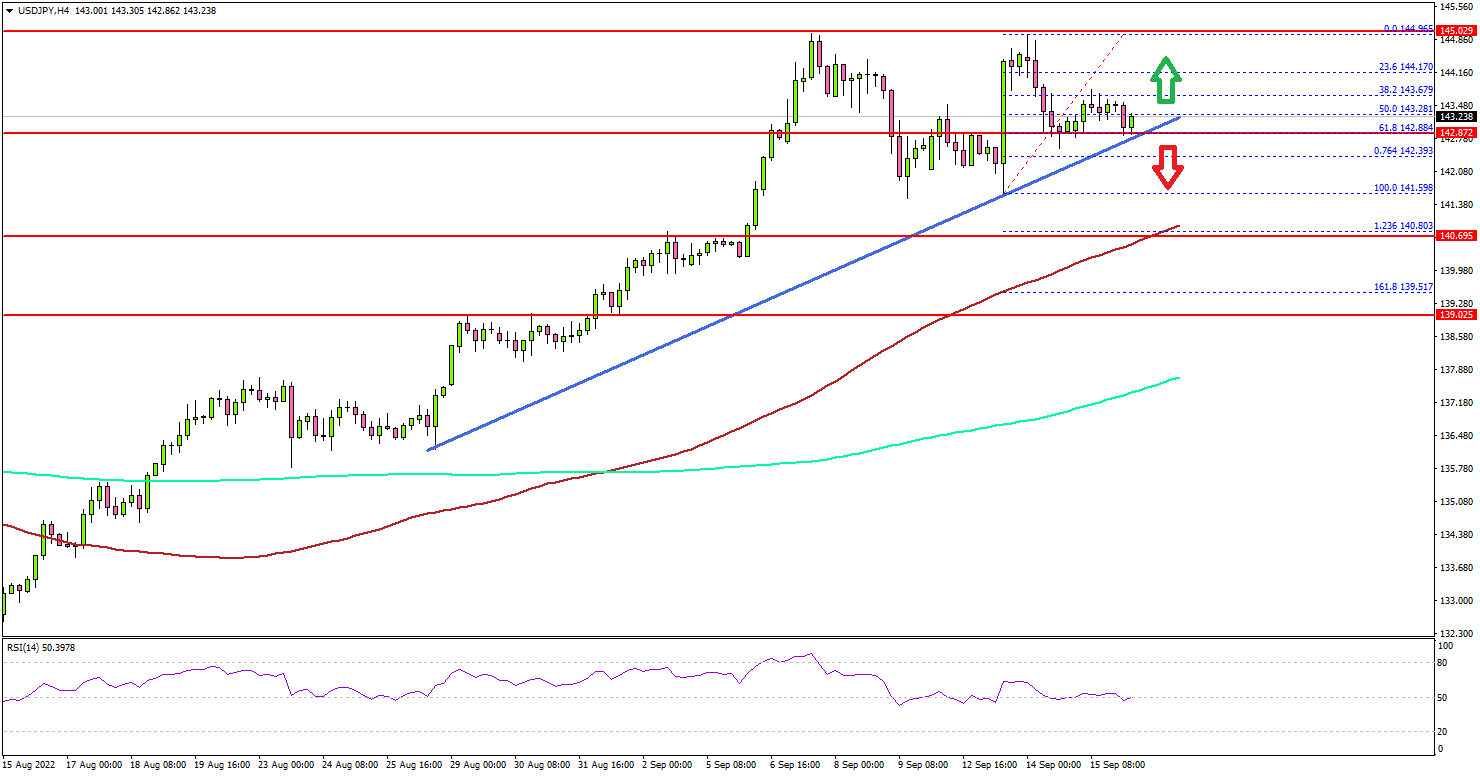
Looking at the 4-hours chart, the pair seems to be forming a double top near 145.00. The pair is slowly moving lower and there was a break below the 50% Fib retracement level of the upward move from the 141.59 swing low to 144.96 high.
It is now testing a major bullish trend line at 142.85 on the same chart. The trend line is near the 61.8% Fib retracement level of the upward move from the 141.59 swing low to 144.96 high.
A downside break below the trend line support might spark a sharp decline towards the 141.50 support. The next major support is near the 140.50 level, below which the pair could even test the 140.00 level and the 100 simple moving average (red, 4-hours).
On the upside, the pair might face resistance near the 143.80 level. The next major resistance is near the 144.20 level. The main resistance is still near the 145.00 level.
A clear move above the 145.00 resistance might start a strong increase. The next major resistance is near 146.50, above which the pair may perhaps rise towards the 148.00 level.
Looking at gold price, the bulls failed to protect the $1,680 support and there was a sharp decline towards the $1,660 support zone.
Economic Releases
- UK Retail Sales for August 2022 (YoY) - Forecast +1.7%, versus +4% previous.
- UK Retail Sales for August 2022 (MoM) - Forecast -0.8%, versus +2.3% previous.
- Michigan Consumer Sentiment Index for Sep 2022 (Prelim) – Forecast 63.0, versus 65.5 previous.