Sample Category Title
Japanese Yen – Calm Before the Storm?
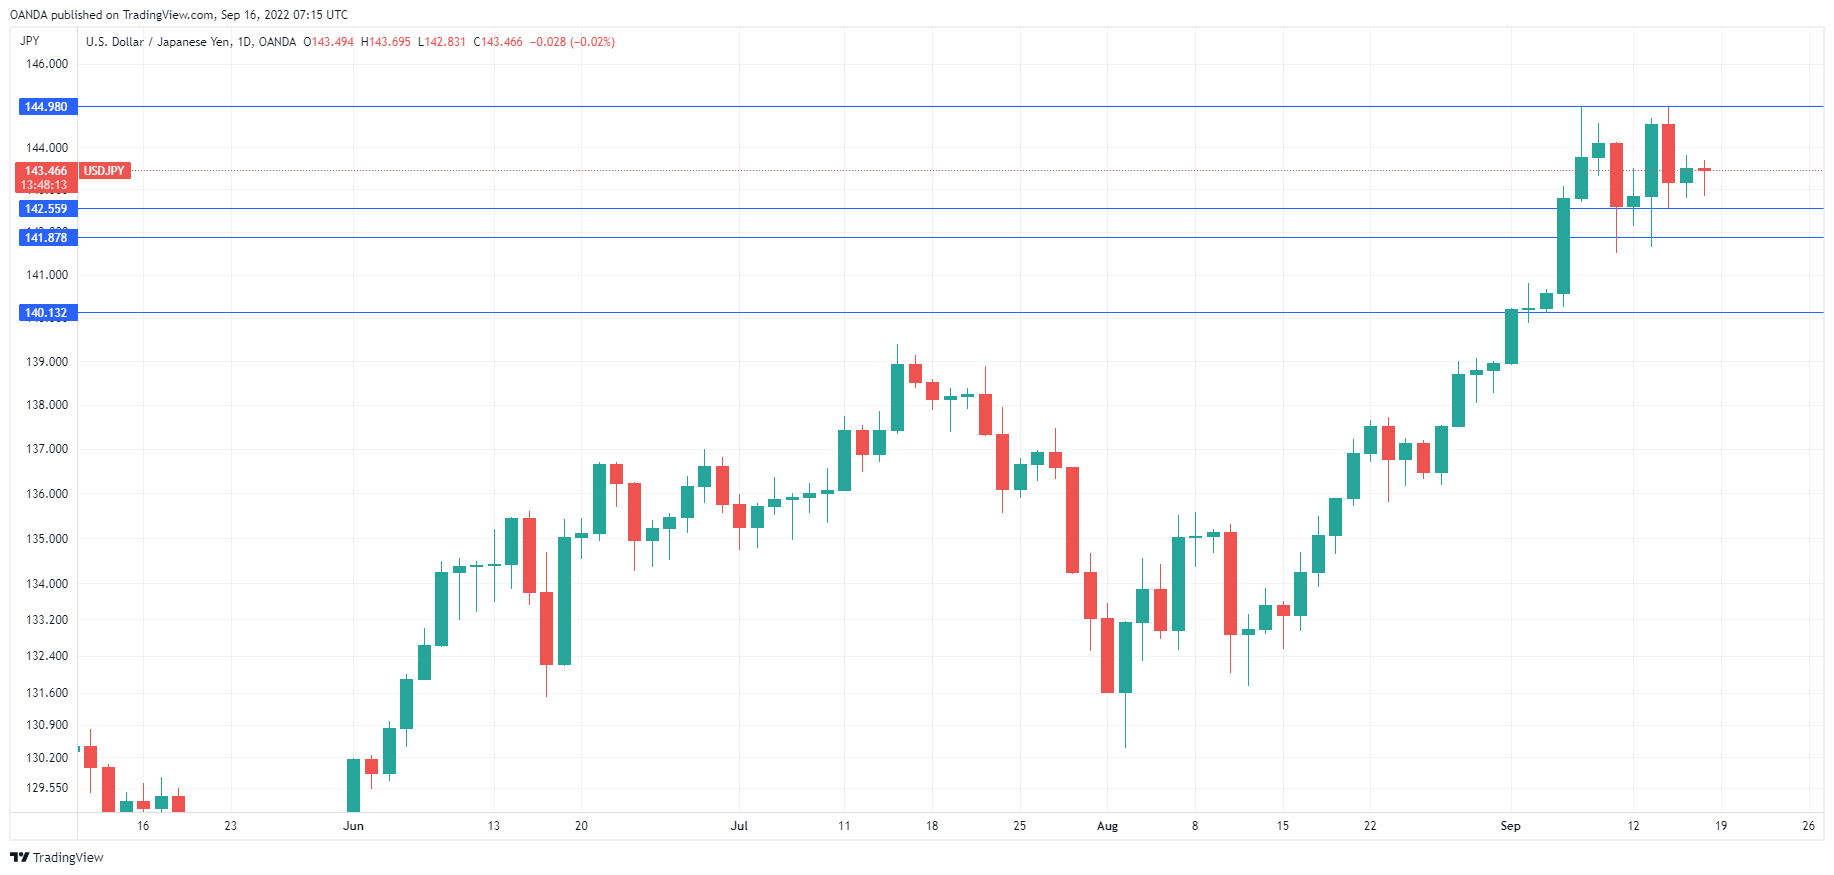
After some mid-week volatility, USD/JPY has settled down. In the European session, the yen is trading quietly at 143.59.
Markets eye BoJ meeting
For anyone following the Japanese yen, next week promises to be interesting, at the very least. The Federal Reserve will hold its policy meeting on September 21st, with the Bank of Japan officials meeting the next day. The Japanese yen continues to lose ground against the dollar, and fell to 144.99 earlier this month, a new 24-year low. Japanese officials have responded with well-worn rhetoric about how Tokyo is concerned about the yen’s depreciation and warning that all options are on the table. We’ve heard this all before, but is this time different? Is Japan seriously contemplating a currency intervention to prop up the ailing yen? There has been some speculation that 145 could be a line in the sand for the MOF, but in fairness, there was similar talk when yen hit 130 and then 135, and the MOF and BoJ stayed on the sidelines.
The likelihood is that Tokyo will avoid such a dramatic move, which last occurred in 2011. The Ministry of Finance (MOF) and the Bank of Japan are not happy with the rapid descent of the yen, but an intervention would require the consent of the G-20, which is unlikely to give its consent. The BoJ made waves this week after a report that it had conducted a rate check, which was viewed as a possible prelude to an intervention. Finance Minister Suzuki has been coy about what moves he might make, and refused to comment on whether the BoJ had made a rate check.
The BoJ has rigidly maintained its ultra-loose monetary policy in order to stimulate Japan’s fragile economy. As part of this policy, the BoJ has kept a firm hand on its yield curve control, and the price for this stance has been a freefall in the yen, which is done an astounding 30% against the dollar this year. With the Fed looking to hike next week by 75 basis point, and an outside chance of a massive full-point increase, the yen’s downtrend is likely to continue, barring a spectacular response from Japanese officials.
USD/JPY Technical
- 1.4363 is the next line of resistance, followed by 144.81
- USD/JPY has support at 142.56, followed by 141.88
GBP/USD: Primary Triple Zigzag Likely to Complete Near 1.077
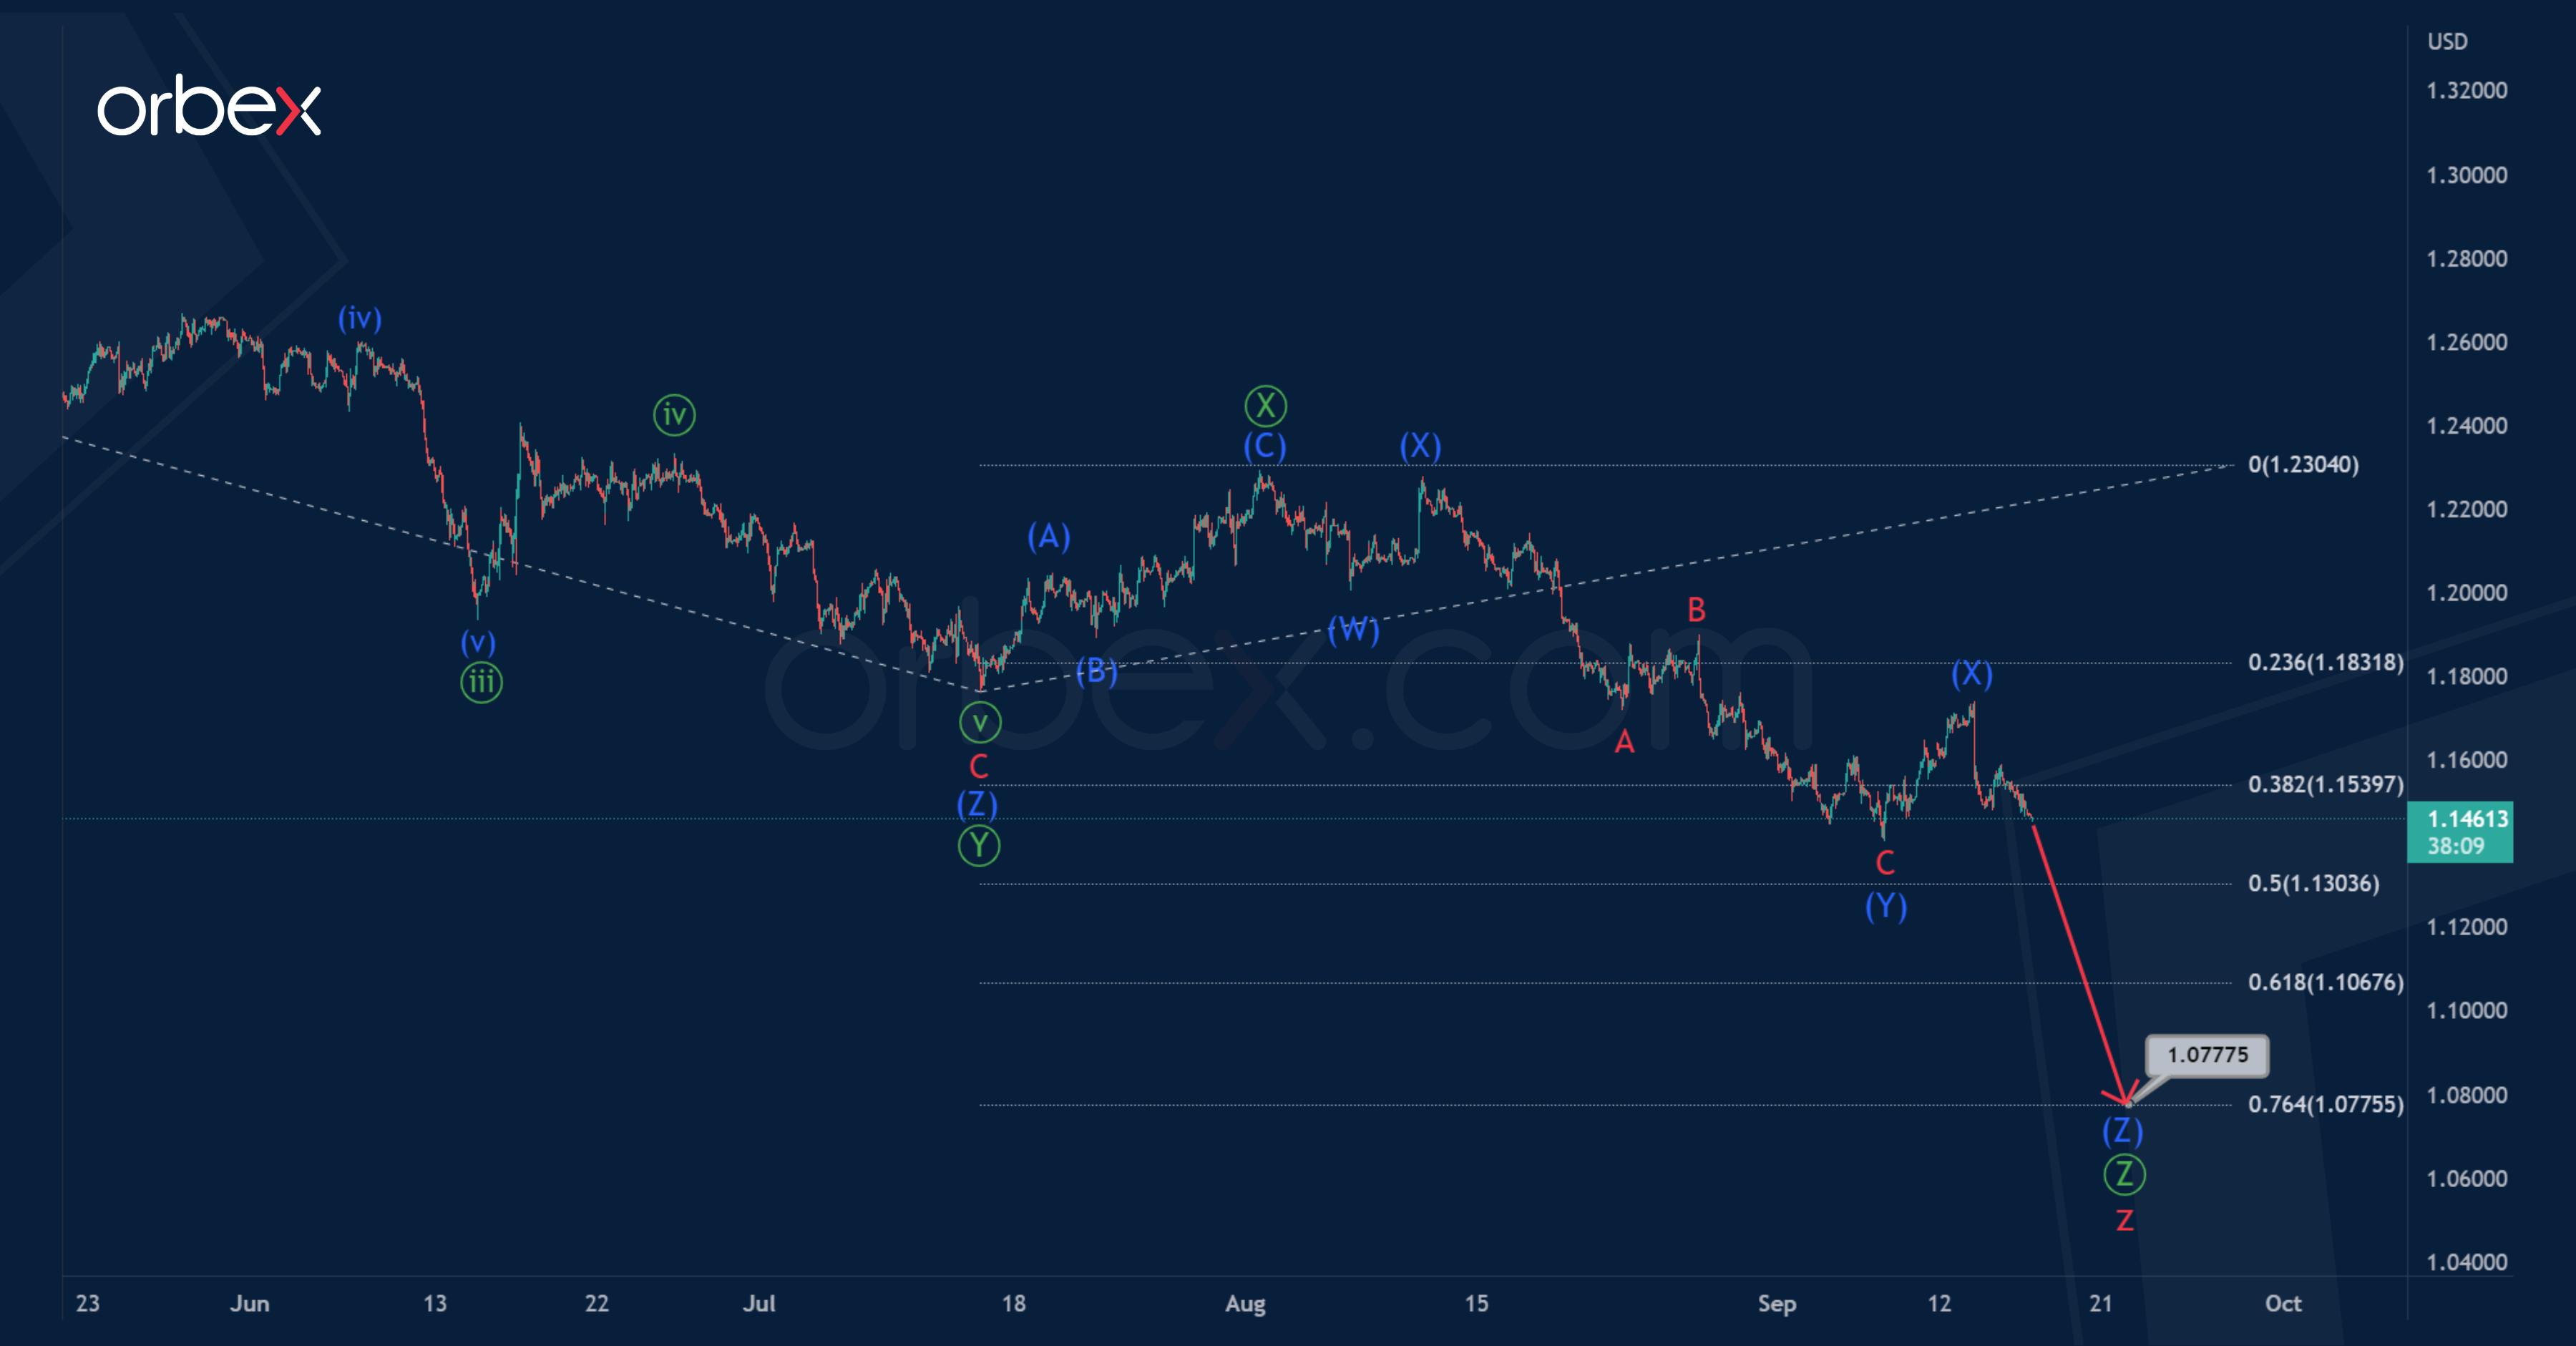
The internal structure of the GBPUSD currency pair suggests the formation of a global corrective trend – a triple zigzag w-x-y-x-z. On the 1H timeframe, we see the final actionary wave z of the cycle degree.
The wave z most likely takes the form of a primary triple zigzag Ⓦ-Ⓧ-Ⓨ-Ⓧ-Ⓩ. At the beginning of August, the bullish price movement within the primary intervening wave Ⓧ apparently ended, it took the form of an intermediate zigzag (A)-(B)-(C).
It is likely that in the near future the bearish trend will continue to develop in the primary wave Ⓩ, which may complete its intermediate triple zigzag pattern (W)-(X)-(Y)-(X)-(Z) near 1.077.
At that level, wave Ⓩ will be at the 76.4% Fibonacci extension of previous actionary wave Ⓨ.
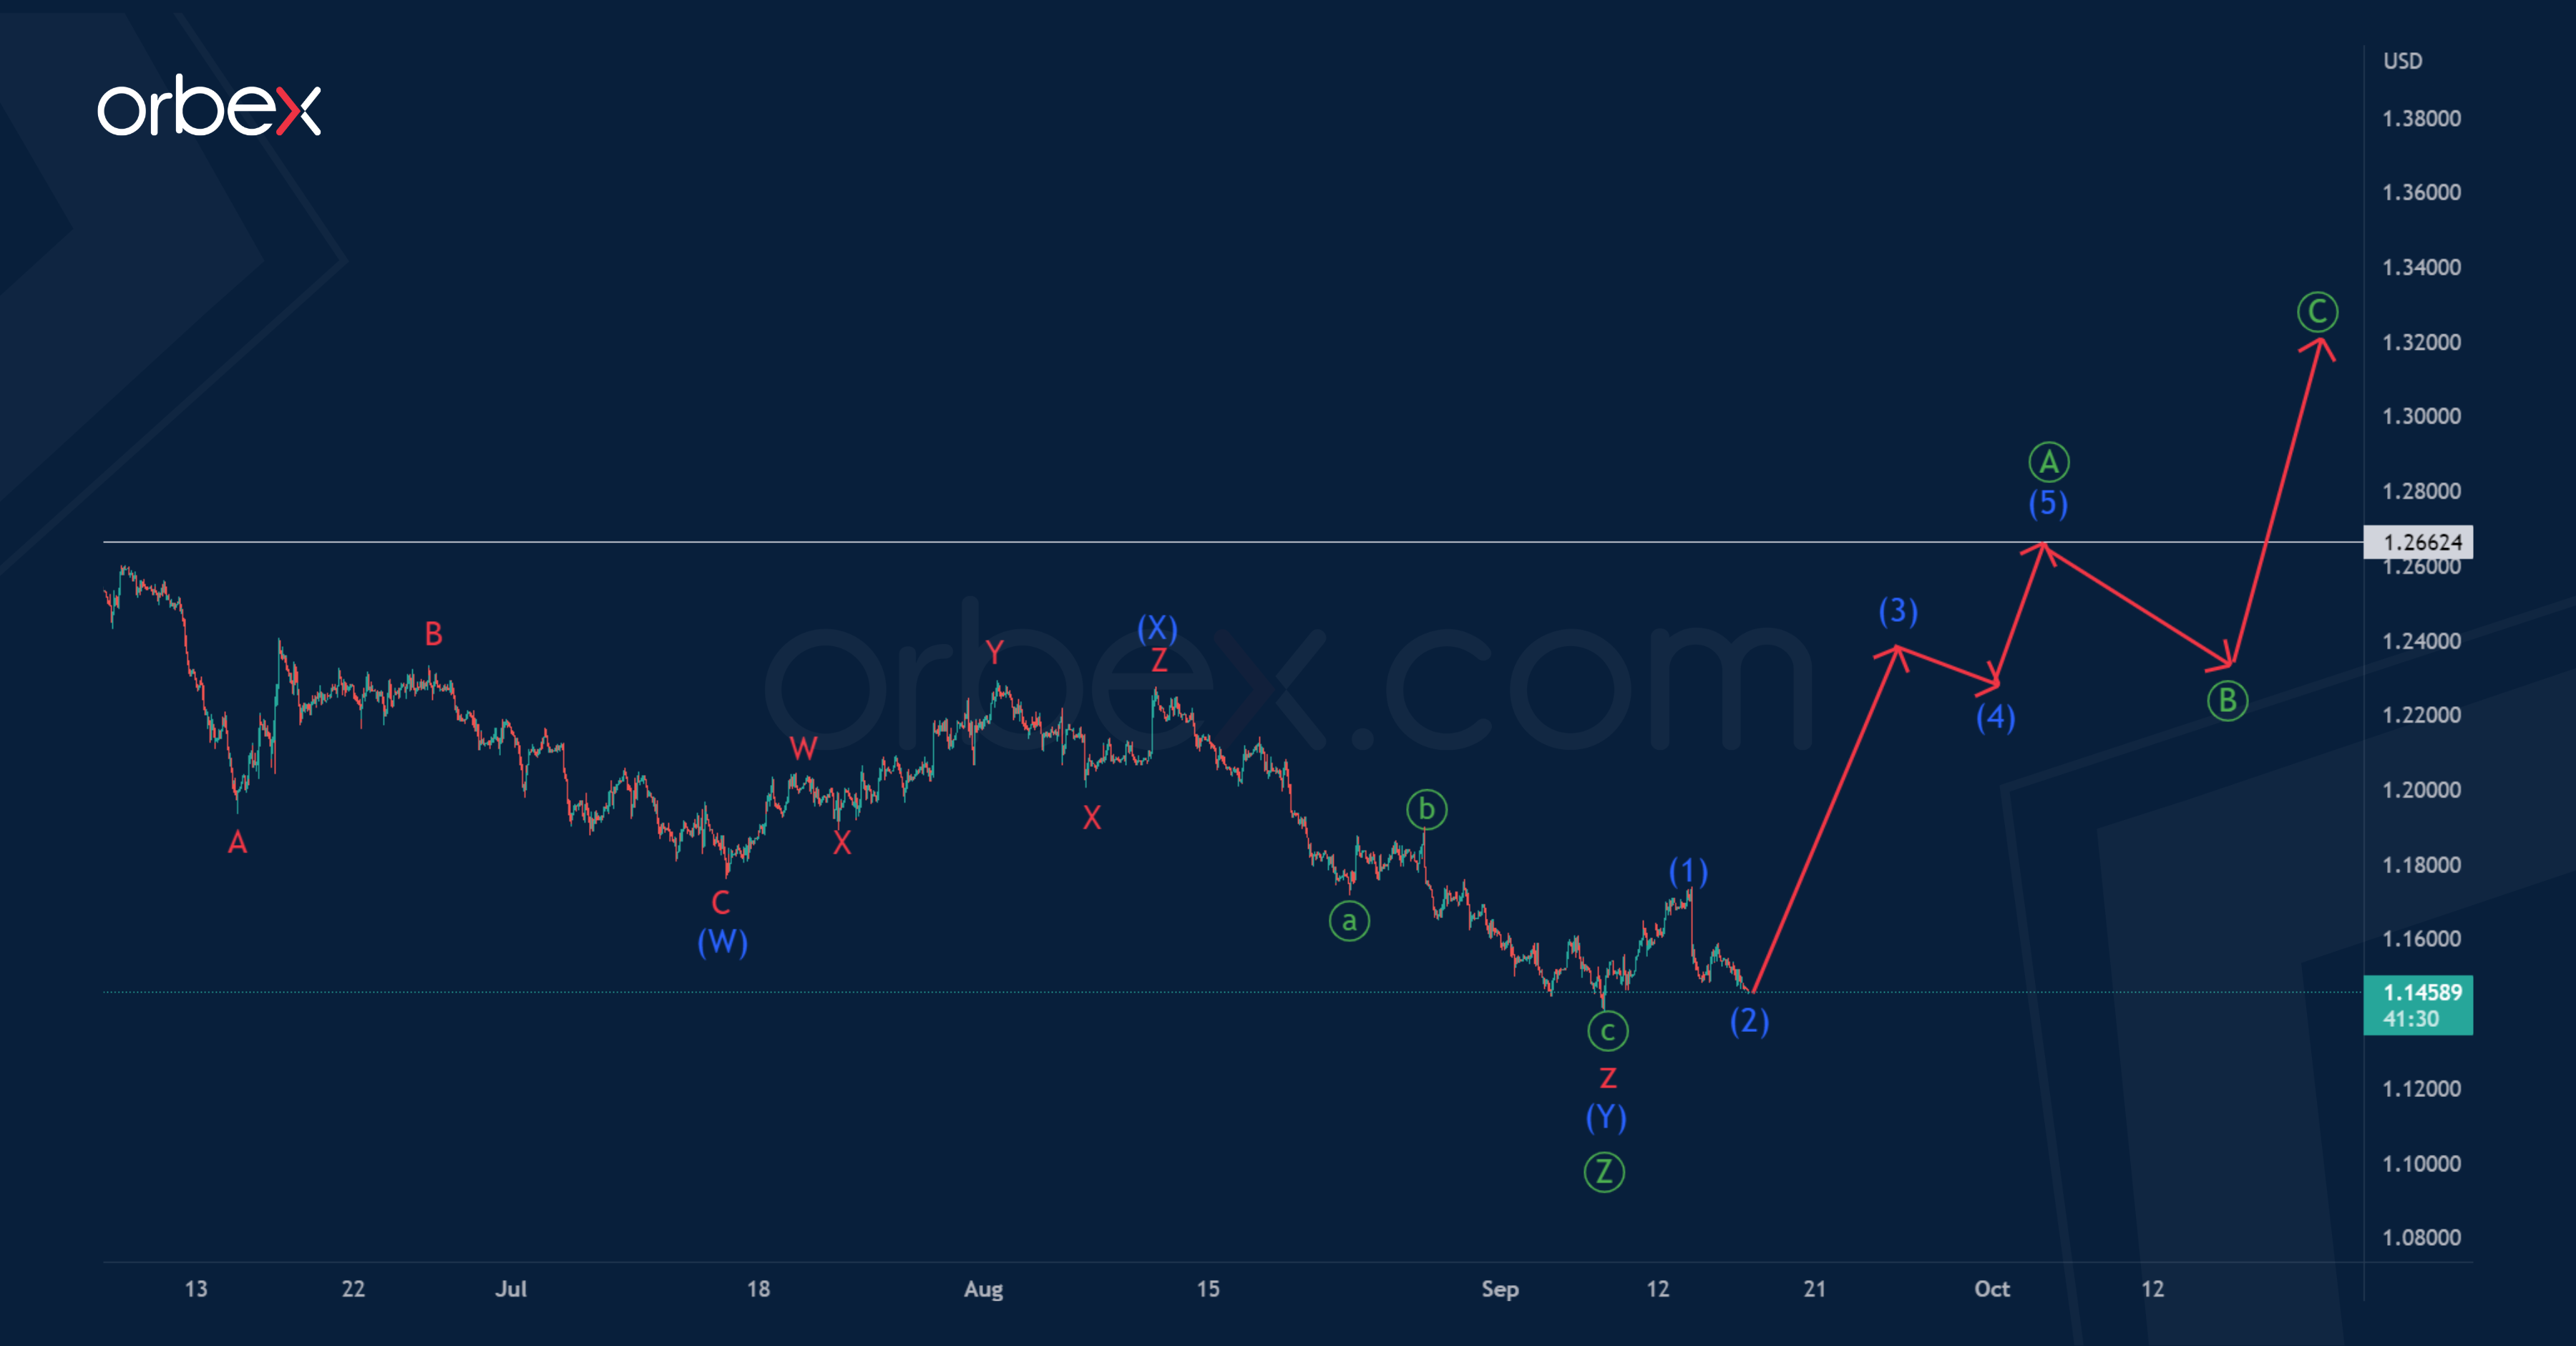
However, the cycle wave z could be fully completed. As in the main version, it has the form of a primary triple zigzag.
Thus, to confirm the second scenario, it is necessary that the bulls are strong enough to start moving the price within the new trend.
Perhaps in the next coming trading weeks, market participants will observe the construction of the first impulse wave of a potential zigzag of the primary degree.
The price may rise to the previous high of 1.266, and then even higher.
GBP/JPY Daily Outlook
Daily Pivots: (S1) 164.09; (P) 164.92; (R1) 165.35; More...
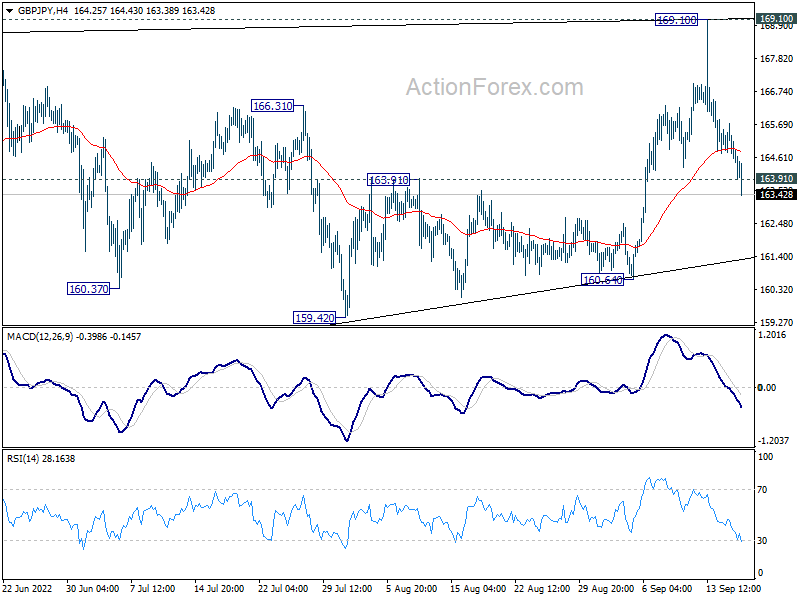
GBP/JPY's break of 163.91 support suggests that corrective pattern from 168.40 is extending with another falling leg. Intraday bias is back on the downside for 159.42 support. But downside should be contained there to bring rebound. Firm break of 169.91 will resume larger up trend. However, break of 159.42 support will now be a sign of bearish reversal and target 155.57 support next.
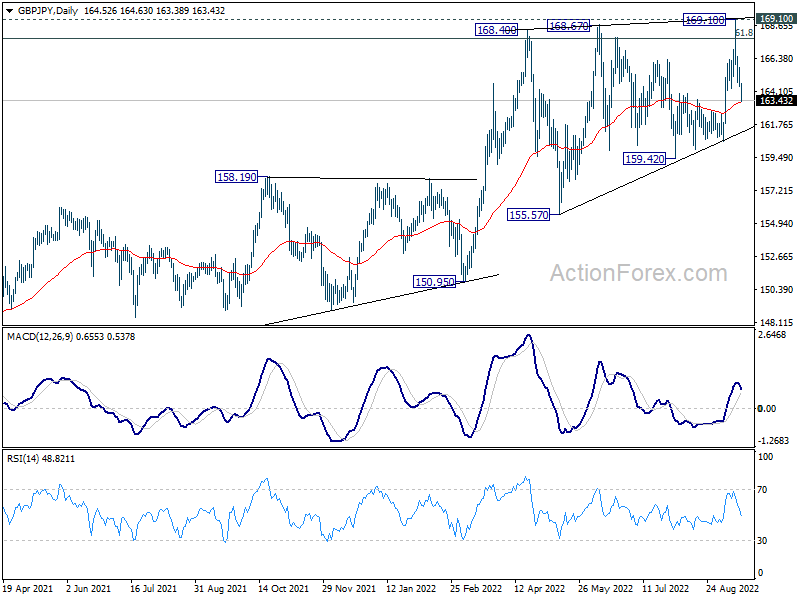
In the bigger picture, up trend from 123.94 (2020 low) is still in progress. Sustained break of 61.8% retracement of 195.86 (2015 high) to 122.75 (2016 low) at 167.93 will be a long term bullish signal, and could pave the way back to 195.86 high. This will remain the favored case as long as 155.57 support holds, even in case of deep pull back.
EUR/JPY Daily Outlook
Daily Pivots: (S1) 142.78; (P) 143.23; (R1)143.89; More....
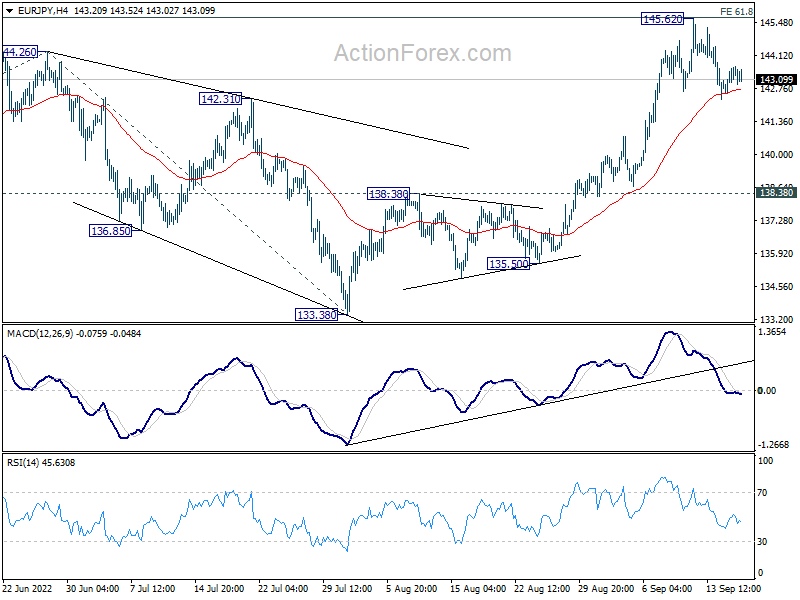
Intraday bias in EUR/JPY is staying neutral as consolidation from 145.62 is extending. Deeper pull back cannot be ruled out. But downside should be contained above 138.38 resistance turned support bring another rally. On the upside, decisive break of 61.8% projection of 124.37 to 144.26 from 133.38 at 145.67 will pave the way to 149.76 long term resistance, and then 100% projection at 153.27.
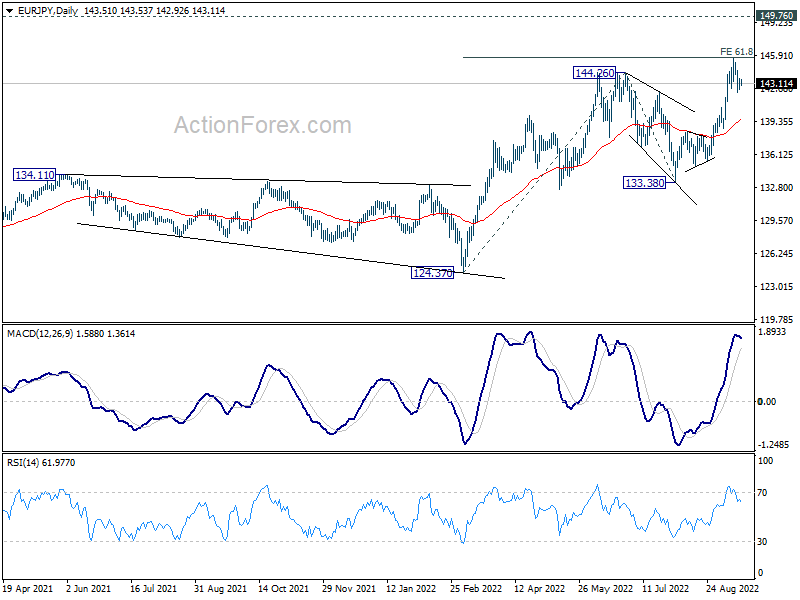
In the bigger picture, up trend from 114.42 (2020 low) is seen as the third leg of the pattern from 109.30 (2016 low). Next target is 149.76 (2015 high). For now, outlook will remain bullish as long as 133.38 support holds, even in case of deep pull back.
EUR/GBP Daily Outlook
Daily Pivots: (S1) 0.8667; (P) 0.8694; (R1) 0.8745; More...
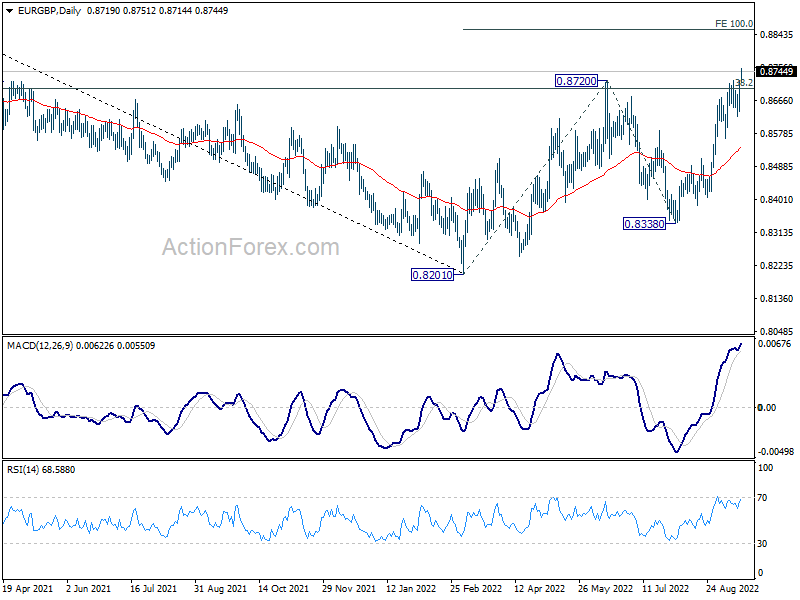
EUR/GBP surges to as high as 0.8751 so far. The firm break of 0.8720 resistance should confirm resumption of whole rise from 0.8201. Intraday bias will be back on the upside for 100% projection of 0.8201 to 0.8720 from 0.8338 at 0.8857. On the downside, break of 0.8624 support is needed to indicate short term topping. Otherwise, outlook will stay bullish in case of retreat.
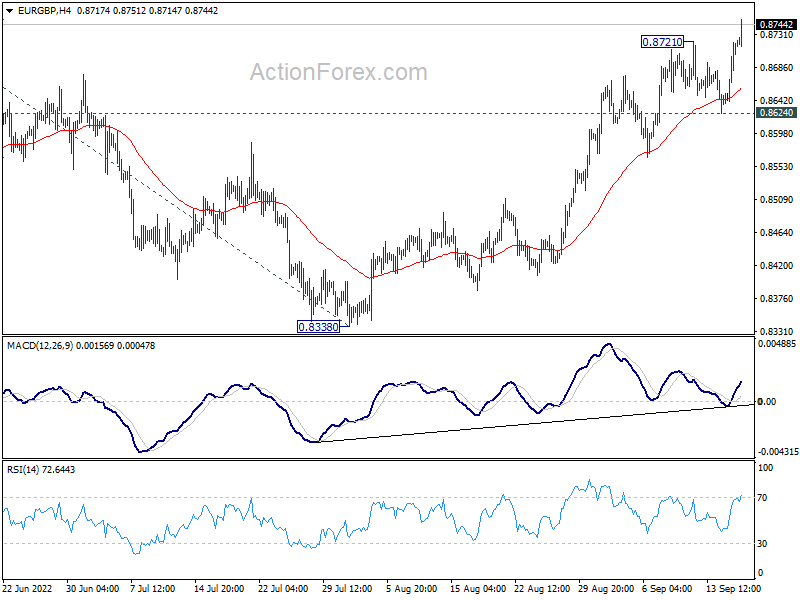
In the bigger picture, sustained trading above 38.2% retracement of 0.9499 to 0.8201 at 0.8697 will argue that rise from 0.8201 is a medium term up trend, rather than a correction. Further rally would be seen back to 61.8% retracement at 0.9003. This will now be the favored case as long as 0.8338 support holds.
EUR/AUD Daily Outlook
Daily Pivots: (S1) 1.4798; (P) 1.4862; (R1) 1.4986; More...
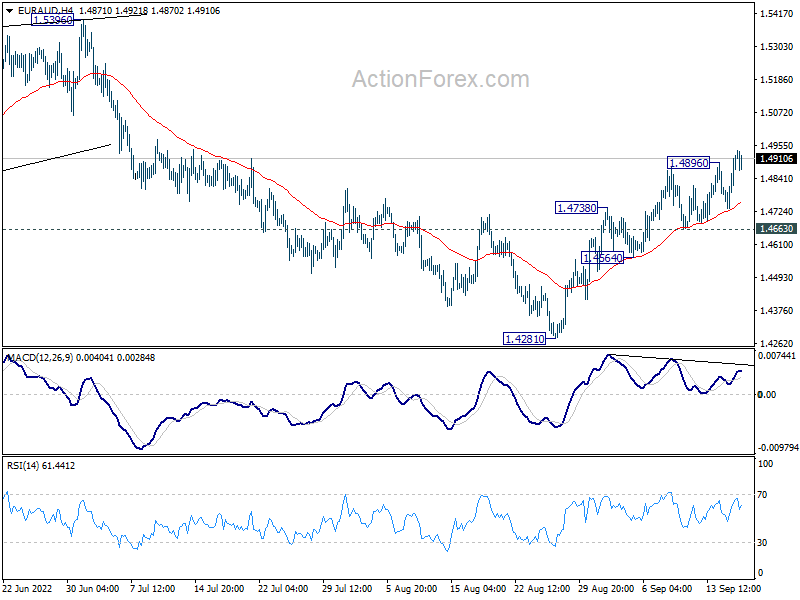
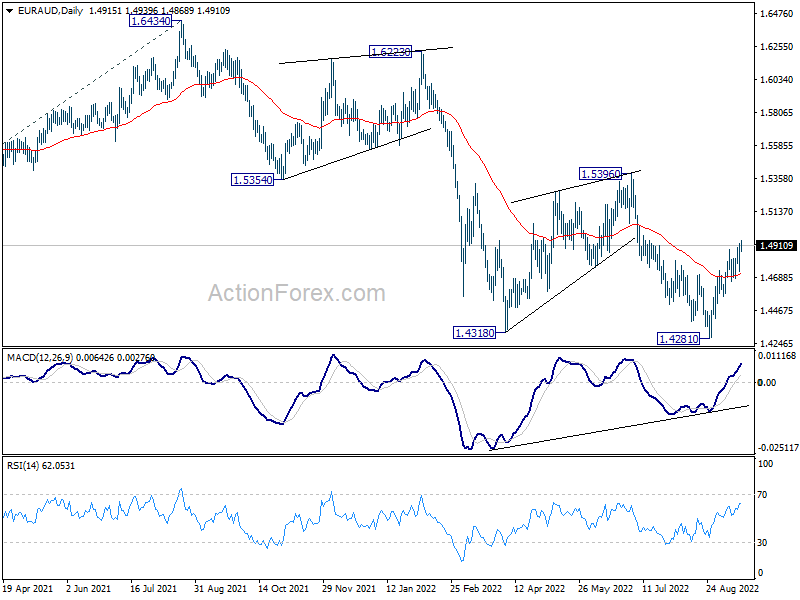
EUR/AUD's rally resumes again and intraday bias is back on the upside. Rise from 1.4281 short term bottom would target 1.5396 resistance. On the downside, however, break of 1.4663 minor support will turn bias back to the downside for retesting 1.4281 low.
In the bigger picture, down trend from 1.9799 is still in progress. Break of 1.4318 low will target 61.8% projection of 1.9799 to 1.5250 from 1.6434 at 1.3623, which is close to 1.3624 long term support (2017 low). This will remain the favored case now as long as 1.5396 resistance holds.
EUR/CHF Daily Outlook
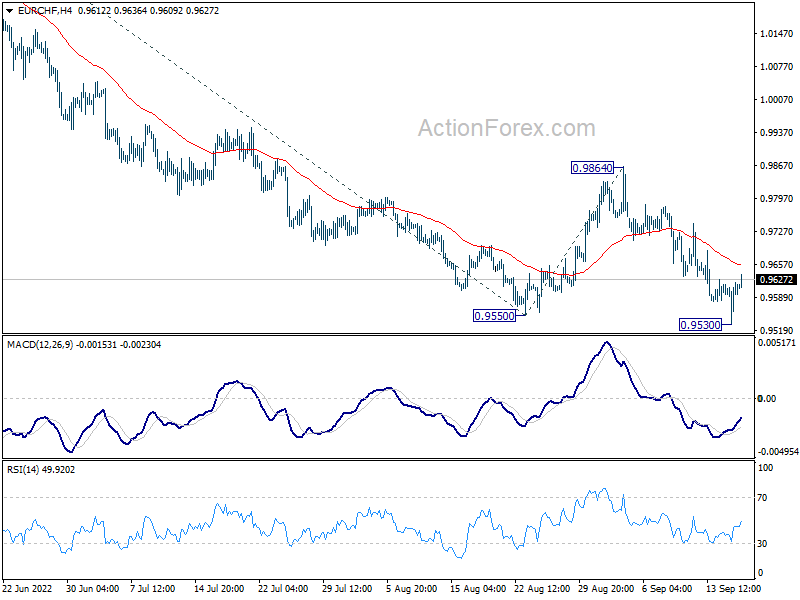
Daily Pivots: (S1) 0.9558; (P) 0.9586; (R1) 0.9640; More....
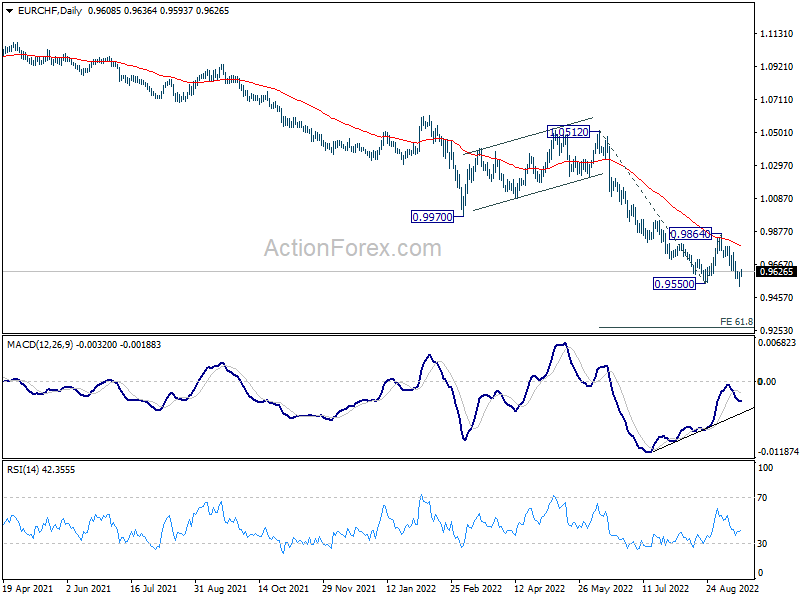
EUR/CHF recovered quickly after dipping to 0.9530. Intraday bias is turned neutral first. But outlook stays bearish as long as 0.9864 resistance holds Break of 0.9530 will resume larger down to 61.8% projection of 1.0512 to 0.9550 from 0.9864 at 0.9269.
In the bigger picture, long term down trend from 1.2004 (2018 high) is still in progress. Next target is 138.2% projection of 1.2004 to 1.0505 to 1.1149 at 0.9033. On the upside, break of 0.9970 support turned resistance is needed to be the first sign of medium term bottoming. Otherwise, outlook will stay bearish in case of strong rebound.
Daily Technical Analysis
EUR/USD
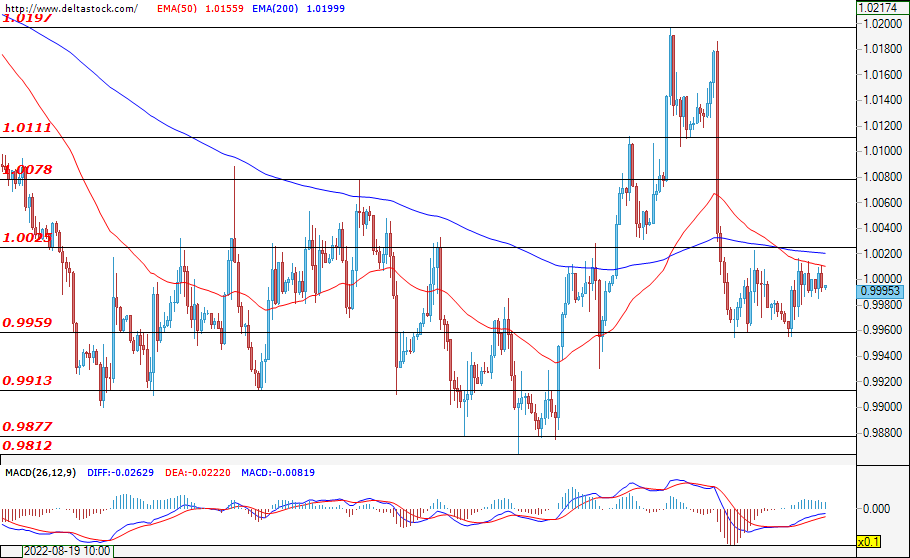
Neither the bears, nor the bulls managed to gain enough momentum and the EUR/USD remained locked in the zone between 0.9960 – 1.0025. The market sentiment remains negative – for a depreciation of the single European currency against the greenback, but only a confirmed breach of the critical support at 0.9960 could deepen the sell-off and head the pair towards a test of the next significant support at 0.9877. However, before a potential resumption of the downtrend is to occur, we may first witness an appreciation of the euro towards the resistance at 1.0070 – a level that may present the sellers with an opportunity to enter the market at better levels than the current ones. In case the resistance at 1.0070 is breached, then the corrective move may deepen and the pair could head towards the next key resistance at 1.0100. Today, an increase in activity can be expected around the announcement of the CPI data for the euro area at 09:00 GMT.
GBP/USD
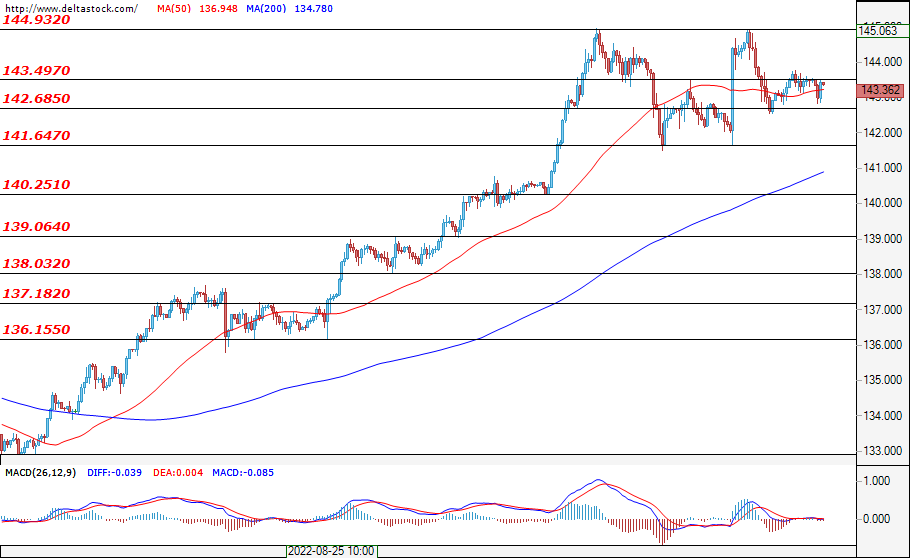
The consolidating movement of the currency pair between the support at 142.68 and the resistance at 143.50 continued during the past trading session and the beginning of the new one. The bulls are currently in control of the market and a successful breach of the 144.93 level would likely not surprise anyone. Conversely, if the support at 142.68 is breached instead, then this would pave the way for the bears to reach the next zone at 141.64, where the bulls should intervene and fight them off.
USD/JPY
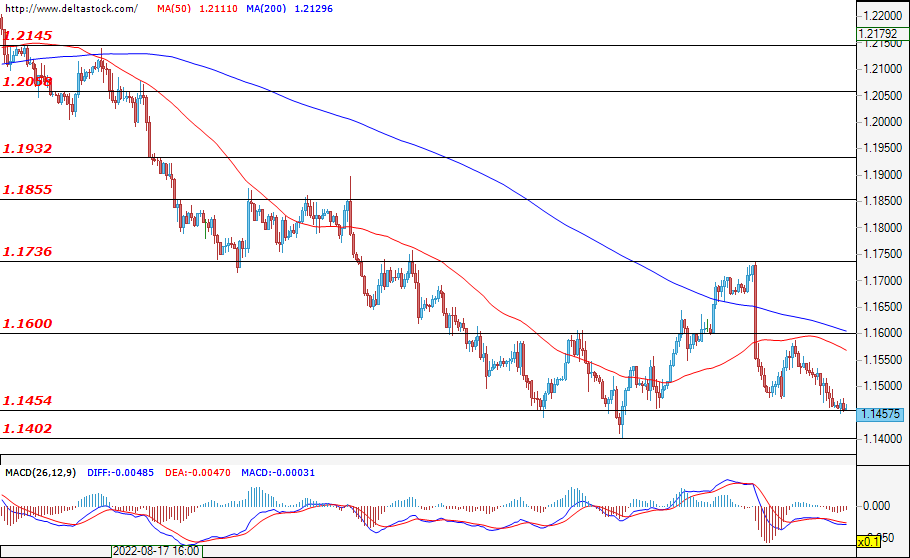
The past trading session was rather calm, and at least for now, the currency pair is managing to remain above the support at 1.1450. We may see a range move and a retracement towards the resistance at 1.1600. However, the bears seem to have permanently settled in the market, and so if the level at 1.1450 does not hold, then the next support at 1.1400 would likely be easily reached as well. A signal that the bulls may return to the market for a longer time period would be a breach of the psychological resistance at 1.1600.
EUGERMANY40
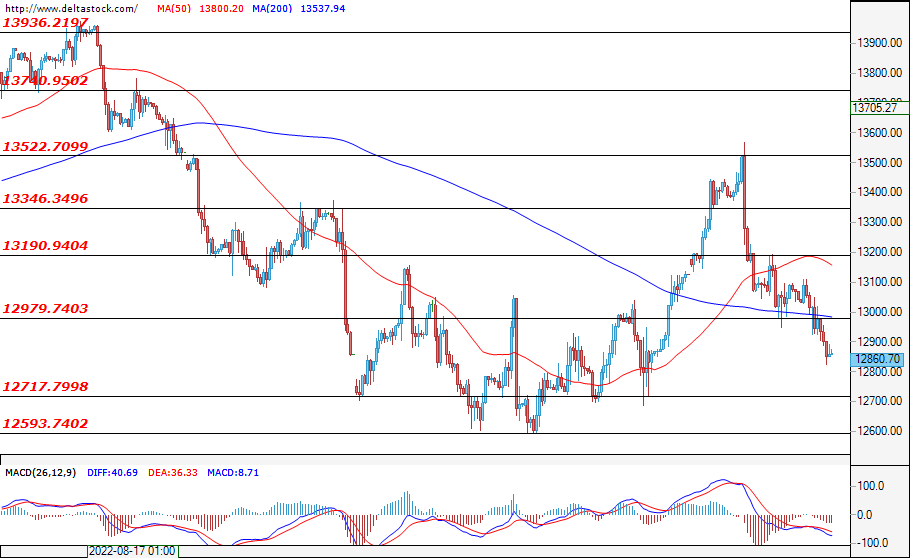
The negative expectations for a continuation of the downward movement that began in the beginning of the week have only strengthened, as yesterday the bears successfully breached the support at 12979. The forecasts for today’s trading session are for the sell-offs to continue and for the critical support at 12717 to likely be considered as the next target for the sellers. In the last trading day of the week, it is highly possible for the sellers to retain their profits, generated by the short positions taken in the beginning of week, which action will most likely hold the price of the index in the interval of 12979 – 12717, before a potential deepening of the sell-offs. There is not any major economic news expected to be announced today, thus volatility may remain low, not providing the necessary stimulus to the sellers to lead the price below the support at 12717. In case of a successful violation of the mentioned support, then we may expect a further deepening of the sell-offs and a depreciation towards the level at 12600. In an alternative scenario, in which the bulls manage to limit the decline and bounce the price back above the resistance at 13000, their next target would be the follow-up resistance zone at around 13190.
US30
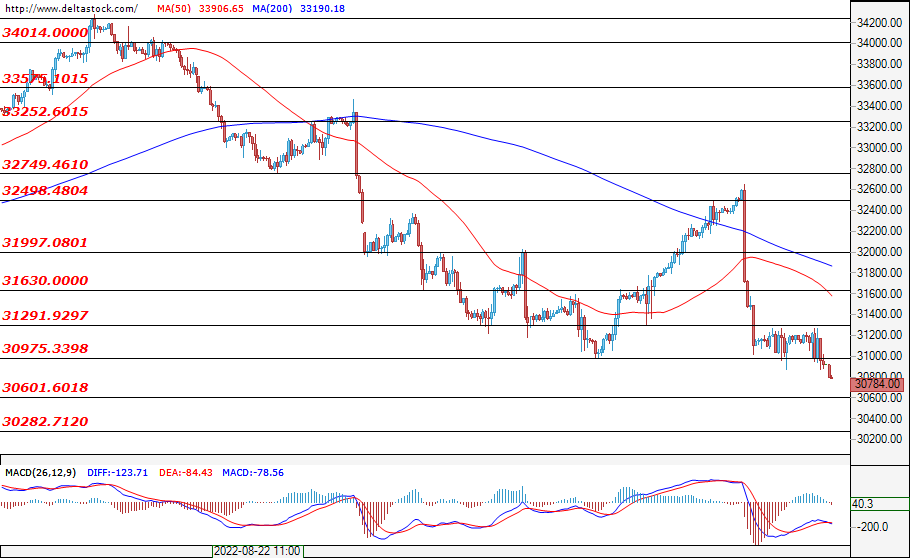
In the early hours of today’s trading session, the bears prevailed and successfully breached the support at 30975, which may suggest the end of the short consolidation that began in the beginning of the week after the significant losses from Monday. Thus, the violation of this support may be considered as a confirmation signal for the continuation of the downtrend. Therefore, the forecasts for today’s session are for the sell-offs to continue heading the price towards a test of the critical support at 36000, as current market sentiment remains negative – for a further depreciation of the index. However, if the bulls prevail and manage to return the price above 30975, then we may expect a further correction towards the resistance at 31630, and if this scenario is realised, then the sellers would most probably take advantage of the situation to enter the market at better levels.
Nasdaq 100 Breaks Lower
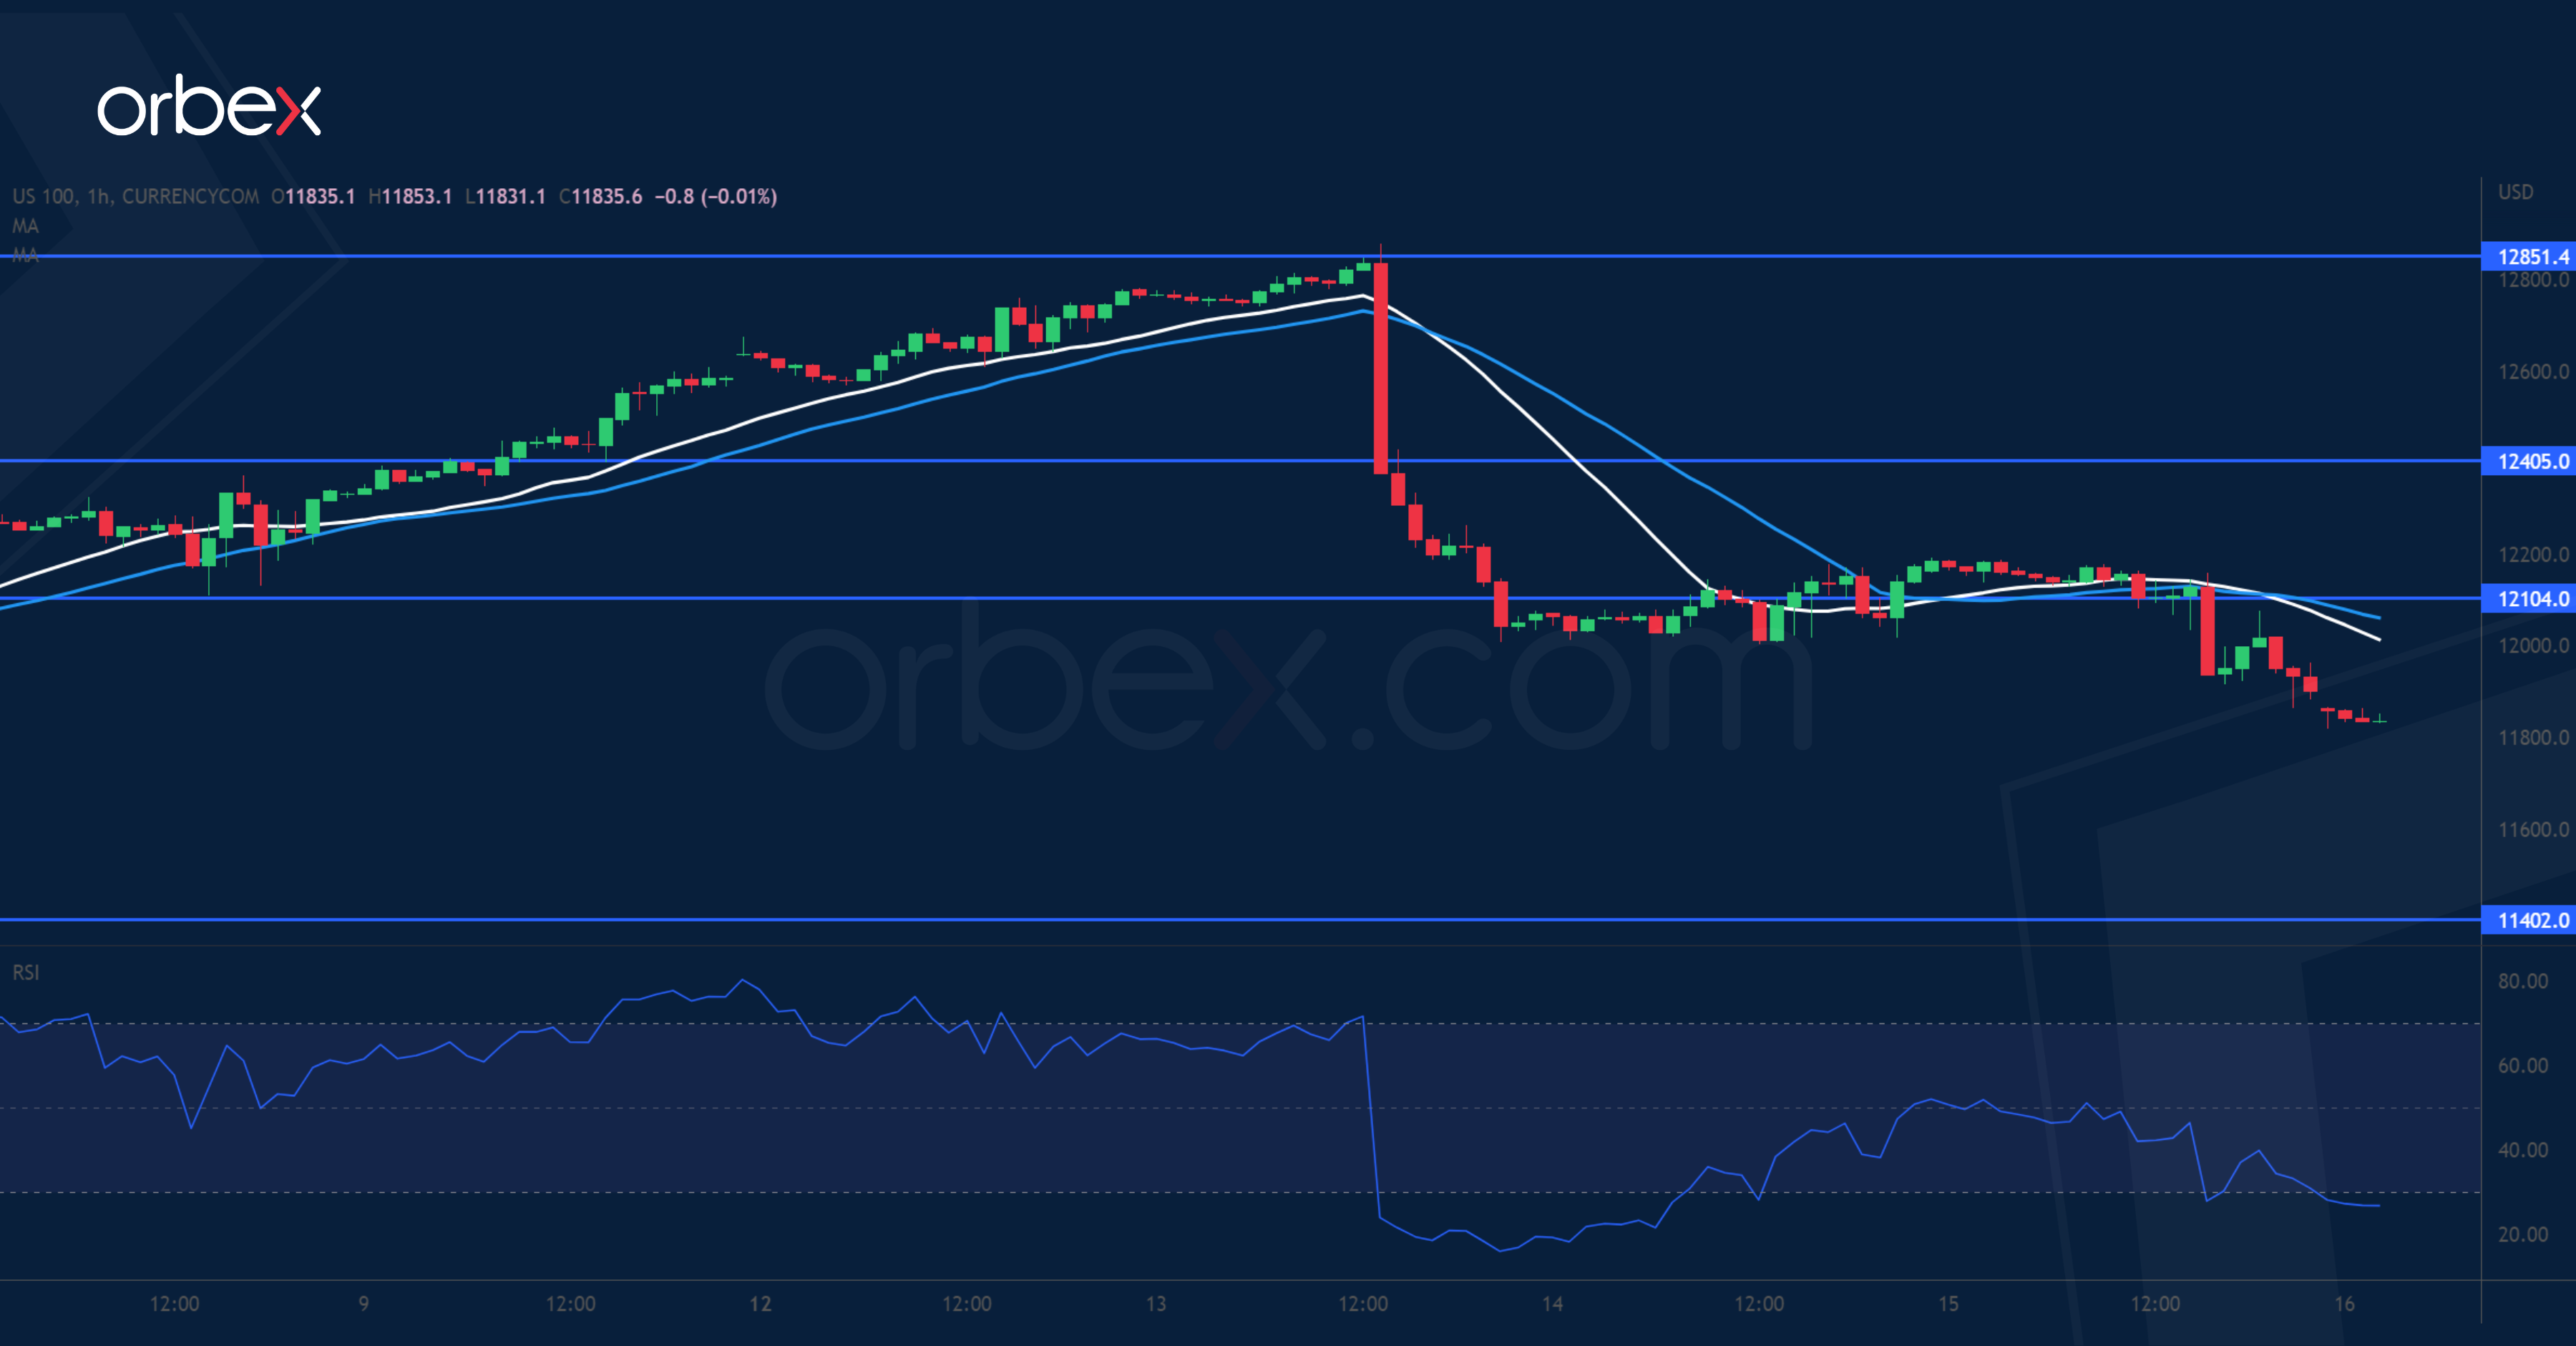
The Nasdaq 100 tumbles as investors brace for an aggressive move by the Fed next week. The recent rally came under pressure at the origin of a sell-off in late August (12850) which coincides with the 30-day moving average. The sharp liquidation suggests that the mood has swung back to the fragile side. A breach below the psychological level of 12000 shows that the path of least resistance is down. Then July’s lows near 11400 would be the bulls’ last stronghold. 12100 is the first resistance in case of a bounce.
AUD/USD Tests Major Support
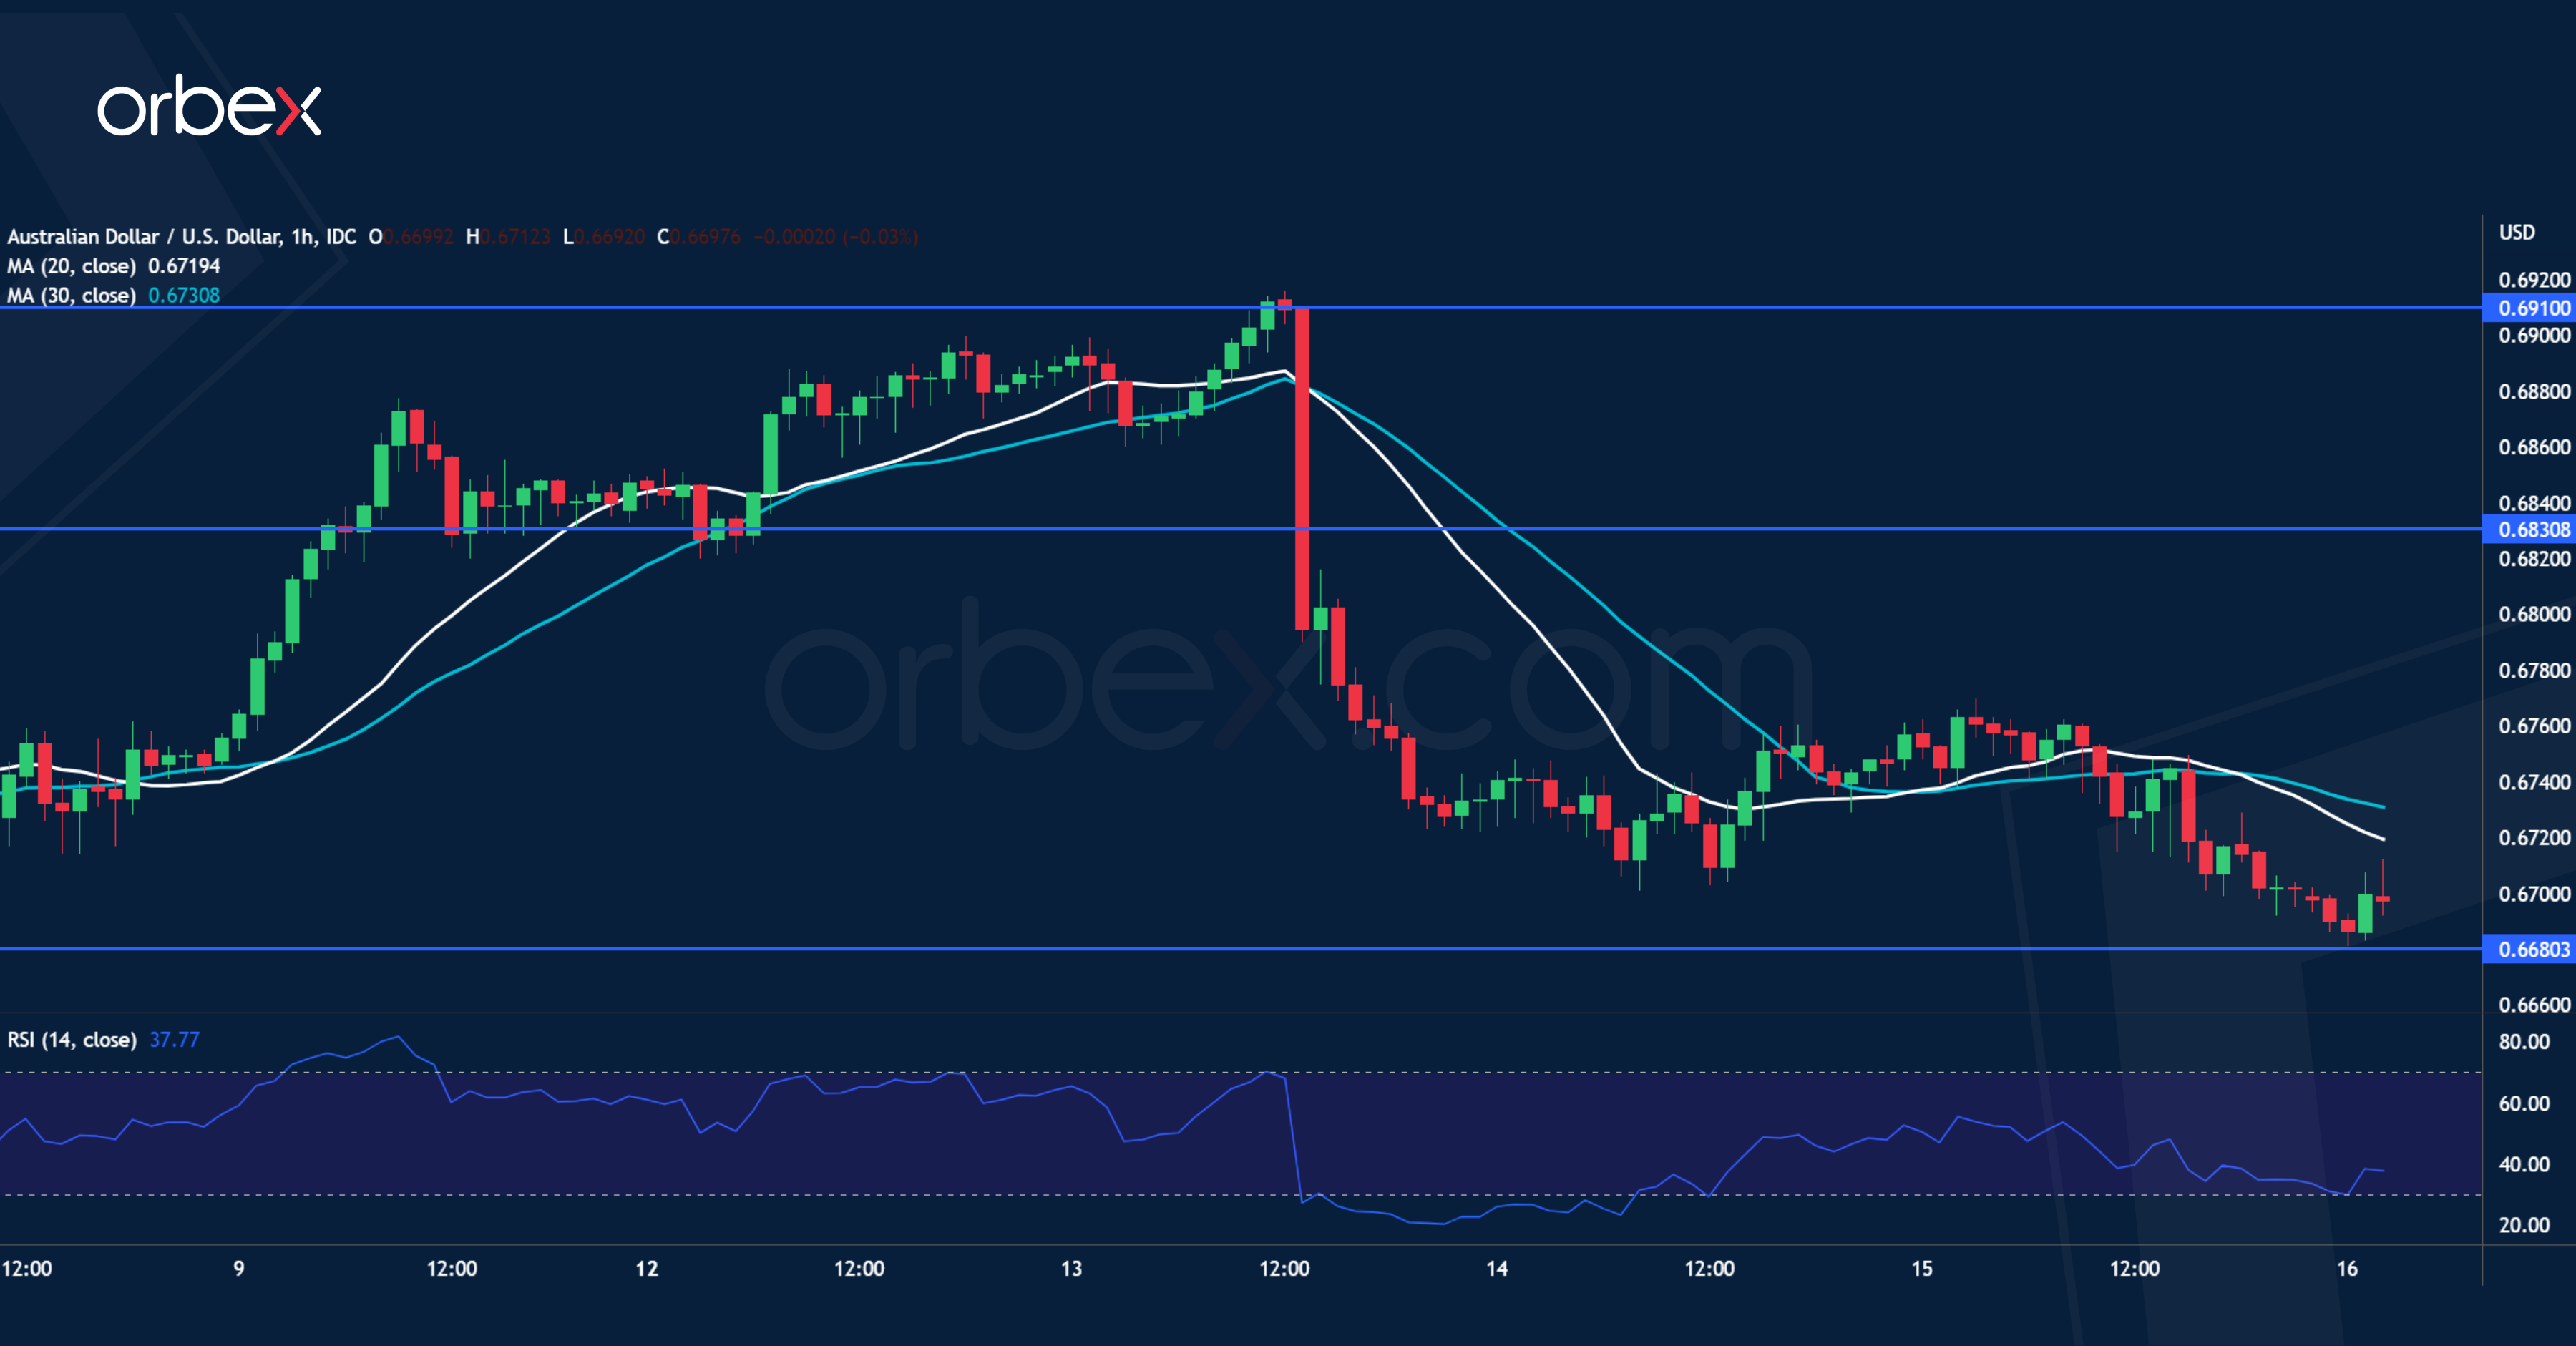
The Australian dollar struggles as August’s unemployment rate shows an uptick. The bounce hit resistance at 0.6910 over the 30-day moving average. A steep drop is a sign of liquidation and a lack of commitment from the buy side. The RSI’s oversold condition has led to some buying in the demand area near July’s lows (0.6680). If the pair fails to hold onto this critical level, a bearish breakout would extend losses to 0.6500 and resume the downtrend in the medium-term. The support-turned-resistance at 0.6830 is a fresh hurdle.