Sample Category Title
Forex and Cryptocurrencies Forecast
EUR/USD: Rather Boring Week
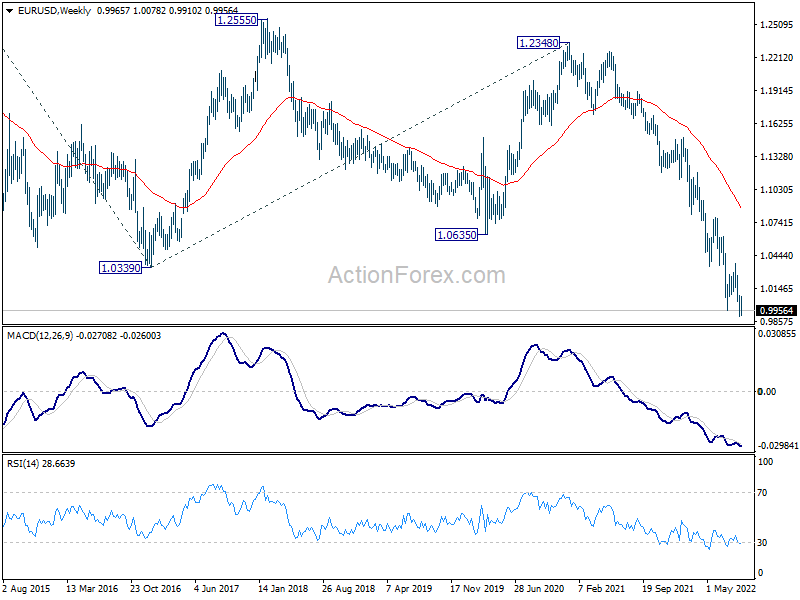
The past week was, boring, so to say. The macro statistics released from August 30 to September 2, although versatile, turned out to be quite close to market expectations. For example, the harmonized consumer price index in Germany, was 8.8%, with the forecast of 8.8%. The consumer price index in the Eurozone amounted to 9.1% instead of the expected 9.0%. The index of business activity in the US manufacturing sector (PMI) did not change at all over the month and amounted to 52.8 (forecast 52.0), and the number of new jobs created outside the American agricultural sector (NFP) did not go far from the expected either, 315K against 300K. As a result, EUR/USD was moving along the parity line of 1.0000 all five days, fluctuating in the range of 0.9910-1.0078, and completed the five-day period at the level of 0.9955.
Market participants are likely to be much more active next week. The key day will certainly be Thursday September 08, when the ECB will decide on the deposit rate and make a statement and comments on its monetary policy. Inflation in the Eurozone rose even more in August: from 8.9% to 9.1%. Therefore, many experts, such as the strategists of the international financial group Nordea, believe that the European regulator will raise the rate by 75 basis points at once.
"Considering that the rate increase by 75 b.p. is not fully priced in financial markets and that the tone of the press conference is likely to be hawkish," Nordea economists write, "we expect the first reaction from markets to be higher yields, wider bond spreads and a stronger euro."
If we talk about the average forecast, it looks as follows at the time of writing the review, on the evening of Friday, September 02. 50% of experts vote for the fact that EUR/USDwill move south in the near future, 35% vote for its growth, the remaining 15% are waiting for the side trend to continue. The readings of the indicators on D1 give much more definite signals. Both among trend indicators and among oscillators, all 100% side with the bears. However, 10% among the latter give signals that the pair is oversold.
The nearest bearish target for EUR/USD is the 0.9900-0.9910 zone. Note that the 0.9900-0.9930 area is also a strong 2002 support/resistance zone. Apart from the parity level of 1.0000, if the euro strengthens, the first priority for the bulls will be to rise above the resistance of 1.0030. After that, it will be necessary to overcome the level of 1.0080 and consolidate in the zone of 1.0100-1.0280, the next target area is 1.0370-1.0470.
Among the upcoming week's events, apart from the ECB meeting, we can single out the publication of data on retail sales in the Eurozone on Monday, September 05. Monday is a holiday in the United States, the country celebrates Labor Day. We are waiting for data on business activity (ISM) in the US services sector on Tuesday, September 06, and GDP indicators in Germany and the Eurozone will be published on Wednesday. Fed Chairman Jerome Powell is scheduled to speak and data on unemployment in the United States will be published on the same day.
GBP/USD: On the Way to a 37-Year Low
We titled our review of the GBP/USD pair "Gloomy Forecasts for the Pound Continue to Come True" two weeks ago. The past headline sounded like "Very Terrible Long-Term Outlook" We can not say anything cheerful this week either: the pound is still one of the weakest G10 currencies, which is affected by the worsening prospects for the UK economy.
The British Chamber of Commerce (BCC) estimates that the UK is already in the midst of a recession and inflation will hit 14% this year. And according to Goldman Sachs, it could reach 22% by the end of 2023. According to the Financial Times, the number of British households living in fuel poverty will more than double in January to reach 12 million people. And the new prime minister will have to take urgent action to avoid an economic disaster. Just what action? It seems that no one knows yet.
In such a situation, the anxiety of market participants about the candidacy of the next prime minister, whose name will be announced on Monday, September 05, is quite understandable. Recall that the current Prime Minister Boris Johnson has resigned after a sex scandal involving one of his cabinet members.
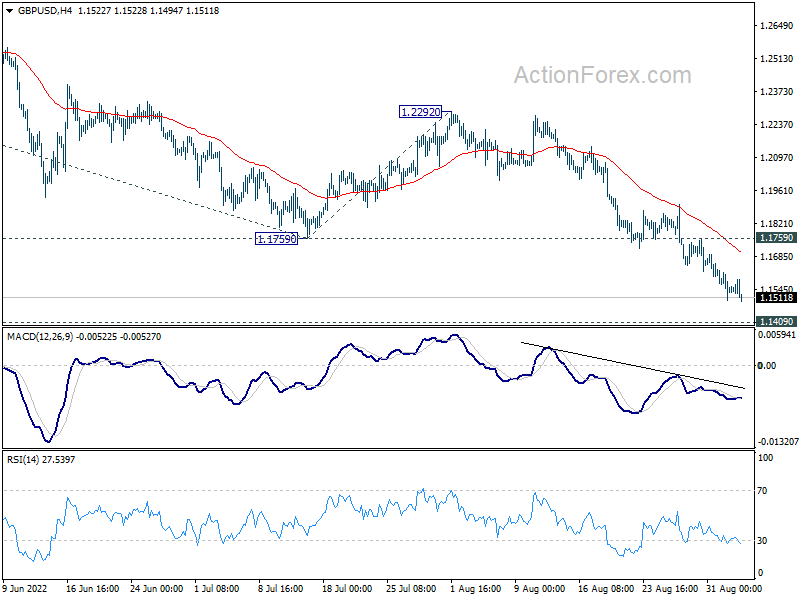
Against this gloomy background, the pound has been falling since August 01. Having broken through support at 1.1500, it set two-year lows (1.1495) last week. As for the final chord of the five-day period, it sounded a little higher, at around 1.1510. Most experts (55%) believe that GBP/USD will continue to fall in the coming weeks. And it will not stop even if the Bank of England raises interest rates by 75 bp on September 15. 30% hope for a correction and 15% have taken a neutral position.
According to currency strategists at UOB Group, the next significant support level after 1.1500 is in the March 2020 lows. "However," the specialists note, "short-term conditions are deeply oversold, and it is not yet clear if this major support will be within reach this time." As for a possible correction to the north, the UOB believes that only a break above 1.1635 will indicate that the British currency is not ready to fall further.
Note that the March 2020 lows (1.1409-1.1415) are at the same time the lows for the last 37 (!) years. The GBP/USD pair fell lower to 1.0800, only in 1985. As for the bulls, they will meet resistance in the zones and at the levels of 1.1585-1.1625, 1.1700, 1.1750, 1.1800-1.1825, 1.1900 and 1.2000. The readings of the indicators on D1 are similar to the readings for the EUR/USD pair: all 100% are colored red. However, here a third of the oscillators signal that the pair is oversold, which often indicates a possible correction.
The United Kingdom's economic calendar can mark Monday 05 and Tuesday 06 September when the UK Services and Manufacturing PMIs and the Composite Index (PMI) will be released. A hearing on the inflation report will take place on Wednesday, September 07, but it will be more informative, and no important decisions will be made that day.
USD/JPY: Higher, Higher and Higher
Most analysts (60%) had been expecting a new test of the July 14 high and taking the 139.40 high last week. This is exactly what happened. USD/JPY rose to the height of 140.79, thus reaching a 24-year high. The weekly trading session finished at 140.20.
The reason for another record is still the same: the divergence between the monetary policy of the Bank of Japan (BOJ) and other major central banks, primarily the US Federal Reserve. Unlike the American hawks, the Japanese regulator still intends to pursue an ultra-soft policy, which is aimed at stimulating the national economy through quantitative easing (QE) and a negative interest rate (-0.1%). This divergence is a key factor for the further weakening of the yen and the growth of USD/JPY.
Bank of America Global Research economists expect USD/JPY to remain at high levels until a major correction in Q4 2022. Moreover, such a correction is possible only if inflation in the US shows a steady slowdown. "We expect USD/JPY to end 2022 at 127," these analysts say. "However, the structural weakness of the Japanese yen should resurface in the longer term."
At the moment, the majority of analysts (50%) believe that USD/JPY will continue its movement to the north. Fortunately, it still has room to grow: it was worth more than 350 yen for 1 dollar back in 1971. 30% of experts expect the bulls to take a break in the area of the highs reached, and another 20% are counting on a corrective moving to the south.
For indicators on D1, the readings mirror the readings for the previous pair: 100% of them point north, while a third of the oscillators are in the overbought zone. The primary task of the bulls is to update the high of September 02 and rise above 140.80. The next goal is 142.00. Supports for the pair are located at the levels and in the zones 140.00, 138.35-139.05, 137.70, 136.70-137.00, 136.15-136.30, 135.50, 134.70, 134.00-134.25.
As for the economic events of the coming week, we can highlight the release of data on Japan's GDP on Thursday, September 08.
CRYPTOCURRENCIES: All Hope for Ethereum
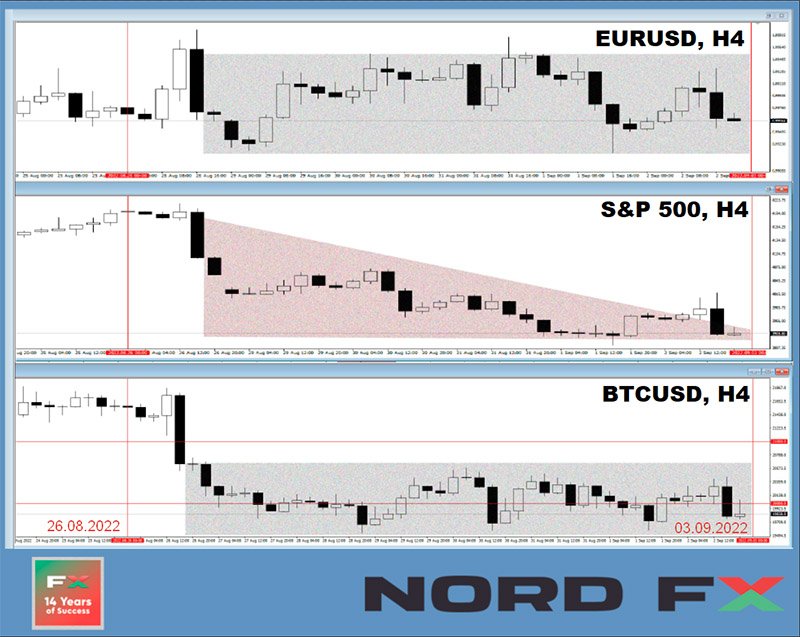
The BTC/USD pair was moving in a narrow range along the $21.330 horizon for a week before Jerome Powell's speech on August 26. The speech of the head of the Fed collapsed risky assets, the stock and crypto markets flew down. However, if the S&P500, Dow Jones and Nasdaq stock indices continued to fall throughout the past week, bitcoin was able to stay in the $20,000 ($19,518-20,550) region, and ethereum even grew in anticipation of the transition to the PoS mechanism.
As a result, instead of the usual correlation of BTC/USDwith technology stocks, we could observe its correlation with the main major forex pair, EUR/USD these days, which moved sideways along the parity line of 1.0000. A slight recovery on Friday, September 2 was caused by the publication of data on unemployment in the US. But the pair did not go beyond the weekly trading range and bitcoin is trading at $19,930 at the time of writing the review. The total capitalization of the crypto market has fallen below the psychologically important level of $1 trillion and stands at $0.976 trillion ($0.991 trillion a week ago). The Crypto Fear & Greed Index has fallen by another 2 points in seven days, from 27 to 25, and is in the Extreme Fear zone.
Over the past 10 years, it was only in 2018 that investors suffered more serious losses. And the pressure on the crypto market continues to persist, primarily due to the tightening of the monetary policy of the US Central Bank. According to CoinShares, the turnover of cryptocurrency investment products fell in the last decade of August to the lowest level since October 2020, and the outflow of funds continued for the third week in a row. "Although […] part of this dynamic is due to seasonal effects," the specialists explain, "we also see continued apathy after the recent price decline. We think the caution is due to the Fed's hawkish rhetoric." In addition to speculators and casual "tourists", medium-term BTC holders (with a coin history of more than 5 months) began to leave the market.
The ranks of crypto enthusiasts are rapidly thinning out. Bitcoin is "a purely speculative asset with no utility," due to the lack of technological progress. This was stated by Justin Bons, the founder and chief investment officer of the Cyber Capital fund. He used to be a vigorous advocate for bitcoin, but changed his point of view, calling it "one of the worst cryptocurrencies". "The world has moved forward. It used to be said that digital gold would simply embrace the best technology. This thesis, obviously, has not been fully confirmed. Bitcoin doesn't have smart contracts, privacy technologies, or scaling breakthroughs," Bons explained.
"The economic properties of bitcoin are incredibly weak as well. It competes with cryptocurrencies that can achieve negative inflation, high storage capacity and utility, such as post-merger ETH." "People, for the most part, invest in the first cryptocurrency only because they believe in the price increase. They act on the same principle as participants in Ponzi schemes," the founder of Cyber Capital believes.
Umar Farooq, the head of Onyx's blockchain division, which is part of the JPMorgan conglomerate, also voiced a lot of criticism against the crypto market. In his opinion, most of the crypto assets on the market are "junk", and the lack of full regulation of the industry deters many traditional financial institutions from participating in the market. In addition, the technologies and practical applications of digital currencies are not well developed. Because of this, for example, they cannot be used as products such as tokenized bank deposits.
Investor and broadcaster Kevin O'Leary also believes that the price of bitcoin is stagnating due to lack of regulation. As a result, institutionalists cannot invest in this sector. "You need to use the trillions of dollars that sovereign wealth manages, but they are not going to buy bitcoin because there is no regulation," says O'Leary. "People forget that 70% of the world's wealth is in pension and sovereign wealth funds. Accordingly, if they are not allowed to buy this asset class, they do not bet on it."
However, the investor believes that regulation will still appear within the next two to three years. In the meantime, without a regulatory framework, cryptocurrency cannot be considered a full-fledged asset class, and bitcoin is unlikely to rise above $25,000.
Analyst Justin Bennett's forecast looks much bleaker. According to him, the recent sell-off in the stock market will inevitably lead to a fall in the bitcoin rate: "The stock sale that has taken place confirms a major bull trap and is likely to cause prolonged decline. That is, the S&P500 will fall by about 16%, and BTC by 30%-40%, to the level of $12,000."
"BTC is testing the 2015 trend line again," the analyst writes. -"Do not believe those who consider it a healthy phenomenon. The two long bottom wicks of 2015 and 2020 indicating strong demand are worth looking out for. This time we are seeing exactly the opposite." According to Bennett, the main target for the bears is the pre-COVID-19 high of $3,400.
Regarding ethereum, Bennett believes that the asset is forming the top of the "head and shoulders" pattern on the chart with a downward target near $1,000: "The right shoulder of this pattern is starting to form and ETH's drop below $1,500 is the confirmation."
A similar scenario is given by Bloomberg analysts. They are also predicting ETH to fall below $1,000 despite its recent comeback from the August 29 lows. This is largely due to the volatility of the ethereum price in bearish market conditions. "Technical indicators of momentum and price trends show that the token's decline from a peak near $2,000 in mid-August to the current zone near $1,500 is likely to continue," Bloomberg said in their report.
Sentiment in the ETH community has remained optimistic lately due to the upcoming merger. However, this has not provided the asset with any immunity to the latest unfavorable macroeconomic conditions, Bloomberg analysts write. Ethereum has established promising support on its 50-day moving average. However, after the market fell on August 25-26, the asset has been below this support, which indicates the risks of a further collapse and a retest of support around $1,000.
And some optimism at the end of the review. According to a number of experts, if the transition to the Ethereum 2.0 network and the implementation of the Proof-of-Stake mechanism go as planned, this altcoin can rise sharply in price and pull the entire market up with it, primarily its main competitor, bitcoin. Recall that the update of the ethereum network is scheduled for the period from September 15 to 20. So we will find out soon which of the predictions will be correct.
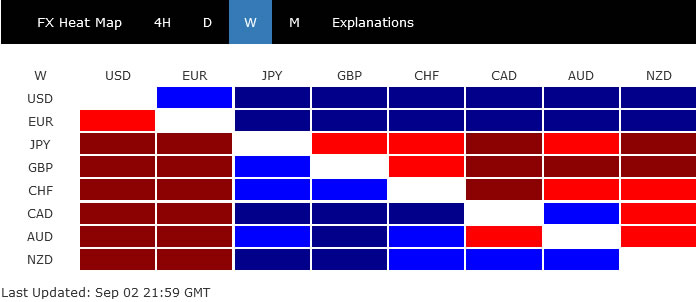
Dollar and Euro as Joint Winner, Risk Aversion Intensified
Dollar and Euro ended as double winners of the week. The greenback was boosted by solid economic data from the US, including non-farm payrolls, risk aversion, and rising yields. On the other hand, ECB policy makers were singing a hawkish chorus which prompted expectation of a 75bps rate hike at the September 8 meeting.
Yen was the biggest looser on the back of rising benchmark yields in the US and Europe. BoJ is also clearly maintaining a dovish stance. Yen was also pressured on heightened geopolitical tension in the Taiwan Strait, with repeated military provocation by China using drones.
But Sterling was not too far away from Yen, as UK's outlook, which is already in recession, looks dim. Swiss Franc is paring some of recent gains, as Euro recovered. Commodity currencies were mixed, with Canadian Dollar having a mild upper hand against Aussie, for expectation of a 75bps BoC hike and a 50bps RBA hike this week.
NASDAQ's steep fall continued, could it challenge 10k support level
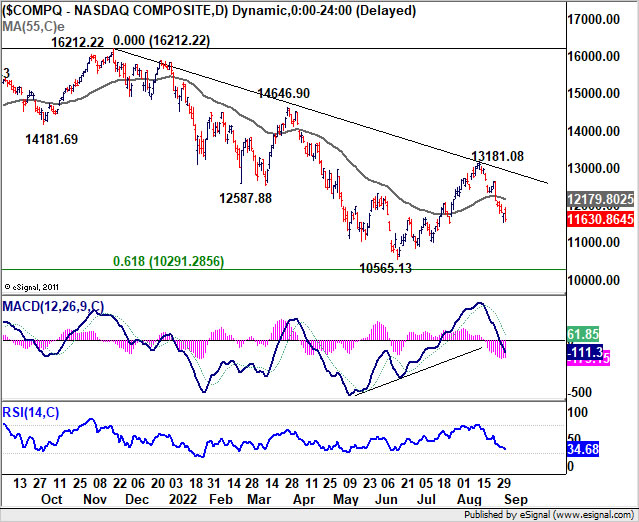
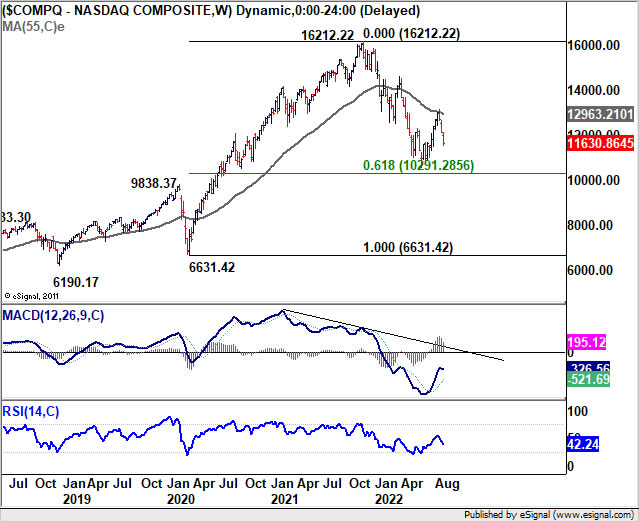
NASDAQ had the third straight week of decline as fall from 13183.08 accelerated lower. Prior rejection by 55 week EMA (now at 12962.21) is clearly a medium term term bearish signal. But it should be noted that there is an important cluster support level slightly above 10k psychological level.
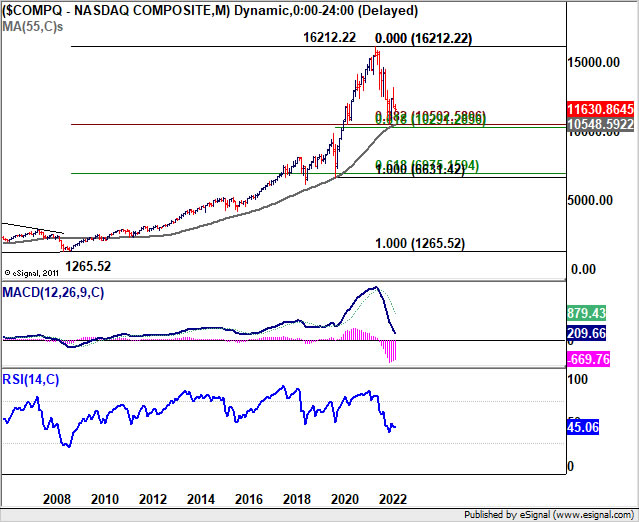
The cluster include 55 month EMA at 10548.59, 61.8% retracement of 6631.42 (2020 low) to 16212.22 (2021 high) at 10291.28, and 38.2% retracement of 1265.52 (2009 low) to 16212.22 at 10502.58.
So, while deeper fall is expected as long as 55 day EMA (now at 12179.80) holds, and breach of 10565.13 low cannot be ruled out. There should be strong support around 10k to bring reversal. And, if happens, firm break of 10k will indicate that something dramatic is happening.
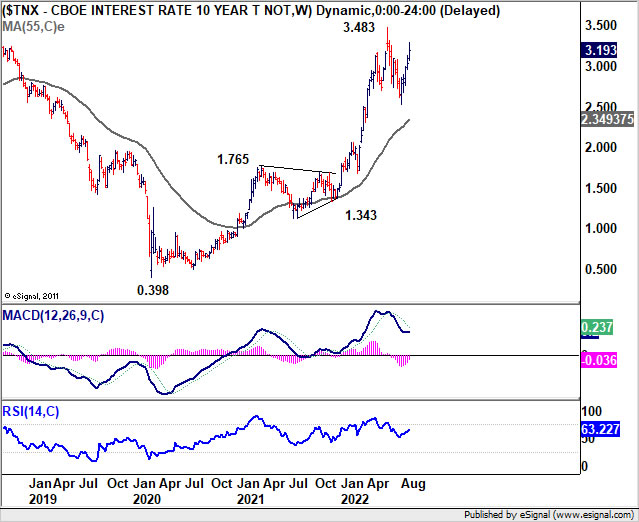
10-year yield extended rebound, but 3.483 should still cap upside
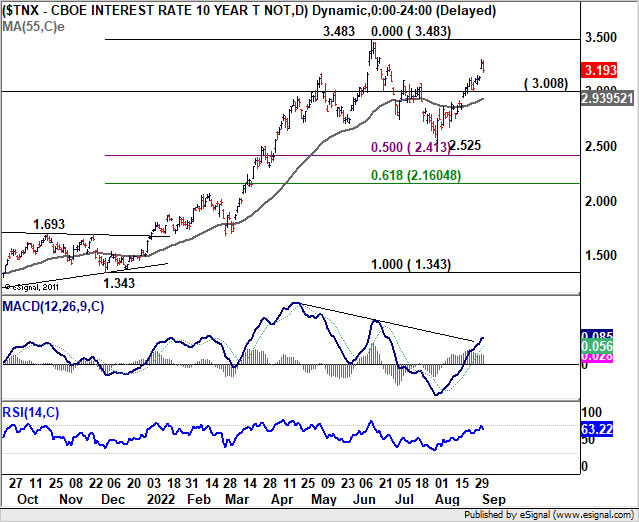
10-year yield's rebound from 2.525 extended last week, break through 3.101 resistance and hit as high as 3.295. While further rise is in favor for the near term, firm break of 3.483 high is still not anticipated yet. There should be one more falling leg before corrective pattern from 3.483 completes. Break of 3.008 support will suggest that such third leg has started back towards 2.525.
However, the up trend resumption in USD/JPY is making this view shaky. Decisive break of 3.483 will resume larger up trend from 0.398 (2020 low). Such development, if happens, will reinforce USD/JPY's rally towards 1998 high at 147.68.
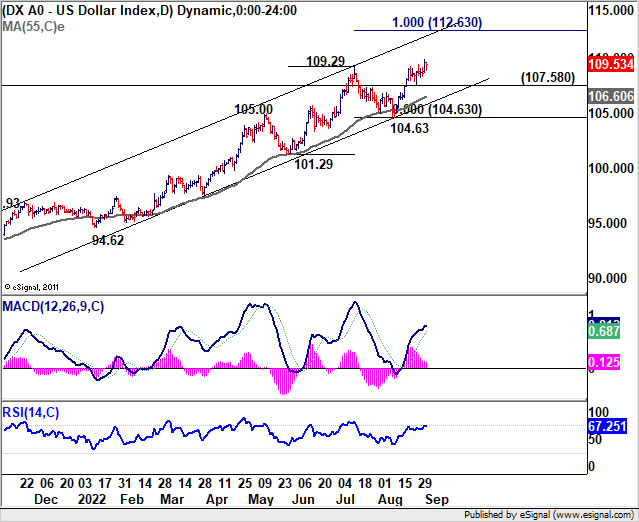
Dollar index extending up trend towards 112.63
Dollar index's up trend continued last week but that was surprisingly due to upside break out in USD/JPY, rather than downside breakout in EUR/USD. Anyway, near term outlook will stay bullish as long as 107.58 support holds. Next target is 100% projection of 101.29 to 109.29 from 104.63 at 112.63.
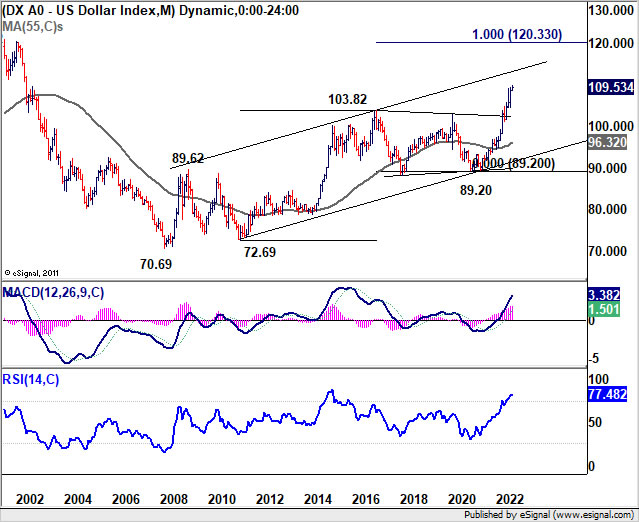
In the bigger picture, current rise in DXY is part of the decade long up trend from 70.69 (2008 low). Theoretically, such up trend should target 100% projection of 72.69 to 103.82 from 89.20 at 120.33, which close to 2001 high at 121.02. But this bearish case would require down trend resumption in EUR/USD before becoming more solid.
Canadian Dollar also strong on BoC expectations
While Dollar and Euro was strong, Canadian Dollar performed not too badly. The Loonie is supported by expectation of BoC rate hike of 75bps on September 7.
GBP/CAD's down trend continued last week with daily MACD showing further downside acceleration. Outlook will stay bearish as long as 1.5776 resistance holds. Next target is 1.4831 long term support (2010 low). This coincides with 61.8% projection of 2.0971 (2015 high) to 1.5746 (2016 low) from 1.8047 (2020 high) at 1.4818. This 1.4818/31 should provide strong support to bring rebound, at least on first attempt.
However, sustained break of 1.4831 will will indicate multi-decade down trend resumption for 100% projection at 1.2822 in the medium term.
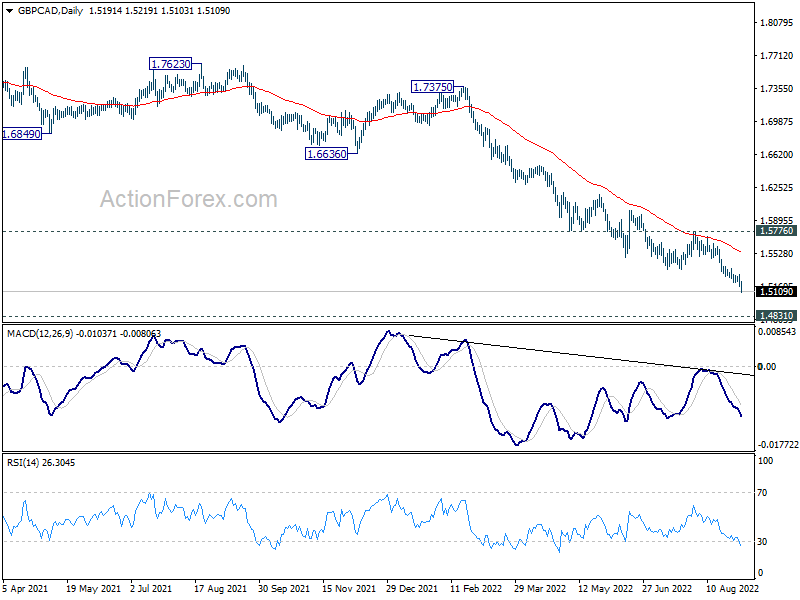
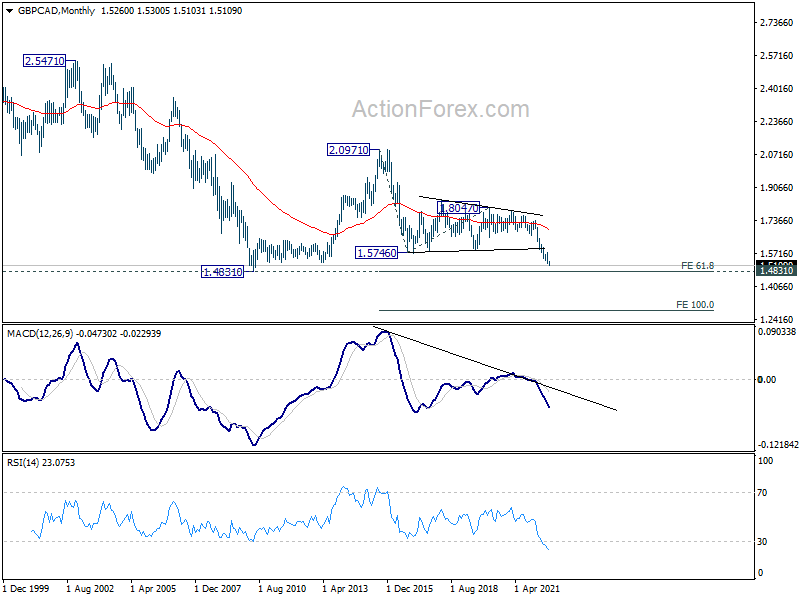
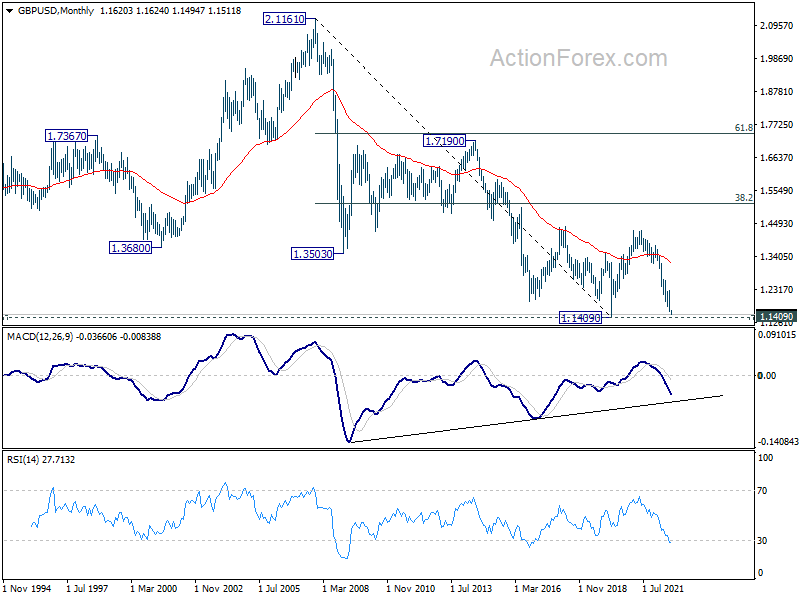
Also, the development in GBP/CAD would very much depends on whether GBP/USD would break through 1.1409 (2020 low) decisively, and subsequent downside momentum.
Silver resumed down trend, Gold still holding above 1680
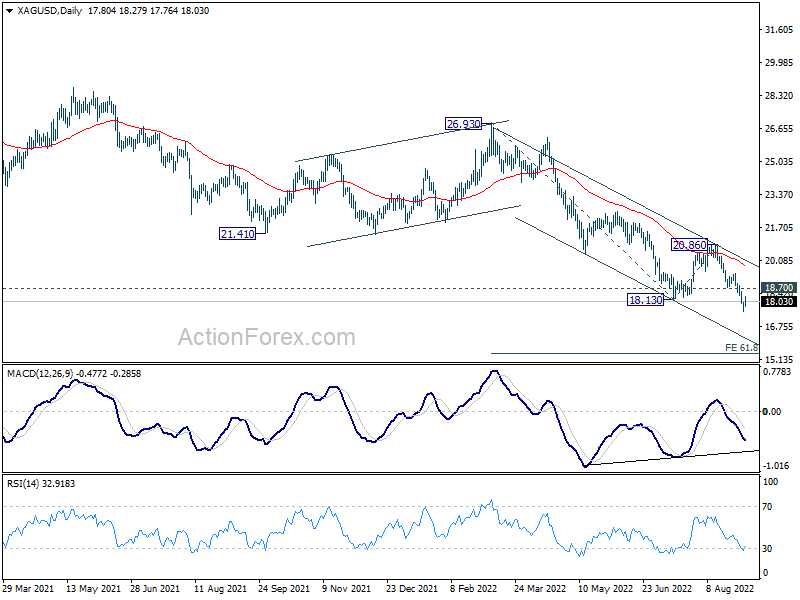
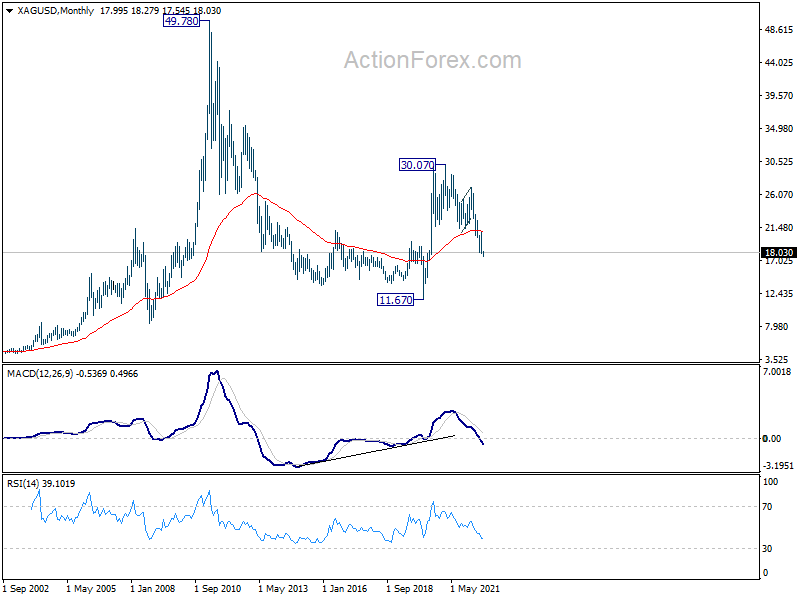
Silver's down trend resumed by breaking through 18.13 low last week and hit as low as 17.54. Near term outlook will stay bearish as long as 18.70 resistance holds. Next target is 61.8% projection of 26.93 to 18.13 from 20.86 at 15.42. Also, prior rejection by 55 month EMA is clearly a bearish sign. While it's too early to tell, the case of more decline towards 2020 low at 11.67 is now opened.
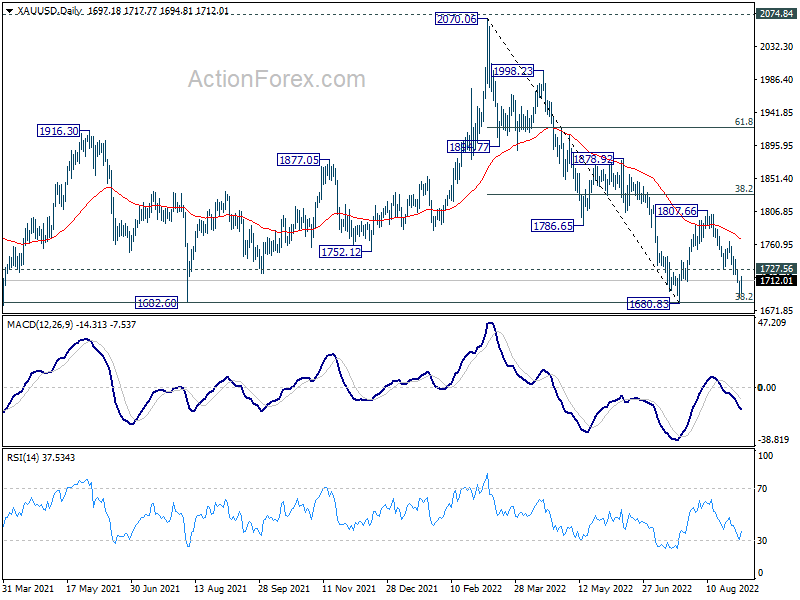
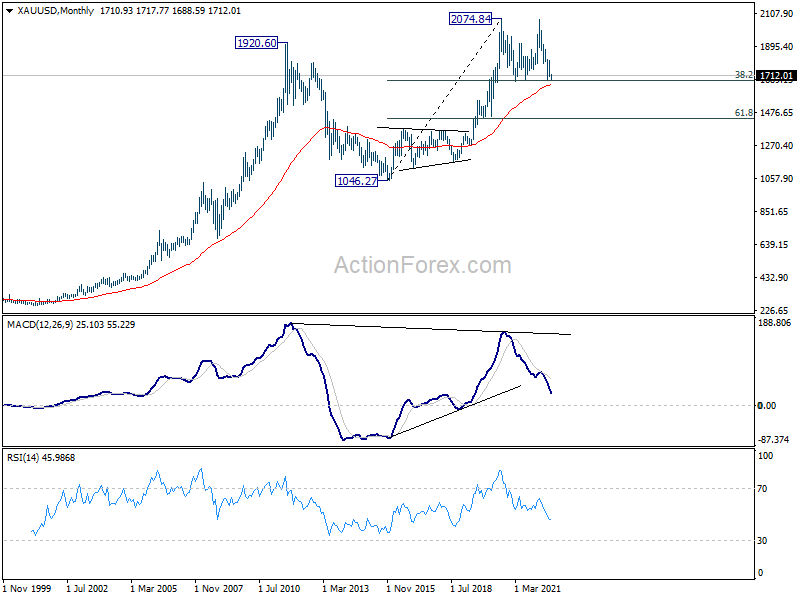
Gold also declined notably last week on the back of Dollar's strength. There is still hope of support from 1680.83 cluster level to bring rebound. This coincides with 38.2% retracement of 1046.27 (2015 low) to 2074.84 at 1681.92, and in proximity to 55 month EMA (now at 1654.00).
However, sustained break of 1654/80 support zone will complete a double top pattern (2074.84, 2070.06). That could prompt deeper selloff to 61.8% retracement of 1046.27 to 2074.84 at 1439.18. If that happens, it would likely be accompanied by some upside acceleration in Dollar.
USD/JPY Weekly Outlook
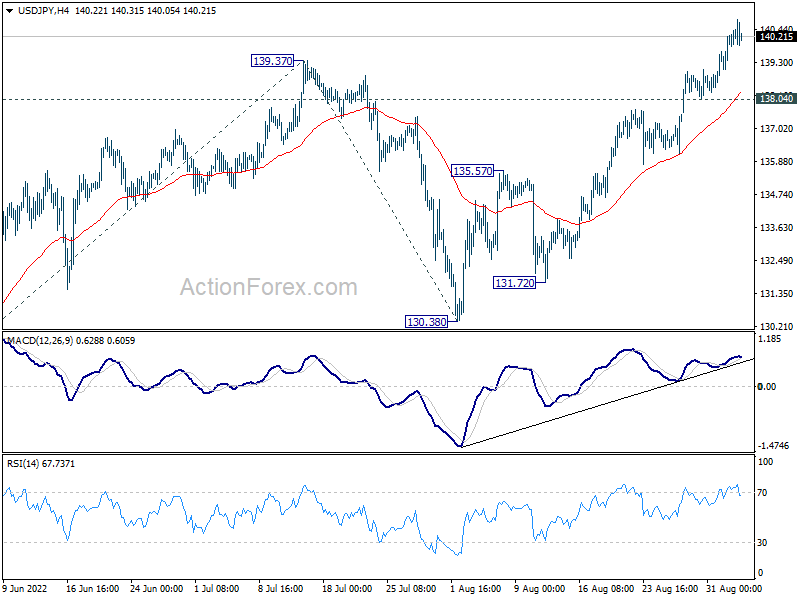
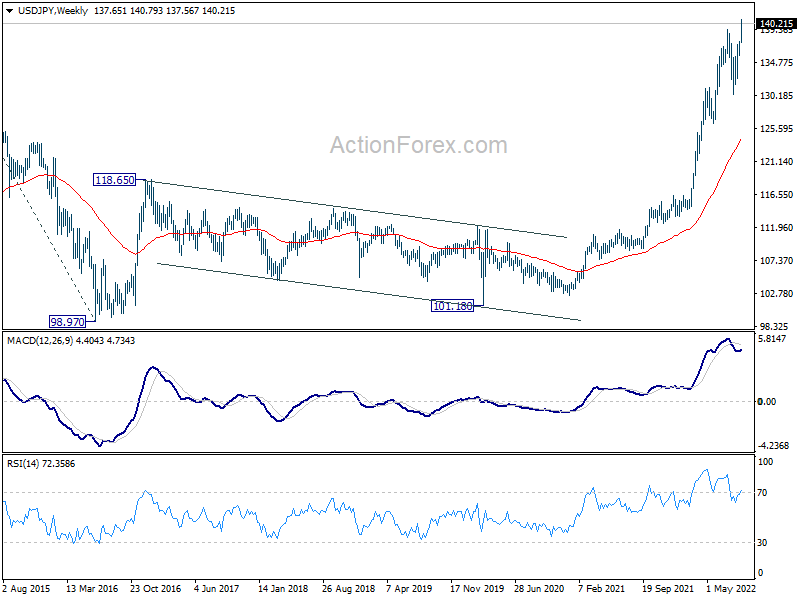
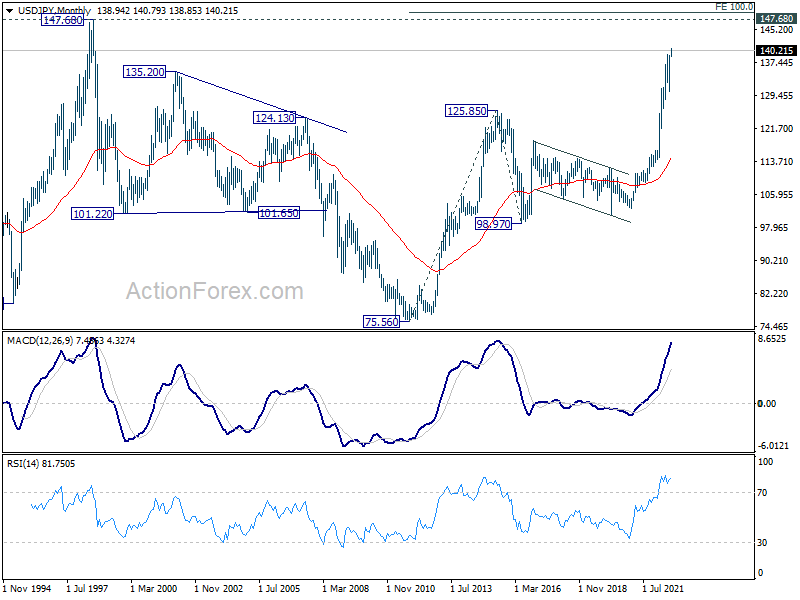
USD/JPY's up trend resumed last week by breaking through 139.37 and hit as high as 140.79. Initial bias stays on the upside this week. Next target is 100% projection of 126.35 to 139.37 from 130.38 at 143.40. Sustained break there could bring upside acceleration of 147.68 long term resistance. On the downside, below 138.04 minor support will turn intraday bias neutral and bring consolidations first, before staging another rally.
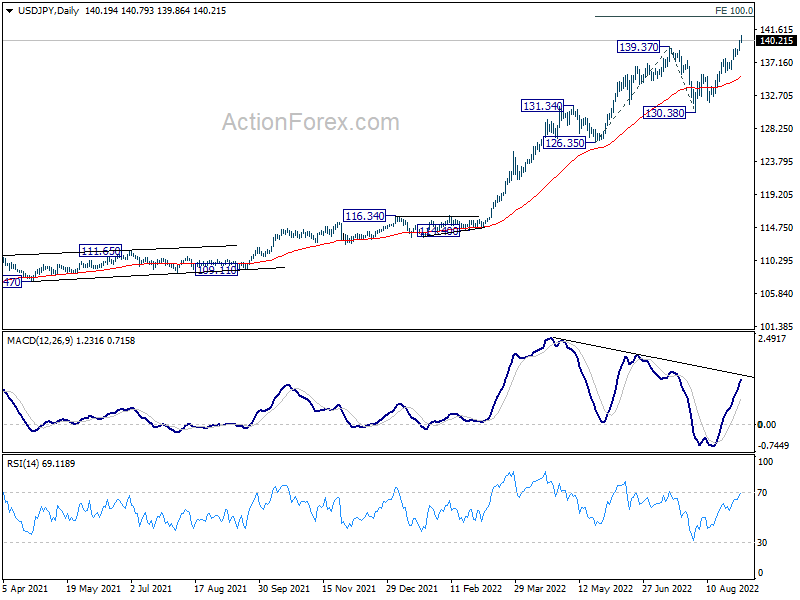
In the bigger picture, up trend from 101.18 is still in progress, as part of the whole up trend from 75.56 (2011 low). Further rise should be seen to 147.68 (1998 high). For now, break of 130.38 support is needed to be the first indication of medium term topping. Otherwise, outlook will stay bullish even in case of deep pull back.
In the long term picture, rise from 101.18 is seen as part of the up trend from 75.56 (2011 low). Further rally is expected to 100% projection of 75.56 (2011 low) to 125.85 (2015 high) from 98.97 at 149.26, which is slightly above 147.68 (1998 high). This will remain the favored case as long as 55 week EMA (now at 124.31) holds.
EUR/USD Weekly Outlook
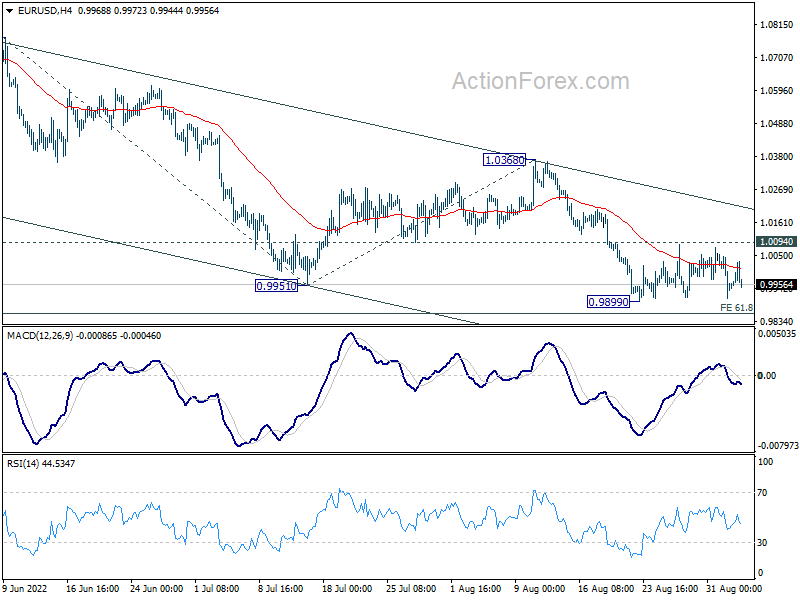
EUR/USD extended the consolidation from 0.9899 last week and outlook is unchanged. Initial bias stays neutral this week first. On the downside, break of 0.9899 will resume larger down trend to 61.8% projection of 1.0773 to 0.9951 from 1.0368 at 0.9860. Firm break there should prompt downside acceleration to 100% projection at 0.9546. However, firm break of 1.0094 minor resistance will dampen this bearish view, and turn bias back to the upside for 1.0368 resistance instead.
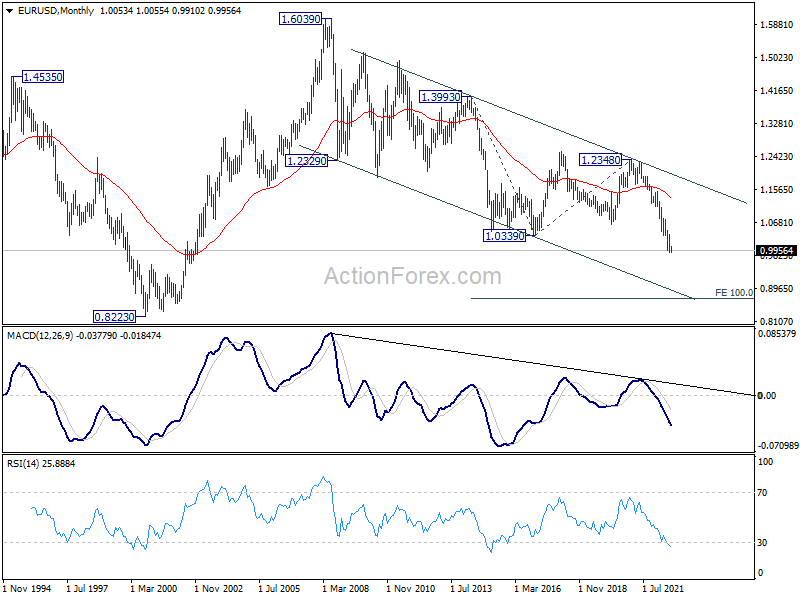
In the bigger picture, down trend from 1.6039 (2008 high) is still in progress. Next target is 100% projection of 1.3993 to 1.0339 from 1.2348 at 0.8694. In any case, outlook will stay bearish as long as 1.0368 resistance holds, in case of strong rebound.
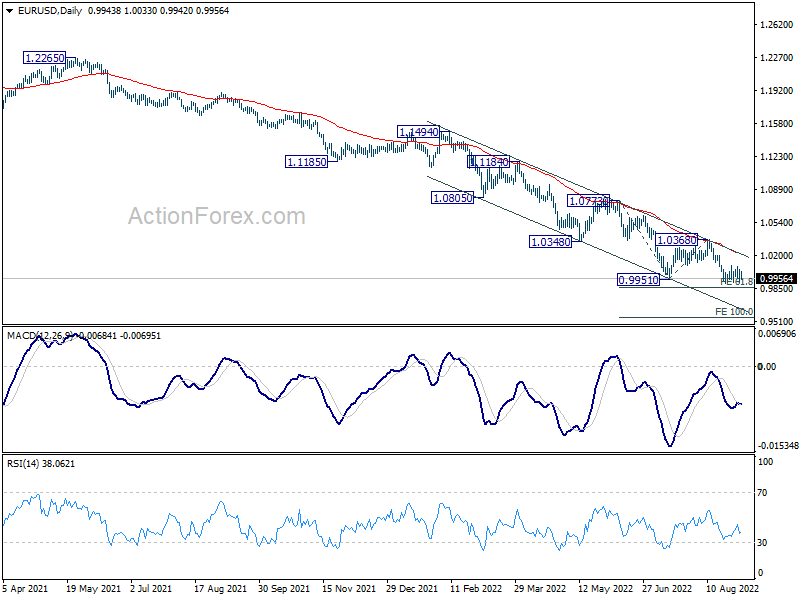
In the long term picture, long term down trend from 1.6039 (2008 high) is extending. Next target is 100% projection of 1.3993 to 1.0339 from 1.2348 at 0.8694. This will now remain the favored case as long as 1.0635 support turned resistance holds.
USD/JPY Weekly Outlook
USD/JPY's up trend resumed last week by breaking through 139.37 and hit as high as 140.79. Initial bias stays on the upside this week. Next target is 100% projection of 126.35 to 139.37 from 130.38 at 143.40. Sustained break there could bring upside acceleration of 147.68 long term resistance. On the downside, below 138.04 minor support will turn intraday bias neutral and bring consolidations first, before staging another rally.
In the bigger picture, up trend from 101.18 is still in progress, as part of the whole up trend from 75.56 (2011 low). Further rise should be seen to 147.68 (1998 high). For now, break of 130.38 support is needed to be the first indication of medium term topping. Otherwise, outlook will stay bullish even in case of deep pull back.
In the long term picture, rise from 101.18 is seen as part of the up trend from 75.56 (2011 low). Further rally is expected to 100% projection of 75.56 (2011 low) to 125.85 (2015 high) from 98.97 at 149.26, which is slightly above 147.68 (1998 high). This will remain the favored case as long as 55 week EMA (now at 124.31) holds.
GBP/USD Weekly Outlook
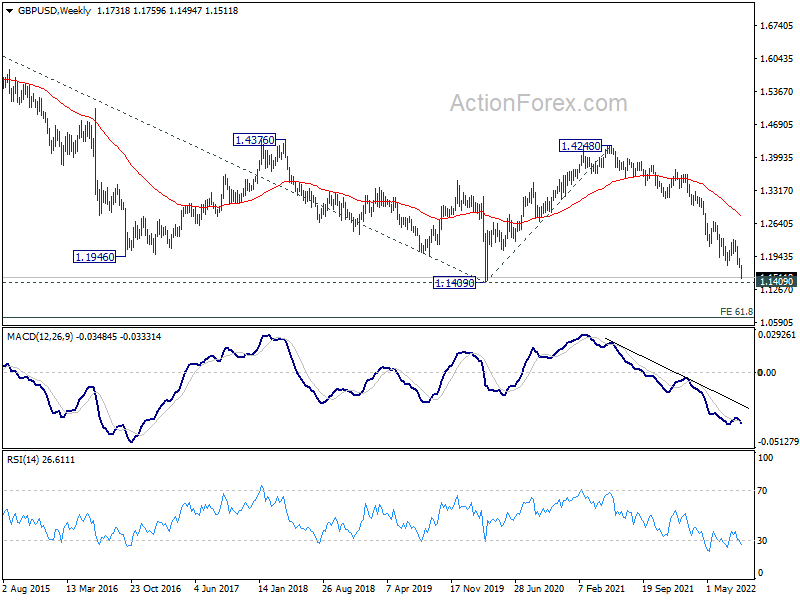
GBP/USD's down trend continued last week and hit as low as 1.1494. Initial bias stays on the downside this week for 1.1409 long term support. Firm break there will pave the way to 61.8% projection of 1.3748 to 1.1759 from 1.2292 at 1.1063 next. On the upside, above 1.1759 minor resistance will turn intraday bias neutral first. But outlook will stay bearish as long as 1.2292 resistance holds, in case of recovery.
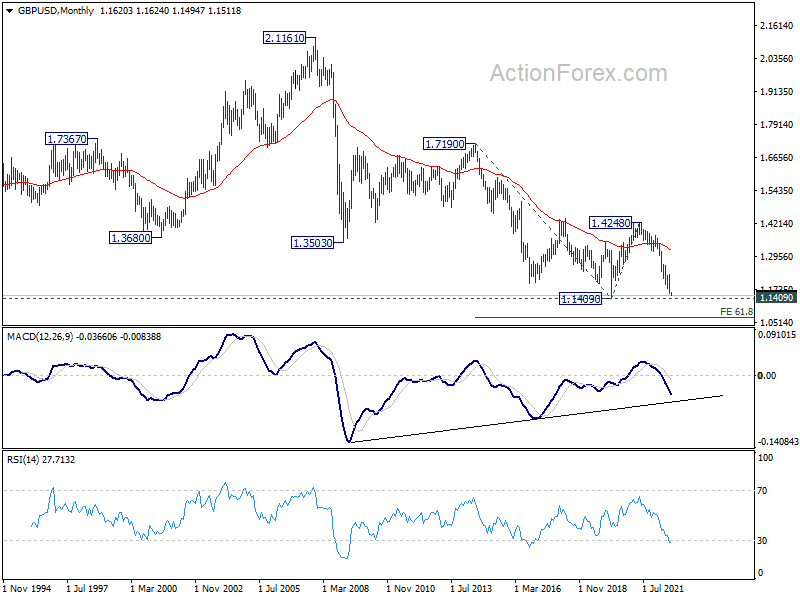
In the bigger picture, based on current momentum, fall from 1.4248 (2018 high) is probably resuming long term down trend from 2.1161 (2007 high). Sustained break of 1.1409 will target 61.8% projection of 1.7190 (2014 high) to 1.1409 (2020 low) from 1.4248 (2021 high) at 1.0675. This will remain the favored case for now as long as 1.2292 resistance holds.
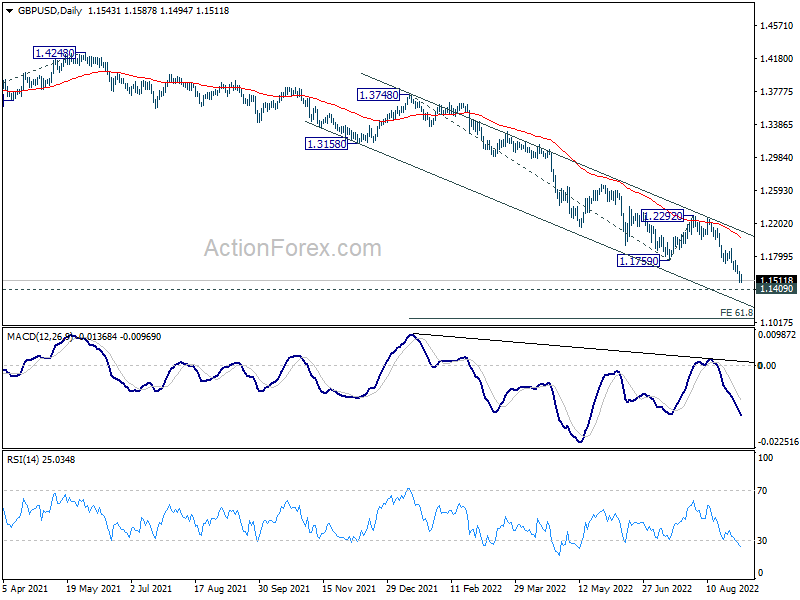
In the longer term picture, long term down trend from 2.1161 (2007) high is still in progress. Firm break of 1.1409 will target 61.8% projection of 1.7190 (2014 high) to 1.1409 (2020 low) from 1.4248 (2021 high) at 1.0675.
USD/CHF Weekly Outlook
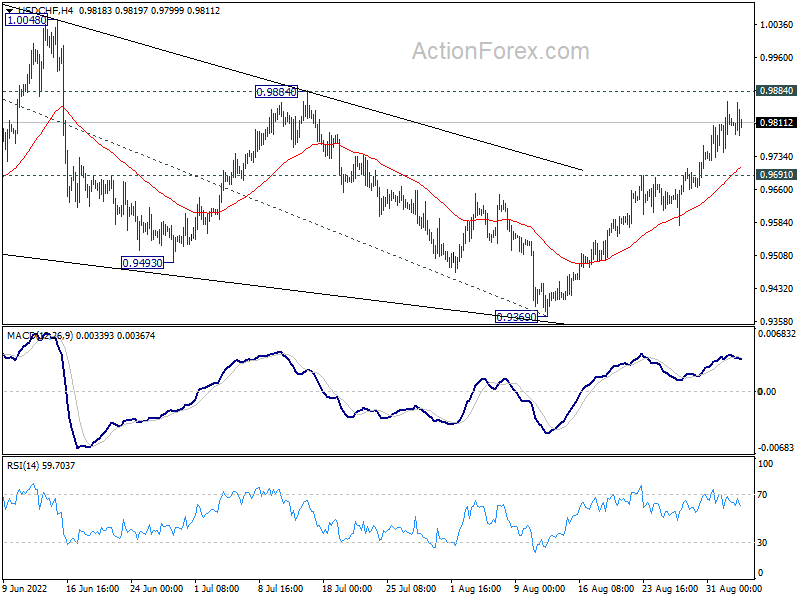
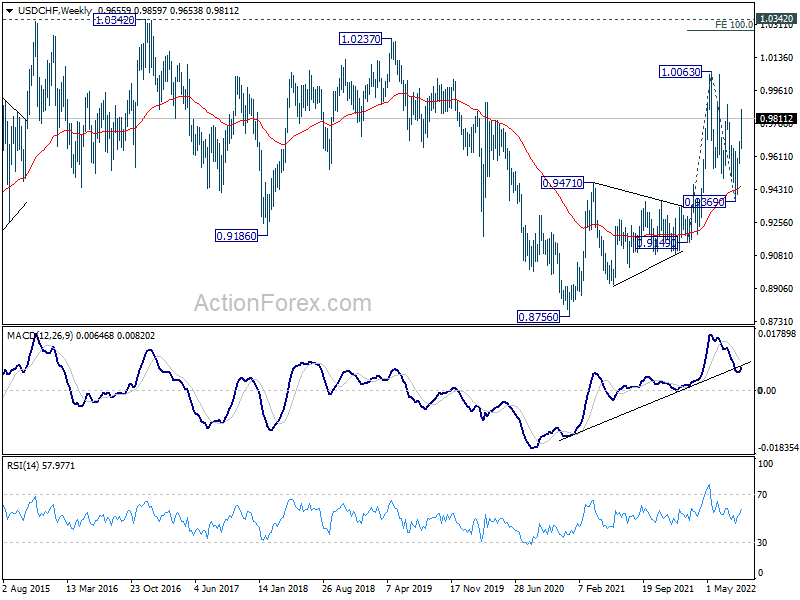
USD/CHF's rebound from 0.9369 continued last week and outlook is unchanged. Triangle correction from 1.0063 could have completed at 0.9369 already. Break of 0.9884 resistance will argue that larger up trend is ready to resume through 1.0063 high. On the downside, break of 0.9691 minor support will mix up the outlook and turn intraday bias neutral first.
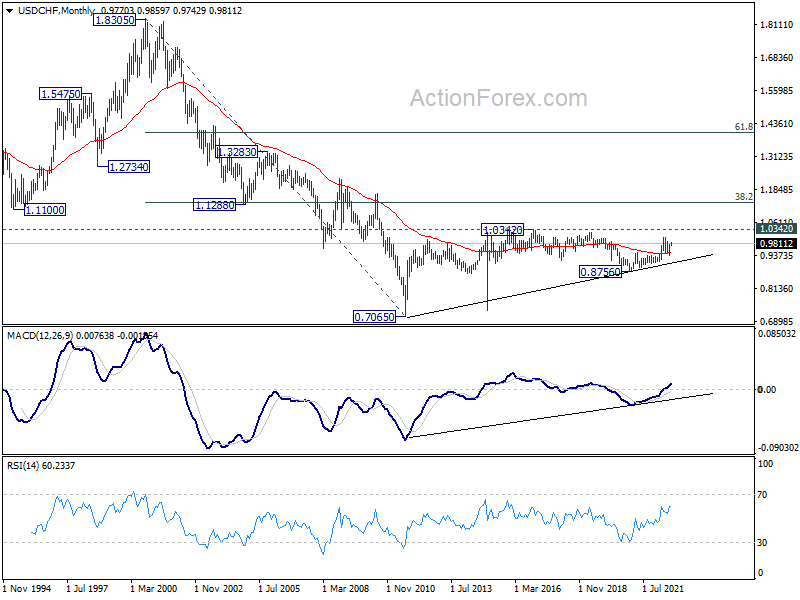
In the bigger picture, current development suggests that up trend from 0.8756 (2021 low) is still in progress. Sustained break of 1.0063 will target 100% projection of 0.9149 to 1.0063 from 0.9369 at 1.0283, and then 1.0342 (2016 high). For now, this will remain the favored case as long as 0.9369 support holds, even in case of deep pull back.
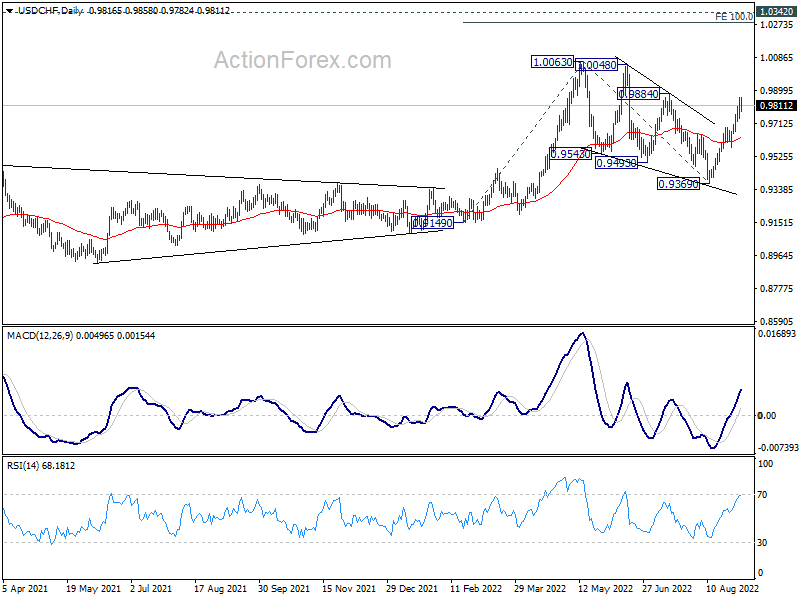
In the long term picture, outlook is mixed with deeper than expected fall from 1.0063, but some support is seen from 55 week EMA (now at 0.9433). Overall, though, USD/CHF is seen as in sideway pattern from 1.0342 (2016 high). Range trading should continue until further development.
AUD/USD Weekly Outlook
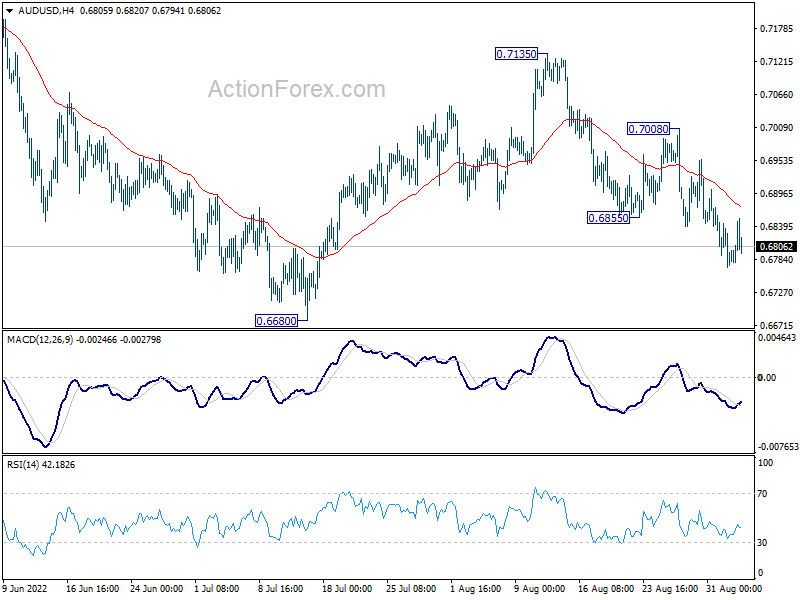
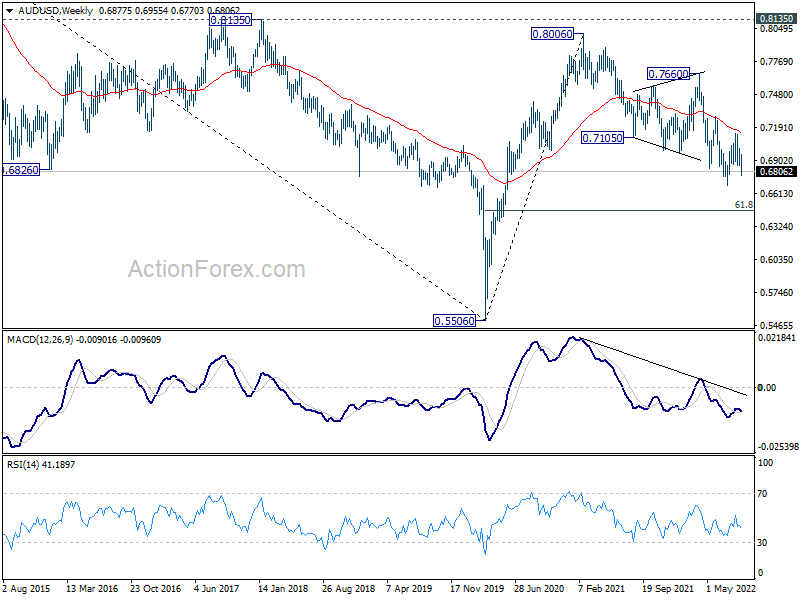
AUD/USD's decline from 0.7135 resumed last week and outlook is unchanged. Corrective rebound from 0.6680 could have completed with three waves up to 0.7135. Retest of 0.6680 should be seen next. Firm break there will resume larger down trend. However, break of 0.7008 will turn bias back to the upside for 0.7135 resistance instead.
In the bigger picture, price actions from 0.8006 (2021 high) is seen more as a corrective pattern to rise from 0.5506 (2020 low). Or it could also be a bearish impulsive move. In either case, outlook will remain bearish as long as 0.7282 resistance holds. Next target is 61.8% retracement of 0.5506 to 0.8006 at 0.6461.
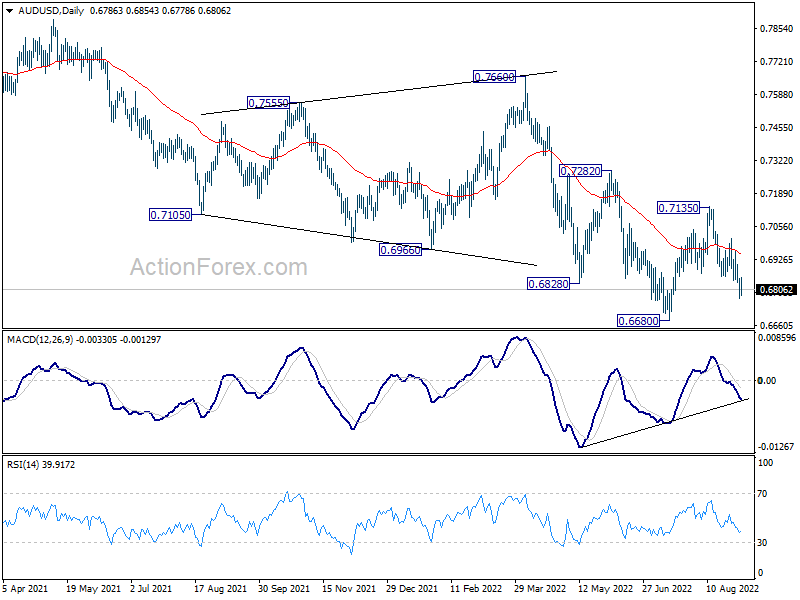
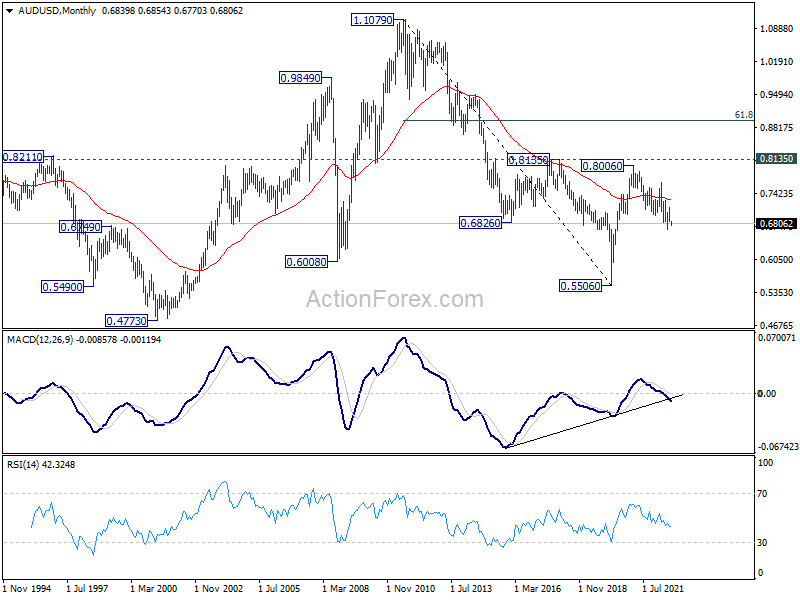
In the long term picture, rejection by 0.8135 resistance suggests that the long term down trend from 1.1079 (2011 high) is not ready to reverse. Yet, the structure of the fall from 0.8006 still argues that it's a corrective move. Hence, break of 0.5506 low is not envisaged for now. The long term outlook stays neutral first, and will be reassessed later after the fall from 0.8006 completes.
USD/CAD Weekly Outlook
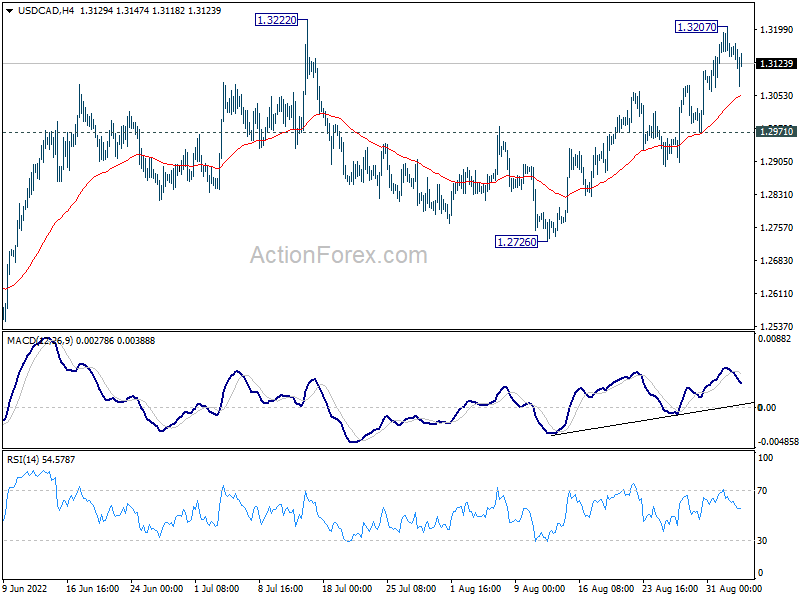
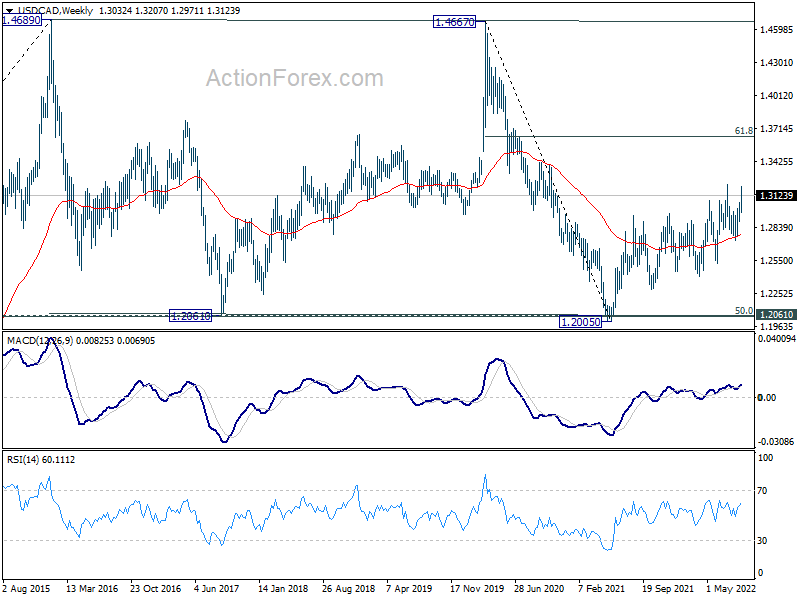
USD/CAD's rise form 1.2726 extended to as high as 1.3207 last week, but retreated ahead of 1.3222 resistance. Initial bias is neutral this week first. Further rise is expected as long as 1.2971 support holds. Decisive break of 1.3222 will resume larger up trend from 1.2005. Next target is 100% projection of 1.2005 to 1.2947 from 1.2401 at 1.3343.
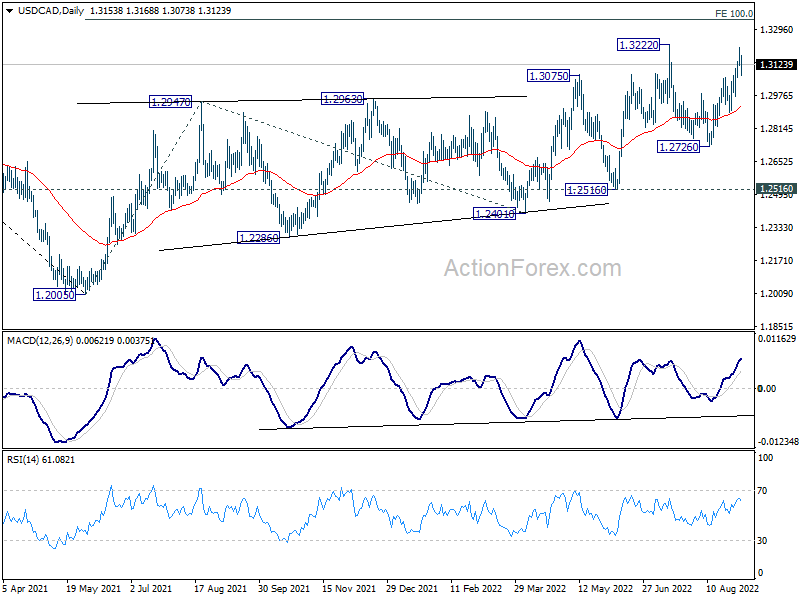
In the bigger picture, down trend from 1.4667 (2020 high) should have completed at 1.2005, after defending 1.2061 long term cluster support. Rise from there should target 61.8% retracement of 1.4667 to 1.2005 (2021 low) at 1.3650. This will remain the favored case now as long as 1.2516 support holds.
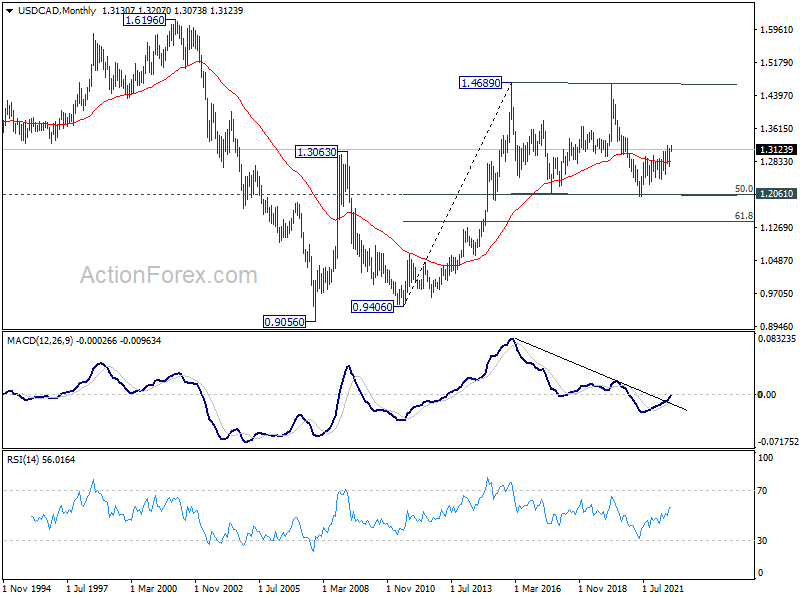
In the longer term picture, price actions from 1.4689 (2016 high) are seen as a consolidation pattern only. That is, up trend from 0.9506 (2007 low) is still expected to resume at a later stage. This will remain the favored case as long as 1.2061 support holds, which is close to 50% retracement of 0.9406 to 1.4689 at 1.2048.
EUR/JPY Weekly Outlook
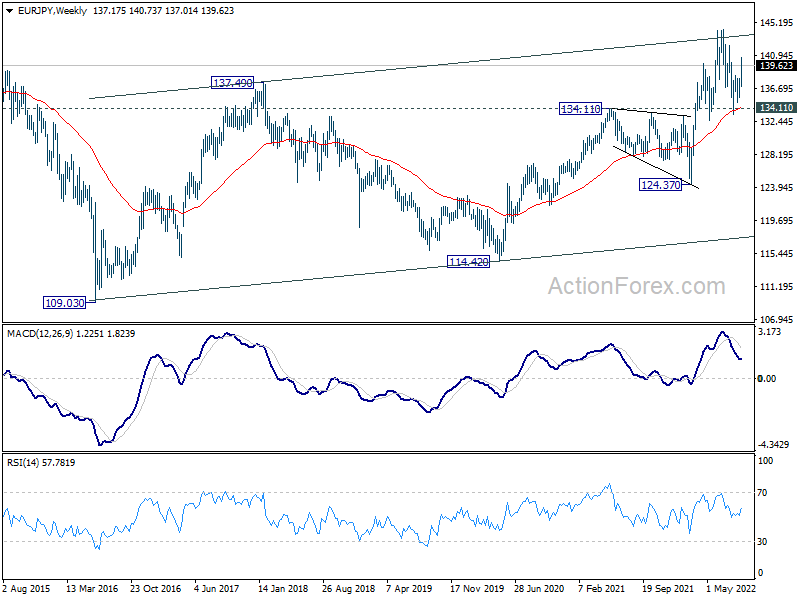
EUR/JPY's rebound from 133.38 resumed last week and matched 100% projection of 133.38 to 138.38 from 135.50 at 140.50 already. Further rise in favor this week as long as 138.34 minor support holds. Firm break of 140.50 will target 144.26 high next. On the downside, break of 138.24 will turn bias back to the downside for 135.50 support instead.
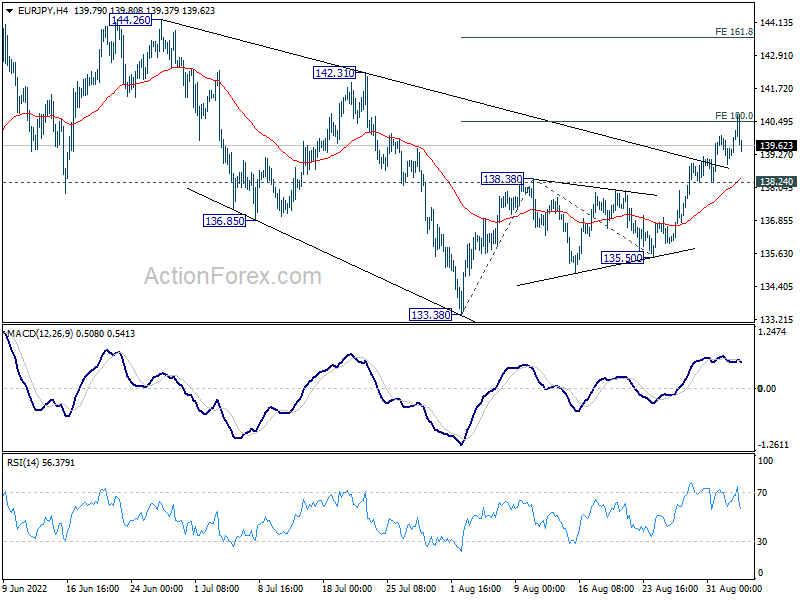
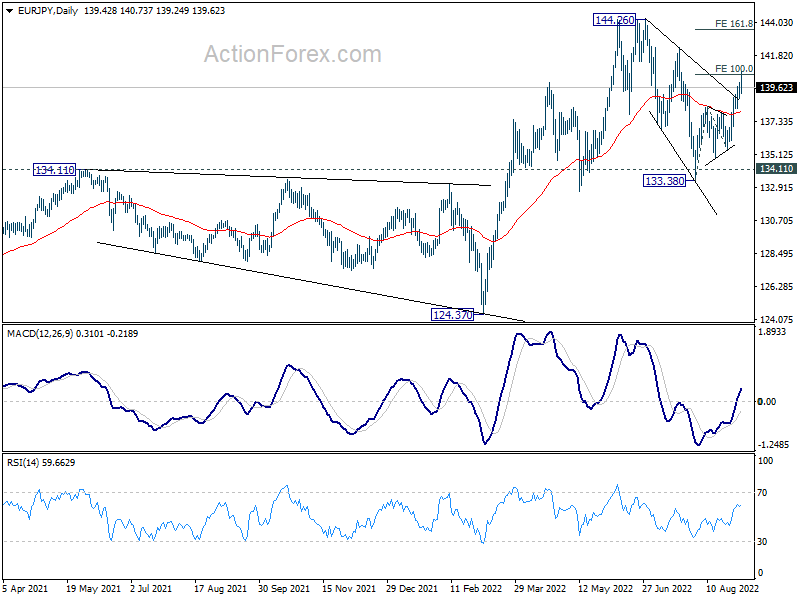
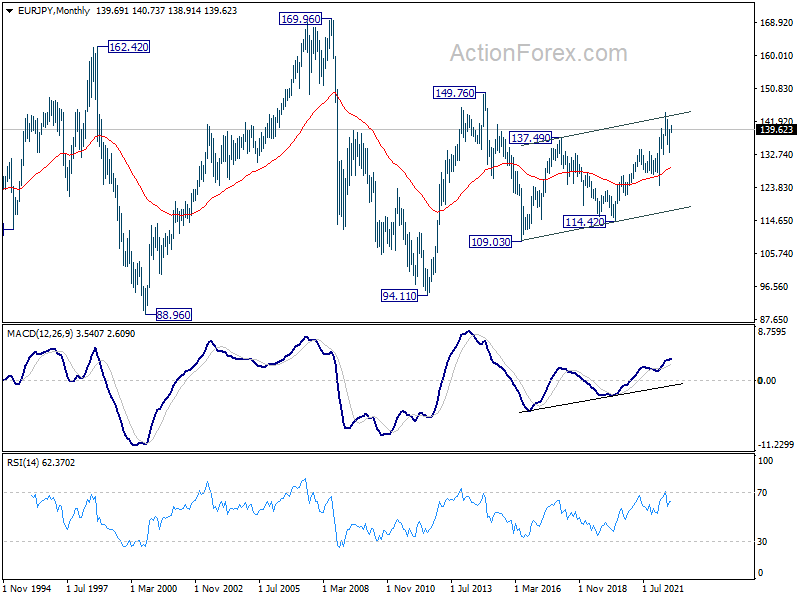
In the bigger picture, up trend from 114.42 (2020 low) is seen as the third leg of the pattern from 109.30 (2016 low). Further rally is in favor as long as 134.11 resistance turned support holds, even in case of deep pull back. Next target is 149.76 (2015 high). However, sustained break of 134.11 will be a sign of medium term bearish reversal and turn focus to 124.37 support for confirmation.
In the long term picture, up trend from 94.11 (2012 low) is seen as in the third leg. Further rally would be seen to 149.76 resistance (2014 high) and above. This will remain the favored case as long as 55 month EMA (now at 129.33) holds.
EUR/GBP Weekly Outlook
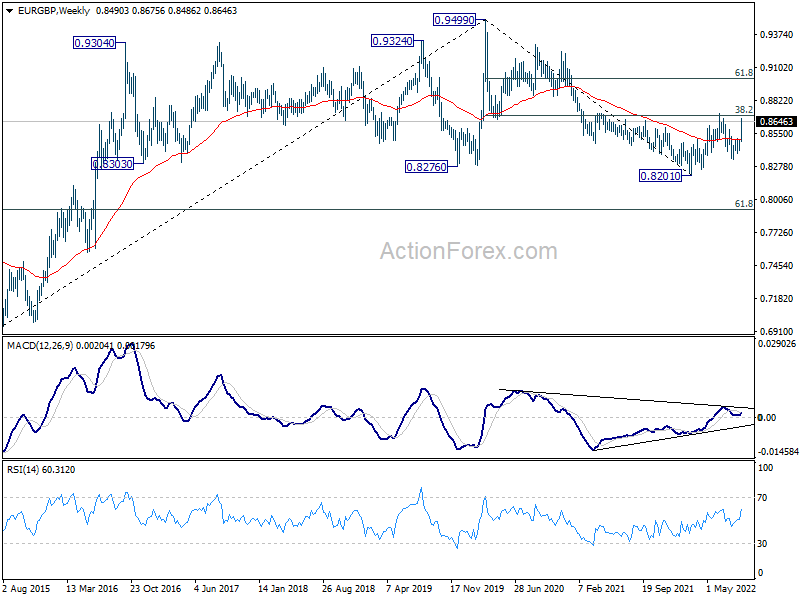
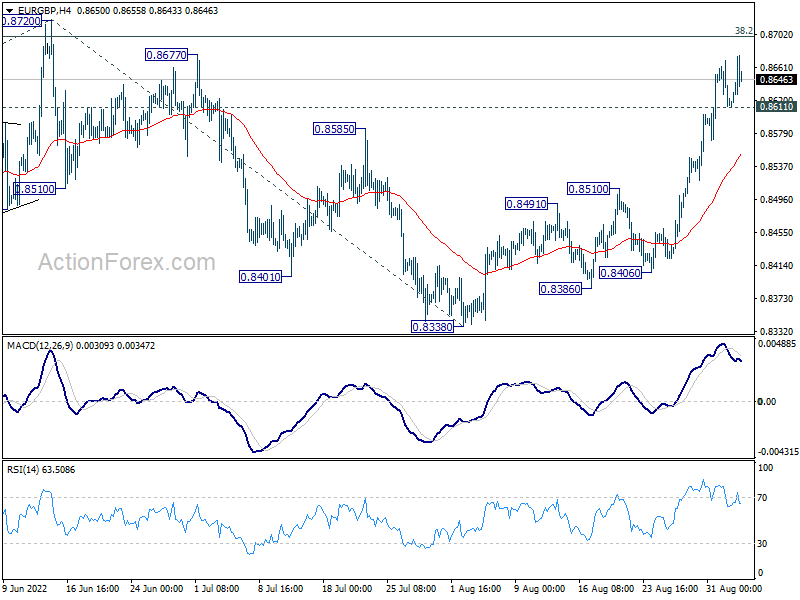
EUR/GBP's rebound from 0.8338 resumed last week and accelerated to as high as 0.8675. Initial bias is mildly on the upside this week for 0.8720 resistance. Decisive break there will carry larger bullish implications. Next target is 100% projection of 0.8201 to 0.8720 from 0.8338 at 0.8857. On the downside, break of 0.8611 minor support will turn intraday bias neutral again first.
In the bigger picture, focus is back on 38.2% retracement of 0.9499 to 0.8201 at 0.8697. Sustained break there will argue that rise from 0.8201 is a medium term up trend, rather than a correction. Next target is 61.8% retracement at 0.9003. Rejection by 0.8697 again will maintain medium term bearishness, for extending the down trend from 0.9499 (2020 high) at a later stage.
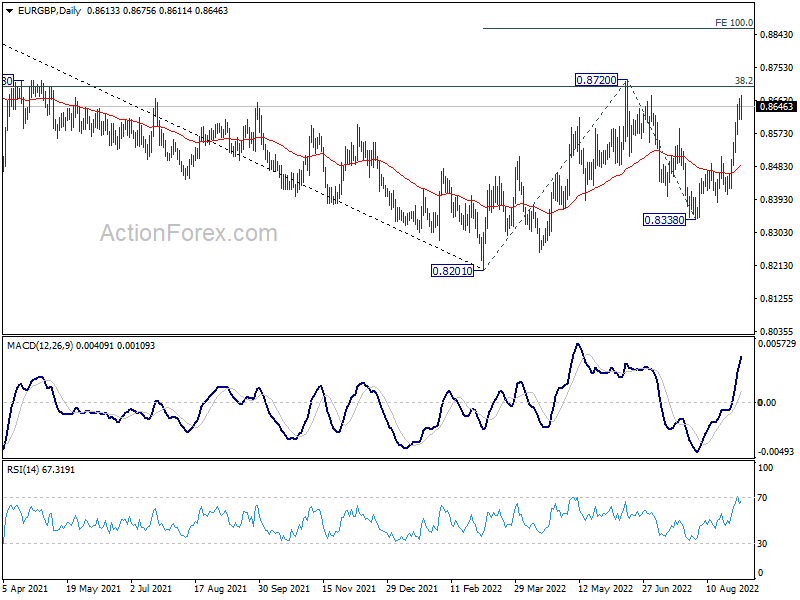
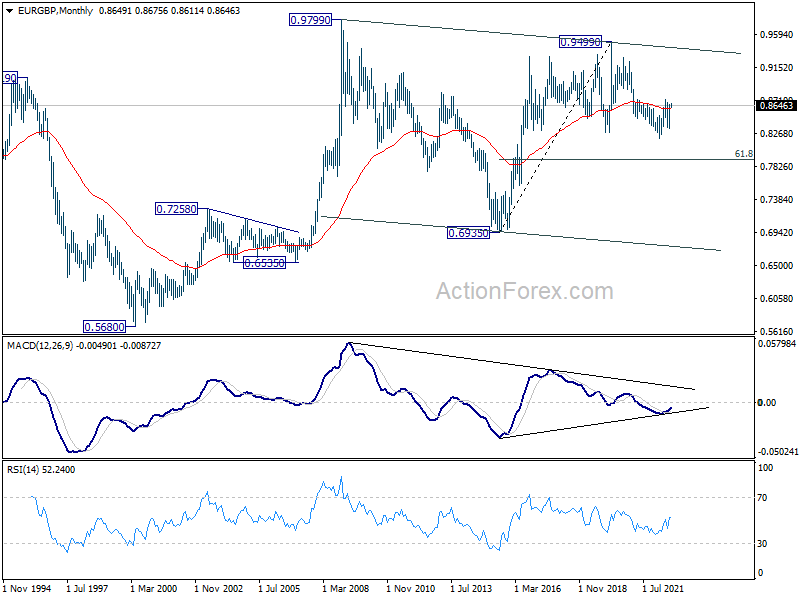
In the long term picture, the lack of medium term downside momentum suggests that fall from 0.9499 (2020 high) is merely a correction to rise from 0.6935 (2015 high). In case of another fall, downside should be contained by 61.8% retracement of 0.6935 to 0.9499 at 0.7917 to bring rebound. Sustained trading above 55 month EMA (now at 0.8601) will indicate that the correction has completed and bring retest of 0.9499.