Sample Category Title
Dollar Struggles to Gain after NFP, Euro Buying Returns
Dollar is extending recent up trend against Yen after non-farm payroll report, but struggles to gain against others so far. Instead, Euro shines again on news that Russia looks set to resume gas supplies to Europe through Nord Stream 1. The common currency is retaining its number one place for the week so far, followed by Dollar. Yen is the worst, followed by Swiss Franc and Sterling. But, there are still a few hours to go before weekly close.
In Europe, at the time of writing, FTSE is up 1.20%. DAX is up 2.08%. CAC is up 1.29%. Germany 10-year yield is up 0.19 at 1.581. Earlier in Asia, Nikkei dropped -0.04%. Hong Kong HSI dropped -0.74%. China Shanghai SSE rose 0.05%. Singapore Strait Times dropped -0.57%. Japan 10-year JGB yield rose 0.0023 to 0.243.
US NFP grew 315k in Aug, unemployment rate rose 0.2% to 3.7%
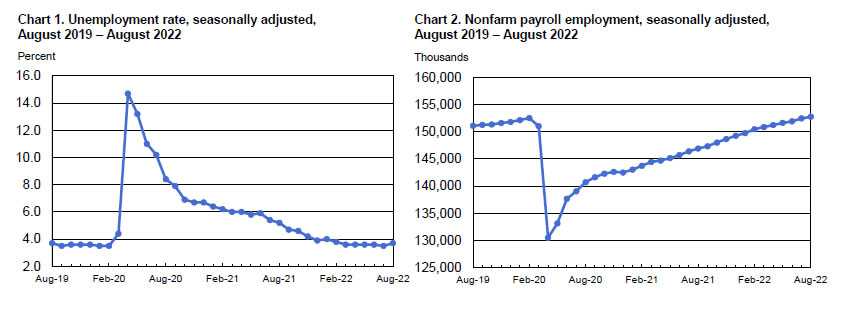
US non-farm payroll employment grew 315k in August, slightly above expectation of 300k. Total employment was 240k above the pre-pandemic level.
Unemployment rose 0.2% to 3.7%, above expectation of 3.5%. Number of unemployed persons increased 344k to 6m. Labor force participation rate rose 0.3% to 62.4%, but remained -1.0% below its pre-pandemic level.
Average hourly earnings rose 0.3% mom, 5.2% yoy, matched expectations.
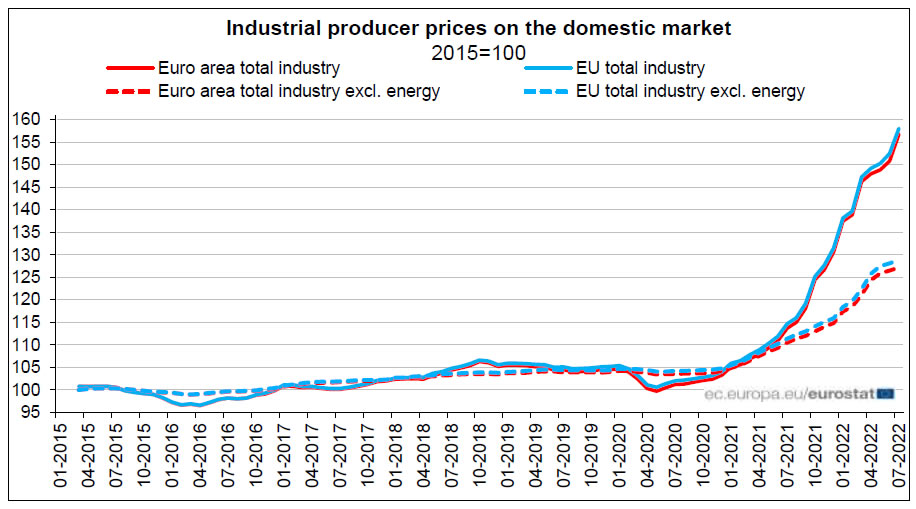
Eurozone PPI up 4.0% mom, 37.9% yoy in Jul
Eurozone PPI rose 4.0% mom in July, up from June's 1.3% mom, above expectation of 2.5% mom. For the year, PPI rose 37.9% yoy, accelerated from 36.0% yoy, well above expectation of 35.8% yoy.
For the month, industrial producer prices increased by 9.0% mom in the energy sector, by 1.2% mom for non-durable consumer goods, by 0.9% mom for durable consumer goods, by 0.8% mom for capital goods and by 0.1% mom for intermediate goods. Prices in total industry excluding energy increased by 0.6% mom.
EU PPI rose 3.7% mom, 37.8% yoy. The highest monthly increases in industrial producer prices were recorded in Ireland (+26.1%), Hungary (+9.4%) and Bulgaria (+8.0%), while the largest decreases were observed in Portugal (-1.5%), Sweden (-1.2%) and Luxembourg (-0.9%).
EUR/USD Mid-Day Outlook
Daily Pivots: (S1) 0.9886; (P) 0.9972; (R1) 1.0033; More...
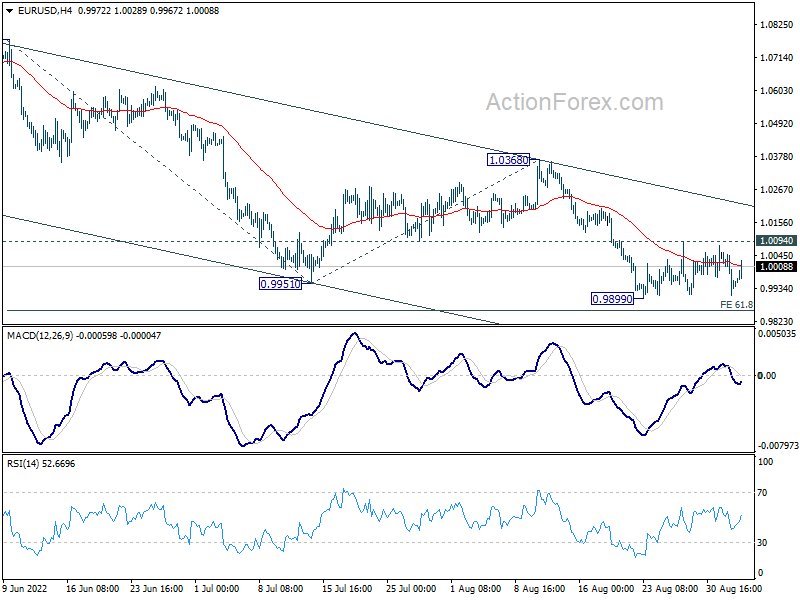
EUR/USD recovered ahead of 0.9899 support and intraday bias stays neutral. Still, further decline is expected with 1.0094 resistance intact. On the downside, break of 0.9899 will resume larger down trend to 61.8% projection of 1.0773 to 0.9951 from 1.0368 at 0.9860. Firm break there should prompt downside acceleration to 100% projection at 0.9546. However, firm break of 1.0094 minor resistance will dampen this bearish view, and turn bias back to the upside for 1.0368 resistance instead.
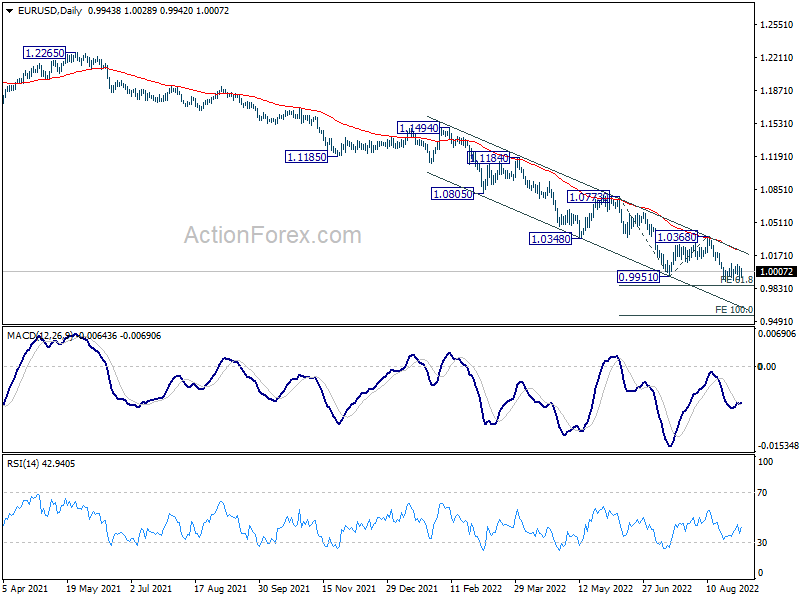
In the bigger picture, down trend from 1.6039 (2008 high) is still in progress. Next target is 100% projection of 1.3993 to 1.0339 from 1.2348 at 0.8694. In any case, outlook will stay bearish as long as 1.0368 resistance holds, in case of strong rebound.
Economic Indicators Update
| GMT | Ccy | Events | Actual | Forecast | Previous | Revised |
|---|---|---|---|---|---|---|
| 22:45 | NZD | Terms of Trade Index Q2 | -2.40% | 0.20% | 0.50% | 0.60% |
| 06:00 | EUR | Germany Trade Balance (EUR) Jul | 5.4B | 4.6B | 6.4B | |
| 09:00 | EUR | Eurozone PPI M/M Jul | 4.00% | 2.50% | 1.10% | 1.30% |
| 09:00 | EUR | Eurozone PPI Y/Y Jul | 37.90% | 35.80% | 35.80% | 36.00% |
| 12:30 | CAD | Labor Productivity Q/Q Q2 | 0.20% | 0.10% | -0.50% | -0.60% |
| 12:30 | USD | Nonfarm Payrolls Aug | 315K | 290K | 528K | 526K |
| 12:30 | USD | Unemployment Rate Aug | 3.70% | 3.50% | 3.50% | |
| 12:30 | USD | Average Hourly Earnings M/M Aug | 0.30% | 0.30% | 0.50% | |
| 14:00 | USD | Factory Orders M/M Jul | 0.20% | 2.00% |
US NFP grew 315k in Aug, unemployment rate rose 0.2% to 3.7%
US non-farm payroll employment grew 315k in August, slightly above expectation of 300k. Total employment was 240k above the pre-pandemic level.
Unemployment rose 0.2% to 3.7%, above expectation of 3.5%. Number of unemployed persons increased 344k to 6m. Labor force participation rate rose 0.3% to 62.4%, but remained -1.0% below its pre-pandemic level.
Average hourly earnings rose 0.3% mom, 5.2% yoy, matched expectations.
Gold Threatens to Fall Down from the Range
The gold price dipped below $1700 on Thursday, approaching the lower boundary of its trading range since May 2020. Gold has been finding buyers after emotional dips towards the lower boundary throughout this period.
Perhaps the main reason for the long-term bearish sentiment is the hawkish US monetary policy. A sharp tightening of policy and the Fed’s promises to raise interest rates have pushed 2-year government bond yields to levels last seen in 2007.
High short-term bond yields push investors away from alternatives such as gold, equities and emerging market currencies, raising the risk-free interest rate level – an informal benchmark for risk assessment.
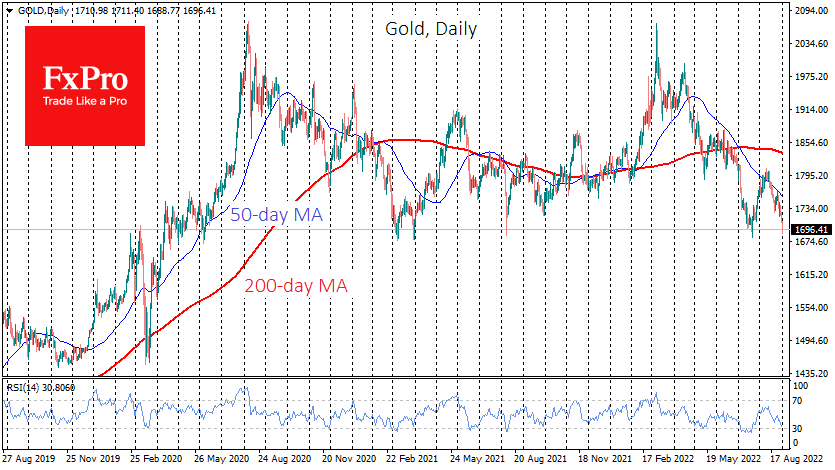
So far, gold has behaved in a frighteningly similar way to the dynamics of 2010-2013, when we saw a comparable bump at the top after a multi-year rally. Now, this period of consolidation after the rally has been longer.
However, we should be prepared for a “dam break” if we see a decisive move down from the established corridor over the next few weeks.
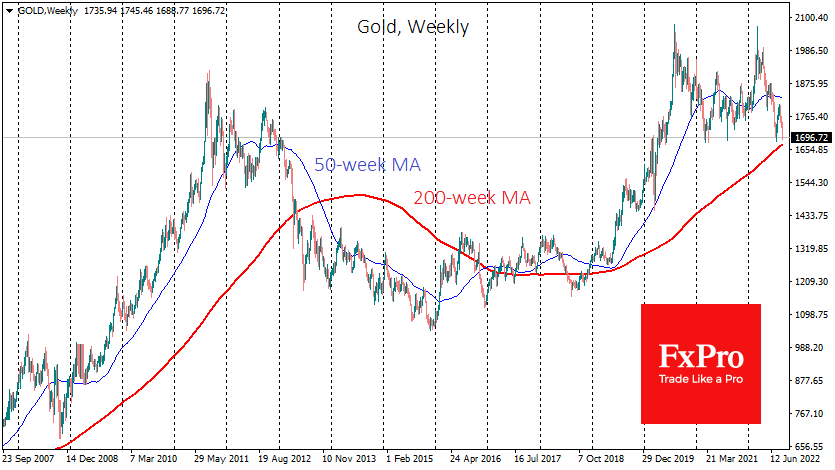
If the price breaks below $1680 this week or next, the market could see an absolute surrender of position traders, who have been betting on another bounce from the lower boundary. In that case, we should be prepared for gold to go into the same multi-year bearish trend as it did in 2012-2015.
Just below, through $1670 passes the 200-week moving average, a fixing under which could trigger the capitulation of the most resilient long-term betting bulls.
In that case, a decline towards $1300 would be a working scenario until the end of 2023. If the gold finds support, as it has done so many times in the past two-plus years, we could see a new upside surge after a two-year consolidation, and the 200-week average retains the long-term support it has enjoyed for the past five years.
Aussie Stabilizes after Slide, NFP Looms
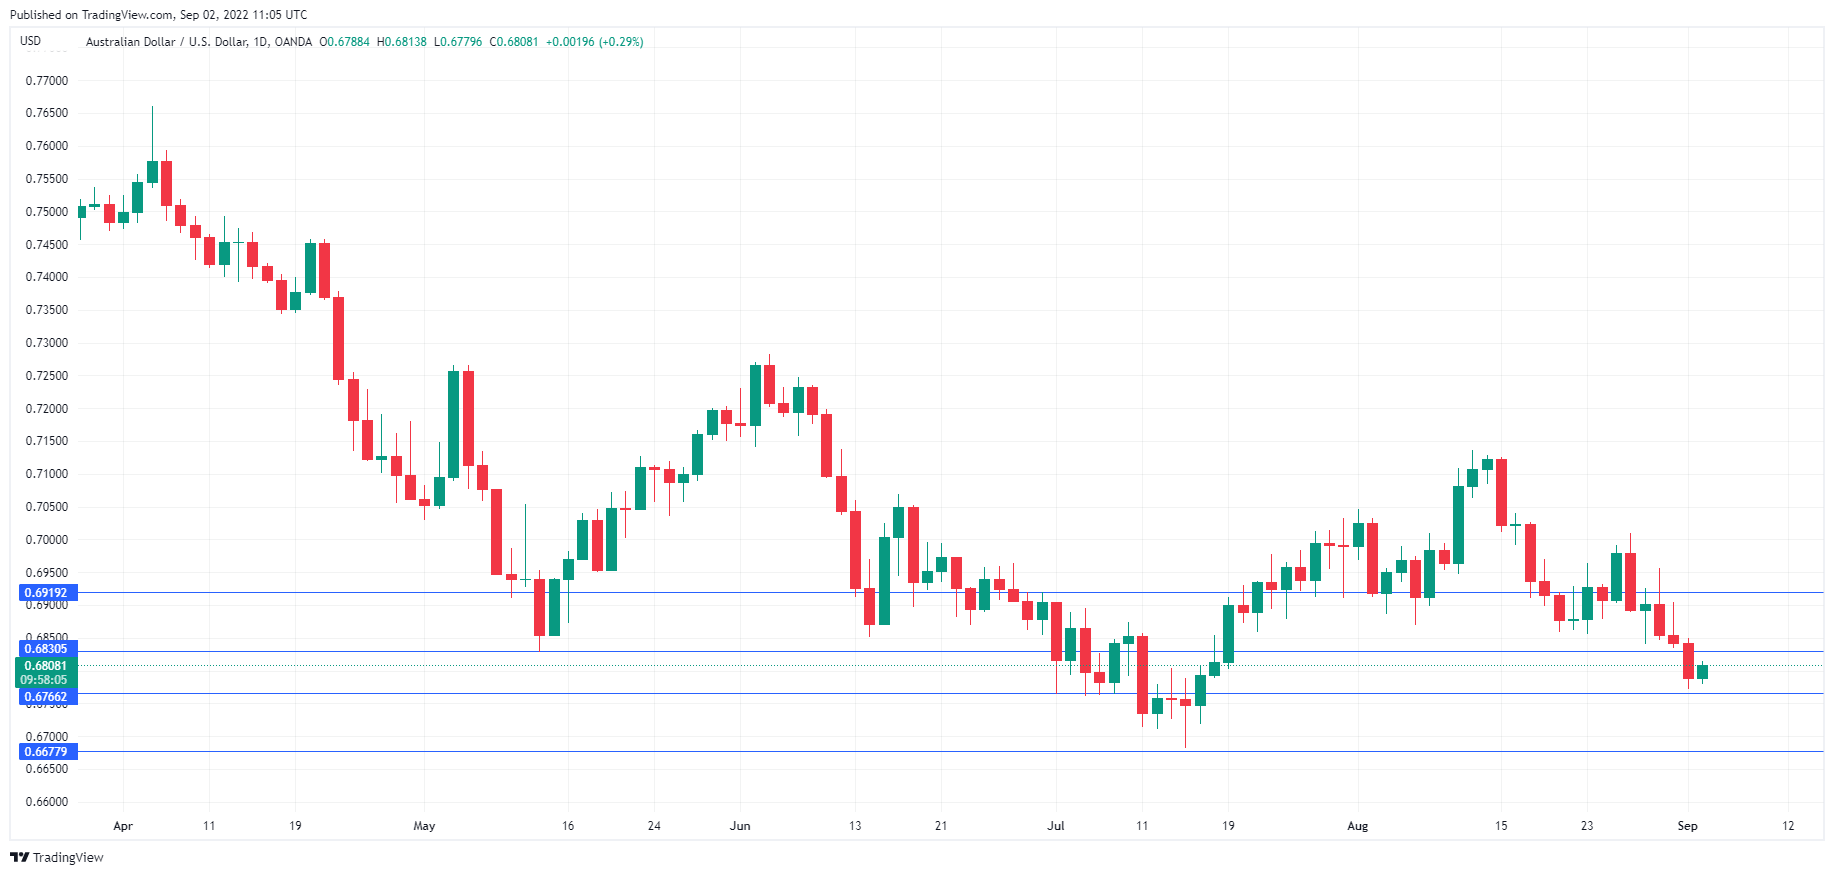
After three straight losing sessions, the Australian dollar is in positive territory today. In the European session, AUD/USD is trading at 0.6802, up 0.21%.
It has been a rough stretch for the Australian dollar, which fell 2.89% in August. On Thursday, AUD/USD fell as low as 0.6771, its lowest level since July 15th. The Australian dollar is sensitive to risk and the black clouds hovering over Europe have sapped risk appetite and are weighing on the Aussie.
Russia shuts Nord Stream 1
The war in Ukraine has raised the price of energy and food imports for Australians and caused high inflation. Headline CPI rose to 6.1% in Q2, the highest level since 1990. The potential energy crisis in Europe has badly strained relations between Western Europe and Russia and dampened risk sentiment. Moscow has shut down the Nord Stream 1 pipeline for three days of maintenance, although Germany has charged that this is a pretense and the pipeline is fully operational. If the gas flow is not renewed on Saturday, we could have a full-blown energy crisis come Monday morning. In addition, The Federal Reserve’s hawkish policy, which finally has been internalized by the markets, has boosted the US dollar, which has made broad gains against the major currencies.
The RBA has its hands full with rising inflation and a slowing economy. Policy makers are hoping to avoid a recession and guide the economy to a soft landing, but the central bank, like the Fed, has made clear that its paramount goal is to curb inflation and avoid inflation expectations from becoming anchored. The RBA meets on September 6th and the markets have priced in a 0.50% hike, which would be the third consecutive 0.50% increase.
All eyes are on the US nonfarm payrolls report, which could result in volatility in the currency markets in the North American session. The markets are expecting a strong gain of 300 thousand, and a reading around this level would indicate that the labour market remains strong. This could push the US dollar higher, as the Fed is relying on a robust labour market to continue with sharp rate increases. However, a weak NFP report could weigh on the US dollar, as it would force the Fed to consider easing policy, which could mean a 0.50% hike in September rather than a 0.75% increase.
AUD/USD Technical
- 0.6830 is a weak resistance line, followed by resistance at 0.6919
- There is support at 0.6766 and 0.6677
How Far Can USD/JPY Go?
The yen has weakened to the lowest level since 1998, with the USDJPY popping above the 140 handle. Through the week, the pair rose 1,9%. In a period of economic uncertainty, usually traders would expect the yen to get stronger on safe-haven flows. Is the yen no longer a safe haven? There's more to the picture. And that could help us understand if there is a correction coming or the trend will continue.
The driving forces
In the short term, the dollar has gotten stronger ahead of NFP data. This is because traders are banking on the employment data to be strong, well above the "normal" 200K rate seen before the pandemic. With fast growth in jobs, the Fed would have free reign to keep hiking, pushing yields even higher.
So, from that we can see a potential source of a correction in the near term: if NFP figures disappoint. After the blow-out figure from last month, investors might be a little overly optimistic about a beat in jobs creation, which means even if the figures come in as expected, it could disappoint the more speculative traders.
The bigger picture
The short term dynamics are an example of the effects of the long-term situation. The major deviation between the two premier safe haven currencies is, broadly speaking, a difference in monetary policy. The US is facing high inflation, prompting the Fed to raise rates. Japan has relatively low inflation (even though it has poked above target recently), and rates have remained negative.
With the Fed pursuing an aggressive hiking policy, the yield spread has widened, making it attractive for carry trading against the yen. The potential for a reversal is that Japan starts experiencing inflation and forces the BOJ to start easing. The weaker yen translates into higher import prices, which in turn implies inflationary pressures. However, the global slowdown could also be translating into lower retail sales in Japan, which in turn minimizes the inflationary pressure. As a result, the BOJ can remain apart from the other central banks desperately fighting inflation, and instead work on promoting economic growth.
It's all about the expectations
A lingering question might be: Sure, the Fed is raising rates, but inflation is much higher than interest. Doesn't that mean a real negative rate?
Yes, it does. However, the inflation that we're seeing now is in the past. It's comparing prices now to prices a year ago. What matters for investors is how much inflation is expected over the next period. Fed tightening implies that inflation should get under control, meaning that holders of US bonds will get the benefit of higher interest rates and lower inflation. Meaning that forward yield expectations are still positive - or, at least, better than what traders might expect to get from yen bonds.
While the BOJ is on an accommodative track, inflation would have to increase substantially before rates rise. Meaning there is more inflationary risk in a Japan that isn't actively fighting inflation, than in a US that is actively trying to get prices down. It isn't that the yen isn't a safe haven, it's that the US has moved more into offering a better rate of return on fixed income.
EUR/USD: Bears Likely to Resume after Consolidation, US NFP Data Eyed for Fresh Direction Signal
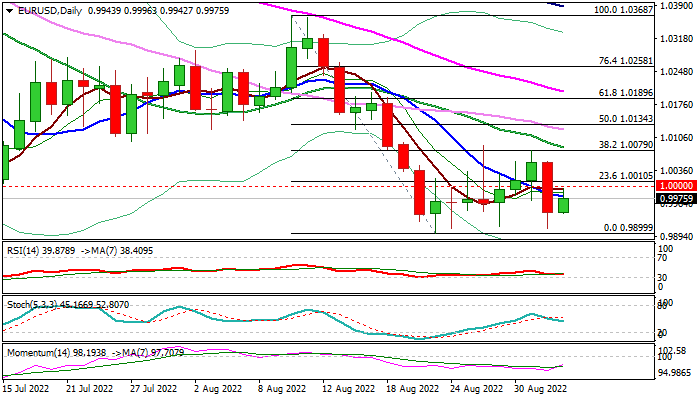
Near-term action remains directionless after larger bears faced strong headwinds at 0.9900 zone, where a temporary base has formed, but rebounds above parity were so far short-lived, keeping sideways mode and waiting for stronger signals.
Overall picture remains bearish, suggesting that larger bears are likely to resume after extended consolidation, with sustained break below 0.9900 base to spark fresh acceleration lower and expose next target at 0.9800 (Nov 2002 low).
Repeated weekly close below parity would add to bearish signals.
Quiet trading in Friday morning signal that traders await results from US labor report for August, which could spark significant market reaction, in case of surprise in either direction.
Res: 1.0000; 1.0050; 1.0079; 1.0134
Sup: 0.9952; 0.9900; 0.9853; 0.9793
Eurozone PPI up 4.0% mom, 37.9% yoy in Jul
Eurozone PPI rose 4.0% mom in July, up from June's 1.3% mom, above expectation of 2.5% mom. For the year, PPI rose 37.9% yoy, accelerated from 36.0% yoy, well above expectation of 35.8% yoy.
For the month, industrial producer prices increased by 9.0% mom in the energy sector, by 1.2% mom for non-durable consumer goods, by 0.9% mom for durable consumer goods, by 0.8% mom for capital goods and by 0.1% mom for intermediate goods. Prices in total industry excluding energy increased by 0.6% mom.
EU PPI rose 3.7% mom, 37.8% yoy. The highest monthly increases in industrial producer prices were recorded in Ireland (+26.1%), Hungary (+9.4%) and Bulgaria (+8.0%), while the largest decreases were observed in Portugal (-1.5%), Sweden (-1.2%) and Luxembourg (-0.9%).
GBP/USD: Bears Taking a Breather ahead of Attack at 2020 Low
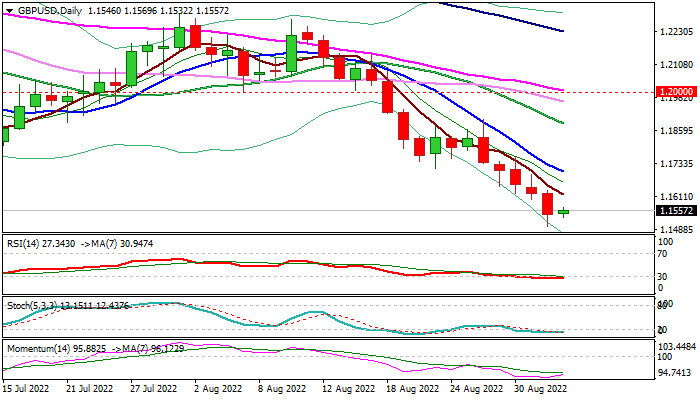
Cable is consolidating above new multi-month low, posted on Thursday after a brief probe below 1.15 handle, following an uninterrupted bear-run in past five days.
The pair is also on track for the third consecutive weekly loss, with risk aversion and strong dollar, keeping the pound in strong defensive mode.
Consolidation or brief bounce on oversold daily studies and fading bearish momentum could be expected in the near-term, with upticks to stay below falling 10DMA (1.1703) and keep bears intact for final push towards key support at 1.1410 (2020 low).
Res: 1.1569; 1.1634; 1.1703; 1.1760.
Sup: 1.1498; 1.1430; 1.1410; 1.1352.
Bitcoin Chained to $20K, and That’s Good
Market picture
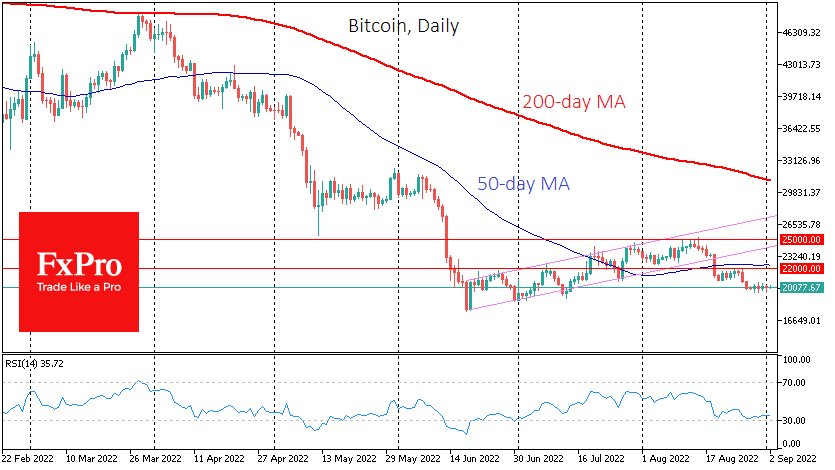
Bitcoin remains firmly anchored to the psychologically significant $20K round level, changing by only fractions of a per cent for almost a week. Ethereum continues to draw green candles, but this is more than nominal growth, also within fractions of a per cent, while the price is still hovering around $1580. Of the top altcoins, Polygon stands out, adding 5% in a day and 8.3% in seven days. The others are down over the last seven days.
Total crypto market capitalisation, according to CoinMarketCap, added 0.9% overnight to $984bn.
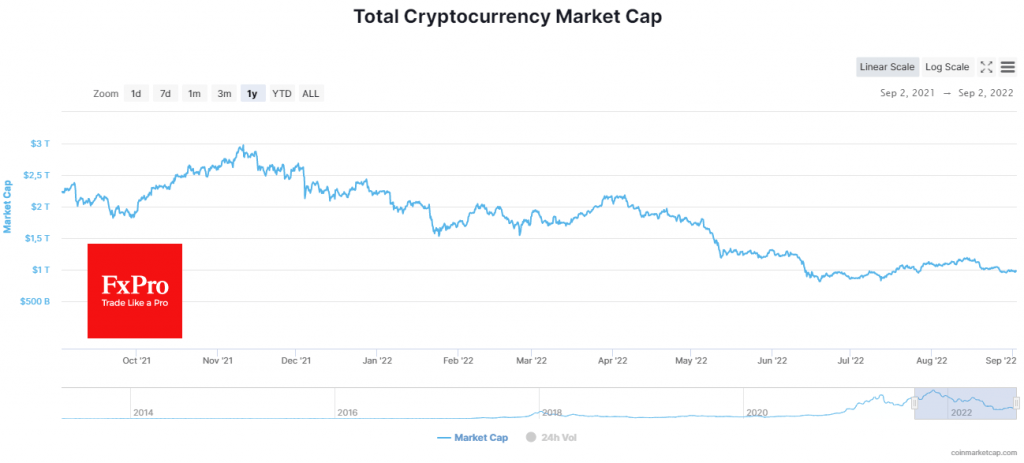
Despite recent stock indices’ notable drop, BTC has been hovering near the circular $20,000 level for almost a week. The last time there was such a prolonged lull was in June 2020, when it stretched out for almost a month. Current trends indicate that bitcoin is a leading indicator for the stocks rather than following them. If this connection persists, the resilience of the most crowded with institutions, BTC and ETH, indicates that risk appetite continues, which gives an encouraging signal for the stock market.
News background
According to Bank of America, Crypto investors are switching to Stablecoin as they wait for the market crisis to continue.
The Attorney General of Washington has filed a lawsuit against Michael Saylor and the MicroStrategy company he used to run for $25 million in tax evasion.
Dogecoin co-founder Billy Marcus ridiculed former Microstrategy CEO Michael Saylor for being overly enthusiastic about the first cryptocurrency. Saylor called bitcoin “a miracle happening right before people’s eyes”.
Finally, South Korean tech giant LG Electronics is preparing to launch a cryptocurrency wallet, Wallypto, based on the Hedera Hashgraph network in the third quarter of 2022.
Nasdaq 100 Grinds Critical Support
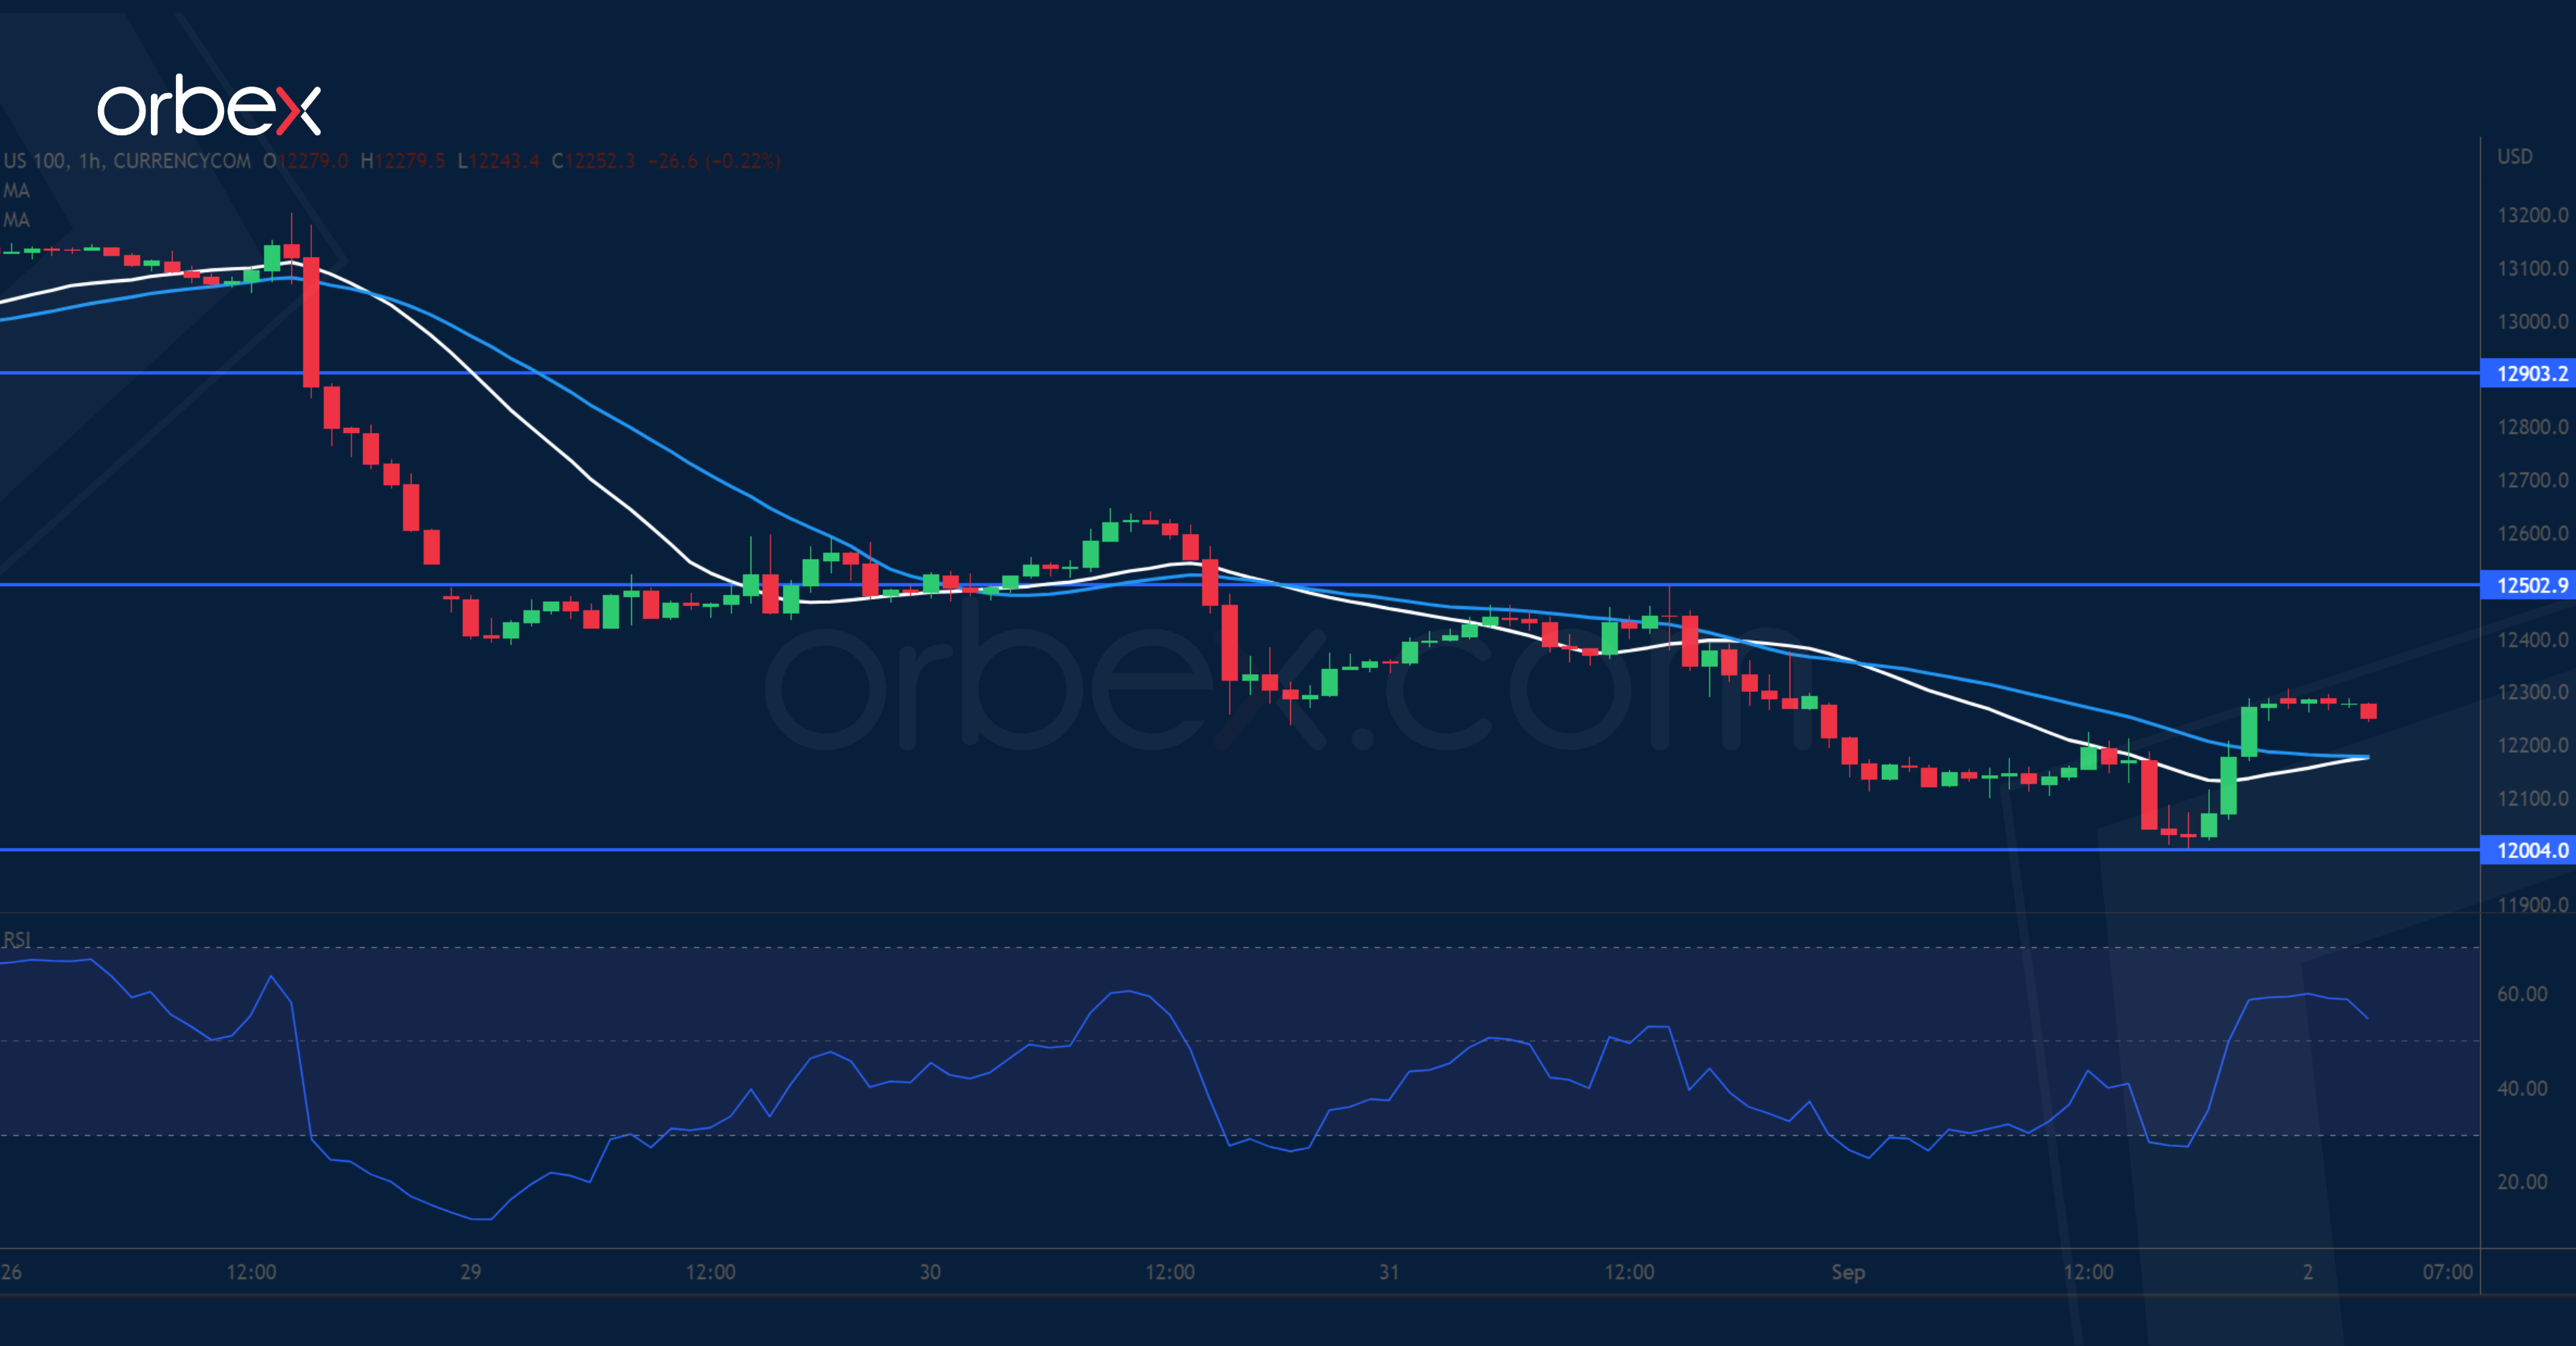
The Nasdaq 100 falters as the Fed puts price stability as its number one priority. A drop below 13000 has prompted buyers to bail out, exacerbating the selling pressure. The index is hovering above 12000 at the base of a bullish breakout in late July. This is a critical zone to hold the fading optimism together. A bearish breakout would show a lack of commitment from the buy side and turn the previous rally into a dead cat bounce. An oversold RSI attracted some buying interest in the demand zone and 12500 is a fresh resistance.