

Sample Category Title
USD/JPY Daily Outlook
Daily Pivots: (S1) 139.79; (P) 140.30; (R1) 140.71; More...
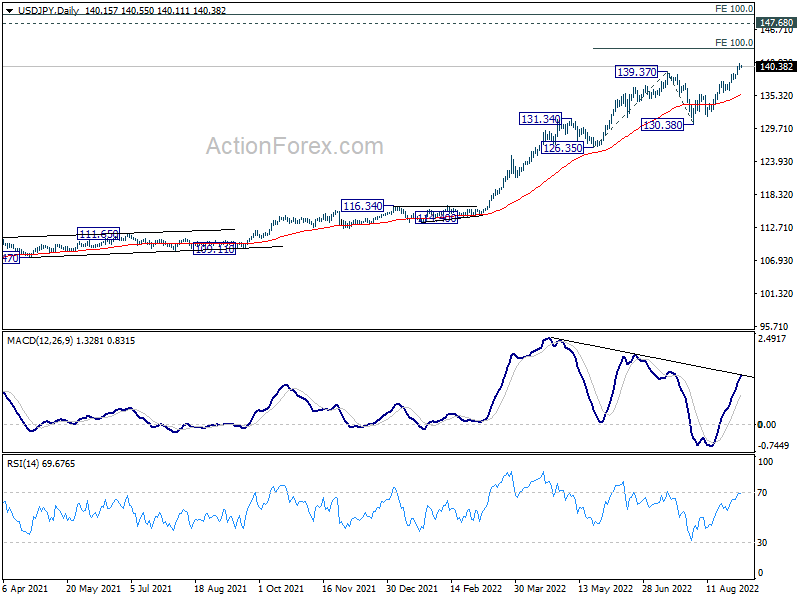
Intraday bias in USD/JPY stays on the upside, and current up trend should target 100% projection of 126.35 to 139.37 from 130.38 at 143.40. Sustained break there could bring upside acceleration of 147.68 long term resistance. On the downside, below 138.04 minor support will turn intraday bias neutral and bring consolidations first, before staging another rally.
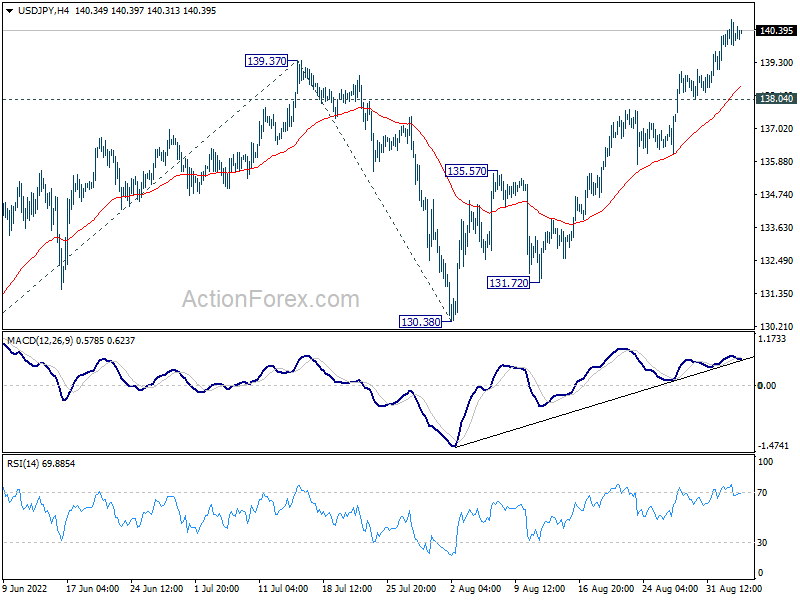
In the bigger picture, up trend from 101.18 is still in progress, as part of the whole up trend from 75.56 (2011 low). Further rise should be seen to 147.68 (1998 high). For now, break of 130.38 support is needed to be the first indication of medium term topping. Otherwise, outlook will stay bullish even in case of deep pull back.
USD/CHF Daily Outlook
Daily Pivots: (S1) 0.9778; (P) 0.9819; (R1) 0.9853; More...
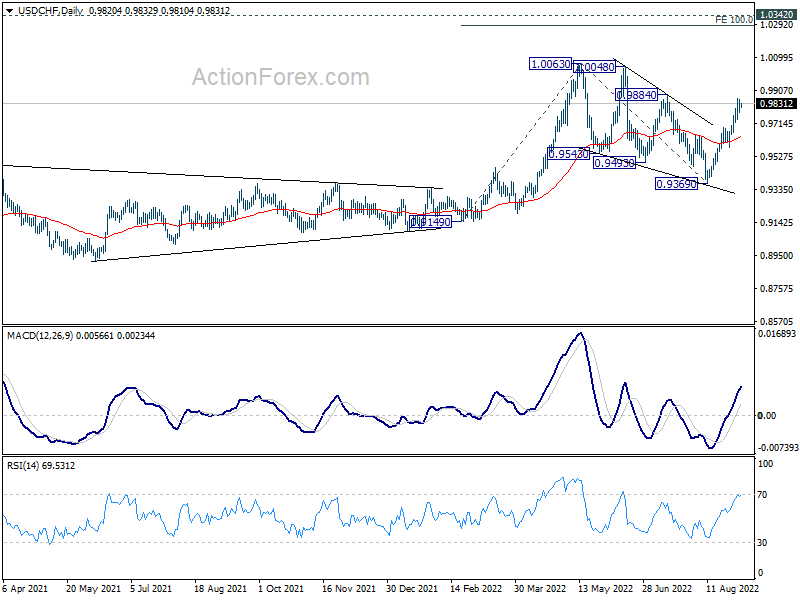
While USD/CHF is losing some upside momentum as seen in 4 hour MACD, further rise is still expected. Triangle correction from 1.0063 could have completed at 0.9369 already. Break of 0.9884 resistance will argue that larger up trend is ready to resume through 1.0063 high. On the downside, break of 0.9691 minor support will mix up the outlook and turn intraday bias neutral first.
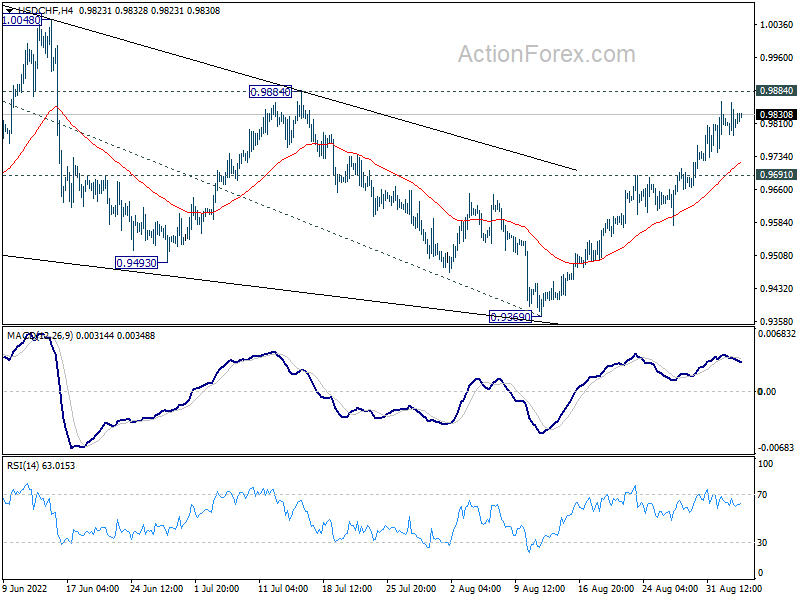
In the bigger picture, current development suggests that up trend from 0.8756 (2021 low) is still in progress. Sustained break of 1.0063 will target 100% projection of 0.9149 to 1.0063 from 0.9369 at 1.0283, and then 1.0342 (2016 high). For now, this will remain the favored case as long as 0.9369 support holds, even in case of deep pull back.
GBP/USD Daily Outlook
Daily Pivots: (S1) 1.1474; (P) 1.1532; (R1) 1.1567; More...
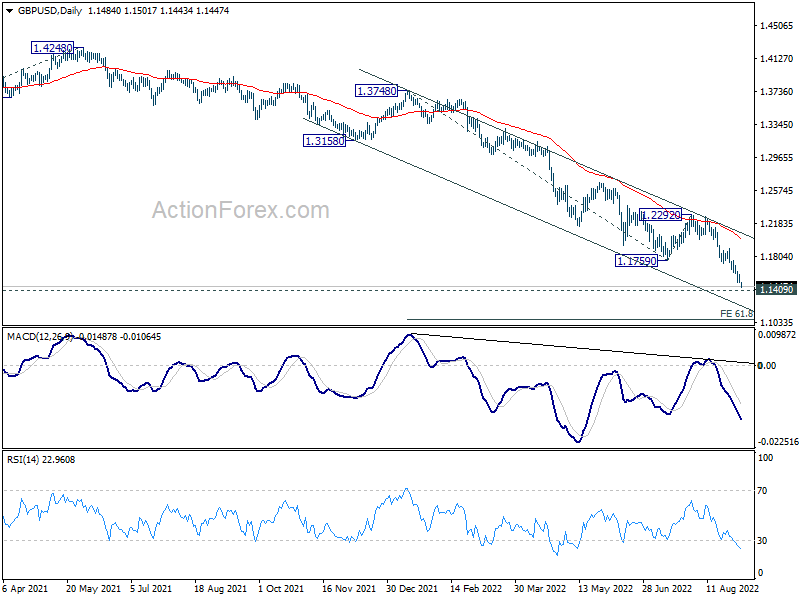
Intraday bias in GBP/USD stays on the downside and deeper fall should be seen to 1.1409 long term support. Firm break there will pave the way to 61.8% projection of 1.3748 to 1.1759 from 1.2292 at 1.1063 next. On the upside, above 1.1587 minor resistance will turn intraday bias neutral and bring consolidations, before staging another decline.
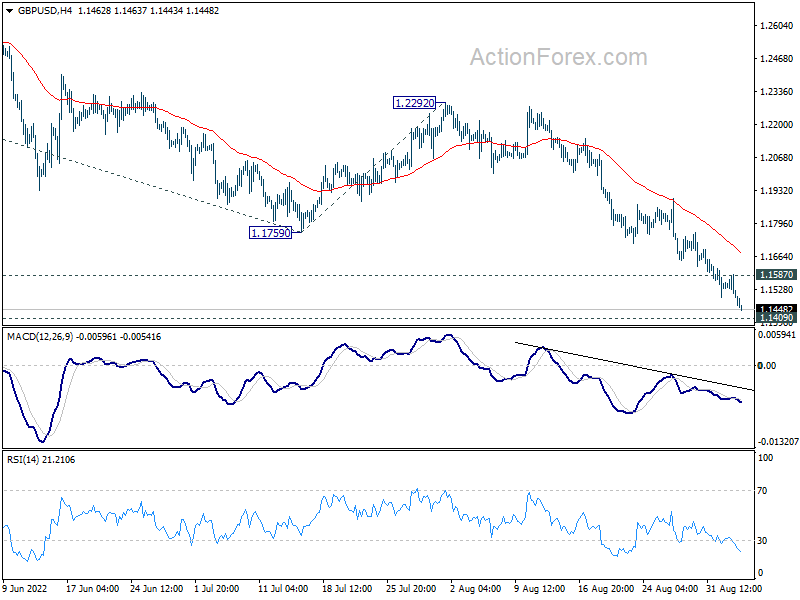
In the bigger picture, based on current momentum, fall from 1.4248 (2018 high) is probably resuming long term down trend from 2.1161 (2007 high). Sustained break of 1.1409 will target 61.8% projection of 1.7190 (2014 high) to 1.1409 (2020 low) from 1.4248 (2021 high) at 1.0675. This will remain the favored case for now as long as 1.2292 resistance holds.
Technical Outlook and Review
USD/JPY:
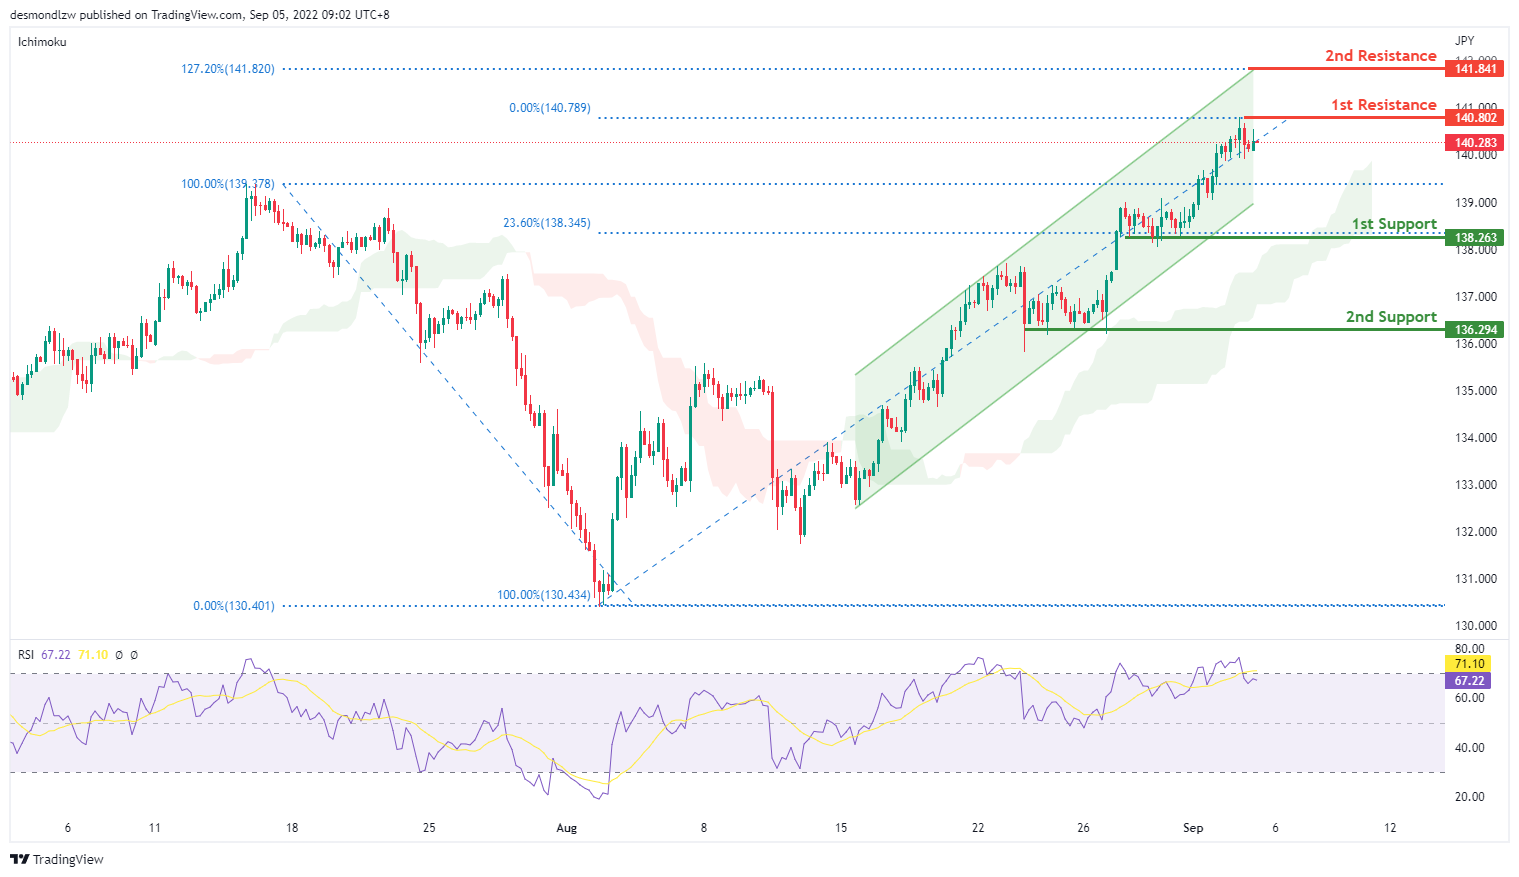
On the H4 chart, price has confirmed a bullish momentum breaking the previous high. We are bullish bias- Price has pulled back slightly but if bullish momentum continues, it should test the first resistance at 140.802 and then the second resistance at 141.841 where the 127.2% extension sits. Alternatively, if price reverse, it might pull back to test the first support at 138.263 where the 23.6% retracement sits then the second support at 136.294 levels
Areas of consideration:
- H4 time frame, 1st resistance at 140.802
- H4 time frame, 1st support at 138.263
DXY:
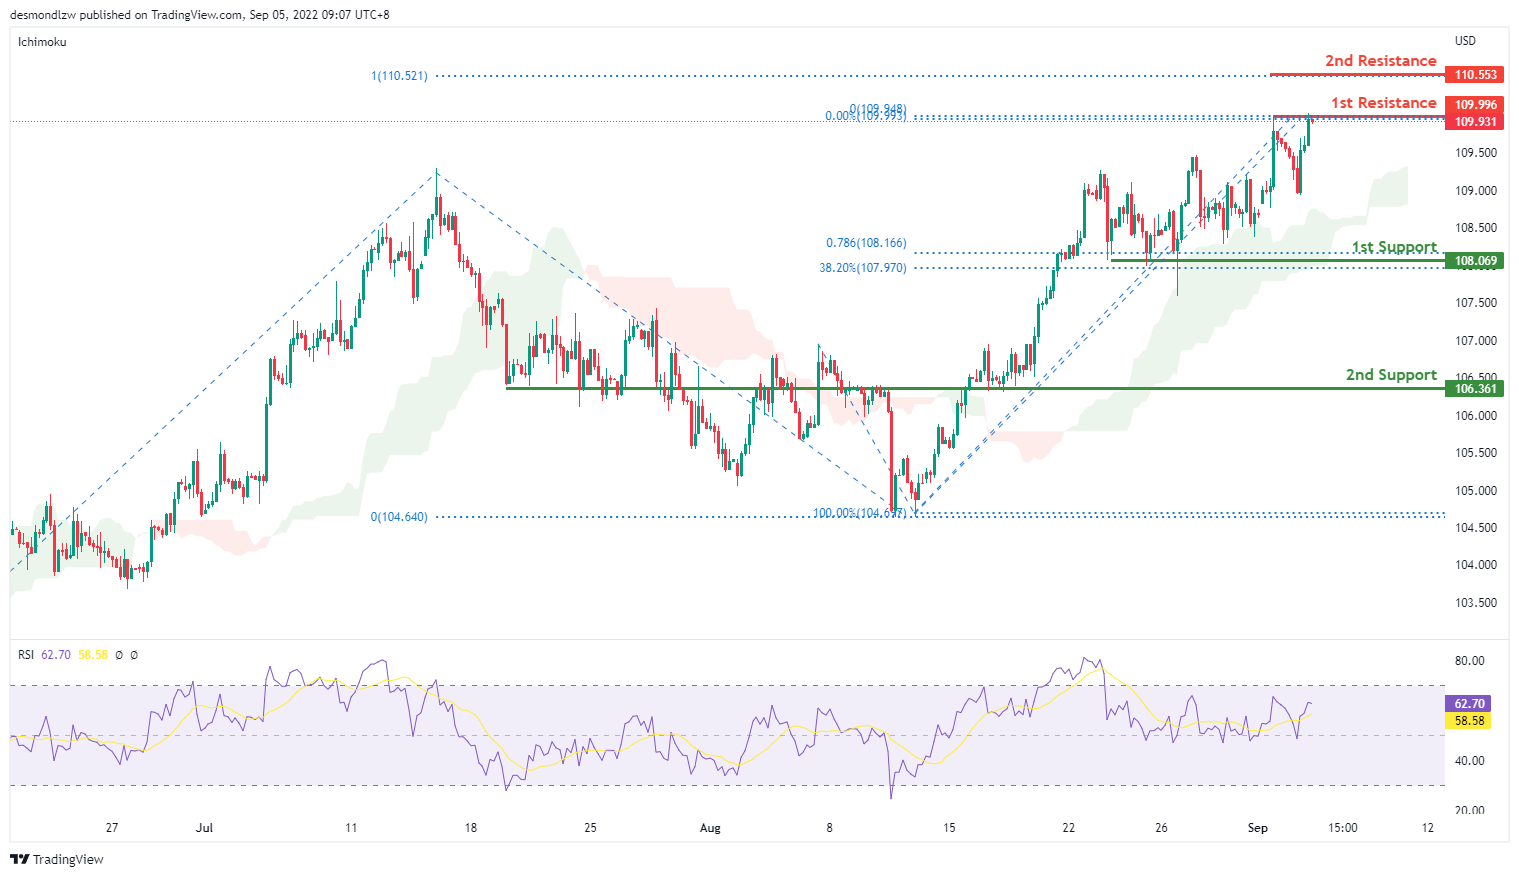
On the H4, price seems to be ranging but it is still moving in an ascending trend and is in a bullish momentum. Price is currently testing the first resistance at 109.996 levels. If bullish momentum continues, it should bring price up to 110.553 where the 100% Fibonacci projection sits. If price fails to break this level, it will pull back to test the first support at 108.069 where the 78.6% projection and 38.2% retracement sits and subsequently the second support at 106.361 levels
Areas of consideration:
- H4 time frame, 1st resistance at 109.996
- H4 time frame, 1st support at 108.069
EUR/USD:
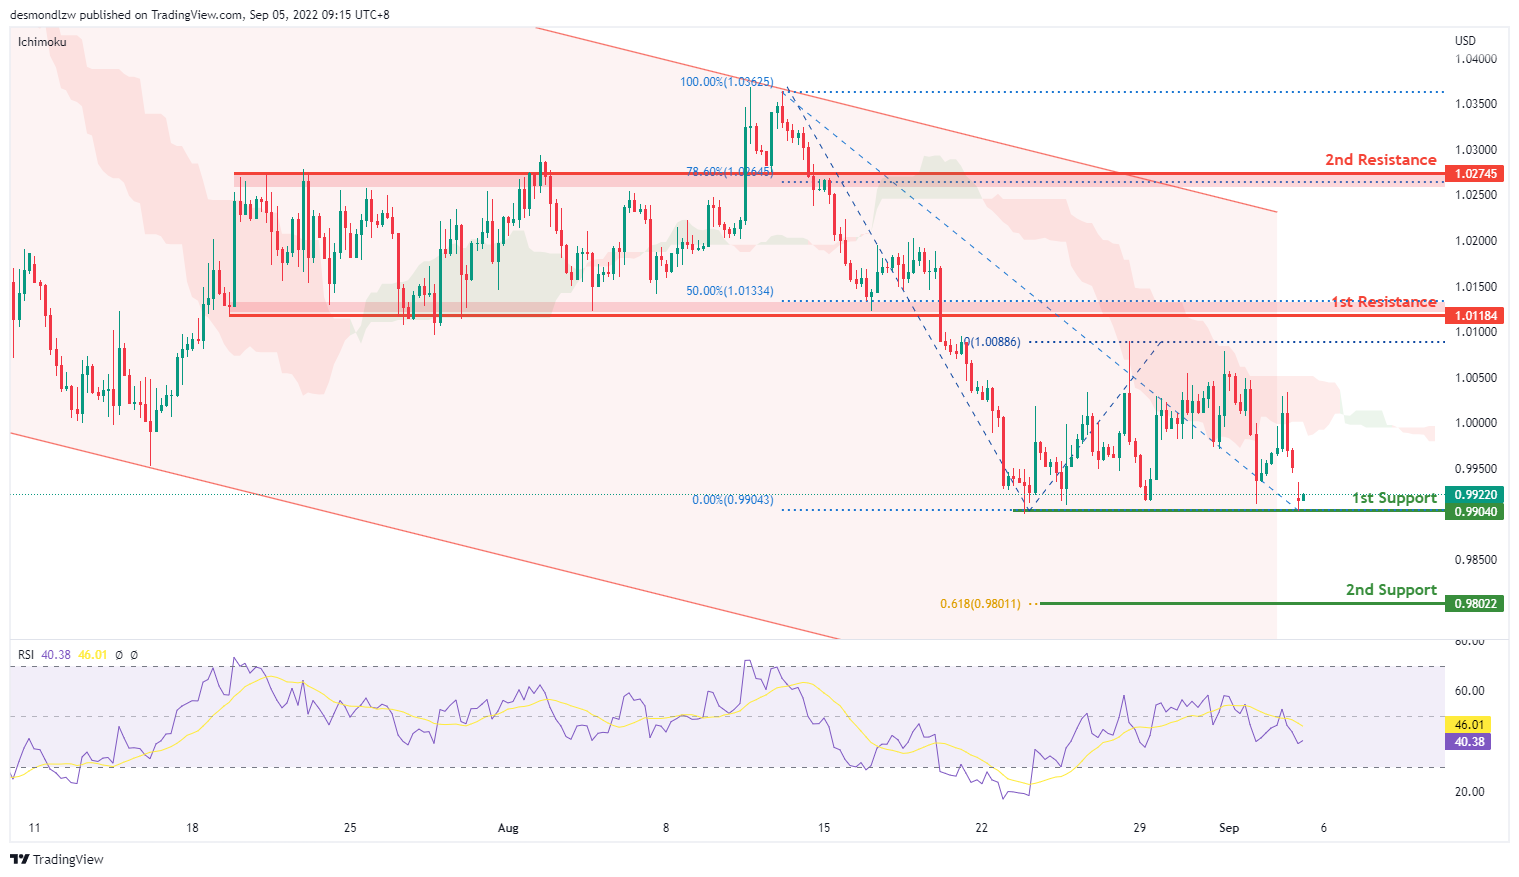
On the H4, price seem to have formed a bottom and is pulling back slightly – we are slightly bullish bias. Price looks like it’s pulling back to test the first resistance at 1.0118 where the previous swing low and 50% retracement sits and subsequently the second resistance at 1.0274 where the 78.6% retracement and swing high sits. If price fail to test the first resistance, it might pull back to test the first support at 0.9904 again and then the second support at 0.9802 where the 61.8% projection sits
Areas of consideration :
- H4 1st resistance at 1.0118
- H4 1st support at 0.9904
GBP/USD:
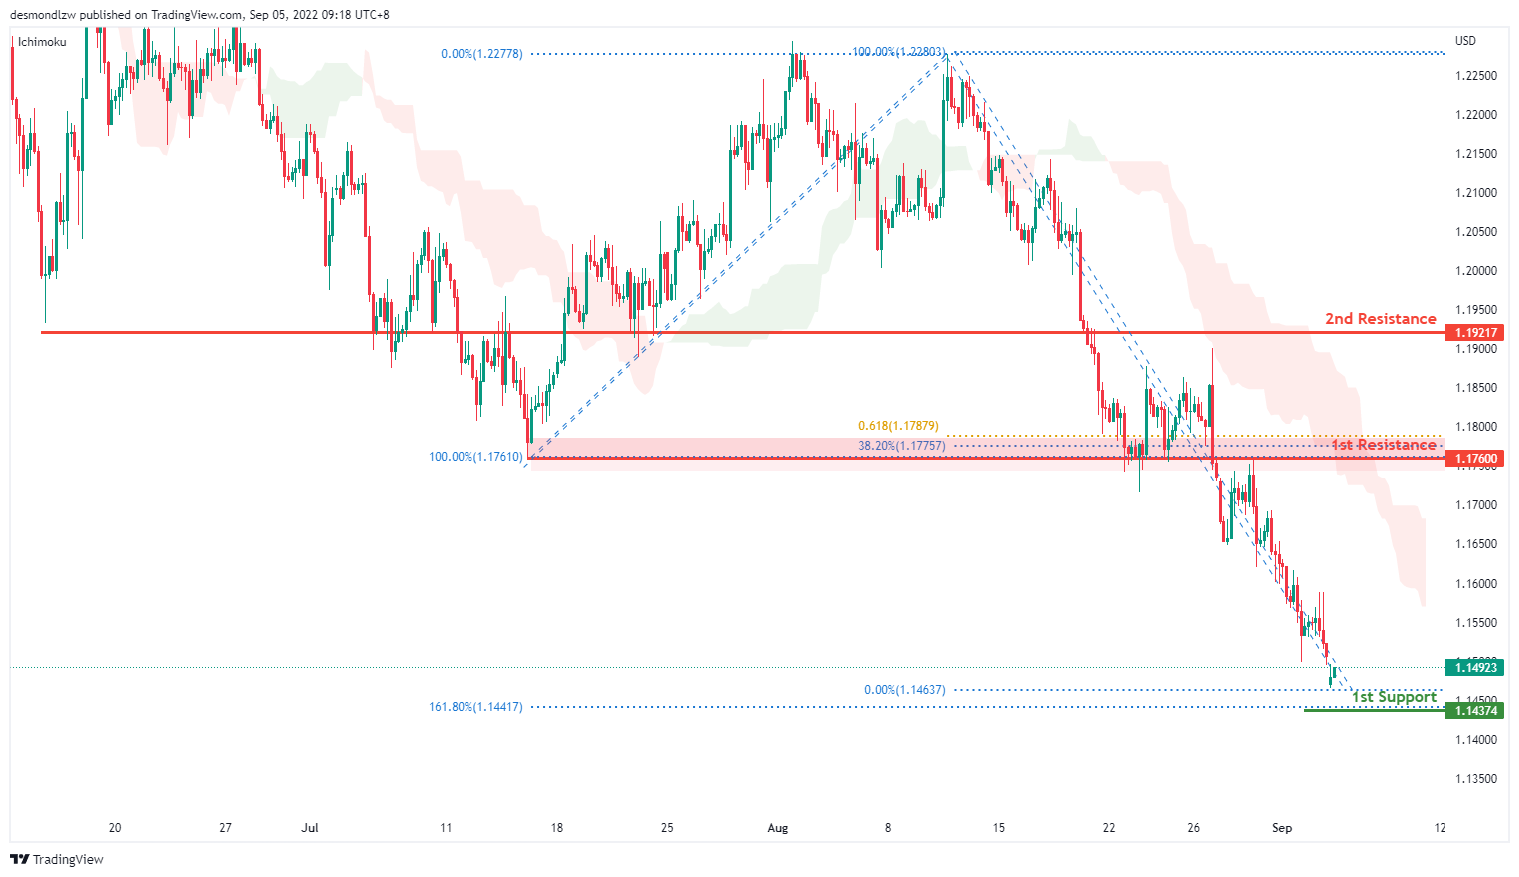
On the H4, prices seem to be in a bearish momentum and respecting the ichimoku cloud. Prices have broken the 78.6% projection level and is moving toward the first support at 1.1437 levels where the 161.8% extension sits. Alternatively, if it fails to break this level, it might look to test the first resistance at 1.1760 level where the 61.8% projection and 38.2% retracement sits then the second resistance at 1.1921 level where the previous swing low and 78.6% projection sits
Areas of consideration:
- H4 1st resistance at 1.1760
- H4 1st support at 1.1437
USD/CHF:
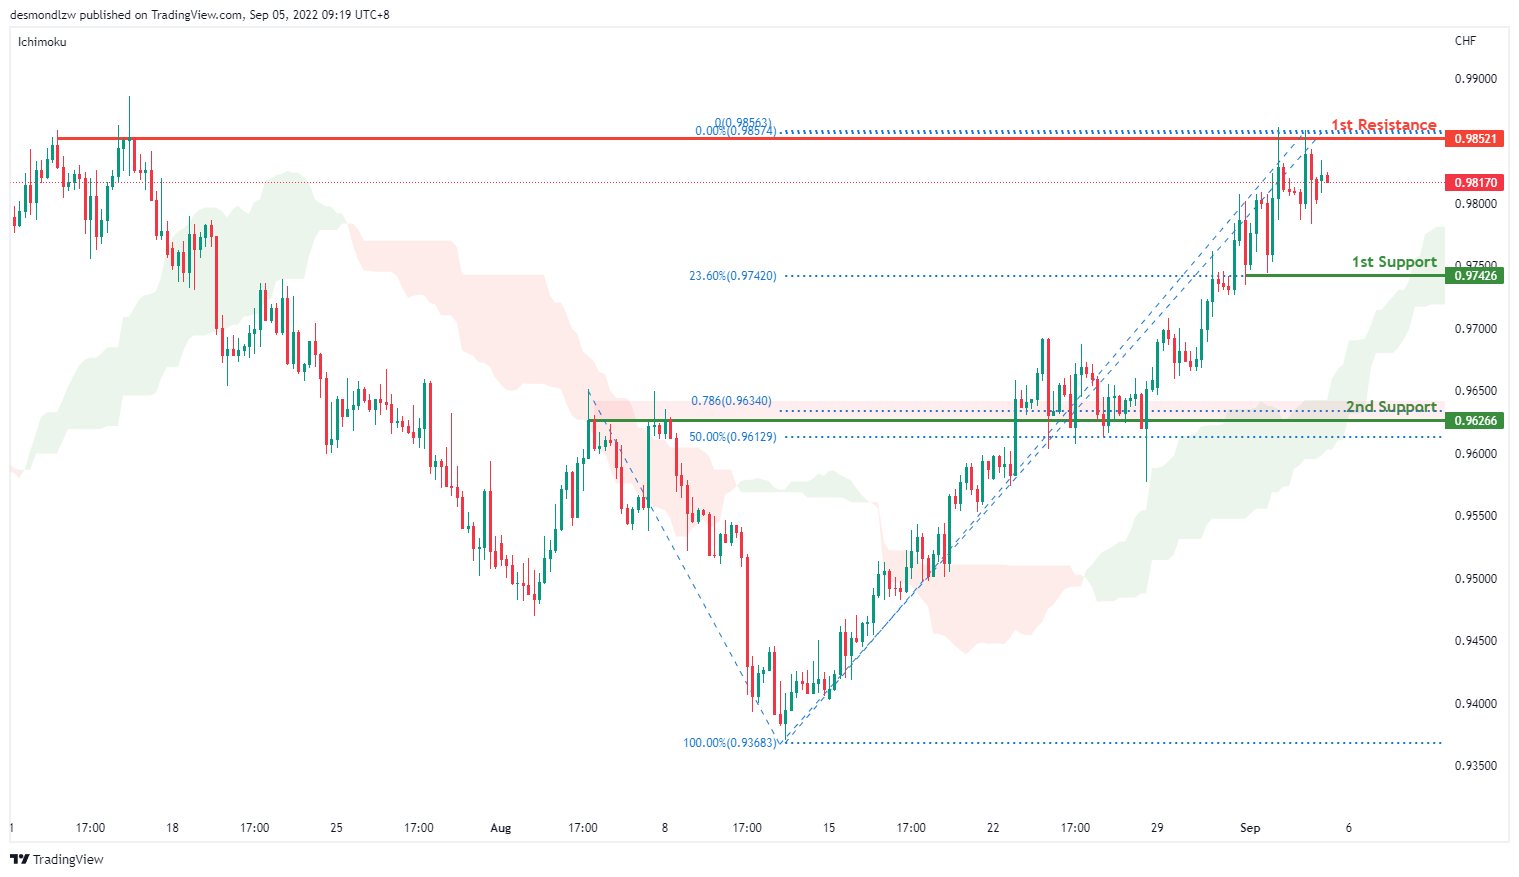
On the H4, with prices moving above the ichimoku cloud and breaking the descending trend, we are bullish. Price has tested the first resistance at 0.9852 where the previous swing high sits and has pulled back slightly. If price do not break the first resistance, it could pull back to test the first support around the 0.9742 levels where the 23.6% retracement and swing low sits, subsequently the second support at 0.9626 where the 50% fibonacci retracement,78.6% projection and previous swing low sits
Areas of consideration
- H4 1st support at 0.9742
- H4 1st resistance at 0.9852
XAU/USD (GOLD):
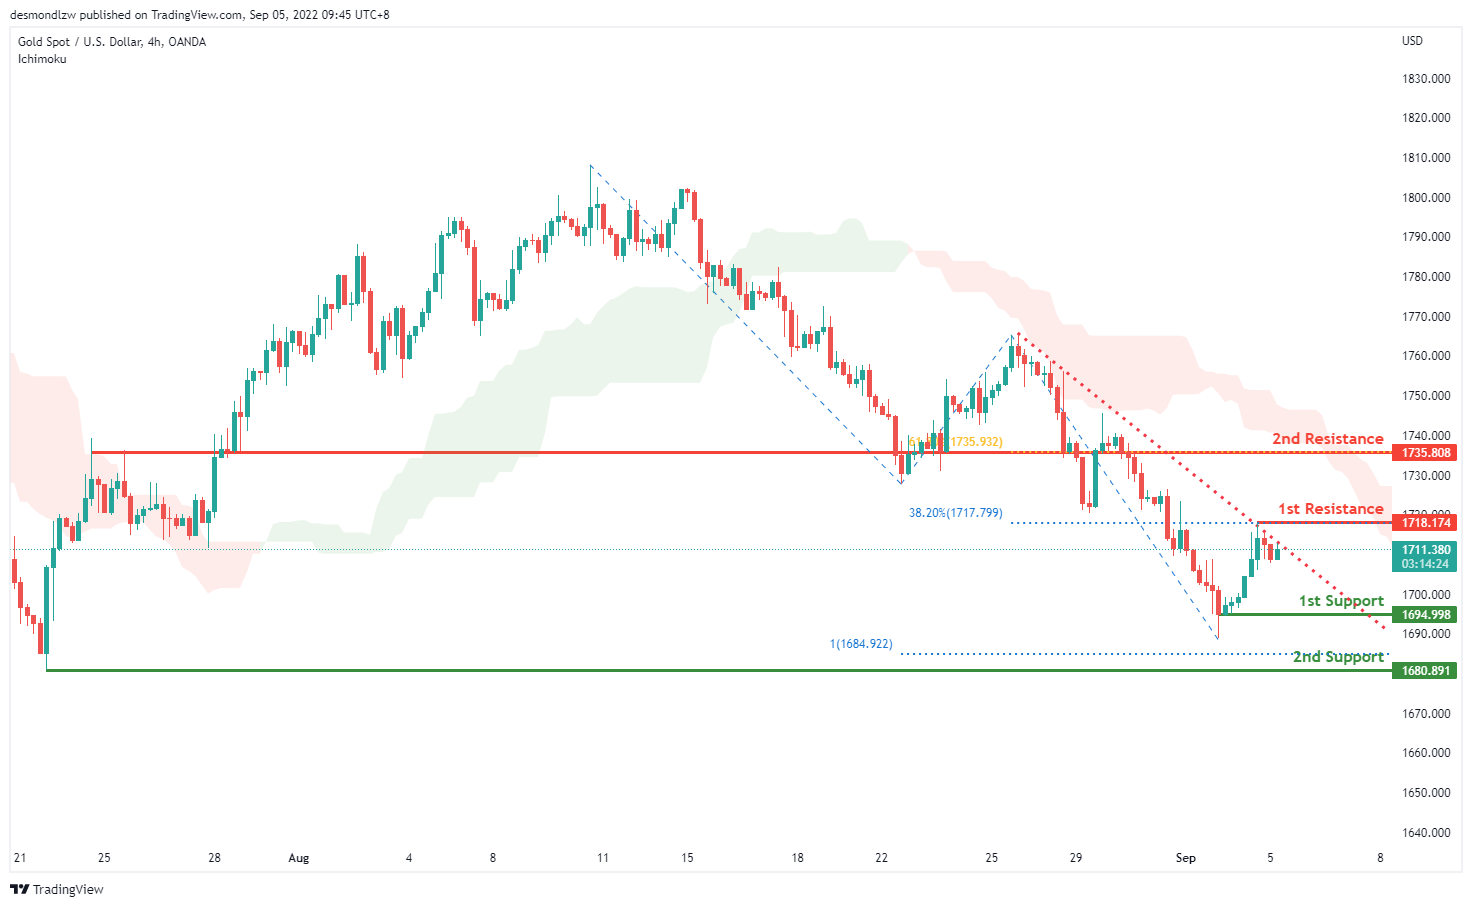
On the H4, with prices below ichimoku cloud and moving within the descending trendline, we have a bearish bias that the price may drop to the 1st support at 1694.998, where the previous swing low is. If the price can break this support line, the next support level could be at 1680.891, where the significant swing low is. Alternatively, the price may rise to the 1st resistance at 1718.174, where the price tested before and 38.2% fibonacci retracement is. If the price retest this level and break it, the 2nd resistance could be at 1735.808, which is in line with previou swing highs and 61.8% fibonacci retracement.
Areas of consideration:
- H4 time frame, 1st resistance at 1718.174
- H4 time frame, 1st support at 1694.998
AUD/USD:
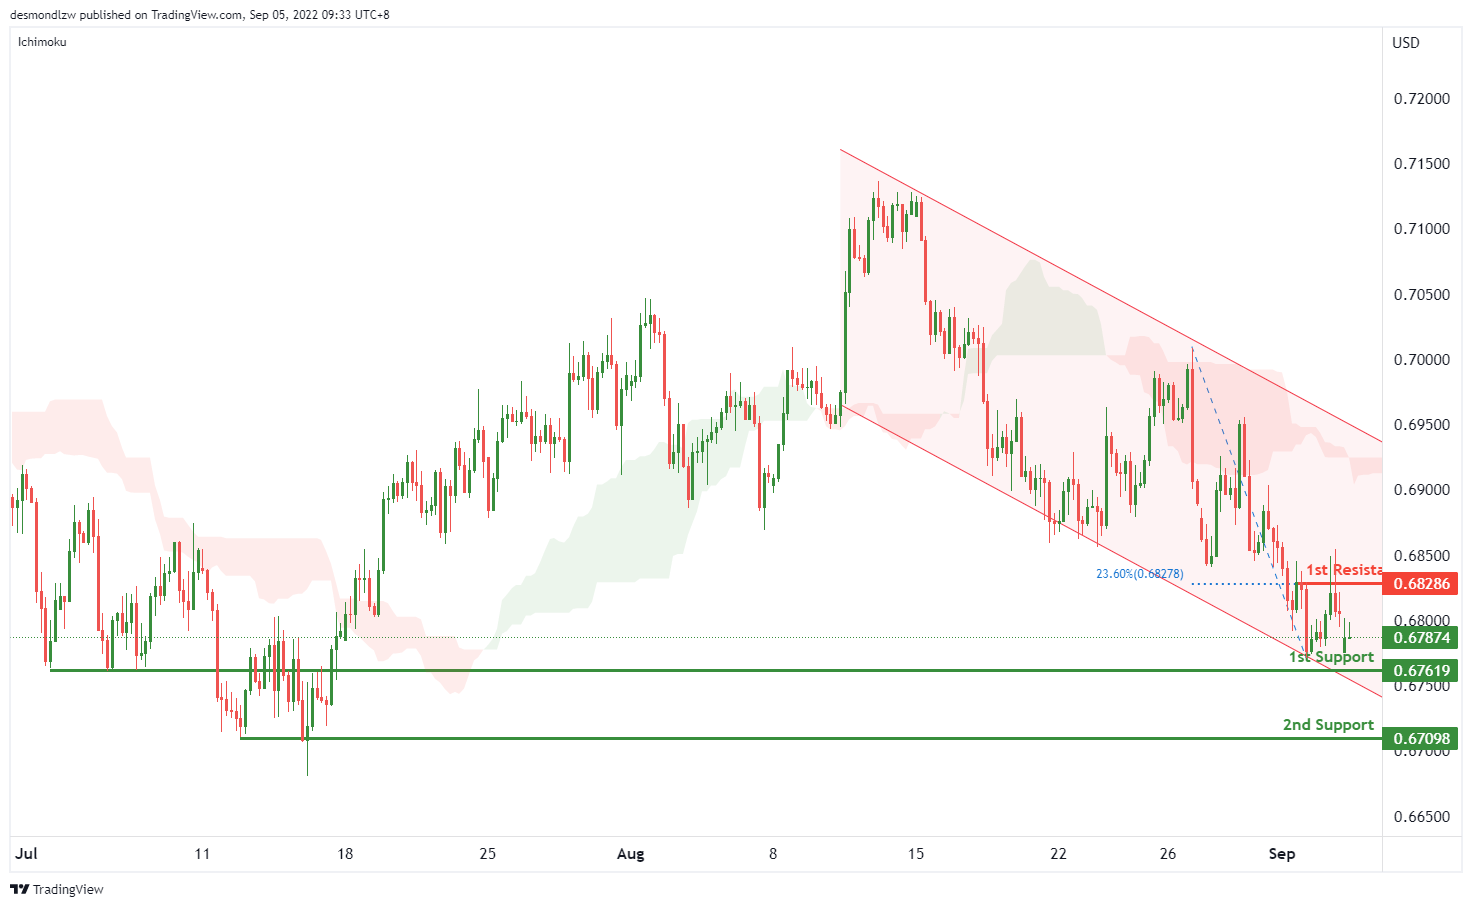
On the H4, with the price moving below the ichimoku cloud and moving within the descending channel, we have a bearish bias that the price may drop from the 1st support at 0.67619, which is in line with the multiple swing lows to the 2nd support at 0.67098, where the swing lows are. Alternatively, the price may rise to the 1st resistance 0.68286, where the 23.6% fibonacci retracement is.
Areas of consideration
- H4 1st support at 0.67619
- H4 2nd support at 0.67098
NZD/USD:
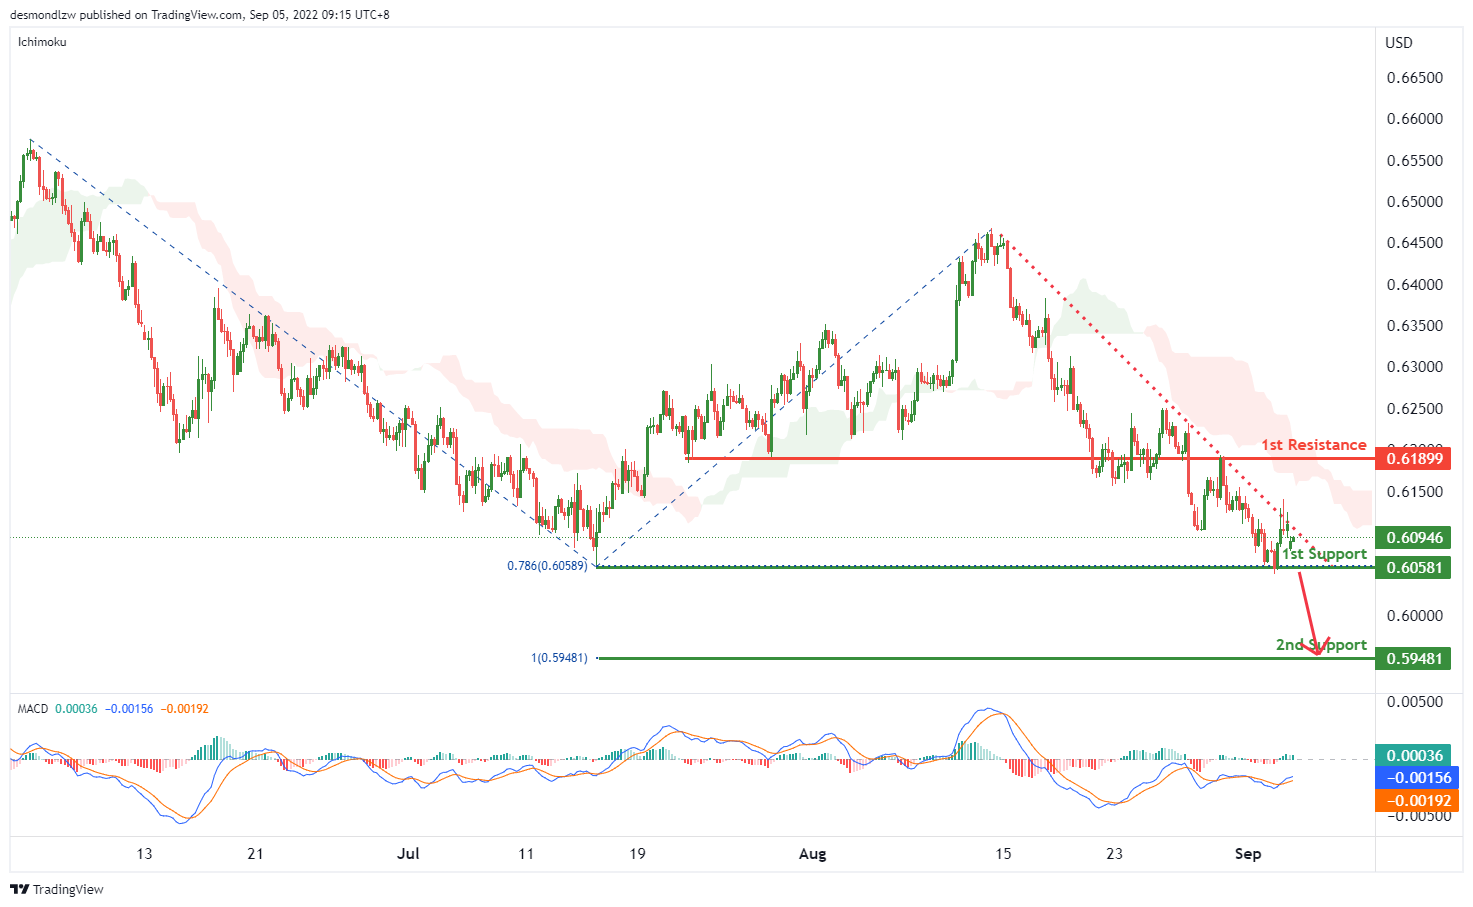
On the H4, with price moving within the descending trendline and below the ichimoku indicator, we have a bearish bias that price may drop to the 1st support at 0.60581, where is the 78.6% fibonacci projection, if the price can break the 1st support, the 2nd support could be at 0.59481, where the 100% fibonacci projection are. Alternatively, price could rise to 1st resistance at 0.61899, which is in line with overlap resistance.
Areas of consideration:
- H4 time frame, 1st support at 0.60581
- H4 time frame, 2nd support at 0.59481
USD/CAD:
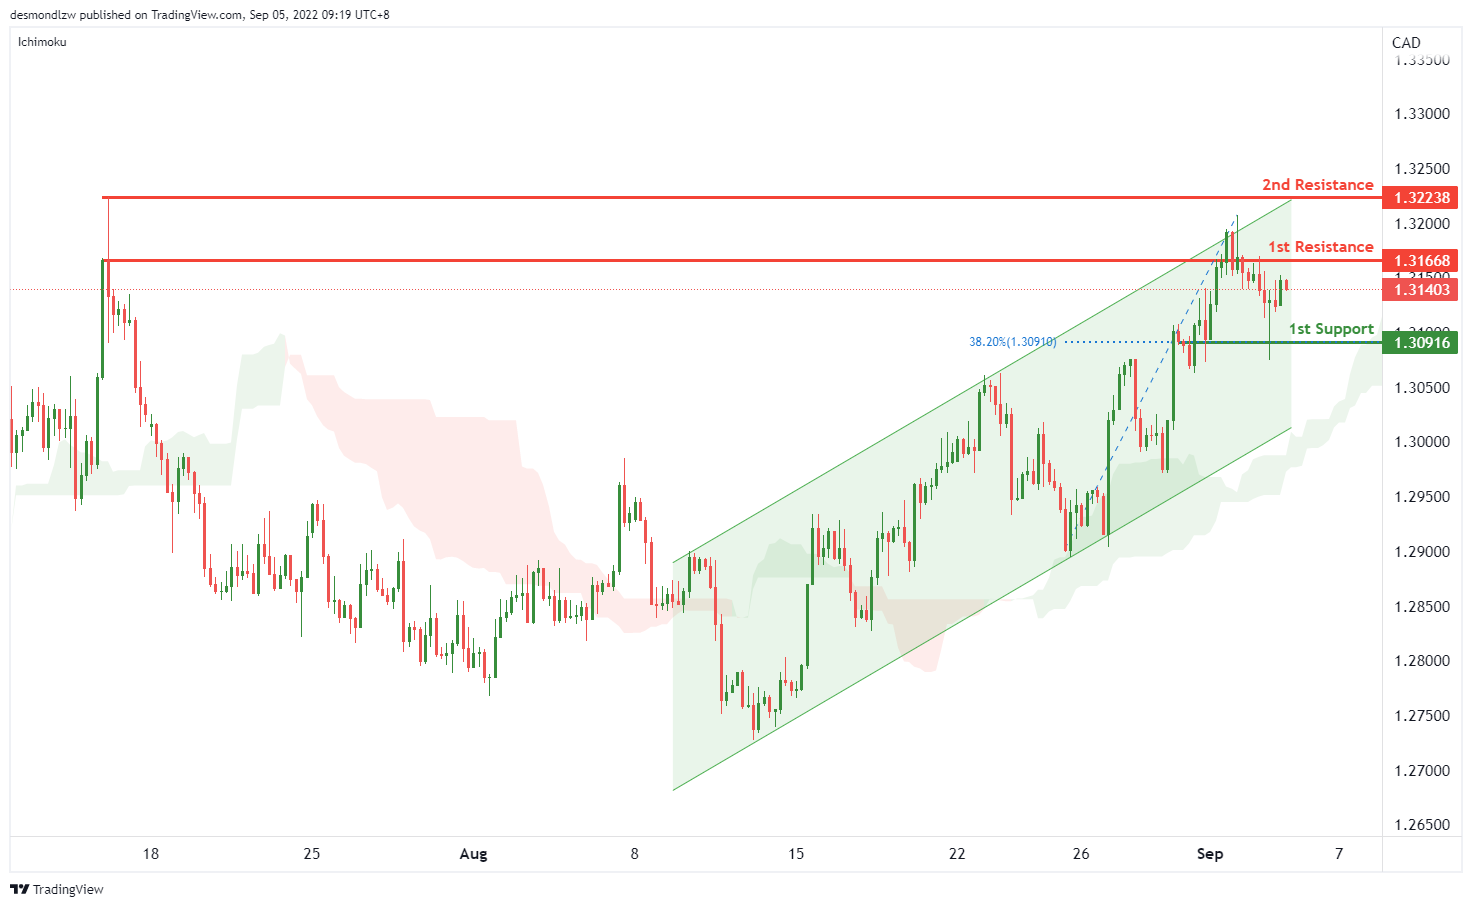
On the H4, with the price moving within the ascending channel, above ichimoku cloud, we have a bullish bias that the price may rise to the 1st resistance at 1.31668, where the swing highs are, If the price can break the 1st resistance, we can expect the price rise to the 2nd resistance at 1.32238, where the swing high is. Alternatively, price could pullback from the 1st resistance and drop to the 1st support at 1.30916, where the overlap support and 23.6% fibonacci retracement are.
Areas of consideration:
- H4 time frame, 1st resistance at 1.31668
- H4 time frame, 2nd resistance at 1.32238
OIL:
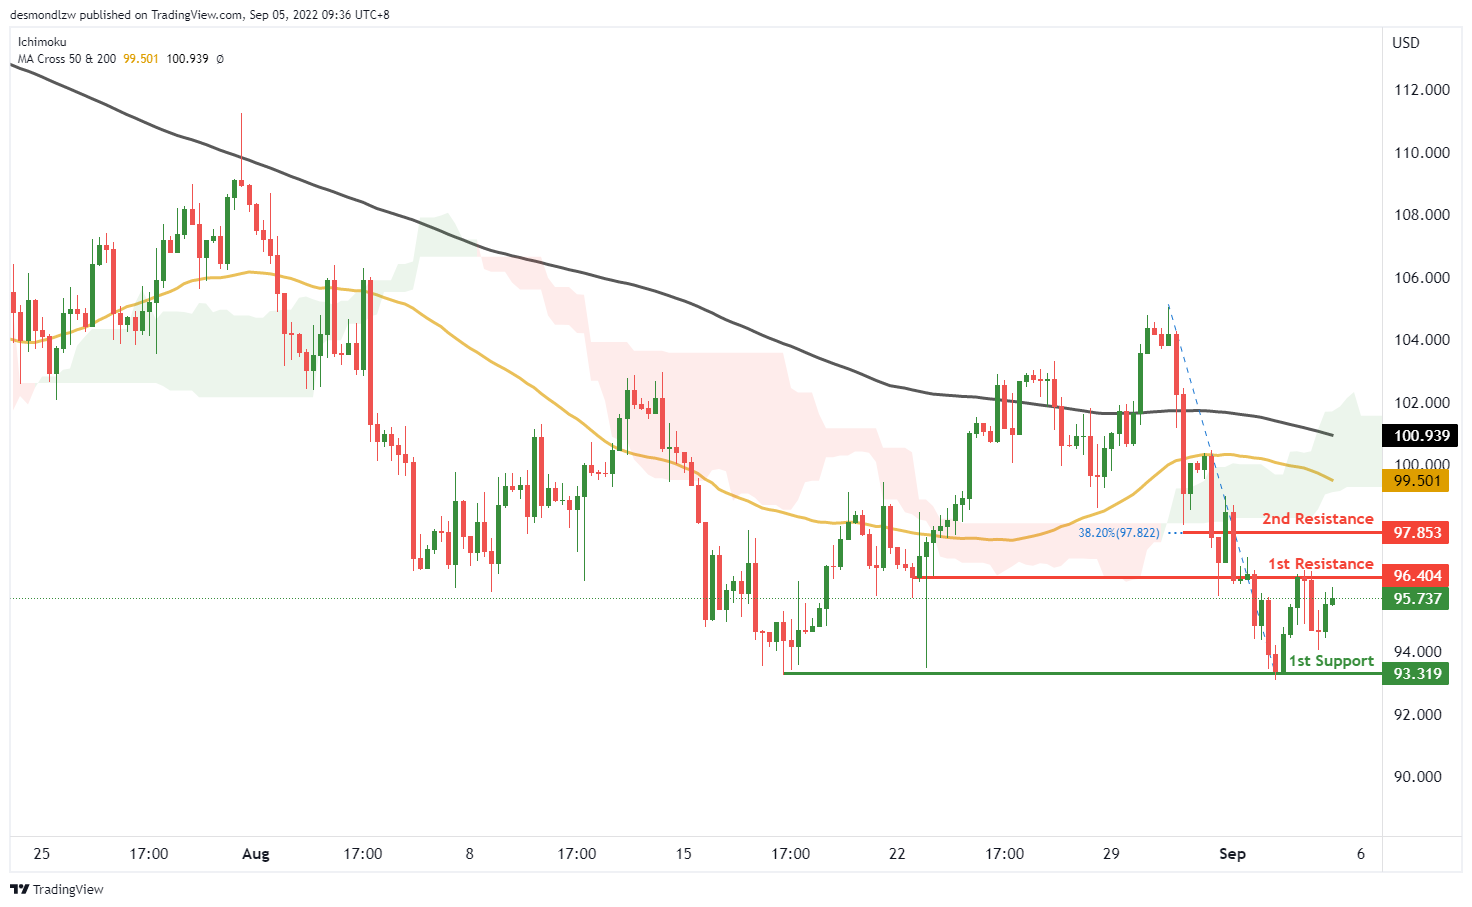
On the H4, with price below ichimoku cloud and MA Cross, we have a bearish bias that the price may pullback to the 1st resistance at 96.404, where the overlap resistance is, and then drop to the 1st support at 93.319, which is in line with the swing lows support. Alternatively, if the price breaks the 1st resistance, the 2nd resistance could be at 97.853, where the 38.2% fibonacci retracement is.
Areas of consideration:
- H4 time frame, 1st resistance at 96.404
- H4 time frame, 1st support at 93.319
Dow Jones Industrial Average:
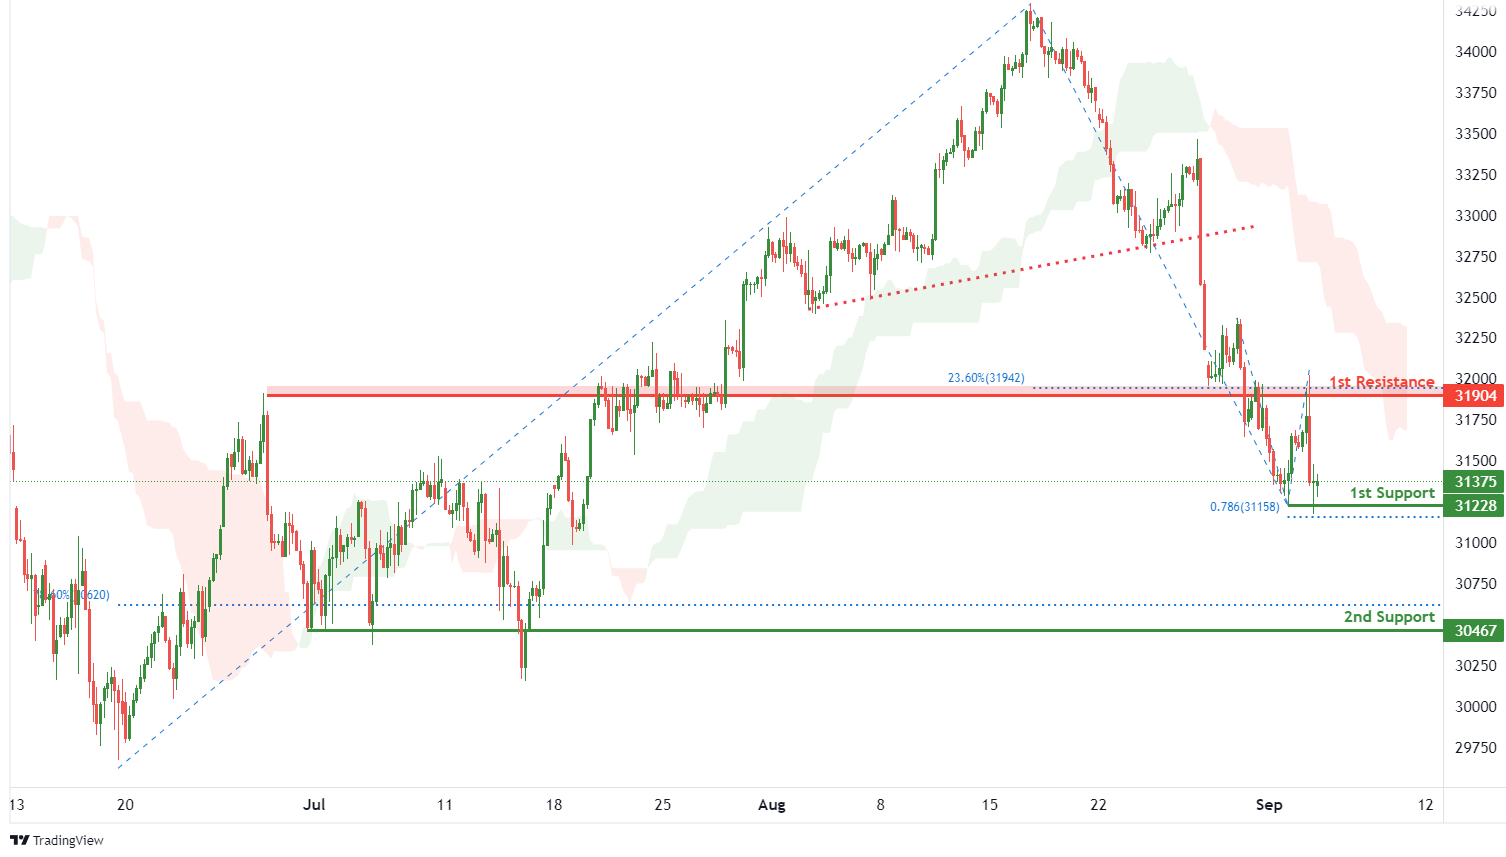
On the H4, with price breaking the ascending trendline and moving below the ichimoku indicator, we have a bearish bias that price will drop to 1st support at 31228 where the swing low support and 78.6% fibonacci projection are. Once there is downside confirmation that price has broken 1st support structure, we would expect bearish momentum to carry price to 2nd support at 30467 where the pullback support and 78.6% fibonacci retracement are. Alternatively, price could rise to 1st resistance at 31904 where the overlap resistance and 23.6% fibonacci retracement are.
Areas of consideration:
- H4 time frame, 1st resistance of 31904
- H4 time frame, 1st support at 31228
DAX:
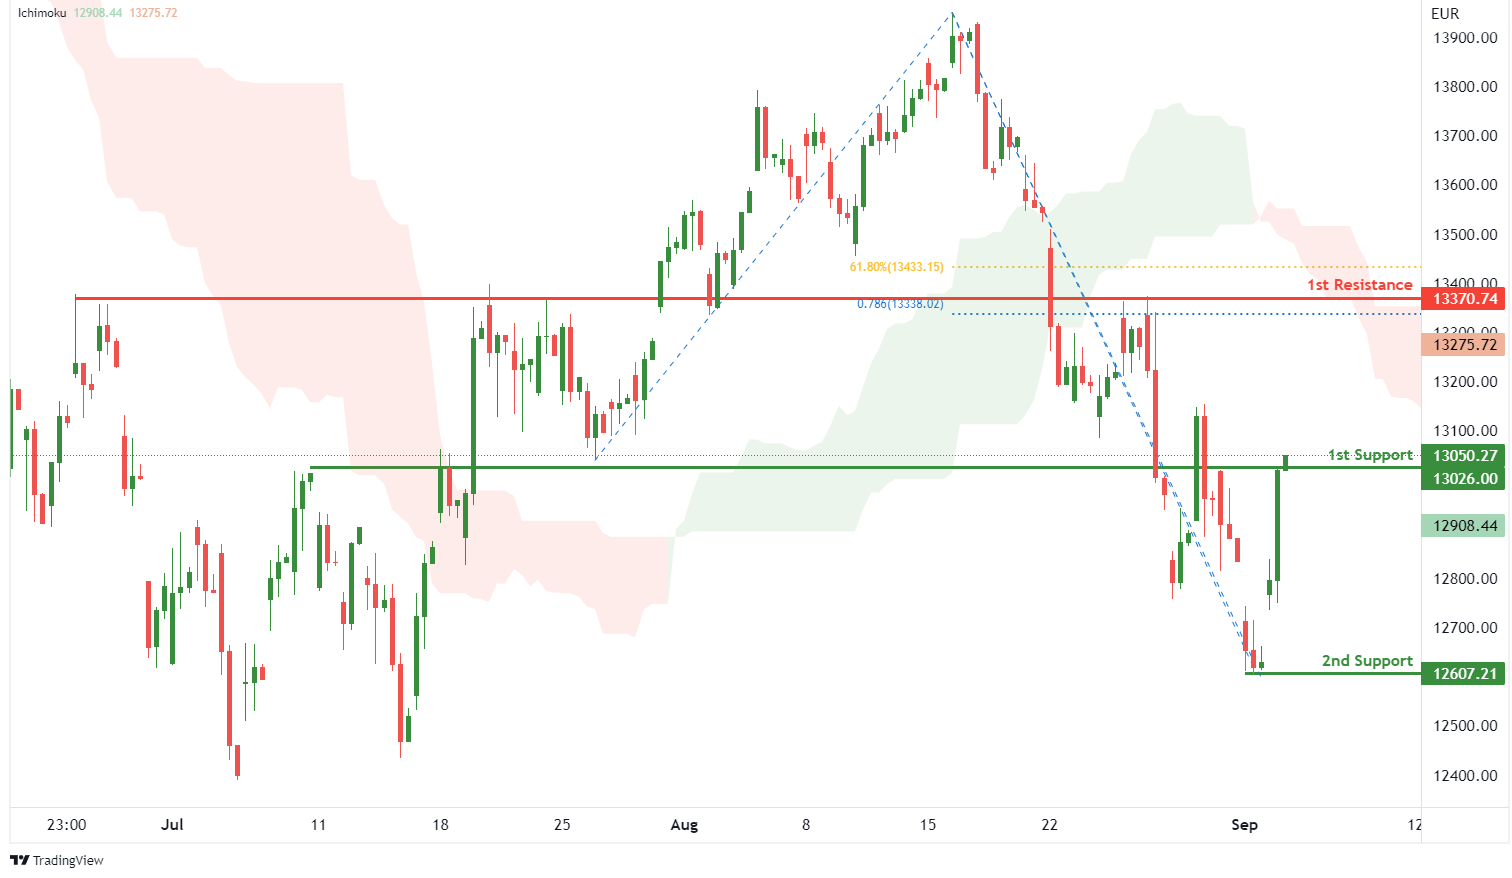
On the H4, with price moving within below the ichimoku indicator, we have a bearish bias that price will drop to 1st support at 13026.00 where the pullback support is. Once there is downside confirmation that price has broken 1st support structure, we would expect bearish momentum to carry price to 2nd support at 12607.21 where the swing low support is. Alternatively, price could rise to 1st resistance at 13370.74 where the overlap resistance, 61.8% fibonacci retracement and 78.6% fibonacci projection are.
Areas of consideration:
- H4 time frame, 1st resistance of 13370.74
- H4 time frame, 1st support at 13026.00
ETHUSD:
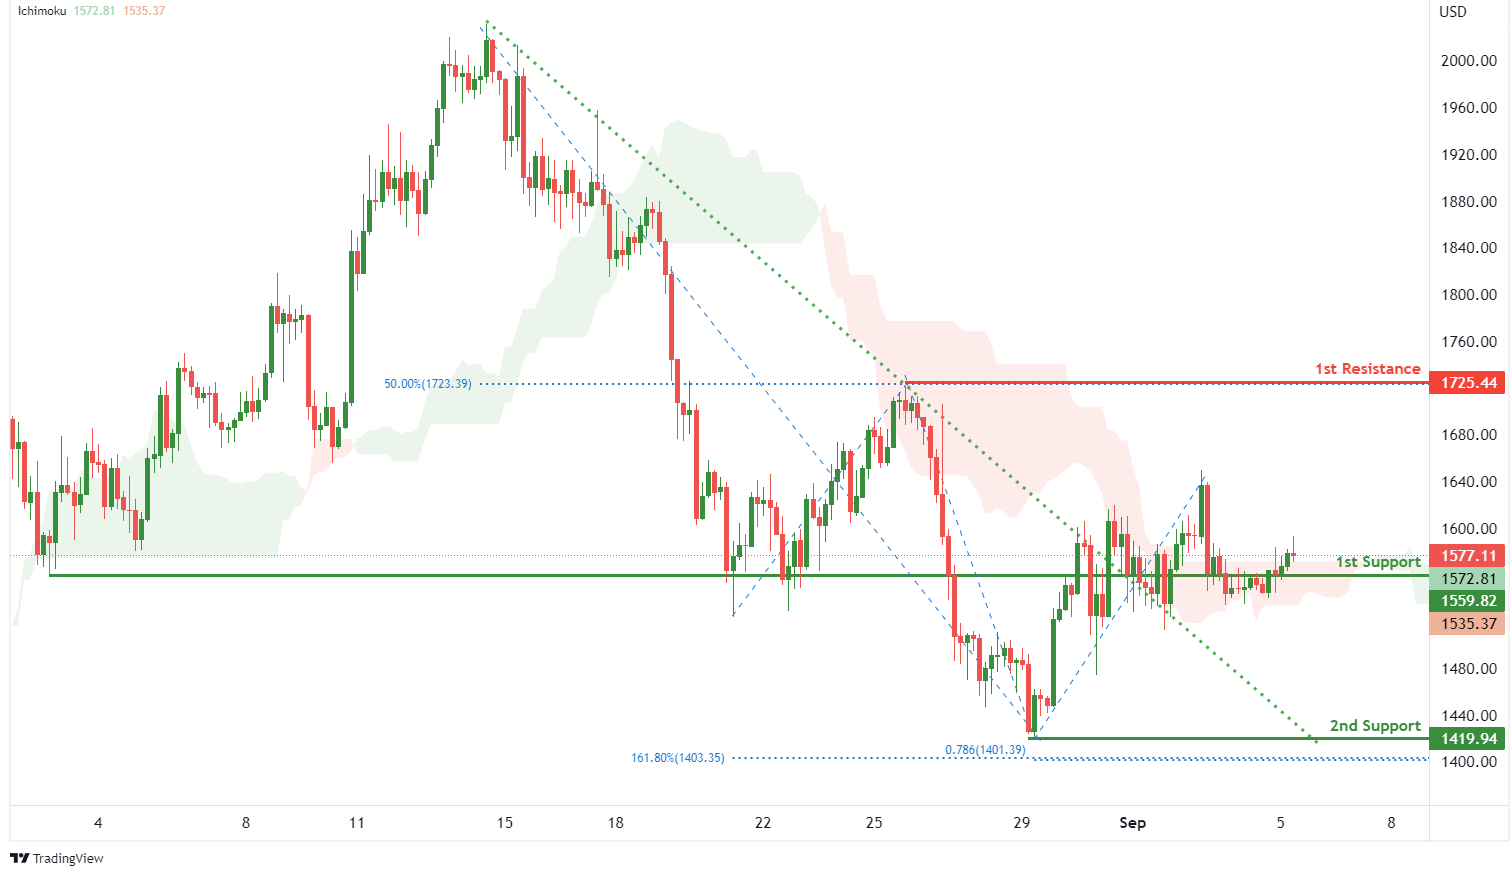
On the H4, with price breaking out of the descending trendline and moving above the ichimoku indicator, we have a bullish bias that price will rise from 1st support at 1559.82 where the overlap support is to the 1st resistance at 1725.44 where the swing high resistance and 50% fibonacci retracement are. Alternatively, price could break 1st support and drop to 2nd support at 1419.94 where the swing low support, 78.6% fibonacci projection and 161.8% fibonacci extension are.
Areas of consideration:
- H4 time frame, 1st resistance of 1725.44
- H4 time frame, 1st support at 1559.82
BTCUSD:
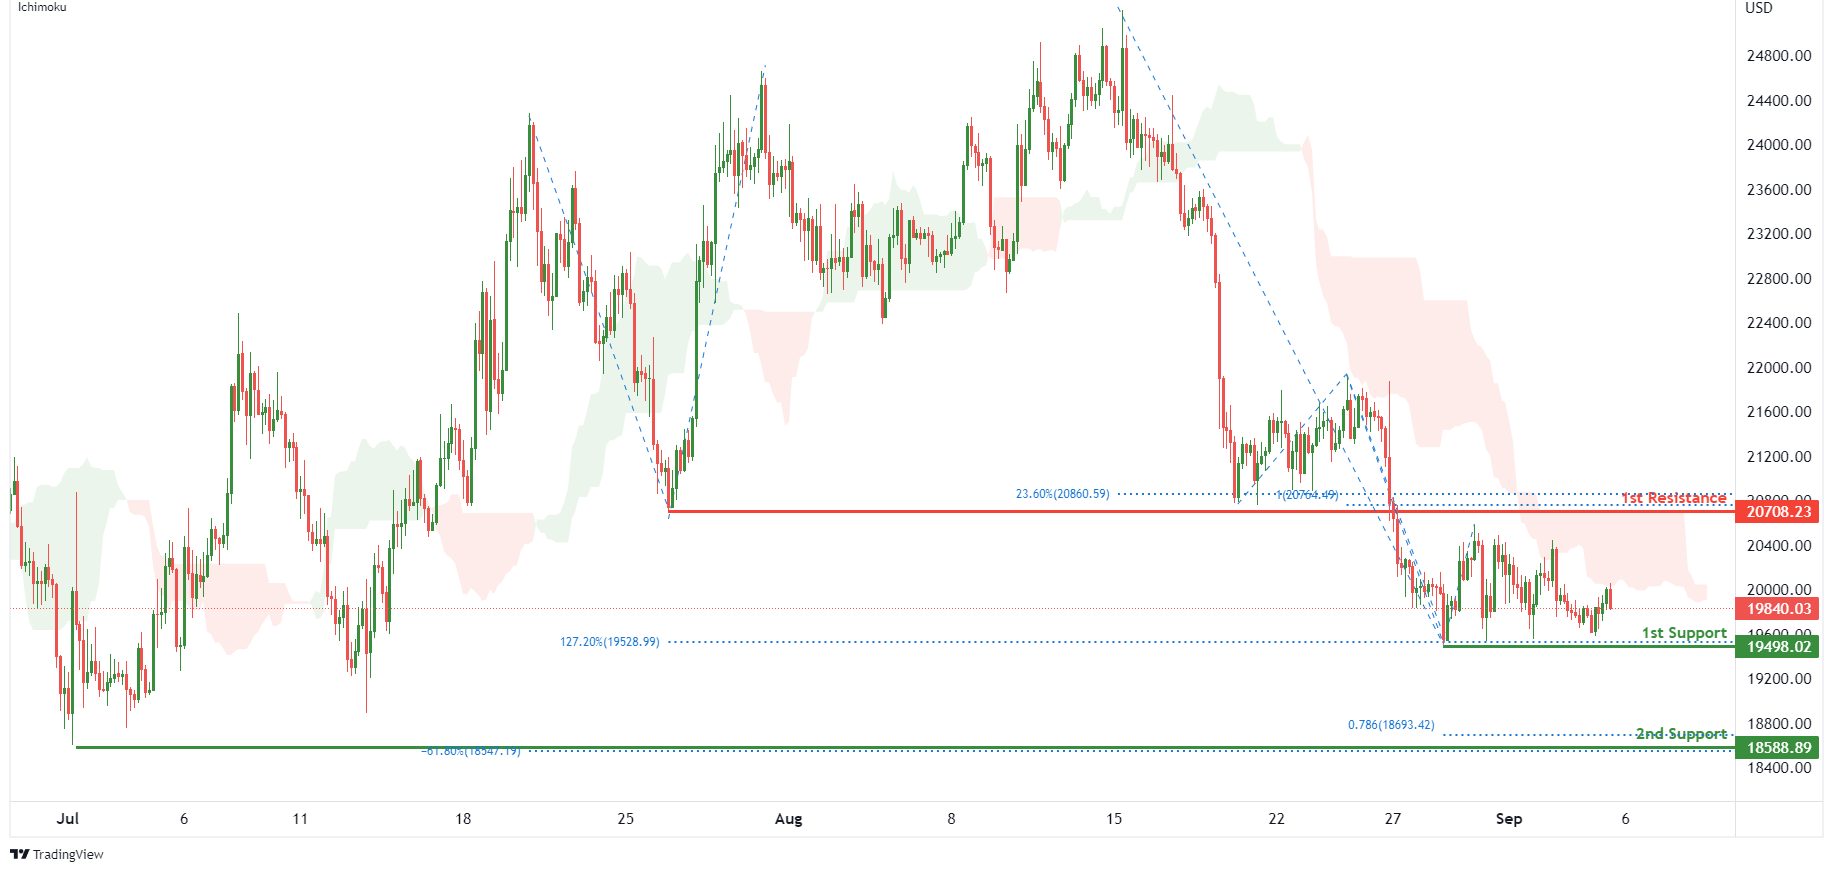
On the H4, with price moving below an ichimoku indicator, we have a bearish bias that price will drop to 1st support at 19498.02 where the swing low support and 127.2% fibonacci extension are. Should price break 1st support structure, we would expect bearish momentum to carry price to 2nd support at 18588.89 where the swing low support, -61.8% fibonacci expansion and 78.6% fibonacci projection are. Alternatively, price could rise to 1st resistance at 20708.23 where the pullback resistance, 100% fibonacci projection and 23.6% fibonacci retracement are.
Areas of consideration:
- H4 time frame, 1st resistance of 20708.23
- H4 time frame, 1st support at 19498.02
S&P 500:
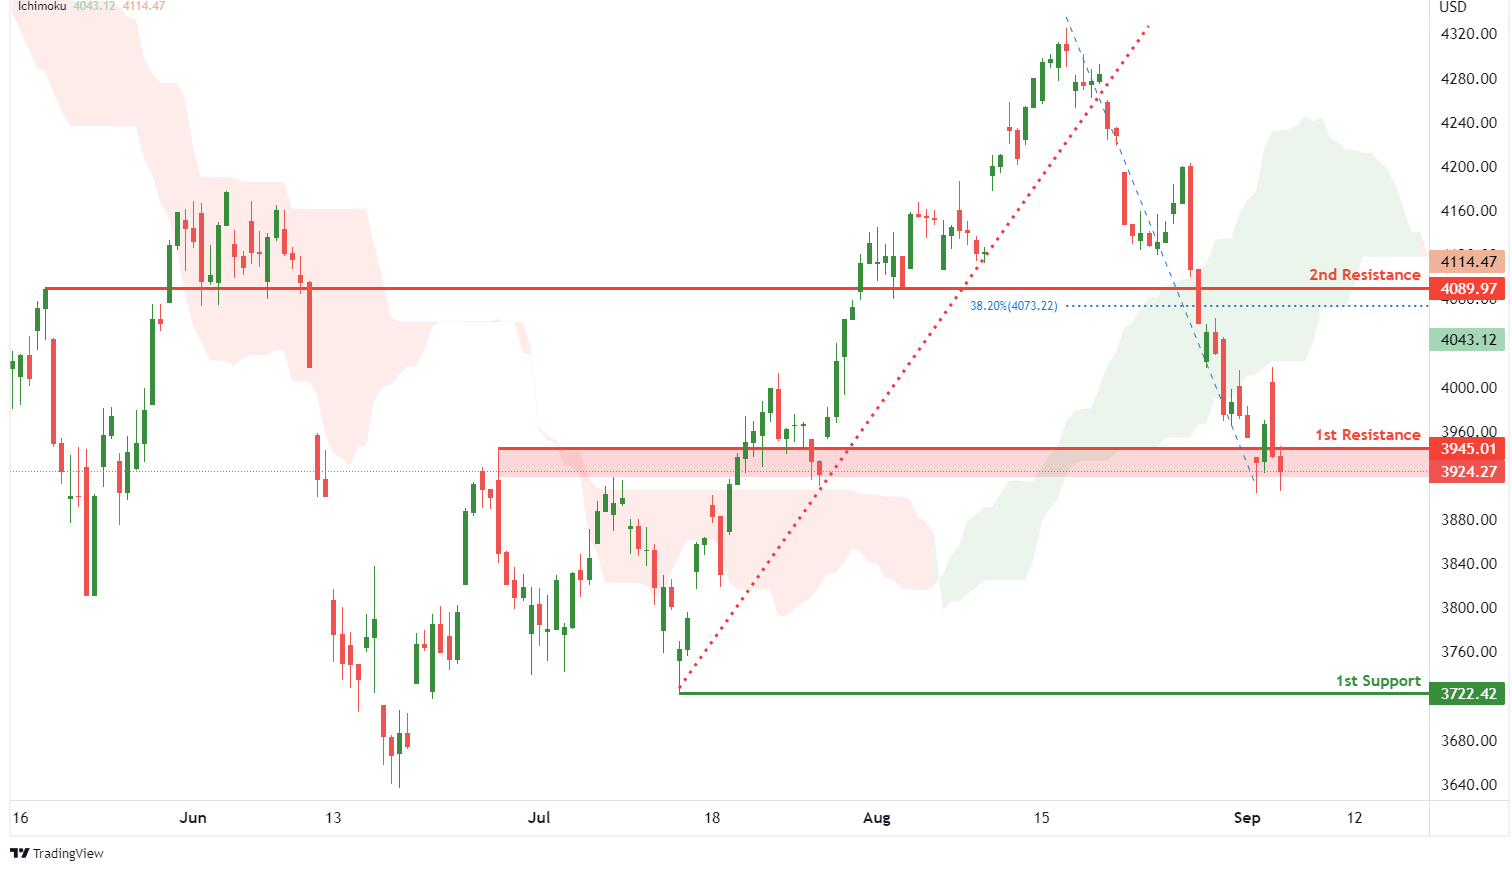
On the H4, with prices breaking out of the ascending trendline and moving below the ichimoku indicator, we have a bearish bias that the price will drop from 1st resistance at 3945.01 where the pullback resistance is to the 1st support at 3722.42 where the swing low support is. Alternatively, price could break 1st resistance structure and rise to 2nd resistance at 4089.97 where the pullback resistance and 38.2% fibonacci retracement are.
Areas of consideration:
- H4 time frame, 1st resistance of 3945.01
- H4 time frame, 1st support at 3722.42
EUR/USD Daily Outlook
Daily Pivots: (S1) 0.9925; (P) 0.9979; (R1) 1.0016; More...
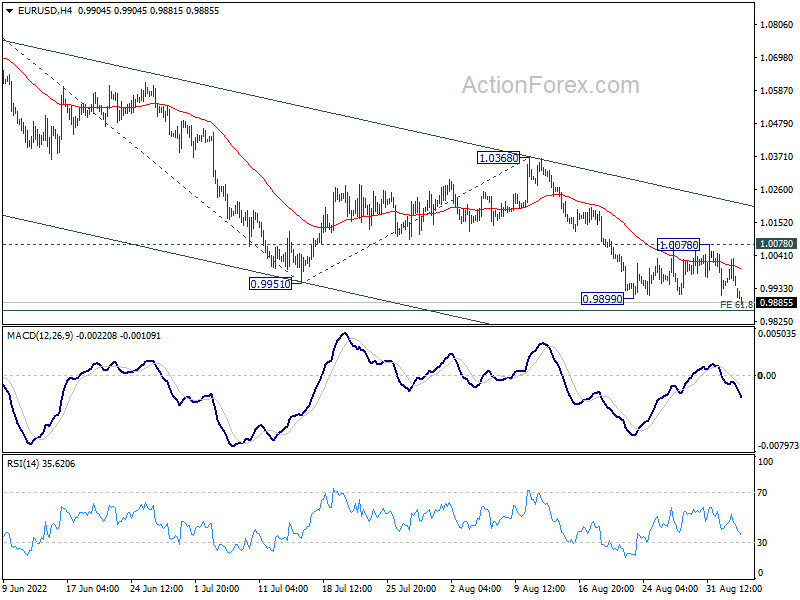
EUR/USD's down trend resumed by breaking 0.9899 low. Intraday bias is back on the downside for 61.8% projection of 1.0773 to 0.9951 from 1.0368 at 0.9860. Firm break there should prompt downside acceleration to 100% projection at 0.9546. On the upside, break of 1.0078 resistance is needed to indicate short term bottoming. Otherwise, outlook will remain bearish in case of recovery.
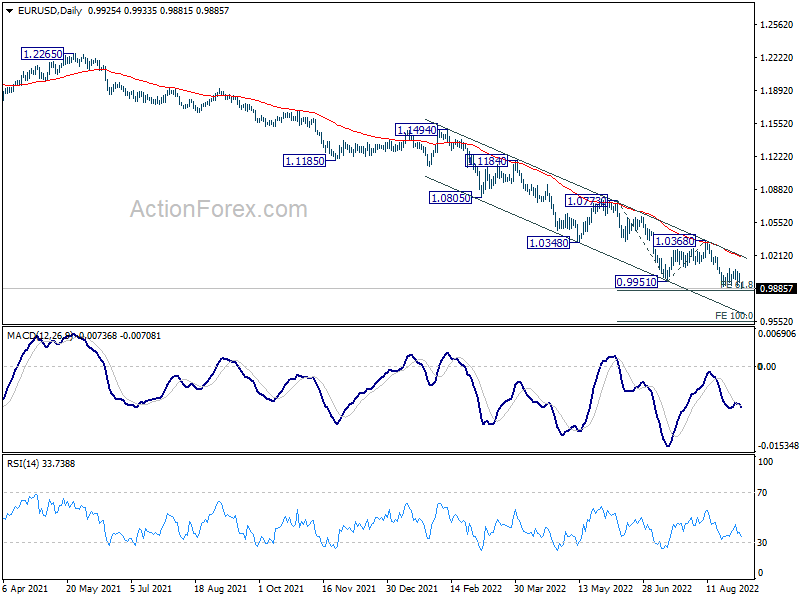
In the bigger picture, down trend from 1.6039 (2008 high) is still in progress. Next target is 100% projection of 1.3993 to 1.0339 from 1.2348 at 0.8694. In any case, outlook will stay bearish as long as 1.0368 resistance holds, even in case of strong rebound.
EUR/USD Downside Breakout; Focus on RBA, BoC and ECB This Week
The downside breakout in EUR/USD is finally here as markets focus turns to meetings of RBA, BoC and ECB. Dollar is rising broadly, and risk-off sentiment takes Yen and Swiss Franc higher too. Euro is starting to reverse some of last week's gain while Sterling is staying weak. Commodity currencies are currently mixed for now.
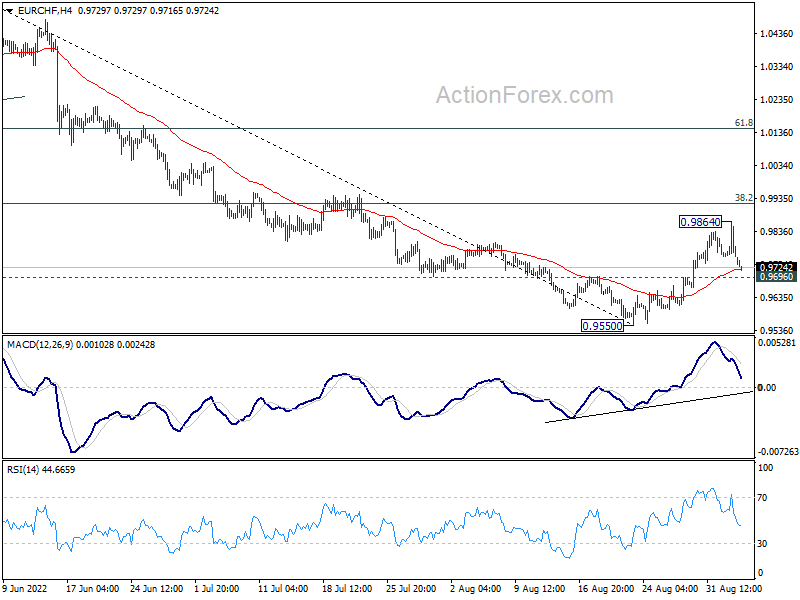
Technically, as Euro turns weak broadly, some attention will be on 0.9696 minor support in EUR/CHF. Break there will argue that corrective rebound from 0.9550 has completed at 0.9864. Larger down trend might be ready to resume through 0.9550 low in this case. If that happens, Euro could be dragged down further in other crosses.
In Asia, at the time of writing, Nikkei is up 0.03%. Hong Kong HSI is down -1.28%. China Shanghai SSE is up 0.10%. Singapore Strait Times is up 0.25%. Japan 10-year JGB yield is down -0.007 at 0.236.
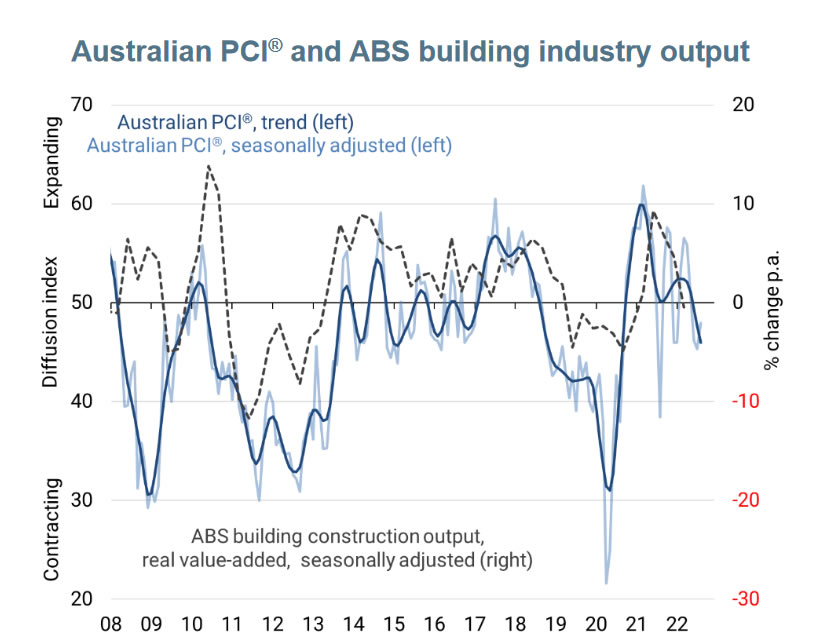
Australia AiG construction rose to 47.9, pull back continued
Australia AiG Performance of Construction Index rose 2.6 pts to 47.9 in August. Activity rose 3.5 to 46.2. Employment dropped -5.3 to 47.7. New orders rose 7.9 to 51.0. Supplier deliveries rose 3.4 to 45.6. Input prices dropped -1.2 to 92.6. Selling prices dropped sharply by -18.6 to 68.5. Average wages rose 1.2 to 77.6.
Peter Burn, Chief Policy Advisor at Ai Group said: "The pull back of the Australian construction sector continued in August with three of the four industry segments recording falls in activity and employment across the industry dropping in the month.... Builders and constructors link much of the fall in activity to rises in interest rates in recent months..... Softer demand was also reflected in the steep fall in the selling price index even though input prices and wage increases remain elevated."
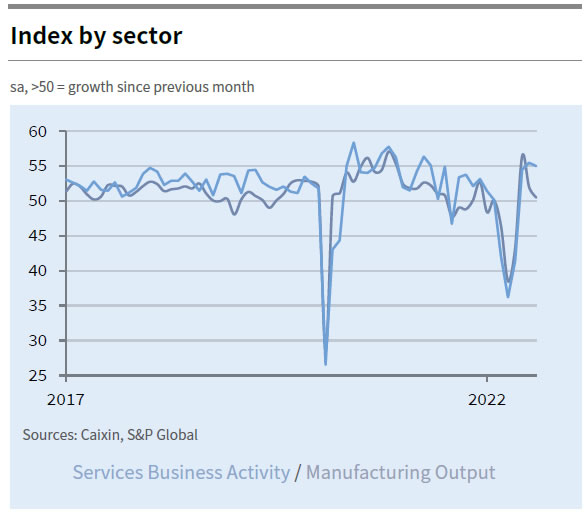
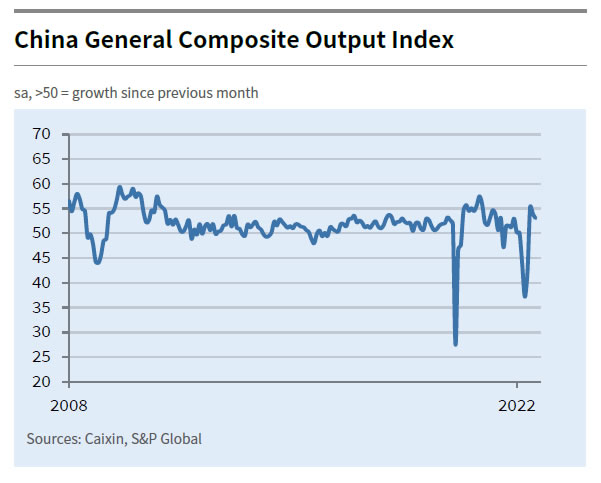
China Caixin PMI services dropped to 55 in Aug, PMI composite down to 53
China Caixin PMI Services dropped slightly from 55.5 to 55.0 in August, above expectation of 54.2. Caixin added that business activity growth held close to July's 15-month high. total new orders rose despite stronger fall in new export business. Optimism around outlook was highest since November.
Wang Zhe, Senior Economist at Caixin Insight Group said: "In August, the Caixin China General Composite PMI dropped to 53 from 54 the previous month. The reading, while marking the second straight monthly drop, remained in expansionary territory. Both supply and demand continued to expand, albeit at a slower pace, with services outperforming manufacturing. Employment remained weak and input costs experienced the slowest increase in 27 months. Market confidence remained stable."
RBA, BoC, and ECB to raise interest rates again
Three central banks are expected to raise interest rate this week. RBA should hike the cash rate by 50bps to 2.35%. While Governor Philip Lowe has recently indicated that the neutral rate for Australia is at least 2.50%, interest should be close enough to neutral after this week's move. So, the markets would be eager to get more hints on what next. It's unlikely for RBA to reveal much about the terminal rate. But there could be some twists in the statement to set the stage for a slower pace of tightening beyond neutral.
BoC is expected to raise interest by another massive 75bps to 3.25%. Rates should then be in restrictive region, with neutral considered by BoC as between 2-3%. There are some wild cards for the meeting. BoC could deliver the expected hike, and signal data-dependency for the path ahead, and slower tightening pace. Or BoC could deliver an even larger hike and signal a pause. The final result would be interest.
ECB is expected to raise the main refinancing rate by 50bps to 1.25%, as talked up by policymakers. The central will most likely maintain that further normalization of interest rates would be appropriate at upcoming meetings. It will maintain a meeting-by-meeting approach, and continue to be data-dependent. Meanwhile, the hints on what next will be delivered by the rhetorics of policymakers just before the next meeting, just it has been happening.
More on RBA, BoC, and ECB:
- Will Another 50bps Hike by the RBA Lift the Aussie?
- September RBA Preview and What Next for the AUDUSD
- RBA to Raise the Cash Rate by 50 Basis Points Next Week
- The Weekly Bottom Line: Canada – Full Steam Ahead to Hike Rates
- Job's Not Finished: Bank of Canada to Hike Rates Again
- New ECB Call – We Expect 75bp at the Meeting Next Week
Here are some highlights for the week:
- Monday: Australia AiG construction, retail sales; China Caixin PMI services; Swiss GDP; Eurozone PMI services final, Sentix investor confidence, retail sales; UK PMI services final.
- Tuesday: Japan average cash earnings, household spending; RBA rate decision; Germany factory orders; UK PMI construction; US ISM services.
- Wednesday: Australia GDP, AiG services; China trade balance; Japan leading indicators; Germany industrial production; Swiss foreign currency reserves; Eurozone GDP revision; Canada trade balance, Ivey PMI, BoC rate decision, ; US trade balance, Fed's Beige Book.
- Thursday: New Zealand manufacturing sales; Australia trade balance; Japan bank lending, current account, GDP final; Swiss unemployment rate; ECB rate decision;
- Friday: China CPI, PPI; France industrial production; Canada employment.
EUR/USD Daily Outlook
Daily Pivots: (S1) 0.9925; (P) 0.9979; (R1) 1.0016; More...
EUR/USD's down trend resumed by breaking 0.9899 low. Intraday bias is back on the downside for 61.8% projection of 1.0773 to 0.9951 from 1.0368 at 0.9860. Firm break there should prompt downside acceleration to 100% projection at 0.9546. On the upside, break of 1.0078 resistance is needed to indicate short term bottoming. Otherwise, outlook will remain bearish in case of recovery.
In the bigger picture, down trend from 1.6039 (2008 high) is still in progress. Next target is 100% projection of 1.3993 to 1.0339 from 1.2348 at 0.8694. In any case, outlook will stay bearish as long as 1.0368 resistance holds, even in case of strong rebound.
Economic Indicators Update
| GMT | Ccy | Events | Actual | Forecast | Previous | Revised |
|---|---|---|---|---|---|---|
| 22:30 | AUD | AiG Performance of Construction Index Aug | 47.9 | 45.3 | ||
| 01:00 | AUD | TD Securities Inflation M/M Aug | -0.50% | 1.20% | ||
| 01:30 | AUD | Company Gross Operating Profits Q/Q Q2 | 7.60% | 4.00% | 10.20% | 9.80% |
| 01:45 | CNY | Caixin Services PMI Aug | 55.0 | 54.2 | 55.5 | |
| 07:00 | CHF | GDP Q/Q Q2 | 0.40% | 0.50% | ||
| 07:45 | EUR | Italy Services PMI Aug | 48.3 | 48.4 | ||
| 07:50 | EUR | France Services PMI Aug F | 51 | 51 | ||
| 07:55 | EUR | Germany Services PMI Aug F | 48.2 | 48.2 | ||
| 08:00 | EUR | Eurozone Services PMI Aug F | 50.2 | 50.2 | ||
| 08:30 | EUR | Eurozone Sentix Investor Confidence Sep | -27.5 | -25.2 | ||
| 08:30 | GBP | Services PMI Aug F | 52.5 | 52.5 | ||
| 09:00 | EUR | Eurozone Retail Sales M/M Jul | 0.60% | -1.20% |
China Caixin PMI services dropped to 55 in Aug, PMI composite down to 53
China Caixin PMI Services dropped slightly from 55.5 to 55.0 in August, above expectation of 54.2. Caixin added that business activity growth held close to July's 15-month high. total new orders rose despite stronger fall in new export business. Optimism around outlook was highest since November.
Wang Zhe, Senior Economist at Caixin Insight Group said: "In August, the Caixin China General Composite PMI dropped to 53 from 54 the previous month. The reading, while marking the second straight monthly drop, remained in expansionary territory. Both supply and demand continued to expand, albeit at a slower pace, with services outperforming manufacturing. Employment remained weak and input costs experienced the slowest increase in 27 months. Market confidence remained stable."
Australia AiG construction rose to 47.9, pull back continued
Australia AiG Performance of Construction Index rose 2.6 pts to 47.9 in August. Activity rose 3.5 to 46.2. Employment dropped -5.3 to 47.7. New orders rose 7.9 to 51.0. Supplier deliveries rose 3.4 to 45.6. Input prices dropped -1.2 to 92.6. Selling prices dropped sharply by -18.6 to 68.5. Average wages rose 1.2 to 77.6.
Peter Burn, Chief Policy Advisor at Ai Group said: "The pull back of the Australian construction sector continued in August with three of the four industry segments recording falls in activity and employment across the industry dropping in the month.... Builders and constructors link much of the fall in activity to rises in interest rates in recent months..... Softer demand was also reflected in the steep fall in the selling price index even though input prices and wage increases remain elevated."
EUR/USD At Risk of More Downsides, Dollar Extends Increase
Key Highlights
- EUR/USD could accelerate lower if it breaks the 0.9900 support.
- A major bearish trend line is forming with resistance near 0.9990 on the 4-hours chart.
- GBP/USD remains in a bearish zone below the 1.1550 support.
- The Euro Zone Services PMI could remain stable at 50.2 in August 2022.
EUR/USD Technical Analysis
The Euro started a major decline from well above 1.0100 against the US Dollar. EUR/USD settled below the parity level to move into a bearish zone.
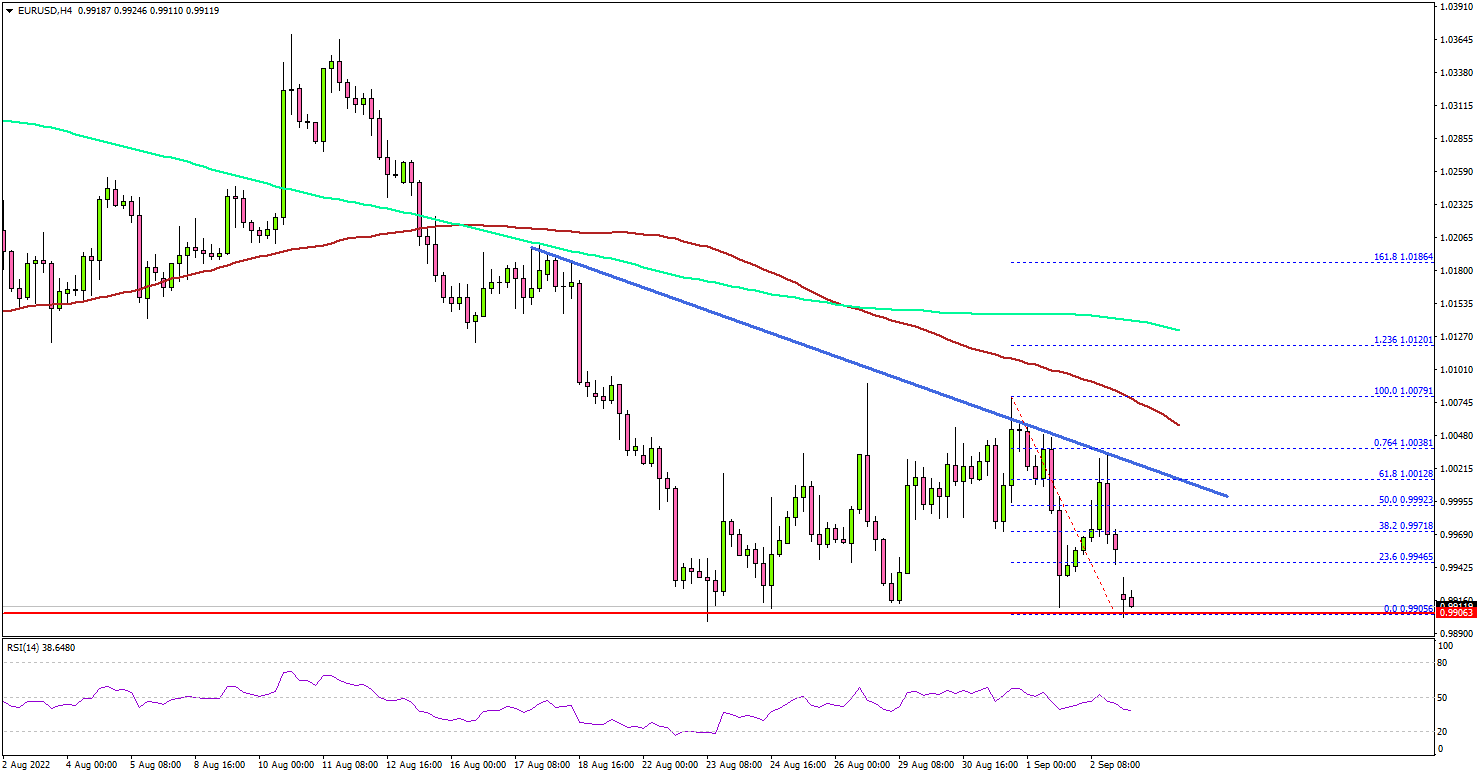
Looking at the 4-hours chart, the pair is showing bearish signs below the 1.0000 level, the 100 simple moving average (red, 4-hours), and the 200 simple moving average (green, 4-hours).
This past week, there was a minor upside correction from the 0.9900 support zone. The bulls were able to push the pair above the 0.9950 and 0.9980 resistance levels. The pair even climbed above the 1.0000 level, but it stayed below the 100 simple moving average (red, 4-hours).
A swing high was formed near 1.0079 and the pair started a fresh decline. It traded below the 1.0000 and 0.9950 support levels. There is also a major bearish trend line forming with resistance near 0.9990 on the same chart.
EUR/USD is now trading near the 0.9900 support zone. A downside break below the 0.9900 support might send the pair towards the 0.9850 support. The next major support is near the 0.9820 level. Any more losses might call for a move towards 0.9780.
On the upside, the pair is facing resistance near the 0.9980 level. The next major resistance is near the 1.0000 level, above which the pair might rise towards the 1.0080 level.
Looking at GBP/USD, the pair gained bearish momentum below the 1.1550 level and is showing bearish signs below the 1.1500 level.
Economic Releases
- Germany’s Services PMI for August 2022 - Forecast 48.2, versus 48.2 previous.
- Euro Zone Services PMI for August 2022 – Forecast 50.2, versus 50.2 previous.
- UK Services PMI for August 2022 – Forecast 52.5, versus 52.5 previous.
Eco Data 9/5/22
[php_everywhere instance="1"]