Sample Category Title
Ether Fights for the Trend
Market picture
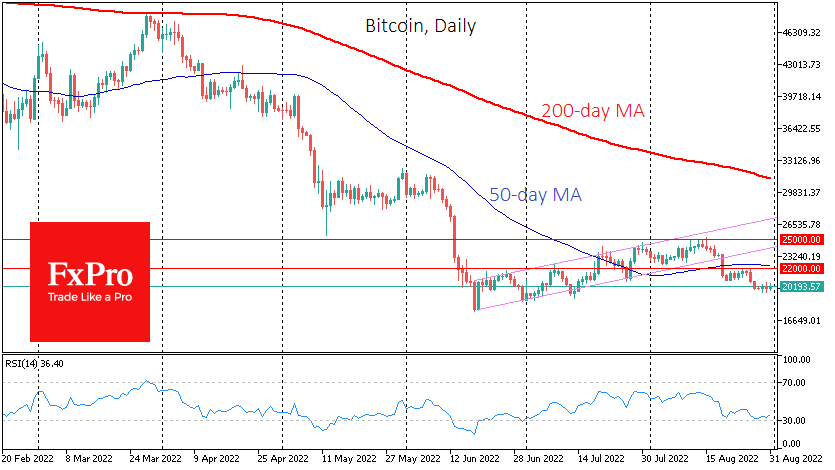
Bitcoin has stopped falling but has still not managed to gain strength to rise, remaining near $20K. Ethereum remains more interesting for buyers, increasing 1.6% overnight to above $1600. Top altcoins showed mixed dynamics: from a decline of 1.3% (Dogecoin) to a rise of 2.2% (Cardano).
Total crypto market capitalisation, according to CoinMarketCap, rose 0.2% overnight to $997bn. The Cryptocurrency Fear & Greed Index fell 4 points to 23 by Wednesday and moved into “extreme fear” status.
The upcoming move to proof-of-stake creates a speculative component to Ethereum’s dynamics. While in the short term, after September 6, there could be a “sell-through,” causing pressure on the price, in the longer term, such a transition will strengthen interest in using Ethereum for transactions, making them cheaper. This promises more interest in the coin, allowing it to remain “better than the market”.
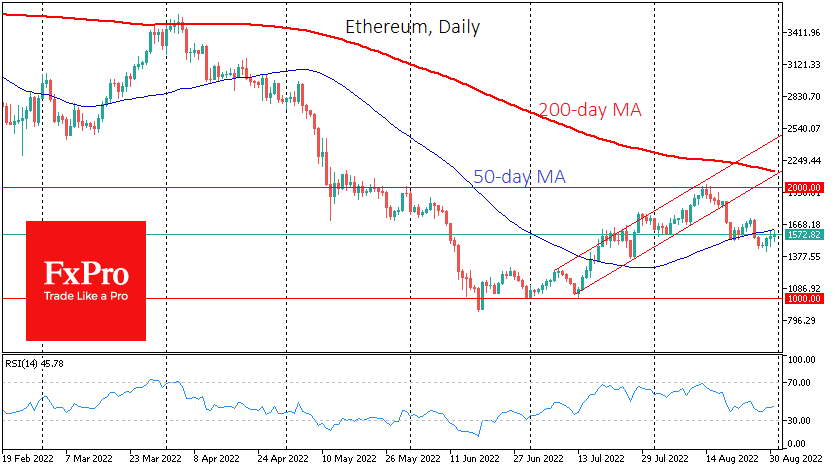
From the technical analysis perspective, ETHUSD is trying to get back above the 50-day average, which is an informal indicator of the medium-term trend. A consolidation above $1620, like in July, could be a prolonged rally with possible targets at $2000-2200 in the nearest future. The opposite is also true. A reversal down from this level will weaken bulls, as it did in February and April, triggering a new decline towards $1000.
News background
Some 5,000 BTCs, which have been in “hibernation” for the past 7-9 years, are on the move, said Look Into Bitcoin founder Philip Swift, citing data from the Whale Shadows indicator. Historically, such spikes in activity have preceded significant price declines.
A link has been established between the 10,000 BTC, which on August 29 went in motion for the first time since 2013, and the bankrupt cryptocurrency exchange Mt.Gox, a Telegram channel reported.
Meanwhile, the US Federal Bureau of Investigation has advised investors to be wary of investing in decentralised finance (DeFi) projects as they are too vulnerable to hacking.
Iranian authorities have approved a comprehensive law regulating cryptocurrency transactions. In particular, imports from abroad with payment in digital assets are allowed.
Bitcoin Reclaims $20,000 after Jackson Hole Bloodbath
On Friday, Bitcoin and major altcoins plummeted but did not approach their 2022 lows, after Jerome Powell restated the Fed’s commitment to tame inflation at any cost and warned against premature loosening at the Jackson Hole symposium. Surprisingly, Bitcoin exhibited some resilience and quickly clawed back above the $20,000 level, despite the widespread stock market weakness. Do these indications suggest that crypto markets have hit a tough floor?
Hawkish Fed weighs on cryptos
Despite the growing optimism in the past two months, Jerome Powell’s latest comments at the Jackson Hole symposium pushed back expectations of a slower monetary tightening pace, sending a clear message to markets that a ‘Fed pivot’ is not on the cards. Powell outlined that the Fed would keep hiking interest rates for as long as it takes to bring inflation under control, while acknowledging that this aggressive approach will most likely cause financial distress in households and businesses.
In turn, markets flooded with risk-off sentiment as investors braced themselves for rate hikes even into a recessionary period. Consequently, both the 2- and 10-year US Treasury yields spiked in multi-year highs, inflicting severe damage to risky assets. Specifically, the crypto space received a significant blow, with the global market capitalisation dipping below the $1 trillion barrier for the first time since January 2021.
Are cryptos stocks on steroids?
Even though Bitcoin fell in tandem with equity markets, it quickly bounced back above the crucial $20,000 psychological mark, whereas stocks extended their retreat. Interestingly, digital coins exhibit smaller swings than stocks in a period where negative risks in crypto markets are increasing. For instance, Powell’s hawkish remarks sent the famous Bitcoin Fear and Greed index back into the ‘extreme fear’ territory.
Moreover, seasonal trends suggest that September is historically the worst month for Bitcoin prices as they have experienced a drop of about 10% on average over the last five years. To make matters worse, cryptocurrencies have never faced an environment of rising interest rates and high inflation so far, with both themes being negative for their performance.
To sum up, Bitcoin’s mild rebound and consolidation, in a period when stocks keep losing ground, could endorse the scenario that the bottom in crypto space is close. Nevertheless, investors should keep in mind that cryptocurrencies are currently trading closer to their 2022 lows than equities are, thus the downside potential for stocks is actually higher.
Bitcoin seeks direction
Taking a technical look, Bitcoin has been rangebound in the last couple of sessions after it managed to cease its post Jackson Hole decline.
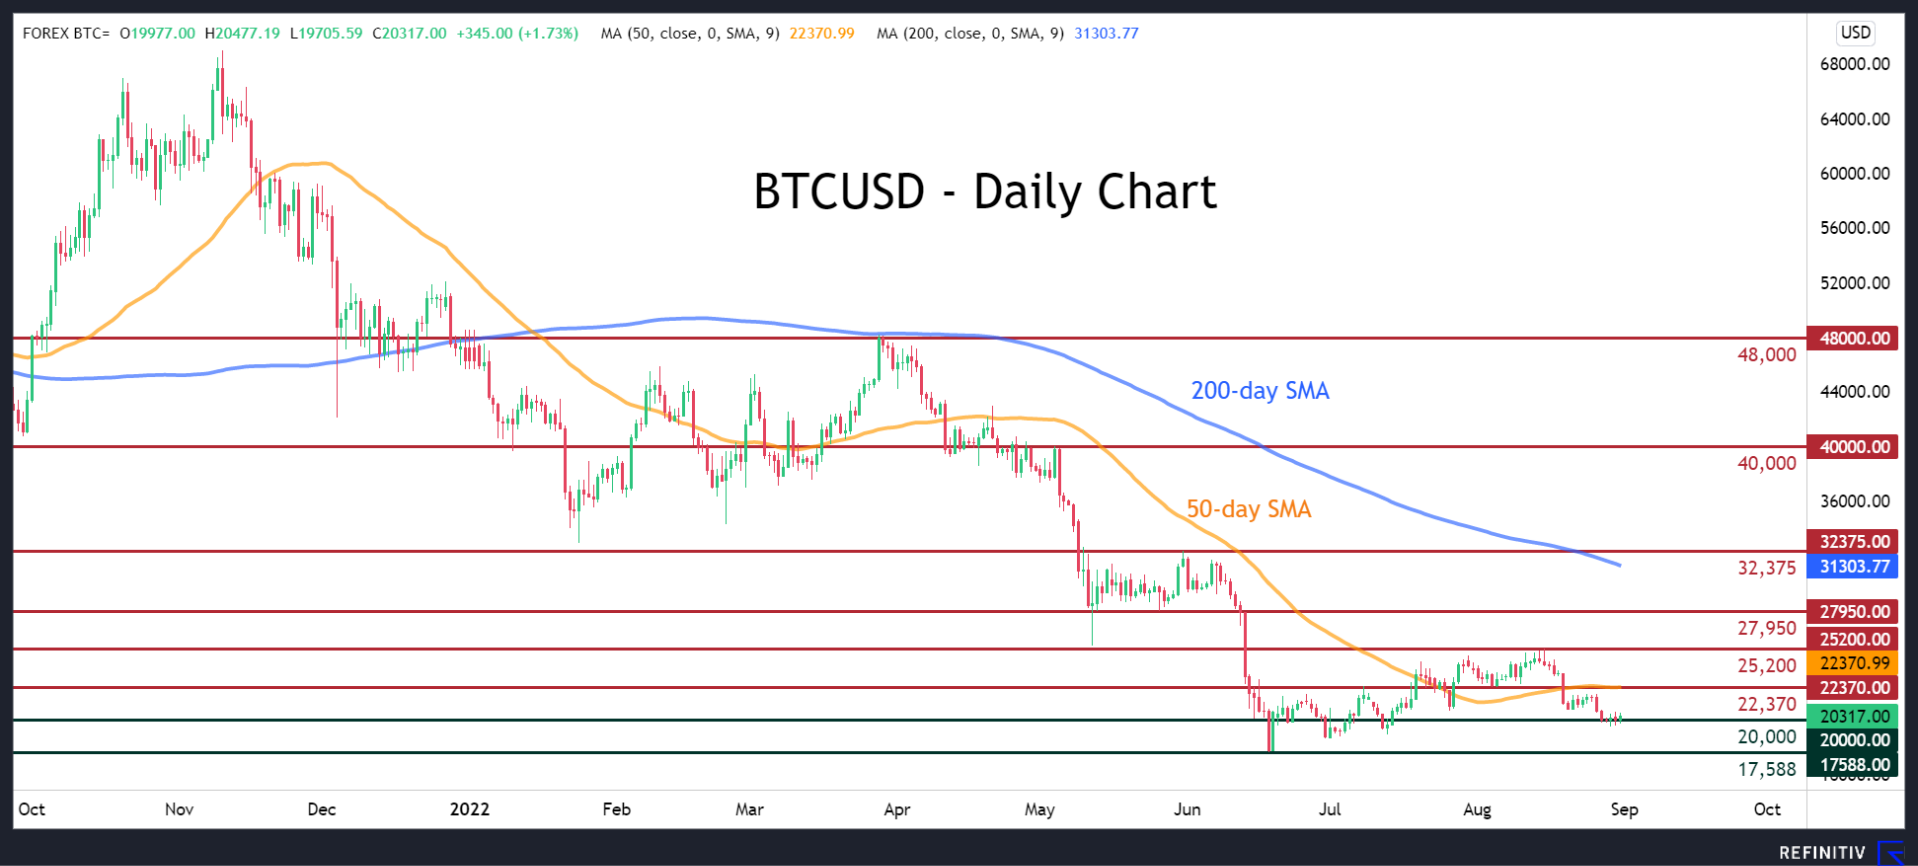
If selling pressures intensify, the price could decline to test the crucial $20,000 psychological mark. Sliding beneath that floor, the spotlight would turn to the 2022 low of $17,588.
On the flipside, bullish actions could propel the price towards the 50-day simple moving average (SMA), currently at $22,370. Even higher, any further advances could stop at the recent high of $25,200.
Eco Data 9/1/22
[php_everywhere instance="1"]
WTI Oil: Oil Falls on Renewed Demand Concerns; Bull-Trap and Bearish Engulfing Add to Negative Signals
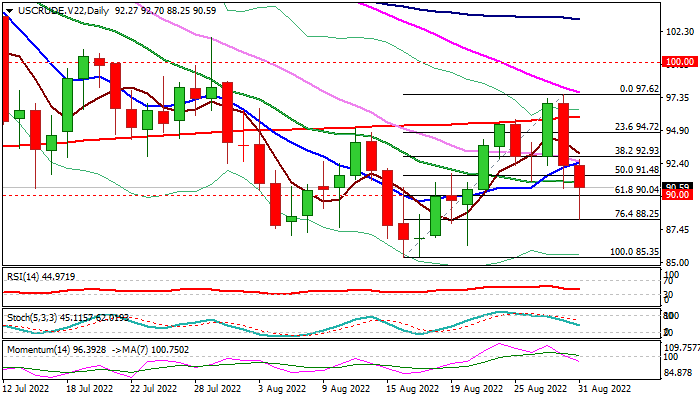
WTI oil price is down for the second day and probes below $90 level, under renewed pressure from rising concerns about the state of global economy, rise in OPEC oil output in August to the highest since early period of pandemic in 2020 and s slowdown in the activity in China’s manufacturing sector, due to restrictions on the latest Covid outbreak that all contribute to growing concerns about global demand.
Weakening structure in daily technical studies, as falling 14-d momentum indicator moved into negative territory and formation of a bull-trap on a false break above 200DMA and Tuesday’s formation of bearish engulfing pattern, add to negative signals.
Cracked $90 round-figure support also marks Fibo 61.8% of $85.35/$97.62 upleg, with close below here to confirm reversal and open way for retest dented $88.25 support (Fibo 76.4%) and risk drop to seven-month low at $85.35 (Aug 16 low).
Near-term action should stay below daily Tenkan-sen ($91.94) to keep bears intact.
Res: 91.48; 91.94; 92.70; 92.93
Sup: 90.00; 88.25; 87.00; 86.27
German, Swiss Retail Sales for July, and Potential Improvement
Retail sales are back to the forefront of analysts' minds. Especially now in Europe, with the ECB raising rates. On the one hand, traders would like to be wary of any signs of demand destruction that could mean weaker currency going forward. On the other, tighter policy could be slowing the economy, which could also weaken the currency.
But, if retail sales beat expectations, it could help return some confidence in the economic outlook. The markets have already priced in a full 50bps hike by the ECB next week, with over half of economists expecting as much as 75bps. Better economic prospects could support the idea that the central bank has plenty of room to keep tightening.
Germany to the forefront
German retail sales are particularly important for the Eurozone not just because it's the biggest country in the Area. Germany has been experiencing less inflation than the periphery, despite its dependence on imported energy. The implication is that if retail sales are affected in Germany, they might be even worse in the rest of the common economy, which has higher debt issues.
Saving rates in Germany have started to fall, but remain higher than in prepandemic levels. Higher saving rates have correlated with lower inflation. People putting money into savings instead of spending it reduces demand pressure. If savings rates fall, or credit levels increase, it could imply further increases in inflation. That might give the ECB more reason to tighten policy.
Interpreting the data
The disparate situation between Germany and Switzerland might highlight the market reaction. While Swiss inflation remains above target, but not as bad as Germany, the SNB is under significantly less pressure to raise rates. Retail sales, therefore, have more room for expansion. While this could imply a weaker franc, the reality is that the difference in inflation expectations means real rates in Switzerland are much higher than in Germany.
Improving (or less negative) retail sales sends the signal that prices can keep rising, and raise inflation expectations. Coming on the heels of higher than expected CPI figures earlier today, it could increase the bets that the ECB will raise rates. But the calculus for the SNB is likely to remain the same.
What to look out for
German July monthly retail sales are expected to come in flat, compared to -1.6% in the prior month. Just a decimal higher could push the figure into the psychologically important "positive" category, and might spur a bigger market reaction. On the other hand, that the shorter term figure is improving, might give the impression that the situation in Germany is not as bad as initially feared. Particularly when considering that the annual figure is comparing to last year when there was relief buying during the summer. Annual change in retail sales for Germany is forecast at -6.5% compared to -8.8% prior.
Swiss July retail sales are expected to be somewhat the opposite, with monthly figures forecast to drop -0.2% compared to 0.1% growth. Annual change in retail sales is projected to slow to just 0.3% compared to 1.2% reading in June.
Sunset Market Commentary
Markets
Yesterday, last week’s repositioning on US and European interest rate markets simply continued with European markets again underperforming. Chair Powell on Friday was very clear that the Fed will do ‘whatever it takes’ to bring inflation back to the 2.0% target, even as that may cause pain in terms of lower growth and higher unemployment. US yields rose further between 2.7 bps (2-y) and 6.2 bps (10-y). Interestingly, the move this time wasn’t the usual bear flattening that often dominated recent repositioning. Is the faster pace of QT in September weighing on bonds with longer maturities? Technical considerations might also be in play as the US 2-y yield is retesting the cycle top near 3.42%. Anyway the rise in US yields was fully driven by higher real yields. EMU swap yields jumped between 15.3 bps (2-y), 11.9 bps for the 10-y yield and 4.9 bps for the 30-y. The 2-y swap jumped above the 2.0% June top to close at a new cycle peak of 2.08% after hawkish ECB members on Friday and over the weekend started the debate on a 75 bps rate hike at next week’s meeting. ECB’s Lane isn’t in the camp of this kind aggressive frontloading yet and prefers a gradual/protracted approach to minimize negative consequences. Still current market pricing sees a chance of 75% of a 75 bps hike rather than a 50 bps step. The (broad) tightening of monetary conditions that the Fed is aiming for also continued via equity markets. US indices again lost up to 1.0% (Nasdaq). The EuroStoxx50 declined 0.92%, but a correction in European gas prices helped equities to close off the intraday lows. The dollar is holding strong, but a clean break higher didn’t occur (yet?). DXY touched a minor cycle top at 109.47, but gains couldn’t be sustained (close 108.83) despite the rise in US real yields. USD/JPY (close 138.72) also just missed the July top. The euro gains some reprieve from the catching up move in European yields (EUR/USD close 0.9997).
Asian equities this morning mostly trade in positive territory with China underperforming (-0.75/-1.0%). The PBOC with a stronger than expected fixing is again leaning against recent yuan depreciation. Still the onshore yuan weakens slightly further to USD/CNY 6.9165. Later today, the calendar is well filled with the preliminary German (and Spanish) August inflation, the EC confidence indicators, US house prices and consumer confidence (Conference Board). The Bund future gains some ground on a (mildly) softer than expected North Rhine Westphalia CPI. However, there is still a decent chance for the Y/Y figure to return to (or above) the 8.7% May top (HICP) . In a data-dependent approach, this leaves a solid case for bold frontloading ECB action. For now, we don’t anticipate a sustained correction to the established trend of higher US and European yields. On FX markets, the dollar apparently needs a clear sign to break beyond recent cycle peak levels. Maybe some consolidation might be on the cards with Friday’s payrolls a potential trigger to decide on the next directional move. The euro probably isn’t out of the woods yet, but a further correction in the gas price might help to keep the EUR/USD pair away from the 0.99 short-term.
News Headlines
European Commission President von der Leyen said that the EU was working on emergency intervention measures as well as structural reforms to the power market. She pointed to decoupling electricity prices from the gas price with the exorbitant surge of the latter influencing the former. The EU also wants to ensure that renewable energies are generated at lower costs, that those costs are transferred to consumers and that windfall profits are used to help vulnerable households. Von der Leyen wants those emergency instruments to be triggered very quickly, perhaps in weeks. The announcement helps explain yesterday’s setback in gas prices with the reference Dutch TTF future dropping 15% after last week’s test of the YTD high set in the wake of the start of the Russian invasion.
The Fed’s balance-sheet roll-off (Quantitative Tightening) is set to hit max speed. From Thursday, monthly caps for maturing assets will be raised to $60bn for Treasuries and $35bn for mortgage-backed securities. If the Fed’s portfolio doesn’t allow for such amounts, it will use its $326bn T-bill portfolio to make up for what’s left. More specifically, we’re already looking at $16.4bn of Bills in September and $13.6bn in October.
NZDUSD Gets Closer to the 0.6060 Support Zone
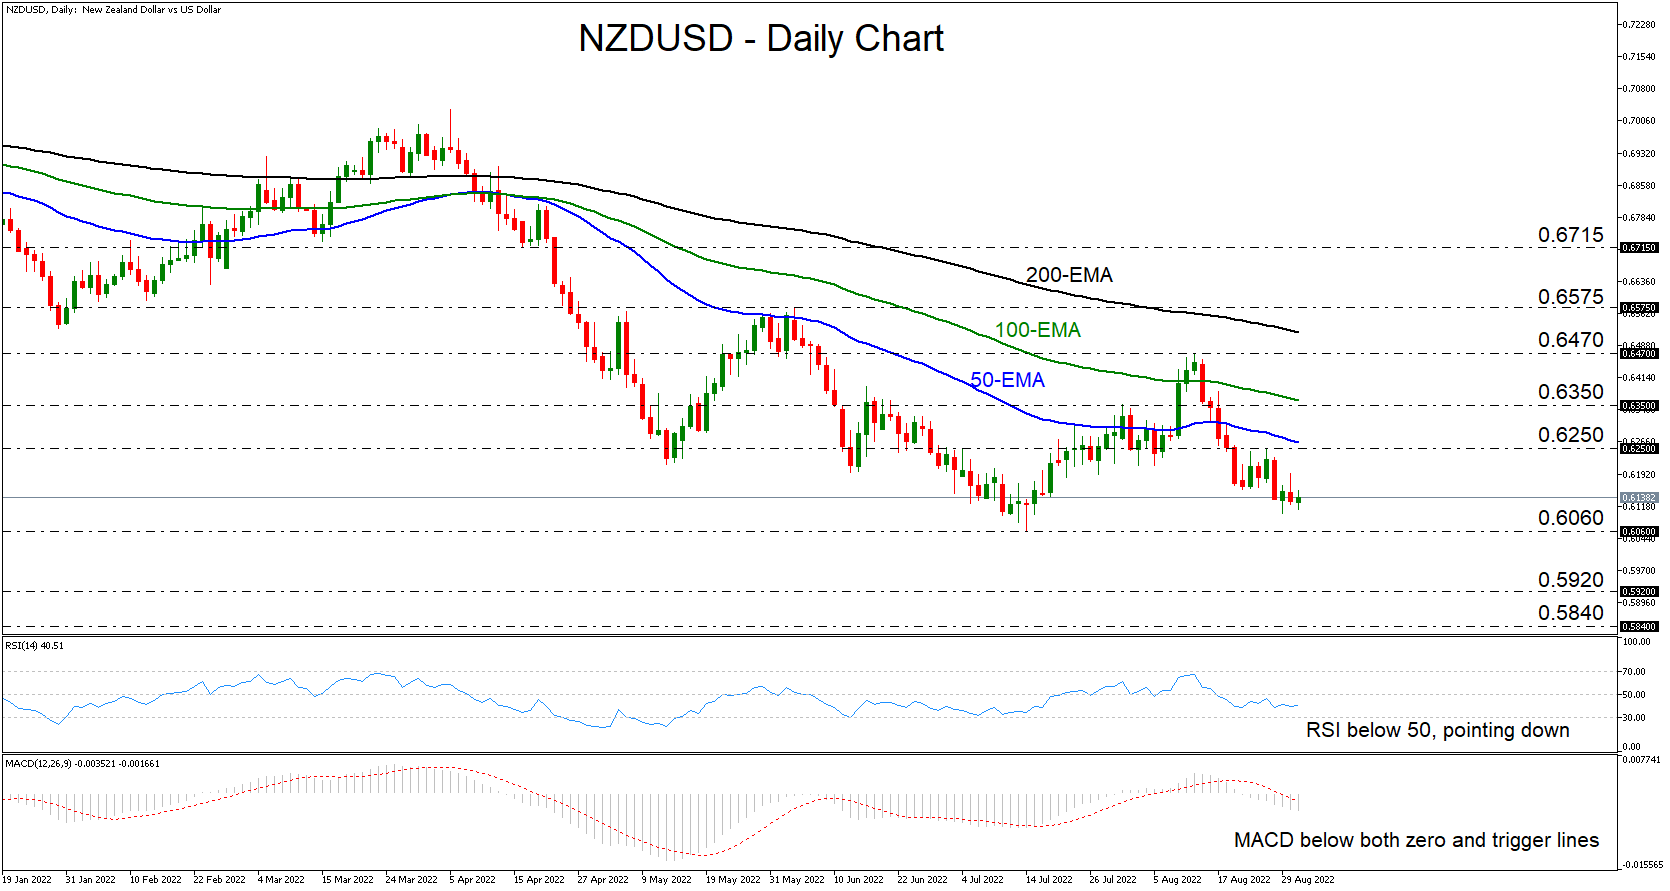
NZDUSD has been sliding since August 12, when it hit resistance at 0.6470, with the price now getting closer to the 0.6060 support zone, marked by the low of July 14. In the bigger picture, the pair has been in a downtrend since February 2021, and thus, there may be decent chances for the pair to break below 0.6060 soon.
The daily oscillators are also supporting the notion of further declines. The RSI lies below 50 and points down, while the MACD runs below both its zero and trigger lines.
A clear and decisive dip below 0.6060 would confirm a forthcoming lower low on bigger timeframes and take the pair into territories last seen in May 2020. That could encourage the bears to dive towards the 0.5920 area, which acted as a temporary floor in April and May 2020, and if they are not willing to stop there, they may push towards the 0.5840 barrier, defined as a support by the low of April 3.
On the upside, the outlook could become brighter upon a break above the August 12 high, at 0.6470. A higher high will be confirmed on the weekly chart and the advance may continue towards the high of June 3, at 0.6575. If that obstacle is not able to stop the bulls either, then extensions towards 0.6715 may be triggered. That zone is marked by the inside swing lows of April 18 and 19.
To sum up, NZDUSD is in a broader downtrend, with the latest impulsive wave approaching the 0.6060 support. A break below that barrier will confirm a forthcoming lower low and thereby a trend continuation.
Canada’s GDP Continues to Outperform Global Peers
The Canadian economy expanded by 3.3% quarter/quarter annualized (q/q) in Q2 2022. Meanwhile, the flash estimate for July showed a 0.1% month/month (m/m) drop in GDP.
Spending by households increased by 9.7% q/q annualized. Statistics Canada noted that this was "driven by spending on garments and footwear, household spending on semi-durable goods rose 5.6% in the second quarter." They also stated that "the increase was largely attributable to increased travel and many people returning to the office."
The report noted that "the opening of the economy also boosted outlays for services (+3.9%) in the second quarter—the eighth consecutive quarterly increase." The major contributors were travel abroad, food and non-alcoholic beverage services, air transport, alcoholic beverage services, games of chance, and accommodation services."
Gross capital formation declined 9.0% q/q annualized, driven by a 27.6% drop in residential structures following the Bank of Canada's move to more aggressive policy rate hikes. On the opposite side, investment in non-residential structures and machinery and equipment rose 13.9% q/q annualized. Statistics Canada noted, "with projects such as Kitimat Liquified Natural Gas in British Columbia and higher capital spending in oil and gas in Alberta, businesses continued to invest in engineering structures in the second quarter."
Business investment in inventories was a big driver, contributing 1.5% to GDP. The report stated that "non-farm inventory investment was bolstered mainly by increases in wholesale durables (machinery and building supplies), non-durables (fertilizers), and manufacturing durables (machinery and aircraft)".
Key Implications
Canada's economic outperformance continues. With GDP figures around the world raising recession fears, Canada's data are still looking pretty good. At 3.3% q/q annualized, this is the fourth straight quarter of above trend economic growth. Though the inventory build was the biggest contributor to growth, the contribution coming from Canadian consumers points to still strong underlying fundamentals.
Looking forward, the July flash estimate of -0.1% m/m is reflective of a deceleration that was always expected now that the economy has reached beyond full capacity. Not to mention, the impact of high inflation and the BoC's surprise 1% rate hike in July are starting to have an impact. We are already seeing this in residential investment but are expecting a greater impact on the consumer going forward. Given our expectation that the BoC will continue to raise rates at an aggressive pace next week, a slowing to below trend growth for Q3 is in the cards.
Euro Inflation Rises, But Euro Yawns
The euro continues to have a calm week. In the North American session, EUR/USD is showing little movement as it trades a whisker above the parity line.
Eurozone inflation tops 9%
Inflation in the eurozone continues to move higher. In August, CPI rose to 9.1%, up from the July gain of 8.9%, which was a record high. Core inflation climbed to 4.3%, up from 4.0%. With both the headline and core readings exceeding the forecast of 9.0% and 4.1%, respectively, there will be additional pressure on the ECB to tighten policy more at an accelerated pace. The central bank has been slow to shift its accommodative policy, which was in place for years in order to support the eurozone economy.
The ECB now finds itself playing catch-up with inflation, and is also far behind in the tightening cycle compared to other major central banks, with a benchmark rate of just 0.50%. Inflationary pressures remain broad-based, which means inflation is well-supported and unlikely to decline anytime soon. The eurozone inflation report comes just a day after Germany, the largest economy in the bloc, reported that August inflation jumped to 7.9%, up from 7.5% in July and nudging above the forecast of 7.8%. The central bank meets next on September 8th, and there is a strong possibility that the ECB could come out with guns blazing and deliver a super-size 75 basis point increase.
A potential energy crisis in Europe continues to hover like a dark cloud, and the uncertainty over whether Moscow will weaponise energy exports remains a massive concern. The Nord Stream 1 pipeline has been shuttered for a scheduled three-day maintenance, but there are fears that Russia will find some excuse and not renew gas flows on Saturday. Any disruptions would likely push European gas prices even higher. In the meantime, the waiting game is on, with Western Europe on edge while it anxiously waits for the gas taps to be turned back on.
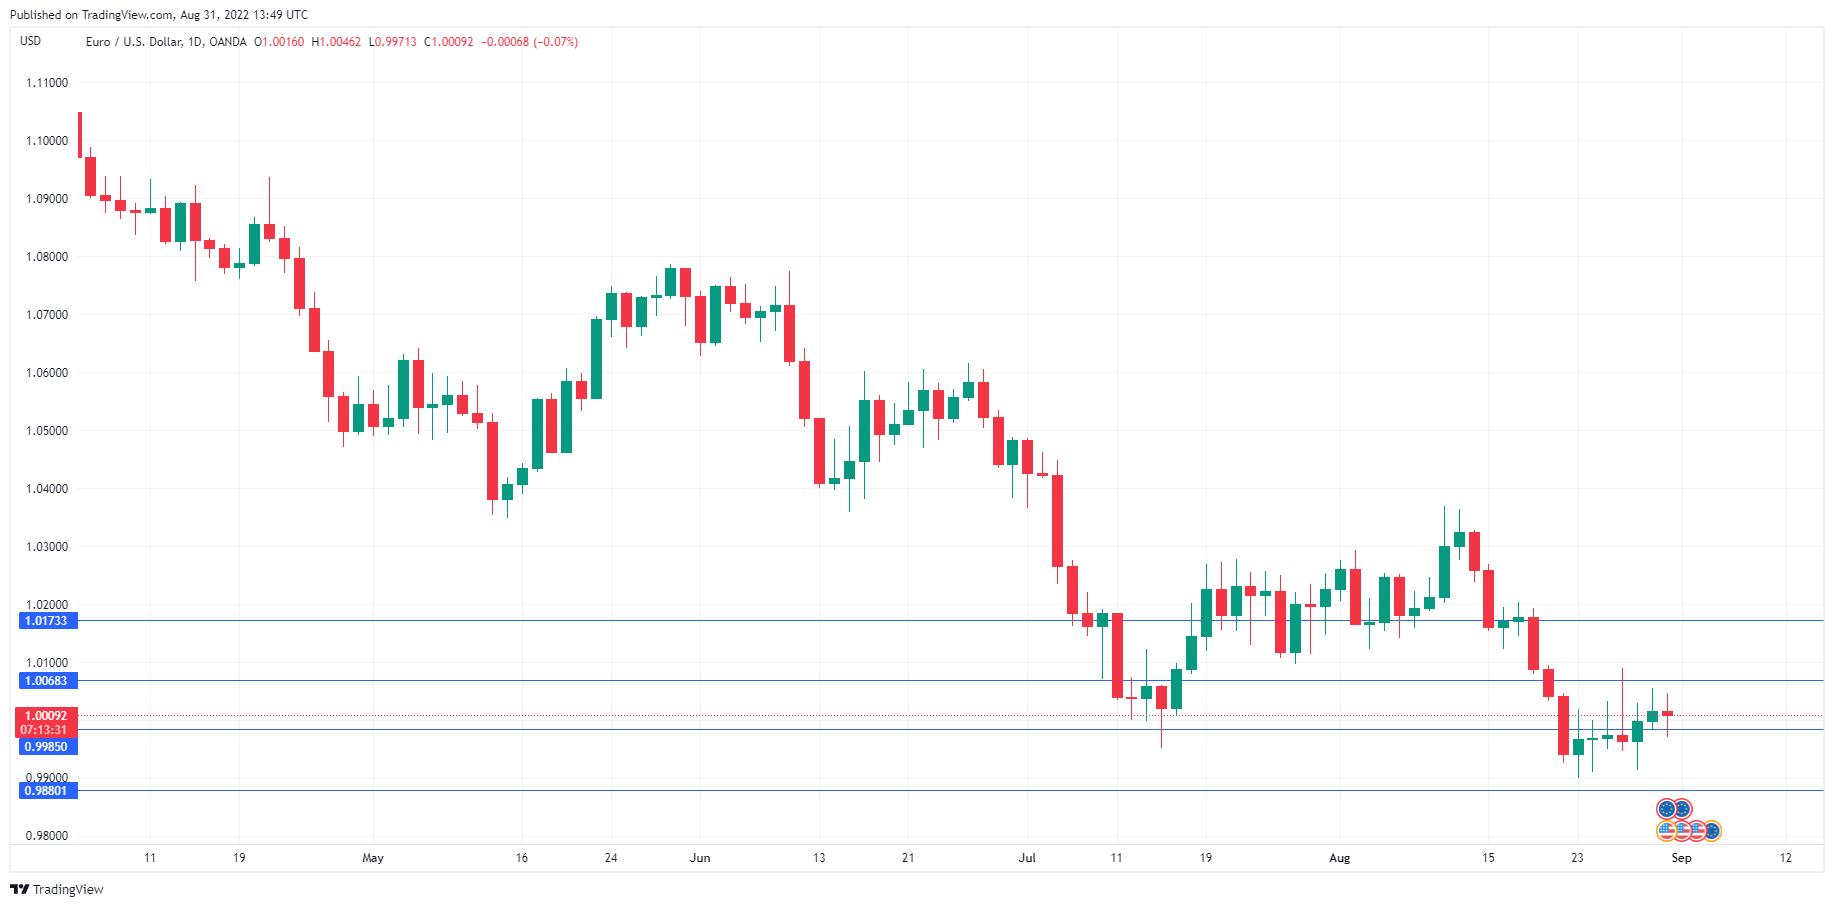
EUR/USD Technical
- EUR/USD has support at 0.9985 and 0.9880
- 1.0068 is a weak resistance line, followed by 1.0173
USD/JPY Mid-Day Outlook
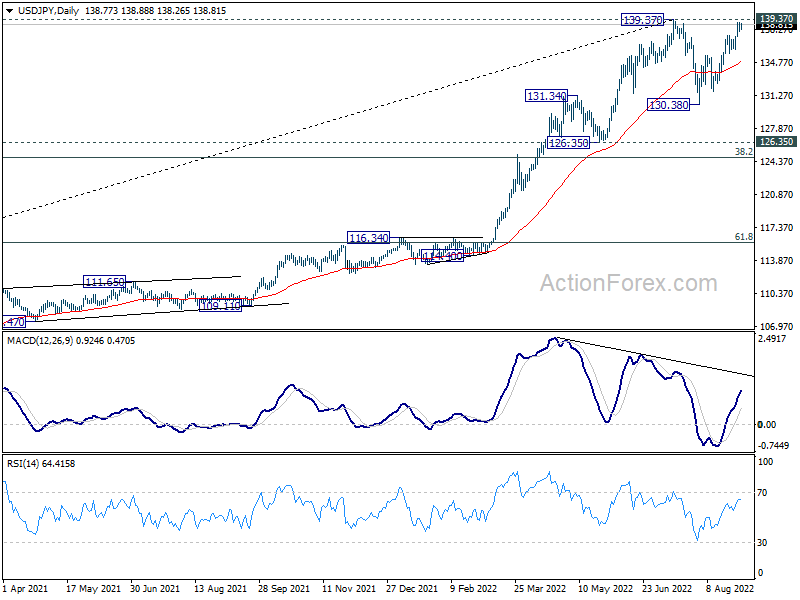
Daily Pivots: (S1) 138.21; (P) 138.64; (R1) 139.23; More...
Intraday bias in USD/JPY remains neutral and outlook is unchanged. Strong resistance could be seen from 139.37 to limit upside, to start the third leg of the corrective pattern from 139.37. Break of 136.17 minor support will turn bias back to the downside for 130.38 support. Nevertheless, decisive break of 139.37 will confirm up trend resumption for 147.68 long term resistance.
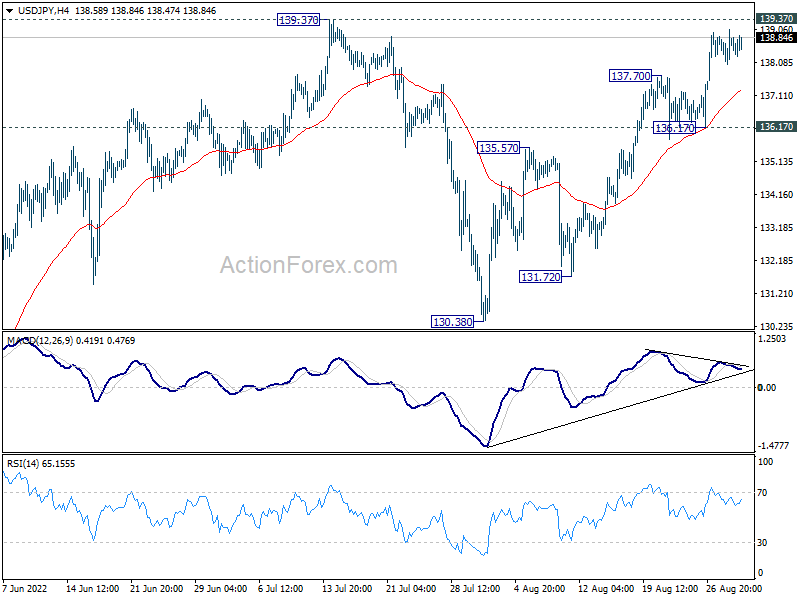
In the bigger picture, price actions from 139.37 medium term top are seen as a corrective pattern to up trend from 101.18 (2020 low). While deeper decline cannot be ruled out, outlook will stays bullish as long as 55 week EMA (now at 123.72) holds. Long term up trend is expected to resume through 139.37 at a later stage, after the correction finishes. Next target is 147.68 (1998 high).