Sample Category Title
Equities Extend Losses on Soft ADP Report
Good news is bad news, as good economic data supports the idea that the US economy could withstand an aggressive monetary policy tightening, therefore has a boosting effect on the US yields, and a negative effect on equity valuations.
But, bad news is also bad news, as the Federal Reserve (Fed) is so determined to bring inflation down, that it is ready to accept a certain slowdown in economy, and the jobs market.
This is why yesterday’s softer-than-expected NFP data didn’t please investors much. The data showed that the US economy added 132’000 new private jobs in August. That was less than about 300’000 expected by analysts.
If Friday’s NFP data shows a similar slowdown in the US jobs market, we will start talking about a potential shift from super-resilient job growth to something more understandable, and more in line with the actual tightening macroeconomic conditions.
And this is something that the Fed ultimately wants to achieve, because a cooler jobs market should also lead to cooler inflation.
Equities extend losses
The three major US indices extended losses yesterday. The S&P500 lost close to 0.80%, Nasdaq dropped another 0.56%, while the Dow Jones was the most heavily hit.
Even the energy stocks couldn’t weather yesterday’s selloff, as crude oil fell close to 4%. The barrel of American crude is again below the $90 level on growing global recession worries and prospects of lower demand.
But if you ask OPEC, the decline in oil prices is due to the disconnect between the reality and the financial markets. So, if we see further declines, they will certainly remind us how tight the oil market could be, no matter how much the global demand slows.
Why inflation doesn’t boost the euro, as much as it boosts the US dollar?
The US dollar index remained strong despite the soft ADP data yesterday, showing how much the employment data doesn’t matter for the Fed expectations. High inflation continues fueling the US dollar, but the same is not true for other currencies like the euro and sterling. Eurozone and Britain are also dealing with skyrocketing consumer prices, but we can’t really say that their currencies are benefiting from that.
The European Central Bank (ECB) for example hiked its policy rates by a 50bp at its last meeting and is now expected to hike by a turbo 75bp in September, as the flash CPI read yesterday revealed that inflation in the Eurozone advanced past the 9% mark in August. The market now gives 60% probability for a 75bp hike.
But no one is impressed, as the Fed is also expected to hike by 75bp this month. Therefore, the ECB must do something bigger to get the market by surprise and to reverse the negative trend in the euro.
And that’s not a piece of cake. European policymakers can’t just raise the rates when the continent is dealing with a deepening energy crisis. It was much easier to shoot the rates to the ground than bringing them back on feet.
As such, even with the rising inflation and the hawkish expectations regarding the ECB policy, the euro is expected to extend losses below parity against the US dollar, simply because the Fed hawks have stronger muscles than the ECB, or the BoE hawks. As a result, the higher inflation doesn’t necessarily lead to a higher euro or a higher sterling. CQFD.
It's also important to note that in period of high stress, like the one we are going through today with the pandemic, the war and the energy crisis, the US dollar becomes the go-to asset of investors.t The dollar also amassed the safe haven flows since last year, especially given that the sovereign bonds and gold couldn’t offer the protection that investors were looking for.
But, we also know that what goes up must come down. There should be a downside correction in the USD, but when, is the million-dollar question.
Global Manufacturing Slowdown
Market movers today
Manufacturing PMIs for August are released in a range of countries. We expect a further drop in Swedish PMI manufacturing from July's 53.1 in line with the drop in the euro area flash PMIs.
In the US, ISM manufacturing for August should probably remain above 50, although PMIs have pointed to downside risks.
German retail sales for July will give further insights into how consumers adjust spending in light of higher prices, since the last two months have already shown increasing signs of weakness in retail spending.
In Norway it will be very interesting to see whether the labour market is cooling or tightening further, while we look for a moderate fall in PMI manufacturing to 52.5.
The 60 second overview
European inflation: Euro area inflation took another leg higher, as October HICP inflation reached 9.1%, driven by core inflation and food. With higher gas and electricity prices yet to fully feed through to consumer prices, we doubt that we have seen the inflation peak in the euro area yet and overall yesterday's figures strengthen the case for a 75bp hike from ECB next week.
Asian manufacturing is slowing. Chinese private Caixin PMIs declined to 49.5 in August from 50.4 in July, short of expectations, confirming the slowdown from the official reading on Wednesday. Also Korean PMIs fell further below into contractionary territory to 47.6 while export growth slowed in August. Taiwan slowed even more to 42.7. ASEAN production on the other hand remained solid with still above 50 readings in Indonesia, the Philippines, Thailand and Malaysia.
Equities: Global equities lower again yesterday with broad based declines. However, we are starting to see a shift in the narrative as the inverse relationship between oil price and equities, or simply the energy sector versus the rest turning around. The last two days we have seen oil price down and equity markets lower. This for us suggests the market narrative is increasingly moving away from the oil-driven inflation fear of central banks tightening the global economy into recession. This fits well with the "Volcker message" we have received lately from Fed, ECB and BoE. In US yesterday indices ended at worst levels and unable to sustain an early rally for the third-straight time this week. With the move this morning, the S&P future is down close to 10%(!) from the peak just two weeks ago. Yesterday, Dow -0.9%, S&P 500 -0.8%, Nasdaq -0.6% and Russell 2000 -0.6%. Asian markets mostly lower this morning after some mixed PMIs. US and European futures down this morning led by the Nasdaq future, which is down 1.2% at time of writing.
FI: Global bond yields rose modestly yesterday and European yield curves flattened between 2Y and 10Y as well as 10Y and 30Y. We are now pricing in 75bp rate hike by the ECB after a string of comments during the Jackson Hole symposium during the weekend as well as comments this week from a string of ECB officials.
FX: Scandies dropped yesterday and in particular NOK was hit hard with EUR/NOK rising close to 10.00 level. EUR/USD was steady around parity and USD/JPY held close to 139 level.
Credit: Credit markets remained under pressure yesterday where iTraxx Xover closed 7bp wider in 588bp and Main 1bp wider in 119.5bp. The indices are now just 38bp and 7bp, respectively, from their 2022 highs.
Nordic macro
Much of the reason for Norges Bank's more aggressive tone recently has to do with high capacity utilisation and a tight labour market increasing the risk of high energy prices triggering a wage-price spiral. It will therefore be very interesting to see whether the labour market is cooling or tightening further. The first sign will be if the number of vacancies has peaked, as the monthly figures for new vacancies seem to suggest. Today also brings PMI data for August. We expect a moderate fall to around 52.5, partly because we have seen the new orders index dropping in recent months.
USD/JPY Daily Outlook
Daily Pivots: (S1) 138.48; (P) 138.75; (R1) 139.22; More...
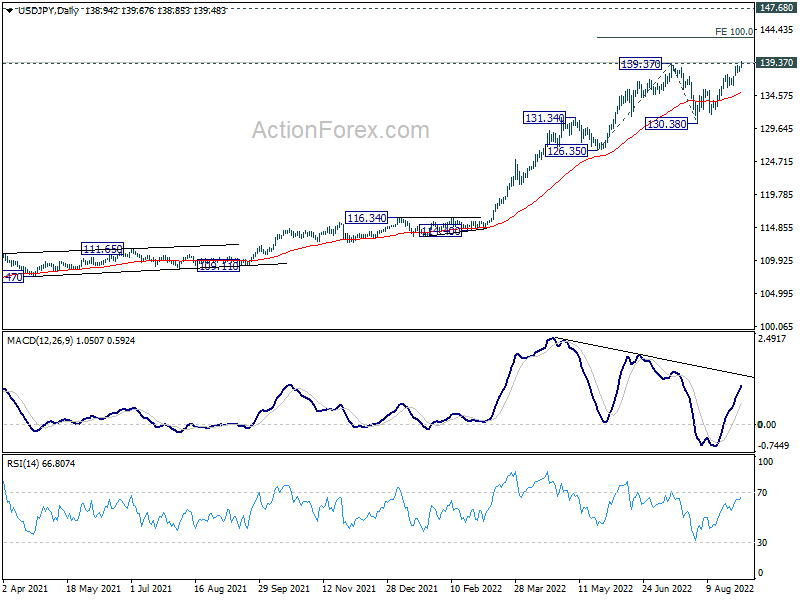
Intraday bias in USD/JPY is back on the upside as rise from 130.38 resumes and picks up some momentum. Focus is now on 139.37 resistance. Sustained break there will confirm up trend resumption. Next target is 100% projection of 126.35 to 139.37 from 130.38 at 143.40. However, break of 137.70 resistance turned support will suggest rejection from 139.37, and turn bias to the downside to extend the corrective pattern from there with another falling leg.
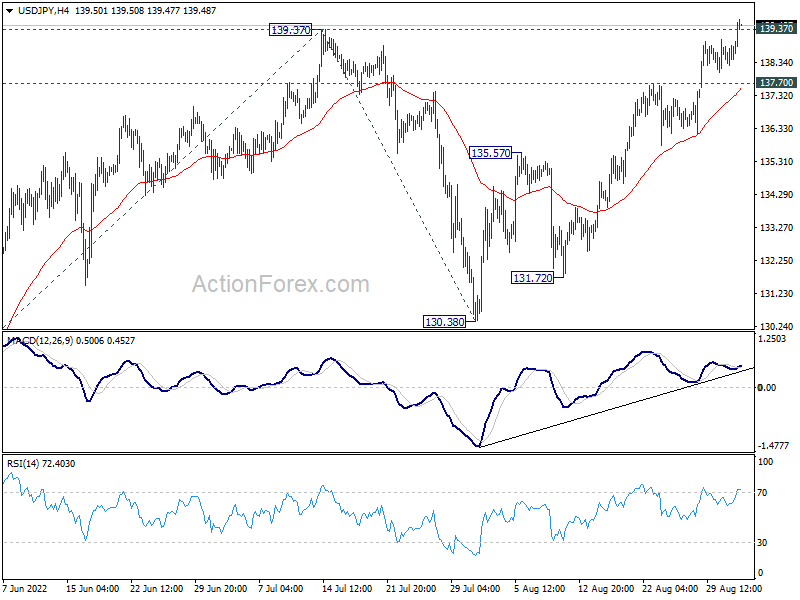
In the bigger picture, up trend from 101.18 is still in progress, as part of the whole up trend from 75.56 (2011 low). Further rise should be seen to 147.68 (1998 high). For now, break of 130.38 support is needed to be the first indicate of medium term topping. Otherwise, outlook will stay bullish even in case of deep pull back.
Dollar Back in Control on Risk Aversion and Rising Yields
Dollar is back in control in Asian session, with some help from risk averse sentiment. Euro is staying firm against Sterling and Swiss Franc, and is picking up upside momentum against commodity currencies. In particular, Aussie is sold off on poor manufacturing data from both Australia and China. Yen is also weak along with renewed rally in benchmark treasury yields.
Technically, US 10-year yield will be a focus today as could be trying to break away from 3.101 resistance decisively. In that case, a near term rally extension would be set up towards 3.483 high. Such development could push Yen pairs higher. In particular, USD/JPY could follow and break through 139.37 resistance in sustained way to resume larger up trend.
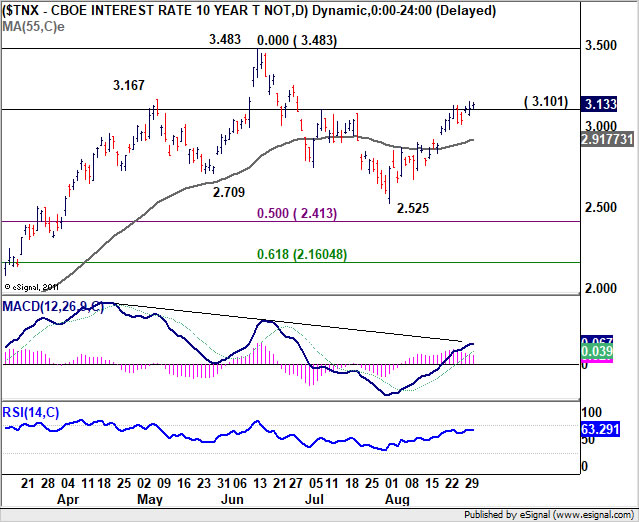
In Asia, at the time of writing, FTSE is down -1.05%. DAX is down -0.97%. CAC is down -1.37%. Japan 10-year JGB yield is up 0.0057 at 0.236. Overnight, DOW dropped -0.88%. S&P 500 dropped -0.78%. NASDAQ dropped -0.56%. 10-year yield rose 0.023 to 3.133.
Australia AiG manufacturing dropped to 49.3, back in contraction
Australia AiG Performance of Manufacturing Index dropped from 52.5 to 49.3 in August, indicating the first contraction since January. Production fell -1.8 pts to 45.7. Employment dropped -2.6 to 47.5. New orders dropped -4.1 to 55.8. Exports dropped -4.3 to 46.9. Sales tumbled -8.8 to 45.2. Input prices rose 2.0 to 81.7. Selling prices rose 4.6 to 69.1. Average wages rose 11.3 to 74.1.
Innes Willox, Chief Executive of Ai Group said: "The Ai Group Australian PMI for August points to the end of the recent expansion of manufacturing activity. Production, employment and sales were all down in August and most manufacturing sectors reported lower performance in the month.... Prices and wages continued to push higher and with the Reserve Bank seeking to ease these pressures by raising interest rates, further slowing in manufacturing looks increasingly likely over the coming months."
Also released, private capital expenditure dropped -0.3% in Q2, below expectation of 1.1%.
Japan PMI manufacturing finalized at 51.1 in Aug, dip likely to continue near term
Japan PMI Manufacturing was finalized at 51.1 in August, down from July's 52.1. The health of the sector that was the joint-weakest since February 2021. S&P Global also noted new orders had the sharpest reduction since October 2020. Backlogs of work decreased for the first time in 18 months. Rise in input prices was slowest for 8 months.
Usamah Bhatti, Economist at S&P Global Market Intelligence, said: "Latest PMI data pointed to deteriorating current activity in the Japanese manufacturing sector midway through the third quarter of 2022.... The dip is likely to continue in the near term... A benefit that has come from softer demand conditions is that pressure on supply chains has been given the opportunity to ease."
Also from Japan, capital spending rose 4.6% in Q2, above expectation of 3.0%.
China Caixin PMI manufacturing dropped to 49.5 in Aug
China Caixin PMI Manufacturing dropped from 50.4 to 49.5 in August, below expectation of 50.2, back in contraction. Caixin added that output growth slowed as firms faced power supply disruption amid heatwave. New orders declined for the first time in three months. Input costs fell at quickest rate since January 2016.
Wang Zhe, Senior Economist at Caixin Insight Group said: "Overall, the Covid-19 flare-ups, the extreme heat wave and restricted power usage resulted in a slight deterioration in overall business conditions in the manufacturing sector. Supply remained stronger than demand, with the latter recording a contraction. The job market remained weak, while lower input costs and output prices eased inflationary pressures. At the same time, firms were cautious about increasing purchases and inventory levels. Market sentiment remained optimistic, although some were worried about the global economic outlook."
Looking ahead
The calendar is rather busy today. Germany retail sales, Swiss CPI and PMI, Eurozone PMI final and unemployment rate, and UK PMI manufacturing final will be released in European session.
Later in the day, US will release jobless claims, non-farm productivity, ISM manufacturing and construction spending. Canada will release building permits and PMI manufacturing.
USD/JPY Daily Outlook
Daily Pivots: (S1) 138.48; (P) 138.75; (R1) 139.22; More...
Intraday bias in USD/JPY is back on the upside as rise from 130.38 resumes and picks up some momentum. Focus is now on 139.37 resistance. Sustained break there will confirm up trend resumption. Next target is 100% projection of 126.35 to 139.37 from 130.38 at 143.40. However, break of 137.70 resistance turned support will suggest rejection from 139.37, and turn bias to the downside to extend the corrective pattern from there with another falling leg.
In the bigger picture, up trend from 101.18 is still in progress, as part of the whole up trend from 75.56 (2011 low). Further rise should be seen to 147.68 (1998 high). For now, break of 130.38 support is needed to be the first indicate of medium term topping. Otherwise, outlook will stay bullish even in case of deep pull back.
Economic Indicators Update
| GMT | Ccy | Events | Actual | Forecast | Previous | Revised |
|---|---|---|---|---|---|---|
| 22:30 | AUD | AiG Performance of Mfg Index Aug | 49.3 | 52.5 | ||
| 23:50 | JPY | Capital Spending Q2 | 4.60% | 3.00% | 3.00% | |
| 00:30 | JPY | Manufacturing PMI Aug F | 51.5 | 51 | 51 | |
| 01:30 | AUD | Private Capital Expenditure Q2 | -0.30% | 1.10% | -0.30% | |
| 01:45 | CNY | Caixin Manufacturing PMI Aug | 49.5 | 50.2 | 50.4 | |
| 06:00 | EUR | Germany Retail Sales M/M Jul | -0.40% | -1.60% | ||
| 06:30 | CHF | Real Retail Sales Y/Y Jul | 0.90% | 1.20% | ||
| 06:30 | CHF | CPI M/M Aug | 0.40% | 0.00% | ||
| 06:30 | CHF | CPI Y/Y Aug | 3.50% | 3.40% | ||
| 07:30 | CHF | SVME - PMI Aug | 58 | |||
| 07:45 | EUR | Italy Manufacturing PMI Aug | 48.4 | 48.5 | ||
| 07:50 | EUR | France Manufacturing PMI Aug F | 49 | 49 | ||
| 07:55 | EUR | Germany Manufacturing PMI Aug F | 49.8 | 49.8 | ||
| 08:00 | EUR | Eurozone Manufacturing PMI Aug F | 49.7 | 49.7 | ||
| 08:00 | EUR | Italy Unemployment Jul | 8.10% | 8.10% | ||
| 08:30 | GBP | Manufacturing PMI Aug F | 46 | 46 | ||
| 09:00 | EUR | Eurozone Unemployment Rate Jul | 6.60% | 6.60% | ||
| 11:30 | USD | Challenger Job Cuts Y/Y Aug | 25.81K | |||
| 12:30 | USD | Initial Jobless Claims (Aug 26) | 250K | 243K | ||
| 12:30 | USD | Nonfarm Productivity Q2 | -4.60% | -4.60% | ||
| 12:30 | USD | Unit Labor Costs Q2 | 10.60% | 10.80% | ||
| 12:30 | CAD | Building Permits M/M Jul | -1.50% | -1.50% | ||
| 13:30 | CAD | Manufacturing PMI Aug | 52.5 | |||
| 13:45 | USD | Manufacturing PMI Aug F | 51.3 | 51.3 | ||
| 14:00 | USD | ISM Manufacturing PMI Aug | 52.6 | 52.8 | ||
| 14:00 | USD | ISM Manufacturing Prices Paid Aug | 59.5 | 60 | ||
| 14:00 | USD | ISM Manufacturing Employment Index Aug | 49.9 | |||
| 14:00 | USD | Construction Spending M/M Jul | -0.10% | -1.10% | ||
| 14:30 | USD | Natural Gas Storage | 58B | 60B |
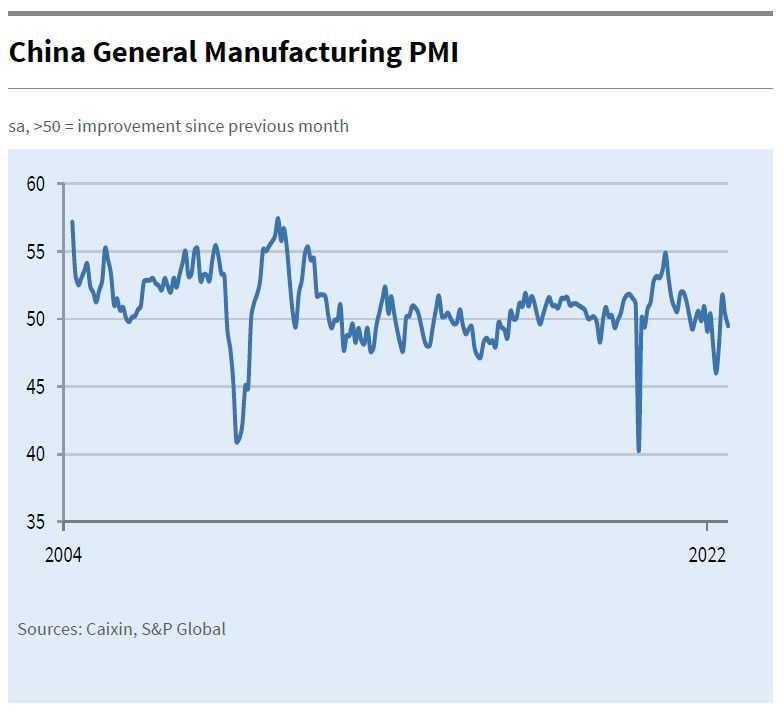
China Caixin PMI manufacturing dropped to 49.5 in Aug
China Caixin PMI Manufacturing dropped from 50.4 to 49.5 in August, below expectation of 50.2, back in contraction. Caixin added that output growth slowed as firms faced power supply disruption amid heatwave. New orders declined for the first time in three months. Input costs fell at quickest rate since January 2016.
Wang Zhe, Senior Economist at Caixin Insight Group said: "Overall, the Covid-19 flare-ups, the extreme heat wave and restricted power usage resulted in a slight deterioration in overall business conditions in the manufacturing sector. Supply remained stronger than demand, with the latter recording a contraction. The job market remained weak, while lower input costs and output prices eased inflationary pressures. At the same time, firms were cautious about increasing purchases and inventory levels. Market sentiment remained optimistic, although some were worried about the global economic outlook."
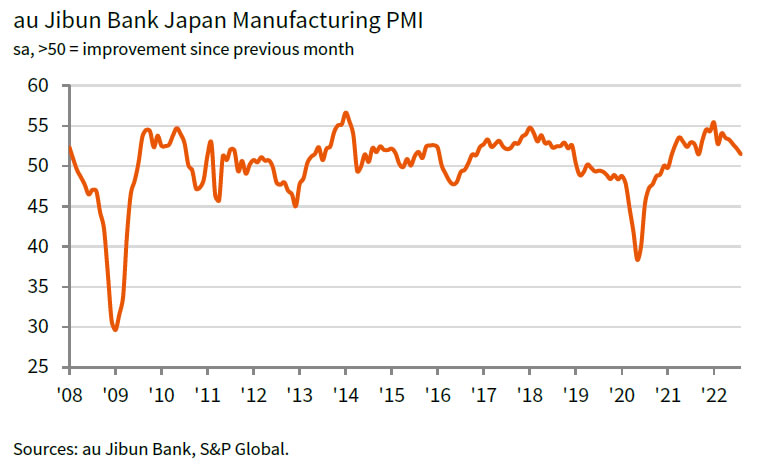
Japan PMI manufacturing finalized at 51.1 in Aug, dip likely to continue near term
Japan PMI Manufacturing was finalized at 51.1 in August, down from July's 52.1. The health of the sector that was the joint-weakest since February 2021. S&P Global also noted new orders had the sharpest reduction since October 2020. Backlogs of work decreased for the first time in 18 months. Rise in input prices was slowest for 8 months.
Usamah Bhatti, Economist at S&P Global Market Intelligence, said: "Latest PMI data pointed to deteriorating current activity in the Japanese manufacturing sector midway through the third quarter of 2022.... The dip is likely to continue in the near term... A benefit that has come from softer demand conditions is that pressure on supply chains has been given the opportunity to ease."
Australia AiG manufacturing dropped to 49.3, back in contraction
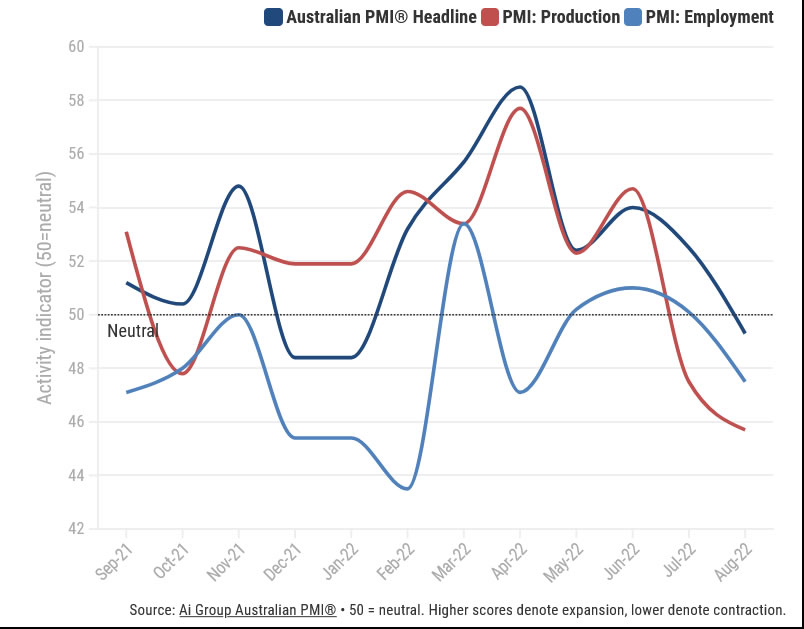
Australia AiG Performance of Manufacturing Index dropped from 52.5 to 49.3 in August, indicating the first contraction since January. Production fell -1.8 pts to 45.7. Employment dropped -2.6 to 47.5. New orders dropped -4.1 to 55.8. Exports dropped -4.3 to 46.9. Sales tumbled -8.8 to 45.2. Input prices rose 2.0 to 81.7. Selling prices rose 4.6 to 69.1. Average wages rose 11.3 to 74.1.
Innes Willox, Chief Executive of Ai Group said: "The Ai Group Australian PMI for August points to the end of the recent expansion of manufacturing activity. Production, employment and sales were all down in August and most manufacturing sectors reported lower performance in the month.... Prices and wages continued to push higher and with the Reserve Bank seeking to ease these pressures by raising interest rates, further slowing in manufacturing looks increasingly likely over the coming months."
RBA to Raise the Cash Rate by 50 Basis Points Next Week
The Reserve Bank Board meets next week on September 6.
We are confident that the Board will decide to raise the cash rate by a further 50 basis points to 2.35%.
The Statement from the Governor following the meeting will be closely scrutinised. In the note below we discuss a range of issues that will be relevant to that issue.
In summary, "The best approach will be to strengthen the rhetoric we saw in the August Statement; maintain the term "not on a pre set path"; and, following Chair Powell, note that at "some point" it will be appropriate to slow the pace of tightening while emphasising that the cycle may have considerably further to run." Raising the cash rate by 50 basis points will move the cash rate into the "neutral zone".
In recent speeches (19 and 20 July) the Governor and Deputy Governor assessed "neutral" is at least 2.5%.
Having quickly moved policy into that neutral zone (225 basis points in four months – five meetings) we expect the Board will decide to slow the pace of increases to 25 basis points from the October meeting.
This second stage of the tightening process, with consecutive 25 basis point increments, is expected to extend out to February next year with the rate peaking at 3.35%.
At that point we expect that it will become evident that the Australian economy is clearly slowing with clear evidence of continuing deterioration as the series of rate hikes and high inflation weigh on households and business. Furthermore, although both headline and underlying inflation will be rising on an annual basis the quarterly increase in underlying inflation will have slowed from 1.5% (September quarter) to 1.2% (December quarter) with the prospect of a further slowing to 0.8% in the March quarter.
Our assessment of "neutral" is lower than the RBA's. We view neutral in the Australian economy to be around 2% (partly relying on comparisons with previous peak debt servicing ratios in earlier cycles).
The 2.5% estimate from the RBA assumes a zero real rate and a nominal component equal to long term inflationary expectations which are judged to be 2.5%.
We accept that the challenge to contain inflationary expectations in this cycle will be formidable given the current evidence that both businesses and households are becoming accustomed to rising prices and short-term inflationary expectations are rising quickly.
Holding the cash rate at 3.35% through 2023, well above the neutral setting of 2.0%, is a necessary condition for the Bank to bring inflation down close to the 3% target – the top of the 2-3% range.
But there will be a price to pay for such success – we forecast the economy to grow by only 1% in 2023 – well below the trend rate of growth of around 2.5%.
This growth forecast is more pessimistic than the Bank's forecast of 1.8% while our forecast for inflation (Trimmed Mean) by end 2023 is 3.1%, well below the RBA's forecast of 3.8%. Indeed, the RBA's forecast for headline inflation by end 2023 is 4.3% (3.8% underlying) - well above the 2-3% target.
The RBA's economic growth forecast for 2023 is 1.8% – significantly above our 1% forecast.
But the RBA uses a different interest rate profile in its forecasts, "the cash rate assumed to increase to around 3% by end of 2024" – a lower profile than our expectations. This profile is not a policy driven choice but rather "expectations derived from professional economists and financial market pricing".
So, although the Bank has a very clear policy objective, its forecasts use the estimates provided by others for the profile of its policy instrument.
There is a strong case for this approach to be reviewed in the current circumstances. It hardly signals the decisive "whatever it takes" commitment we see from US Fed Chairman Powell's Jackson Hole speech.
In the case of the RBA, the outcome is a set of forecasts that does not emphasise the Bank's commitment to returning inflation to the target zone in a reasonable time.
Consider the two policy approaches of the RBA and the Federal Reserve as indicated by the most recent Statements.
Governor Lowe, "The Board places a high priority on the return of inflation to the 2-3% per cent range over time, while keeping the economy on an even keel." (August Board)
Chairman Powell, "The FOMC's overarching focus right now is to bring inflation back down to our 2% goal…. Reducing inflation is likely to require a sustained period of below trend growth … will bring some pain to households and business." (Jackson Hole).
The Jackson Hole speech was clearly aimed at convincing business and households that the FOMC is absolutely committed to containing inflationary expectations, whatever the cost.
The Governor's Statement refers to "the path to achieve this balance is a narrow one and clouded in uncertainty."
The much more cautious, softer rhetoric along with the cautious forecasts risks the RBA losing control of inflationary expectations.
Chairman Powell emphasises that risk by invoking Chairman Volker, "Inflation feeds on itself, so part of the job … must be to break the grip of inflationary expectations."
That is compounded by a set of forecasts from the RBA that projects a "leisurely" two and a half years to reach the top of the 2-3% target zone.
So, the question is whether the powerful Jackson Hole speech will spur the RBA into stronger words after the September meeting than we saw in August.
I believe that would be the right approach although it should not commit to extending the 50 basis point increases into October.
Even the robust Chairman Powell noted, "At some point, as the stance of monetary policy tightens further it likely will become appropriate to slow the pace of increases."
The best approach will be to strengthen the rhetoric by strongly emphasising the inflation priority; maintain the term "not on a pre set path"; and, following Chair Powell, note that at "some point" it will be appropriate to slow the pace of tightening while emphasising that the cycle may have considerably further to run."
The Bigger Picture for Central Banks
Chairman Powell has emphasised his 2% inflation target.
It seems clear that he is prepared to impose considerable pain on the US economy to achieve that objective.
We forecast that growth in the US economy will be only 0.7% in 2023; a necessary development to squeeze inflation out of the system.
Consider the structural changes in the global economy in recent years:
- There has been ample supply in global labour markets, due to the rise of China and Eastern Europe. Through ageing; geo-political tensions; health shocks and mobility restrictions the excess supply of global labour has reverted into global shortages.
- The transition from fossil fuels to renewables, as the world deals with the realities of climate change, has quickly transformed into global shortages of fossil fuels which is pressuring energy prices.
- Food supplies are regularly disrupted by extreme climate developments.
- Globalisation and the resulting cost savings is reverting to deglobalisation as businesses that have suffered through supply chain disruptions are reassessing their supply chain policy – moving the mantra from "just in time" to "just in case".
- In response to the major shocks of the GFC and COVID central banks aggressively expanded their balance sheets. We cannot be sure exactly how this massive boost to liquidity will affect inflation, although the uncertainty is about the extent rather than the direction.
Central banks are likely to be able to restore inflation to their pre COVID targets through aggressively slowing demand over the course of the next few years. But, in facing these major structural changes to the global economy, they may have to accept higher inflation targets once they rebalance policy settings to revitalise demand and restore their economies to potential growth in the future.
With the key current objective for central banks being to contain inflationary expectations there will be no immediate move to address this challenge.
As we move beyond 2023, and into 2024 when we expect central banks to be easing policy settings to restore demand, upward pressures on inflation may emerge more quickly than is currently expected.
Gold Price Dives As Dollar Gains Bullish Momentum
Key Highlights
- Gold price started a major decline below the $1,750 support zone.
- It is following a key bearish trend line with resistance near $1,712 on the 4-hours chart.
- GBP/USD, AUD/USD and NZD/USD traded to a new multi-week low.
- USD/JPY rallied to a new multi-year high above 139.40.
Gold Price Technical Analysis
Gold price struggled to gain pace above the $1,800 resistance zone against the US Dollar. The price started a major decline below the $1,780 and $1,750 support levels.
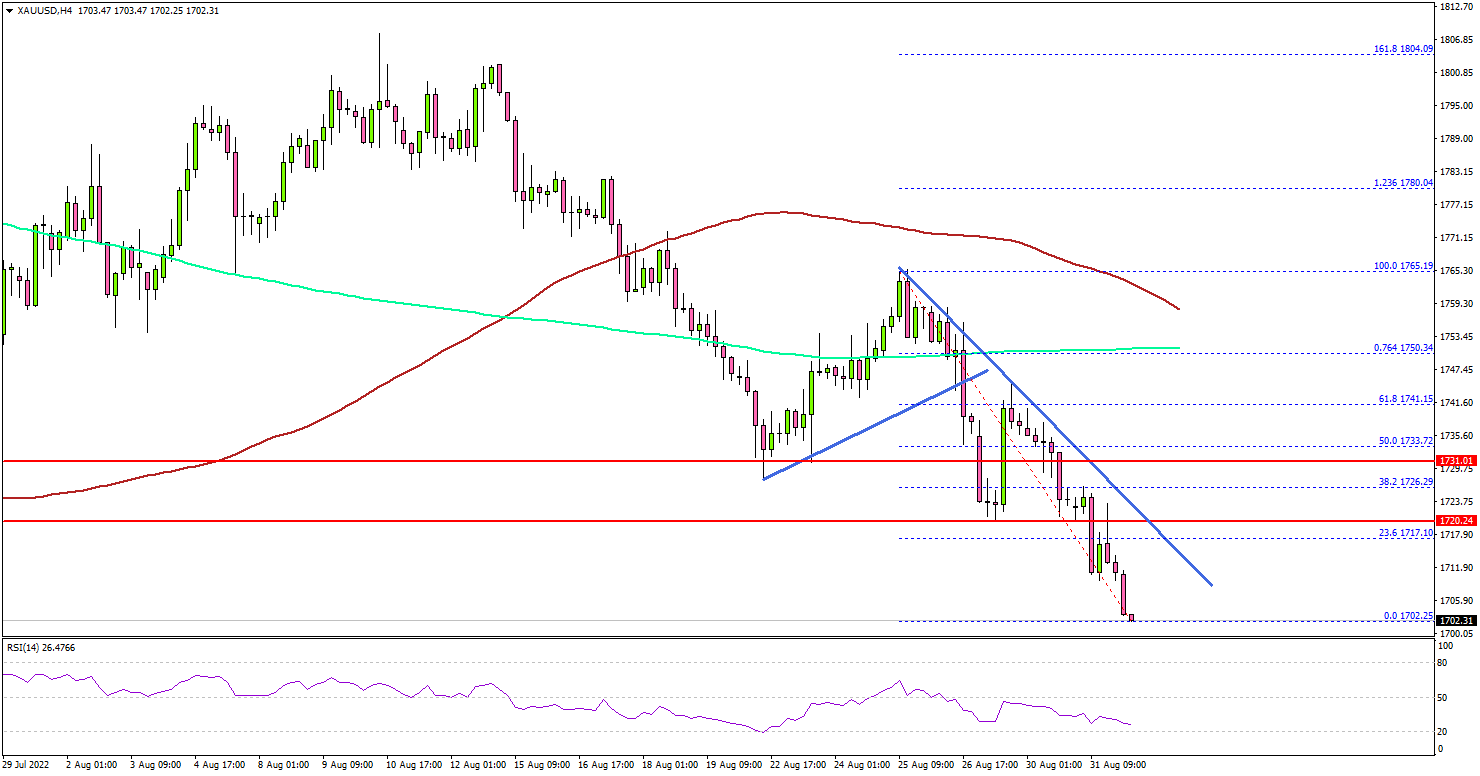
The 4-hours chart of XAU/USD indicates that the price settled below the key $1,750 support, the 100 simple moving average (red, 4-hours), and the 200 simple moving average (green, 4-hours).
It opened the doors for more losses below the $1,720 support. The price even traded close to the $1,700 support zone. It seems to be following a key bearish trend line with resistance near $1,712 on the same chart.
On the downside, an initial support is near the $1,700 level. The next major support is near the $1,685 level, below which the price could accelerate lower. In the stated case, the price may perhaps decline towards the $1,660 level.
On the upside, the price might face sellers near the $1,710 level. The next major resistance is near the $1,720 level. Any more gains might send the price towards the $1,732 level.
Looking at GBP/USD, there were additional losses and the pair traded to a new multi-month low below the 1.1600 level.
Economic Releases to Watch Today
- Germany’s Manufacturing PMI for August 2022 - Forecast 49.8, versus 49.8 previous.
- Euro Zone Manufacturing PMI for August 2022 – Forecast 49.7, versus 49.7 previous.
- UK Manufacturing PMI for August 2022 – Forecast 46.0, versus 46.0 previous.
- US Manufacturing PMI for August 2022 – Forecast 51.3, versus 51.3 previous.
- US ISM Manufacturing Index for August 2022 – Forecast 52.0, versus 52.8 previous.
- US Initial Jobless Claims - Forecast 248K, versus 243K previous.
Elliott Wave View: Near Term Further Weakness in Silver
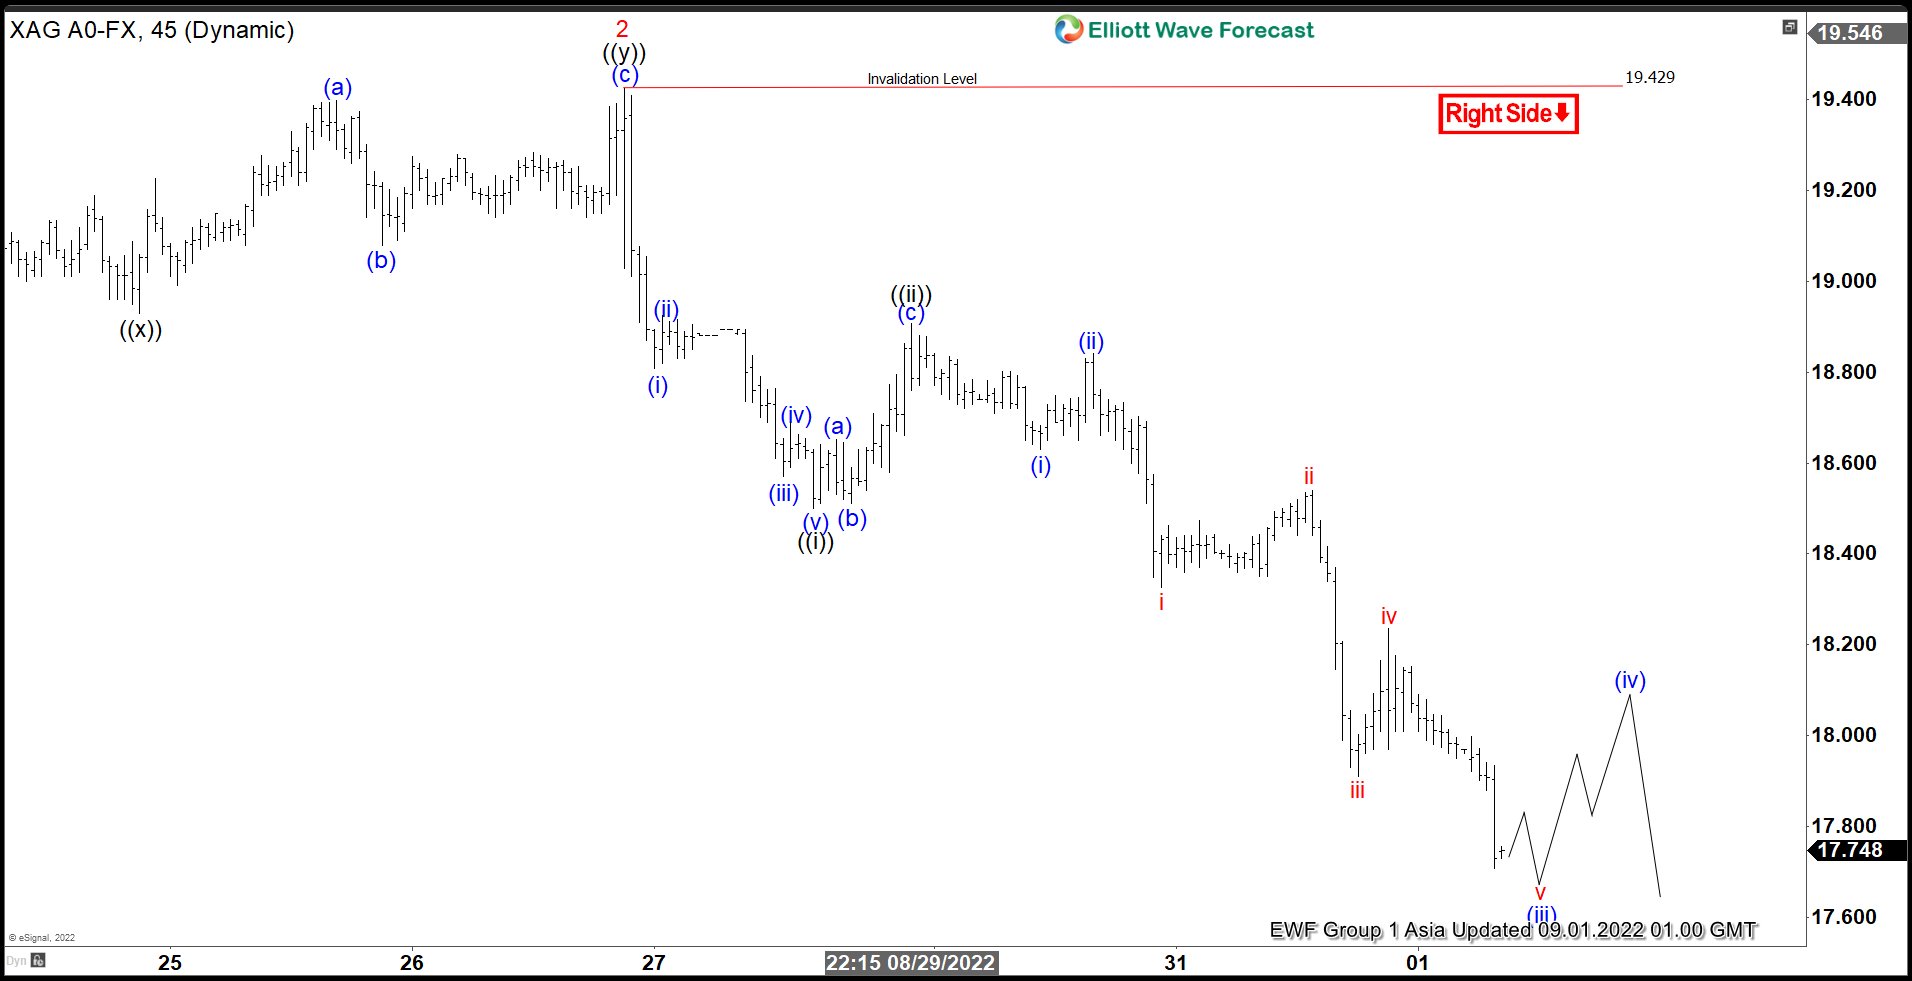
Short Term Elliott Wave View in Silver suggests rally to 19.43 ended wave 2. Wave 3 lower is in progress to complete a cycle from August 14th, 2022 high. Internal subdivision of wave 2 unfolded as a double three Elliott Wave structure. Up from wave 1, wave (a) ended at 19.09 and pullback in wave (b) ended at 18.78. XAGUSD extended higher in wave (c) of ((w)) towards 19.28. Connector wave ((x)) completed as a zigzag correction at 18.93. The metal then resumed the rally in wave (a) ended at 19.40 and pullback in wave (b) finished at 19.07 Final leg higher wave (c) ended at 19.43 which ended wave ((y)) of 2.
Silver turned lower in wave 3. Internal subdivision in wave ((i)) unfolded as an impulse. Down from wave 2, wave (i) ended at 18.81 and bounce in wave (ii) ended at 18.92. Silver extended lower in wave (iii) at 18.56. A shallow bounce completed wave (iv) at 18.69. Last leg lower ended at 18.50 completing wave (v) of ((i)). Then market rally ending wave ((ii)) as a flat correction at 19.91.
Wave ((iii)) already has started and wave (i) ended at 18.63 and corrective wave (ii) at 18.84. XAGUSD continued falling and we can already see 5 swings lower from wave (ii). We are expecting to break 17.70 to complete an impulse as wave (iii), then a corrective bounce as wave (iv) and continue lower end wave (v) and also wave ((iii)). Therefore, silver should see more downside as far as pivot at 19.43 high stays intact, expect that any rally to fail in 3, 7, or 11 swing for further downside.
Silver (XAGUSD) 45 Minutes Elliott Wave Chart