Sample Category Title
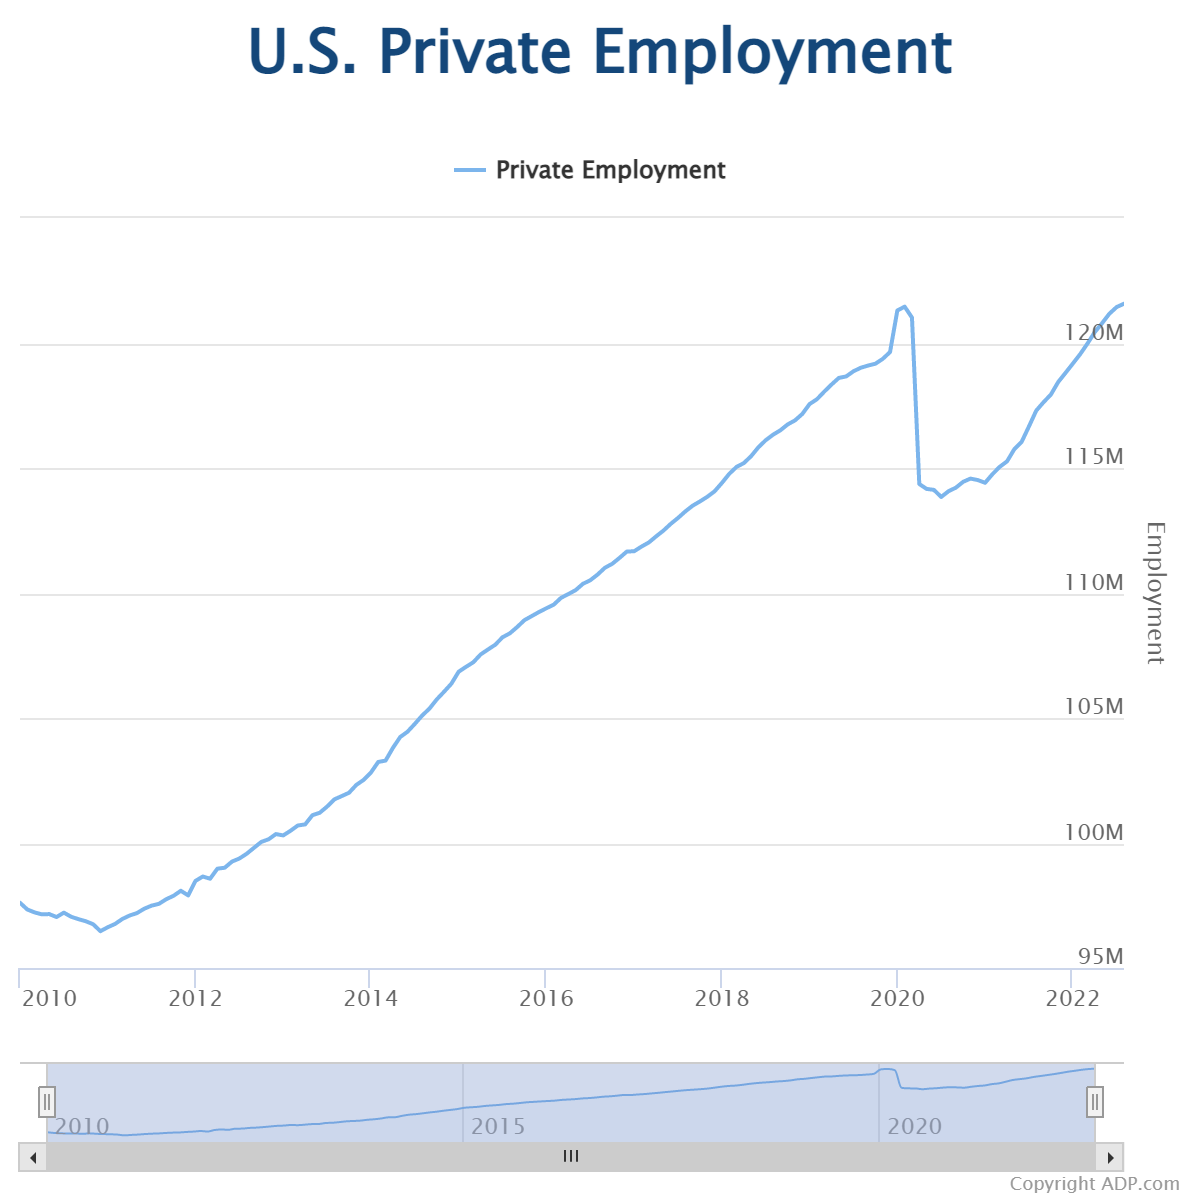
US ADP employment grew 132k, a shift towards more conservative hiring pace
US ADP private employment grew 132k in August, well below expectation of 300k. By sector, goods-producing jobs grew 23k. Services-providing jobs grew 110k. By company size, small businesses added 25k jobs, medium added 53k, large added 54k. Annual pay was up 7.6%.
"Our data suggests a shift toward a more conservative pace of hiring, possibly as companies try to decipher the economy's conflicting signals," said Nela Richardson, chief economist, ADP. "We could be at an inflection point, from super-charged job gains to something more normal."
EUR/USD: Euro Returns Below Parity Despite Positive Signals from Record High EU Inflation
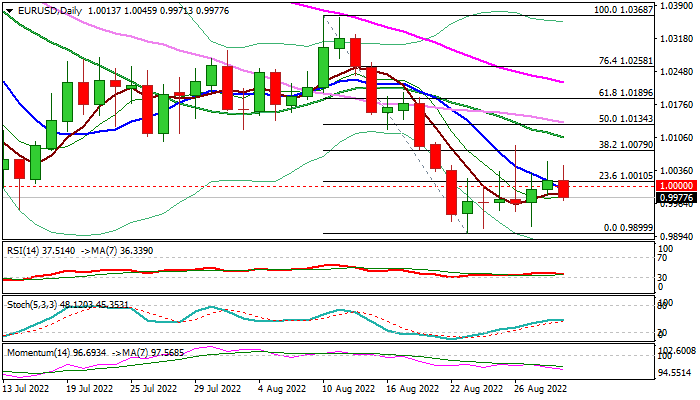
The Euro eases below parity on Wednesday, weighed by fresh strength of the US dollar and failure to benefit from growing expectations for more aggressive action from the ECB next week, after the latest data showed that inflation in the EU bloc surged to new record high in August
The single currency remains depressed by mounting concerns of further economic slowdown due to surging energy and food prices, with fears that inflation is getting entrenched that would make the job of the central bank in restoring price stability more difficult.
Daily technical studies show rising negative momentum and moving averages in bearish setup that adds to weakening outlook.
Fresh weakness brings the price back within the range that extends into the second straight week, after attempts to break the upper range boundary were short-lived, increasing risk of fresh attack at the range floor at 0.9900.
Near-term action is still lacking direction, with break of either boundary (1.0100 / 0.9900) needed to generate initial direction signal.
Res: 1.0050; 1.0089; 1.0111; 1.0137.
Sup: 0.9949; 0.9900; 0.9853; 0.9793.
Gold Wave Analysis
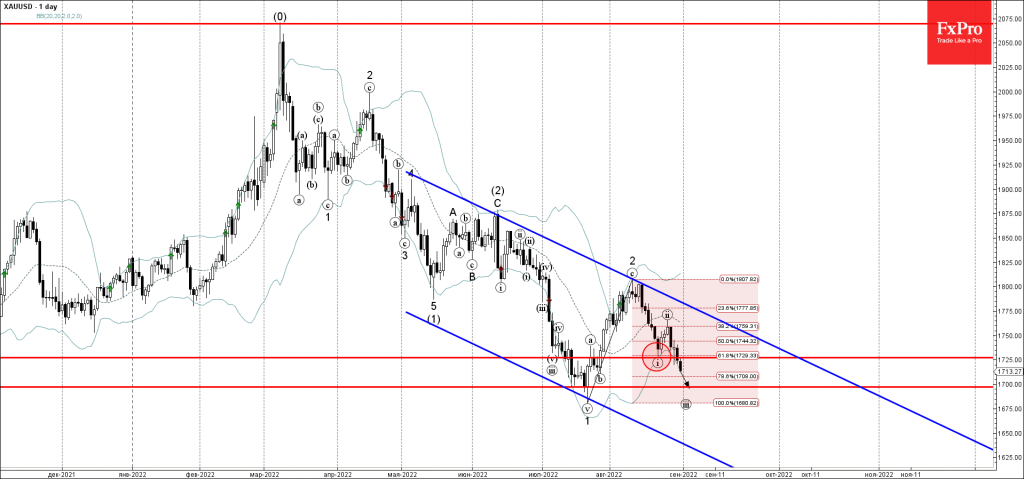
- Gold broke support level 1725.00
- Likely to fall to support level 1700.00
Gold recently broke the support level 1725.00 intersecting with the 61.8% Fibonacci correction of the upward correction 2 from July.
The breakout of the support level 1725.00 accelerated the active short-term impulse waves (iii) and 3, which belong to the intermediate impulse wave (3) from June.
Gold can be expected to fall further toward the next round support level 1700.00 (which stopped the previous impulse wave 1 in July).
WTI Wave Analysis
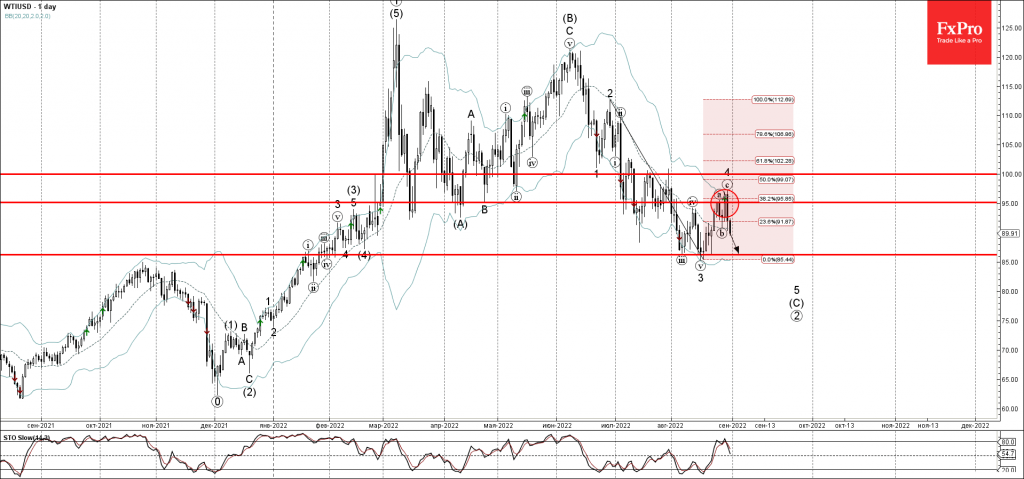
- WTI reversed from resistance level 95.00
- Likely to fall to support level 141.35
WTI crude oil recently reversed down with the Bearish Engulfing from the resistance level 95.00 (which has been reversing the pair from the start of August) intersecting with the upper daily Bollinger Band and the 38.2% Fibonacci correction of the downward impulse from June.
The downward reversal from the resistance level 143.00 started the active short-term impulse wave 5.
WTI crude oil can be expected to fall further toward the next support level 86.25 (low of the previous impulse wave 3).
USD/JPY Pair Moved into a Positive Zone above $137.80
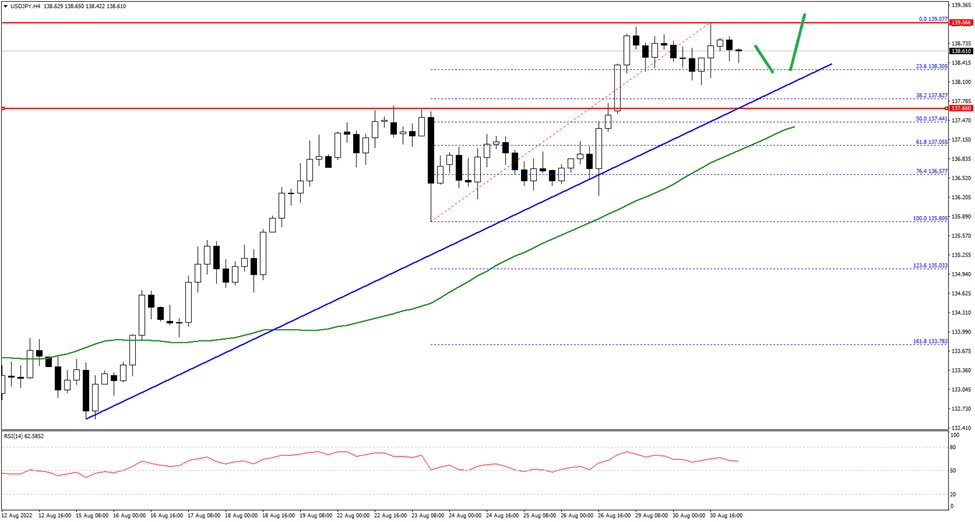
The US Dollar started a fresh increase above the 137.00 resistance against the Japanese Yen. The USD/JPY pair traded above the 137.80 level to move into a positive zone.
The pair even moved above the 138.50 level and is still well below the 50 hourly simple moving average. It is now consolidating near the 138.60 level, with an immediate resistance at 138.85 on FXOpen.
The first major resistance is near the 139.00 zone. A clear break above the 139.00 resistance could push the price towards 139.50. The next major resistance is near the 140.00 level.
On the downside, an initial support is near the 138.30 zone. The next major support sits near the 138.10 level and a connecting bullish trend line on the hourly chart, below which there is a risk of more downsides towards the 137.50 level.
Japanese Yen Ticks Higher on Strong Data
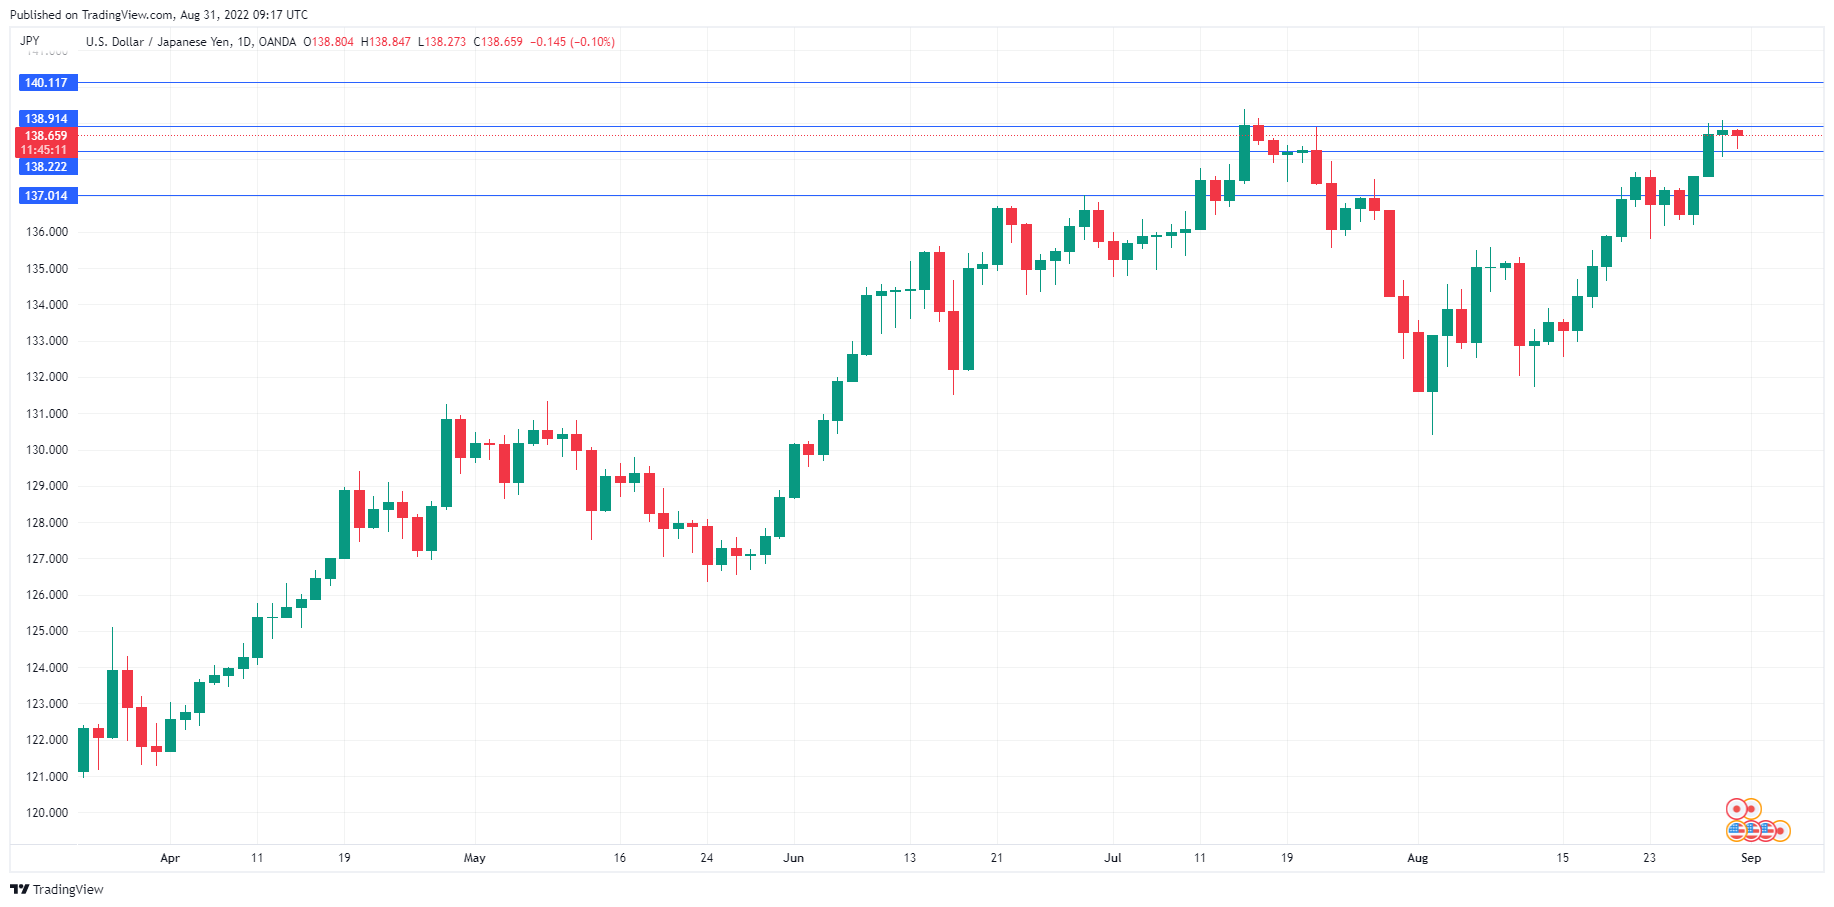
After starting the week with sharp losses, the Japanese yen has settled down. In the European session, USD/JPY is showing limited movement, trading at 138.66.
Japanese data improves
Japan posted solid numbers today, as retail sales and industrial production both improved in July. Retail sales climbed 2.4% YoY in July, (vs 1.5% in June), above the forecast of 1.9%. Significantly, household spending stayed strong, despite high inflation due to rising energy and food prices.
Industrial production surprised with a gain of 1.0% MoM (vs. -0.5% forecast), after a huge 9.2% gain in June. Two straight months of gains point to strong pent-up demand and an easing in supply line disruptions. As well, the consumer confidence index rose to 32.5 in August (vs. 31.0) up from 30.2 in July. Consumer confidence remains weak, but the index improving for the first time in three months is welcome news.
The host of positive numbers is an indication that the Japanese economy, although fragile, continues to recover, in large part due to pent-up demand following the easing of Covid restrictions. Still, the economy has a long way to go before the Bank of Japan will join its counterparts and tighten policy. The BoJ is primarily focused on stimulating the economy, and inflation remains much, much lower than what we’re seeing elsewhere. With the BoJ vigilantly maintaining its yield control, the Japanese yen remains at the mercy of the US/Japan rate differential, and higher US yields of late have pushed USD/JPY close to the 139 level. We could see the yen fall to 140 in the short-term, with no indication that Japan’s Ministry of Finance has any appetite to intervene and support the yen.
Later today, the US releases the ADP Employment report. The market consensus for August stands at 288 thousand, which would be a strong improvement from the July gain of 128 thousand. This event could cause some brief volatility in the dollar, but it is not a reliable indicator for Friday’s non-farm employment report. In fact, NFP is expected to fall to 300 thousand, down from July’s massive gain of 528 thousand.
USD/JPY Technical
- USD/JPY is testing support at 1.3822. The next support line is at 137.01
- 1.3891 and 1.4012 are resistance lines
Eurozone CPI rose to 9.1% yoy in Aug, core CPI up to 4.3% yoy
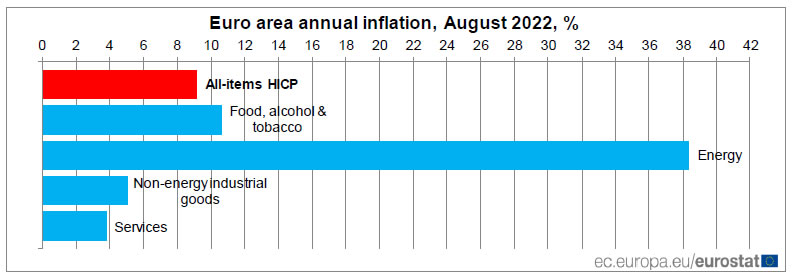
Eurozone CPI accelerated further from 8.9% yoy to 9.1% yoy in August, above expectation of 9.0%. CPI core (all items excluding energy, food, alcohol, and tobacco) rose from 4.0% yoy to 4.3% yoy, above expectation of 4.0% yoy.
Looking at the main components, energy is expected to have the highest annual rate in August (38.3%, compared with 39.6% in July), followed by food, alcohol & tobacco (10.6%, compared with 9.8% in July), non-energy industrial goods (5.0%, compared with 4.5% in July) and services (3.8%, compared with 3.7% in July).
Gold Plunges to New One-Month Low
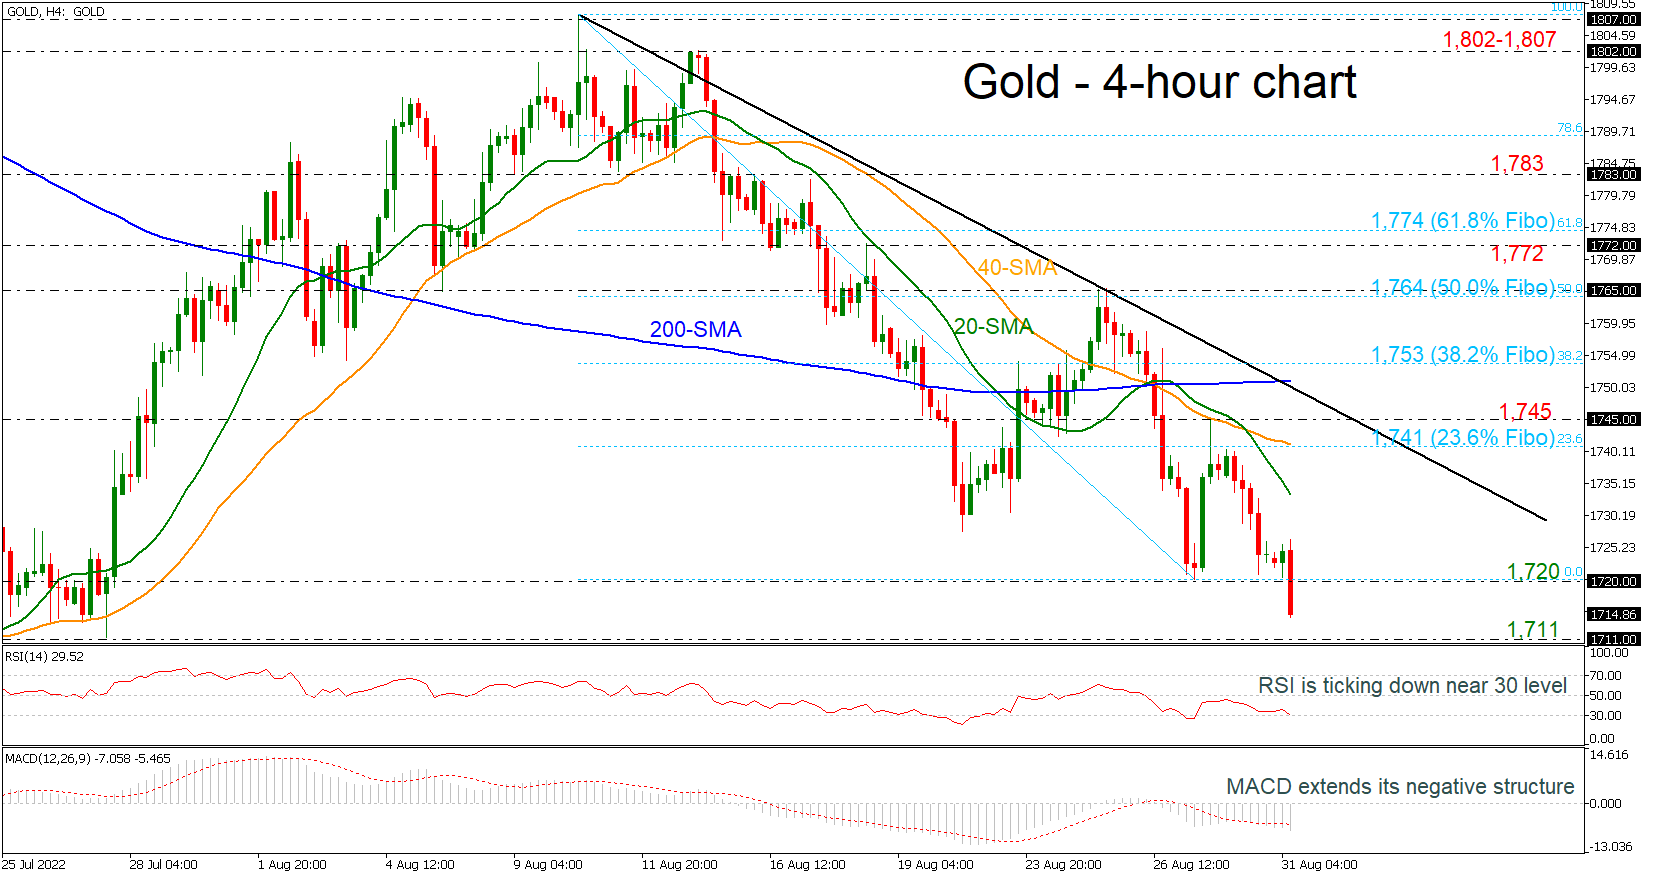
Gold prices are plummeting towards a fresh one-month low at 1,714 and are holding well below the short-term simple moving averages (SMAs). The RSI indicator is ticking lower in the negative region, approaching the oversold territory, while the MACD is extending its bearish momentum beneath its trigger and zero lines.
More downside pressures may open the door for a lower low towards the 1,711 barrier, taken from the lows on July 27. Even lower, the market may hit the 1,680 barrier again, where it has been rejected several times over the last two years.
On the flipside, an upside correction may drive the price towards the 20-period simple moving average (SMA) at 1,733 in the 4-hour chart. Higher, the bulls may find strong resistance near the 23.6% Fibonacci retracement level of the down leg from 1,807 to 1,720 at 1,741, which overlaps with the 40-period SMA. Slightly up, the downtrend line, which is drawn from the peak on August 10 may act as strong resistance near the 1,745 barrier.
All in all, the yellow metal is bearish and only a climb beyond the falling trend line and the 200-period SMA may switch this outlook to slightly positive.
EUR/USD Remains in a Bearish Price Action – Elliott Wave
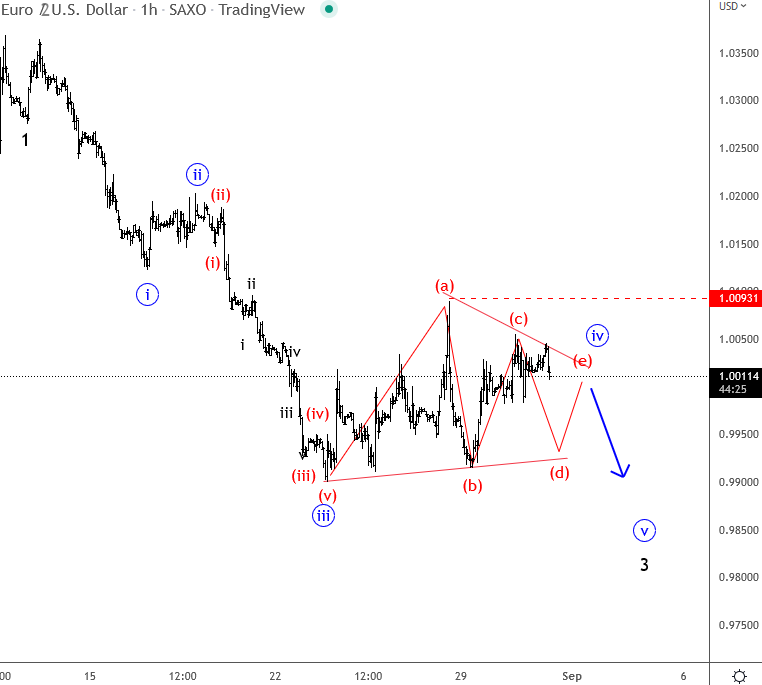
Markets are quiet and sideways, mostly due to end of the month flows ahead of September when normal activity can be back, as most of the traders will return to their trading desks. However, slow price moves may not last long; we may see some interesting price actions already on Friday when US will release its jobs data. But before that, we have some inflation figures from the EU; the CPI flash. Its the first report so it may have an important impact on the EUR. The energy crisis is getting worse in the euro area, so its hard to believe that inflation is going to peak. ECB will most likely have to do a lot more to stabilize the prices. Maybe the 75 bp increase on one of their next meetings can help.
From an Elliott wave perspective, we see EURUSD in fourth wave consolidation, which can be a triangle, while 1.0093 holds so for now bears still remain in play. Recovery back above 1.01 will invalidate the look.
USD/CAD: Minor Wave Z Likely to Complete Near 1.332
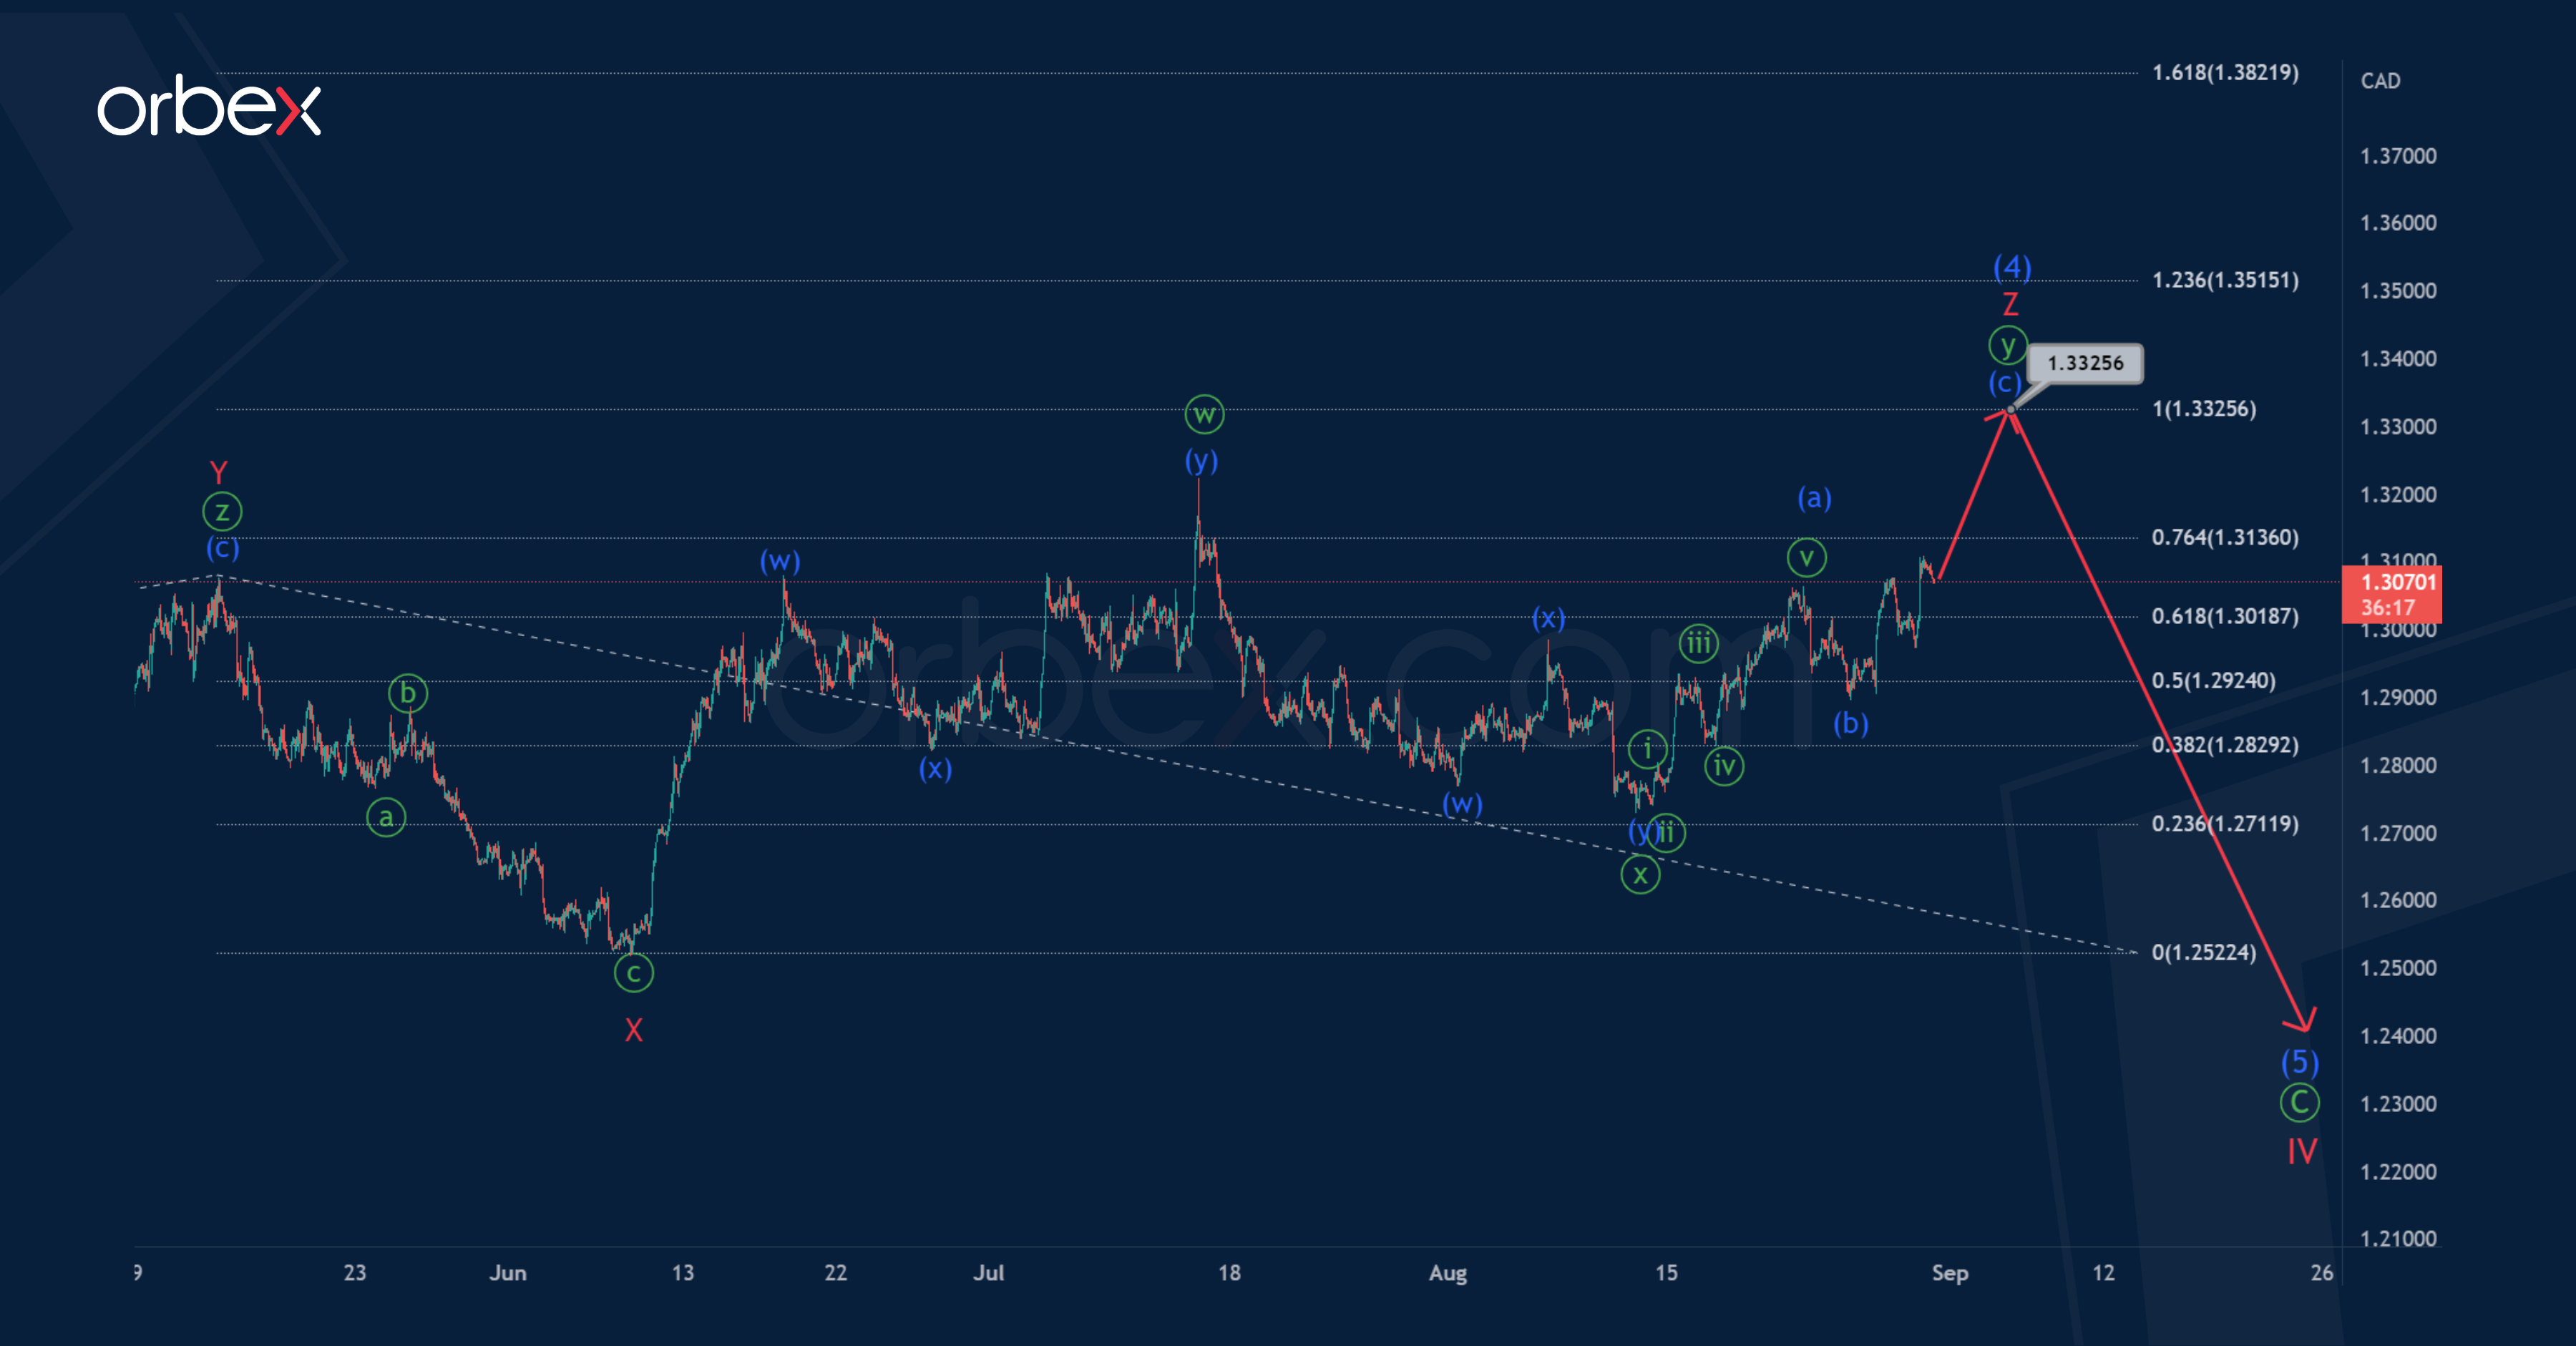
The current USDCAD timeframe shows the internal structure of the long-term correction wave (4) of the intermediate degree, which is part of the global downward impulse Ⓒ of the primary degree.
It is likely that the correction wave (4) is a sideways wave consisting of minor waves W-X-Y-X-Z. Most likely, the sub-waves W-X-Y-X have already been fully built. Not so long ago, the second intervening wave X was completed, and now the price is rising in the final wave Z, taking the form of a minute double zigzag.
The pair may rise in the minor wave Z to 1.332. At that level, wave Z will be at 100% of previous actionary wave Y.
Then, after reaching the specified price level, we could see a market reversal and the beginning of a decline in bearish impulse (5).
According to the alternative, the formation of the intermediate correction wave (4) could be fully completed. Therefore, let's assume that the first sub-waves of the descending intermediate impulse (5) are formed.
It is possible that impulse 1 and bullish correction 2 have been fully completed today, and now we see a decline in the minor wave 3.
The target for bears is at 1.229. This is the previous minimum. Upon reaching this level, a small corrective rise is expected within the bullish correction 4.
An approximate scheme of possible future movement is shown on the chart.