Sample Category Title
Daily Technical Analysis
EUR/USD
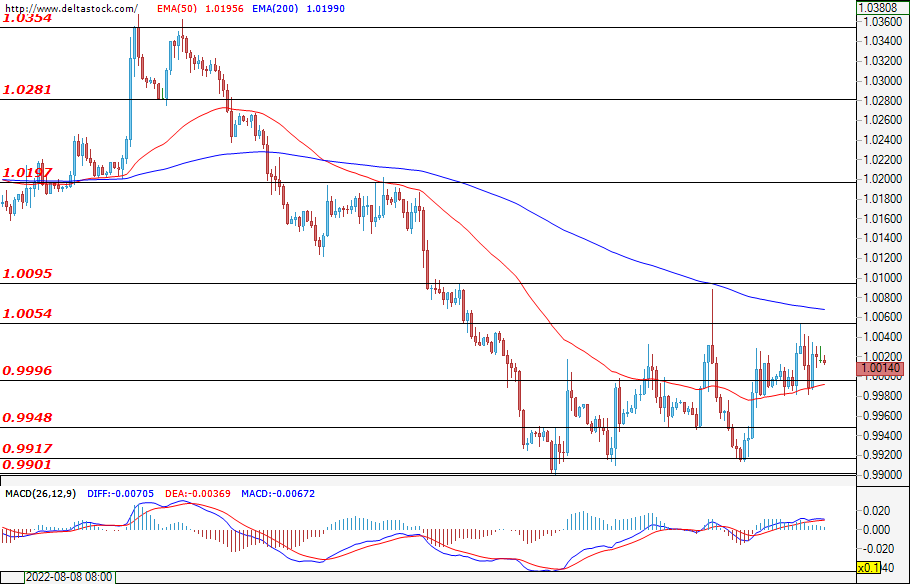
On Tuesday, the single European currency failed to breach the formed range. The day started off calmly, but trading intensified at around 07:00 GMT after the release of the German preliminary inflation data.The news was taken positively and the bulls managed to breach the key level of 1.0000. The pair continued higher, but the bull attack was eventually stopped by the newly formed resistance at 1.0054. After the U.S. data at 14:00 GMT, we saw a correction due to the stronger dollar and the market finished at around 1.0014. Today, from 03:00 to 06:00 GMT, we will see a number of data on the economic state of the EU, the inflation in France, as well as the change in new jobs for Germany. Whether the currency pair will be able to break out of its range will depend on how this data will be interpreted and what actions the ECB will take following its release.
USD/JPY
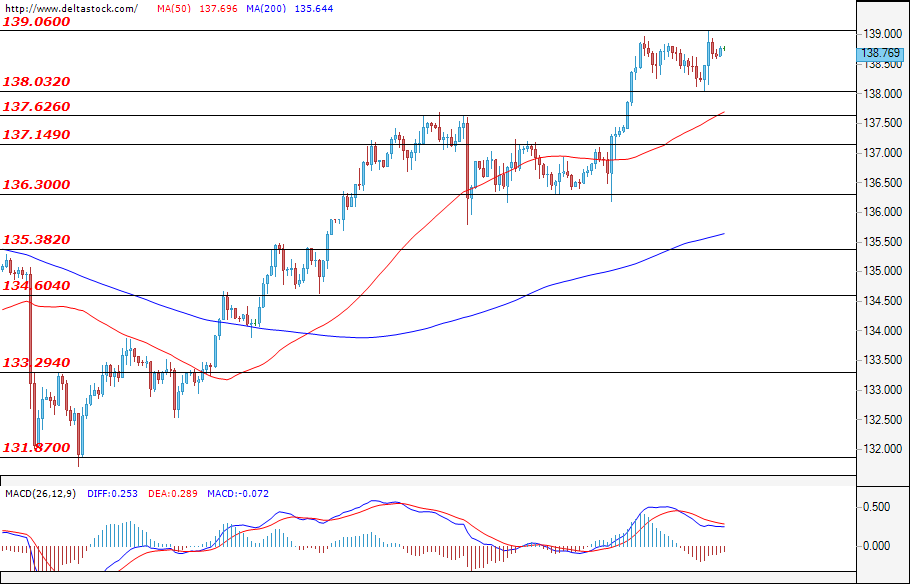
A new day, a new high for the Ninja. We continue to see a strong uptrend, characterised by the consecutive breach of resistances and the formation of new highs, with the pair finding itself as high as 139.06 yesterday. The dollar continues to flex its strength against a number of currency pairs, but this trend is most prevalent when it comes to the USD/JPY. On Tuesday, we saw unemployment in Japan remaining at the expected levels, but that wasn't enough for traders to favour the yen over the dollar. The strong consumer confidence data and private sector job openings positively influenced the dollar and the currency pair peaked 30 pips higher than yesterday's top. Movements in the currency pair are expected to be dictated by the U.S. private non-farm payrolls data today at 12:15 GMT. For now, there is no expectation for the trend to change, but such a scenario should still not be ruled out completely.
GBP/USD
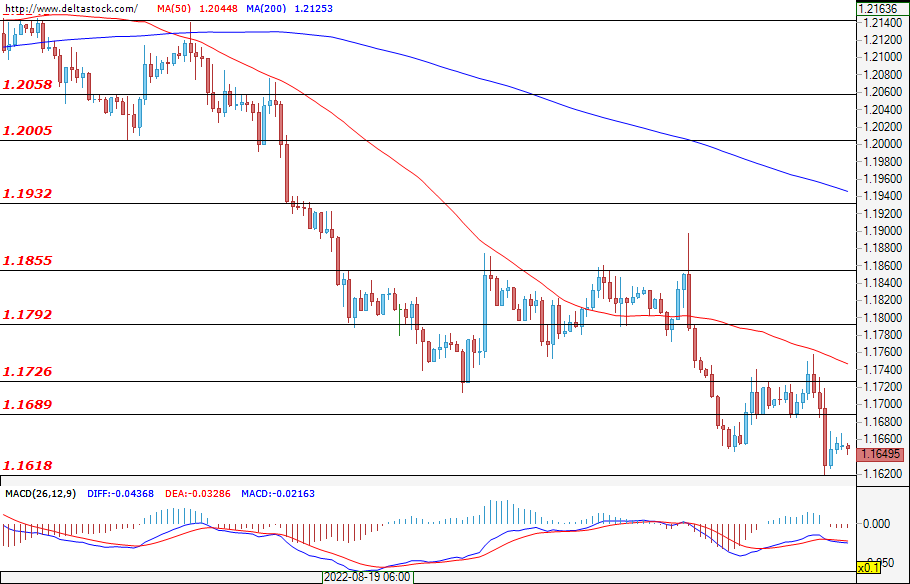
Tuesday got off to a promising start for the Cable – with an extension of the upward moves that began on Monday this week. We saw a breach at 1.1726 after the UK money flow data pushed the bulls to attack, as well as a new weekly high at 1.1757. There, however, the bears did not wait to make a fresh entry, and following the release of the consumer confidence and private sector job openings data at 14:00 GMT, initiated an attack of their own with the help of the stronger dollar. As a result, the dollar continued its rise and the pound dived to a new monthly bottom at 1.1618. Price action today is expected to continue to be dictated by the strength of the dollar, with everyone waiting on the information surrounding the job openings in the U.S. at 12:15 GMT today. Whether the pound will seek a new bottom will depend on whether the released data can provoke a new wave of purchases.
EUGERMANY40
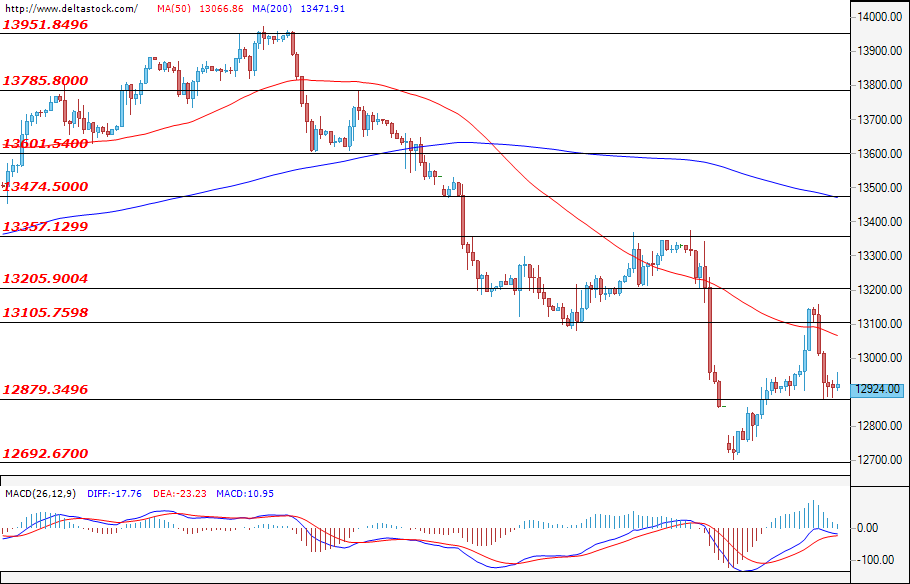
The positive German data, that came out yesterday morning, seemed to push the bulls to attack, resulting in a new weekly high of 13156. However, the start of a corrective move did not take long, and after the opening of the U.S. session, the EUGERMANY40 reached the support formed at 12879. The index managed to stabilise there and finish the day at around 12926. Today at 6:00 GMT and 7:55 GMT, we will be expecting data on import prices and the change in unemployment for Germany, both of which may spur traders to go on the offensive. The likelihood of the pressure continuing and the trend deepening is high, but moves in the opposite direction should not be ruled out as well.
US30
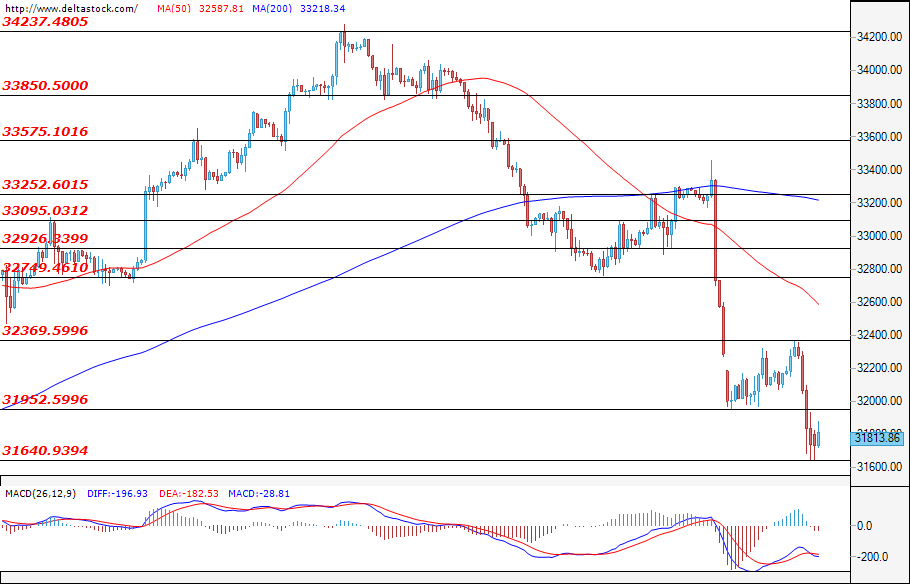
Yesterday, the session for the blue-chip index started promisingly – with an extension of the uptrend that continued on Monday after filling its gap. Shortly before Wall Street opened, the index hit a new weekly high of 32.369, but after the U.S. open, the bears took complete control of the market. Following yesterday’s release of the strong dollar data at 14:00 GMT, the index breached the previous support at 31952 and formed a new low at 31640. There, the market stabilised and ended the trading session at around 31814. Today, the non-farm employment change data for the U.S. at 12:15 GMT may deepen the trend in the U.S. indices and we may see a new bottom. However, in a bear market, it is good to remember that while upward corrections are often sizable and appeal lucrative, they tend to be short-lived.
EURGBP Takes a Breather after Amazing Rally
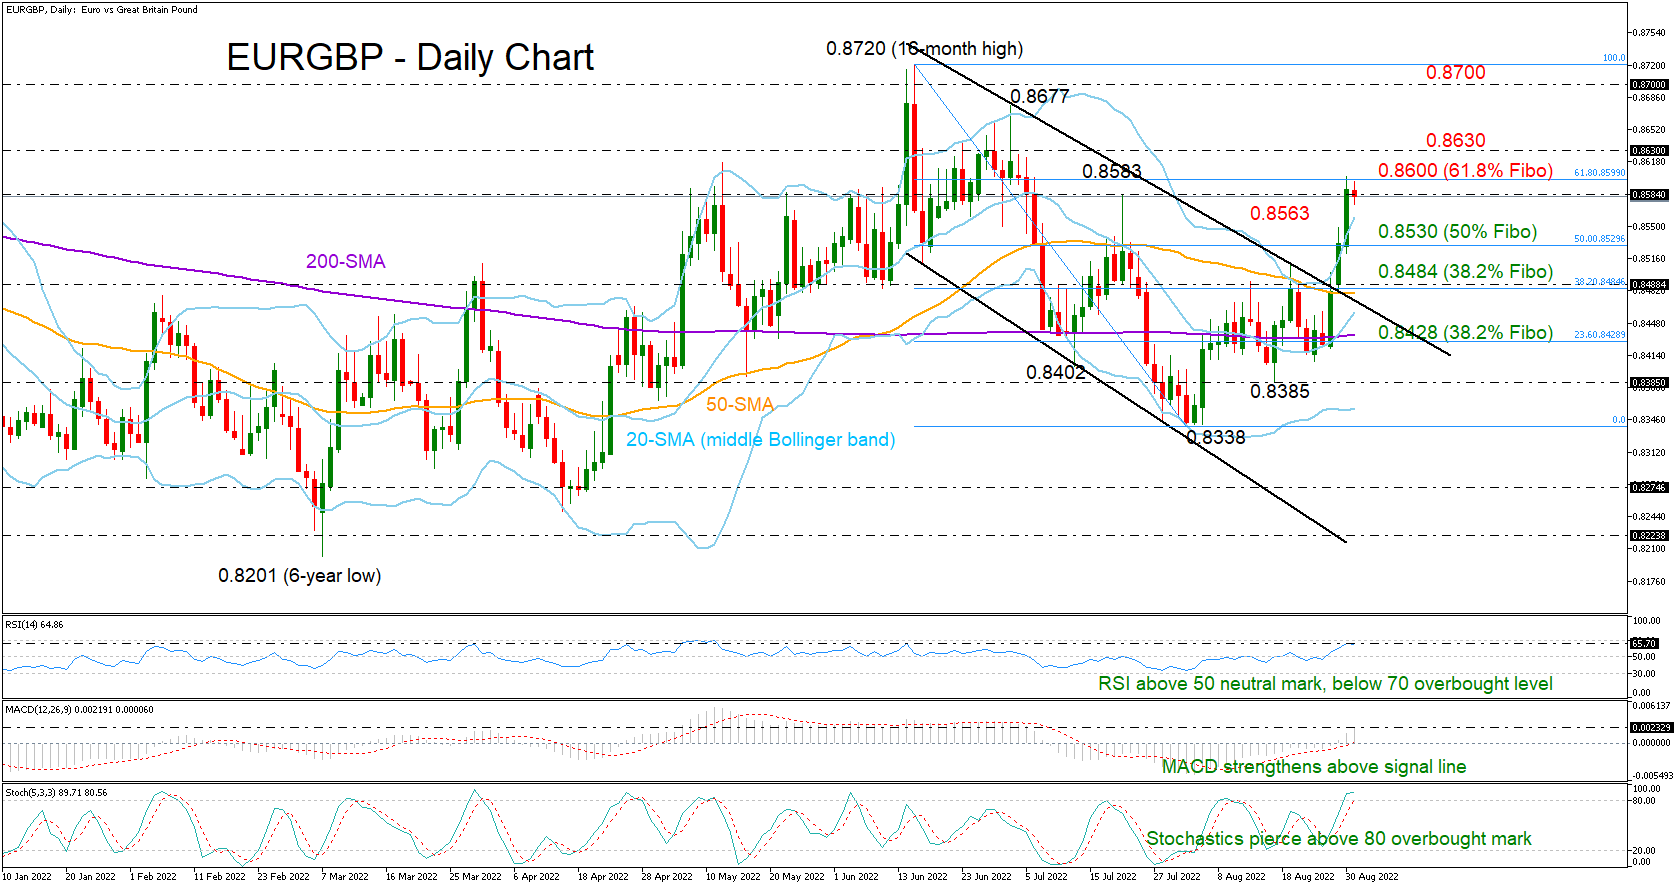
EURGBP has been in a marvelous rally over the past three consecutive trading days, appreciating by 2.0% to top at 0.8600 and slightly above July’s intra swing high of 0.8583.
The ascend picked up steam following the pivot near the 50-day simple moving average (SMA) and the resistance trendline drawn from 0.8677. The question now is whether the impressive rebound will continue at the same strong pace.
According to the momentum indicators, the market has not confirmed overbought conditions yet as the RSI is still some distance below its 70 level, while the Stochastics have just pierced above 80. Yet, with the price having closed significantly above the upper Bollinger band as it did back in mid-June, a downside correction would not be very surprising either.
Nevertheless, if the 0.8583 region, which is currently adding a footing under the pair, stands firm, and the 61.8% Fibonacci retracement of the latest downleg at 0.8600 allows more increases, the recovery could quickly test the 0.8630 bar. A decisive close above it may clear the way towards the 0.8677 barrier, while higher, the pair may again attempt to breach the 200-weekly SMA around 0.8700.
Should the bears retake control, the price could initially seek shelter near the 50% Fibonacci of 0.8530. Even lower, the slide may fight the 50-day SMA and the broken resistance line around the 38.2% Fibonacci of 0.8484. Crossing beneath that floor, selling pressures may take a breather near the 200-day SMA and the 23.6% Fibonacci of 0.8428 before speeding towards the August trough of 0.8338, unless the 0.8385 low comes to the rescue earlier.
In short, although downside risks in EURGBP are getting larger following the latest exponential recovery, the bulls could still recoup some extra ground if the price manages to close above 0.8600.
USDJPY Tries to Extend the Medium-Term Bullish Structure
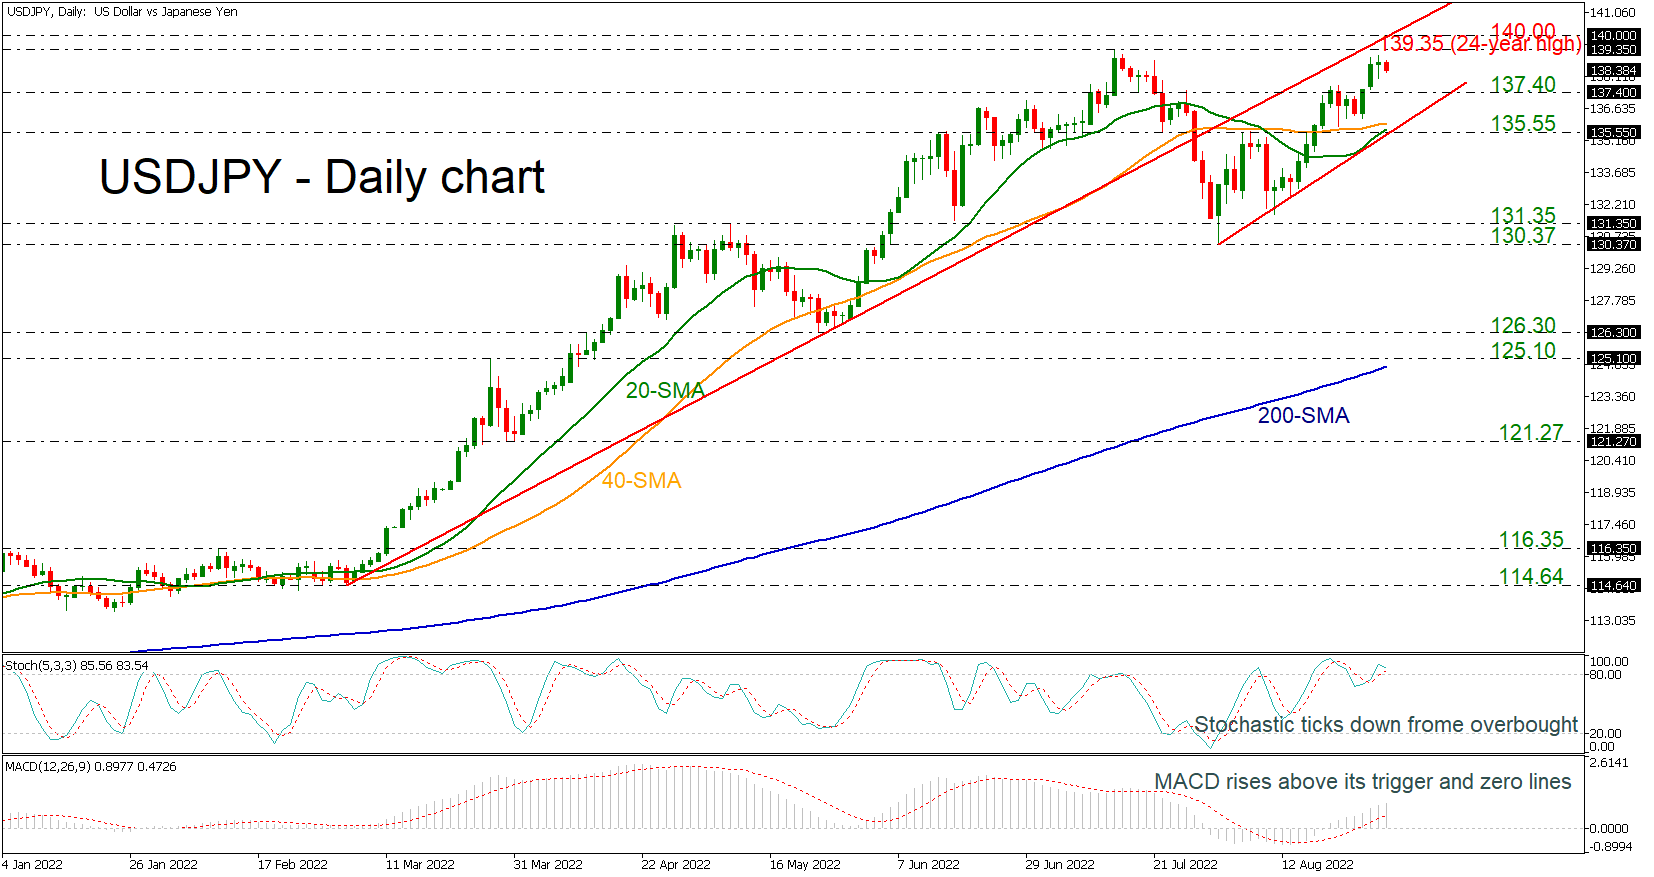
USDJPY has been gaining ground in the short-term timeframe, holding above the one-month uptrend line, despite today’s pullback so far. Though, the market is still moving beneath the medium-term ascending trend line and awaits a strong boost to post a higher high.
Technically, the MACD is holding above its trigger and zero lines; however, the stochastic oscillator is weakening its momentum entering the overbought region, suggesting that the next move may be to the downside.
Any moves beyond the 24-year high of 139.35 could take the market even higher, meeting the next psychological level of 140.00. The uptrend line drawn from the 114.64 support seems to be acting as resistance around 141.00.
On the other hand, violating the 137.40 support could see losses extending towards the 20- and 40-day SMAs, which are holding near the 135.55 barrier. Even lower, the bears could take the price below the short-term ascending trend line around the 131.35-130.37 region.
In the medium-term picture, USDJPY could resume an upside trend above the 24-year high of 139.35. It is also worth noting that the short-term SMAs keep distancing themselves above the 200-day SMA, raising optimism for a bull market.
DAX 40 Hits Resistance
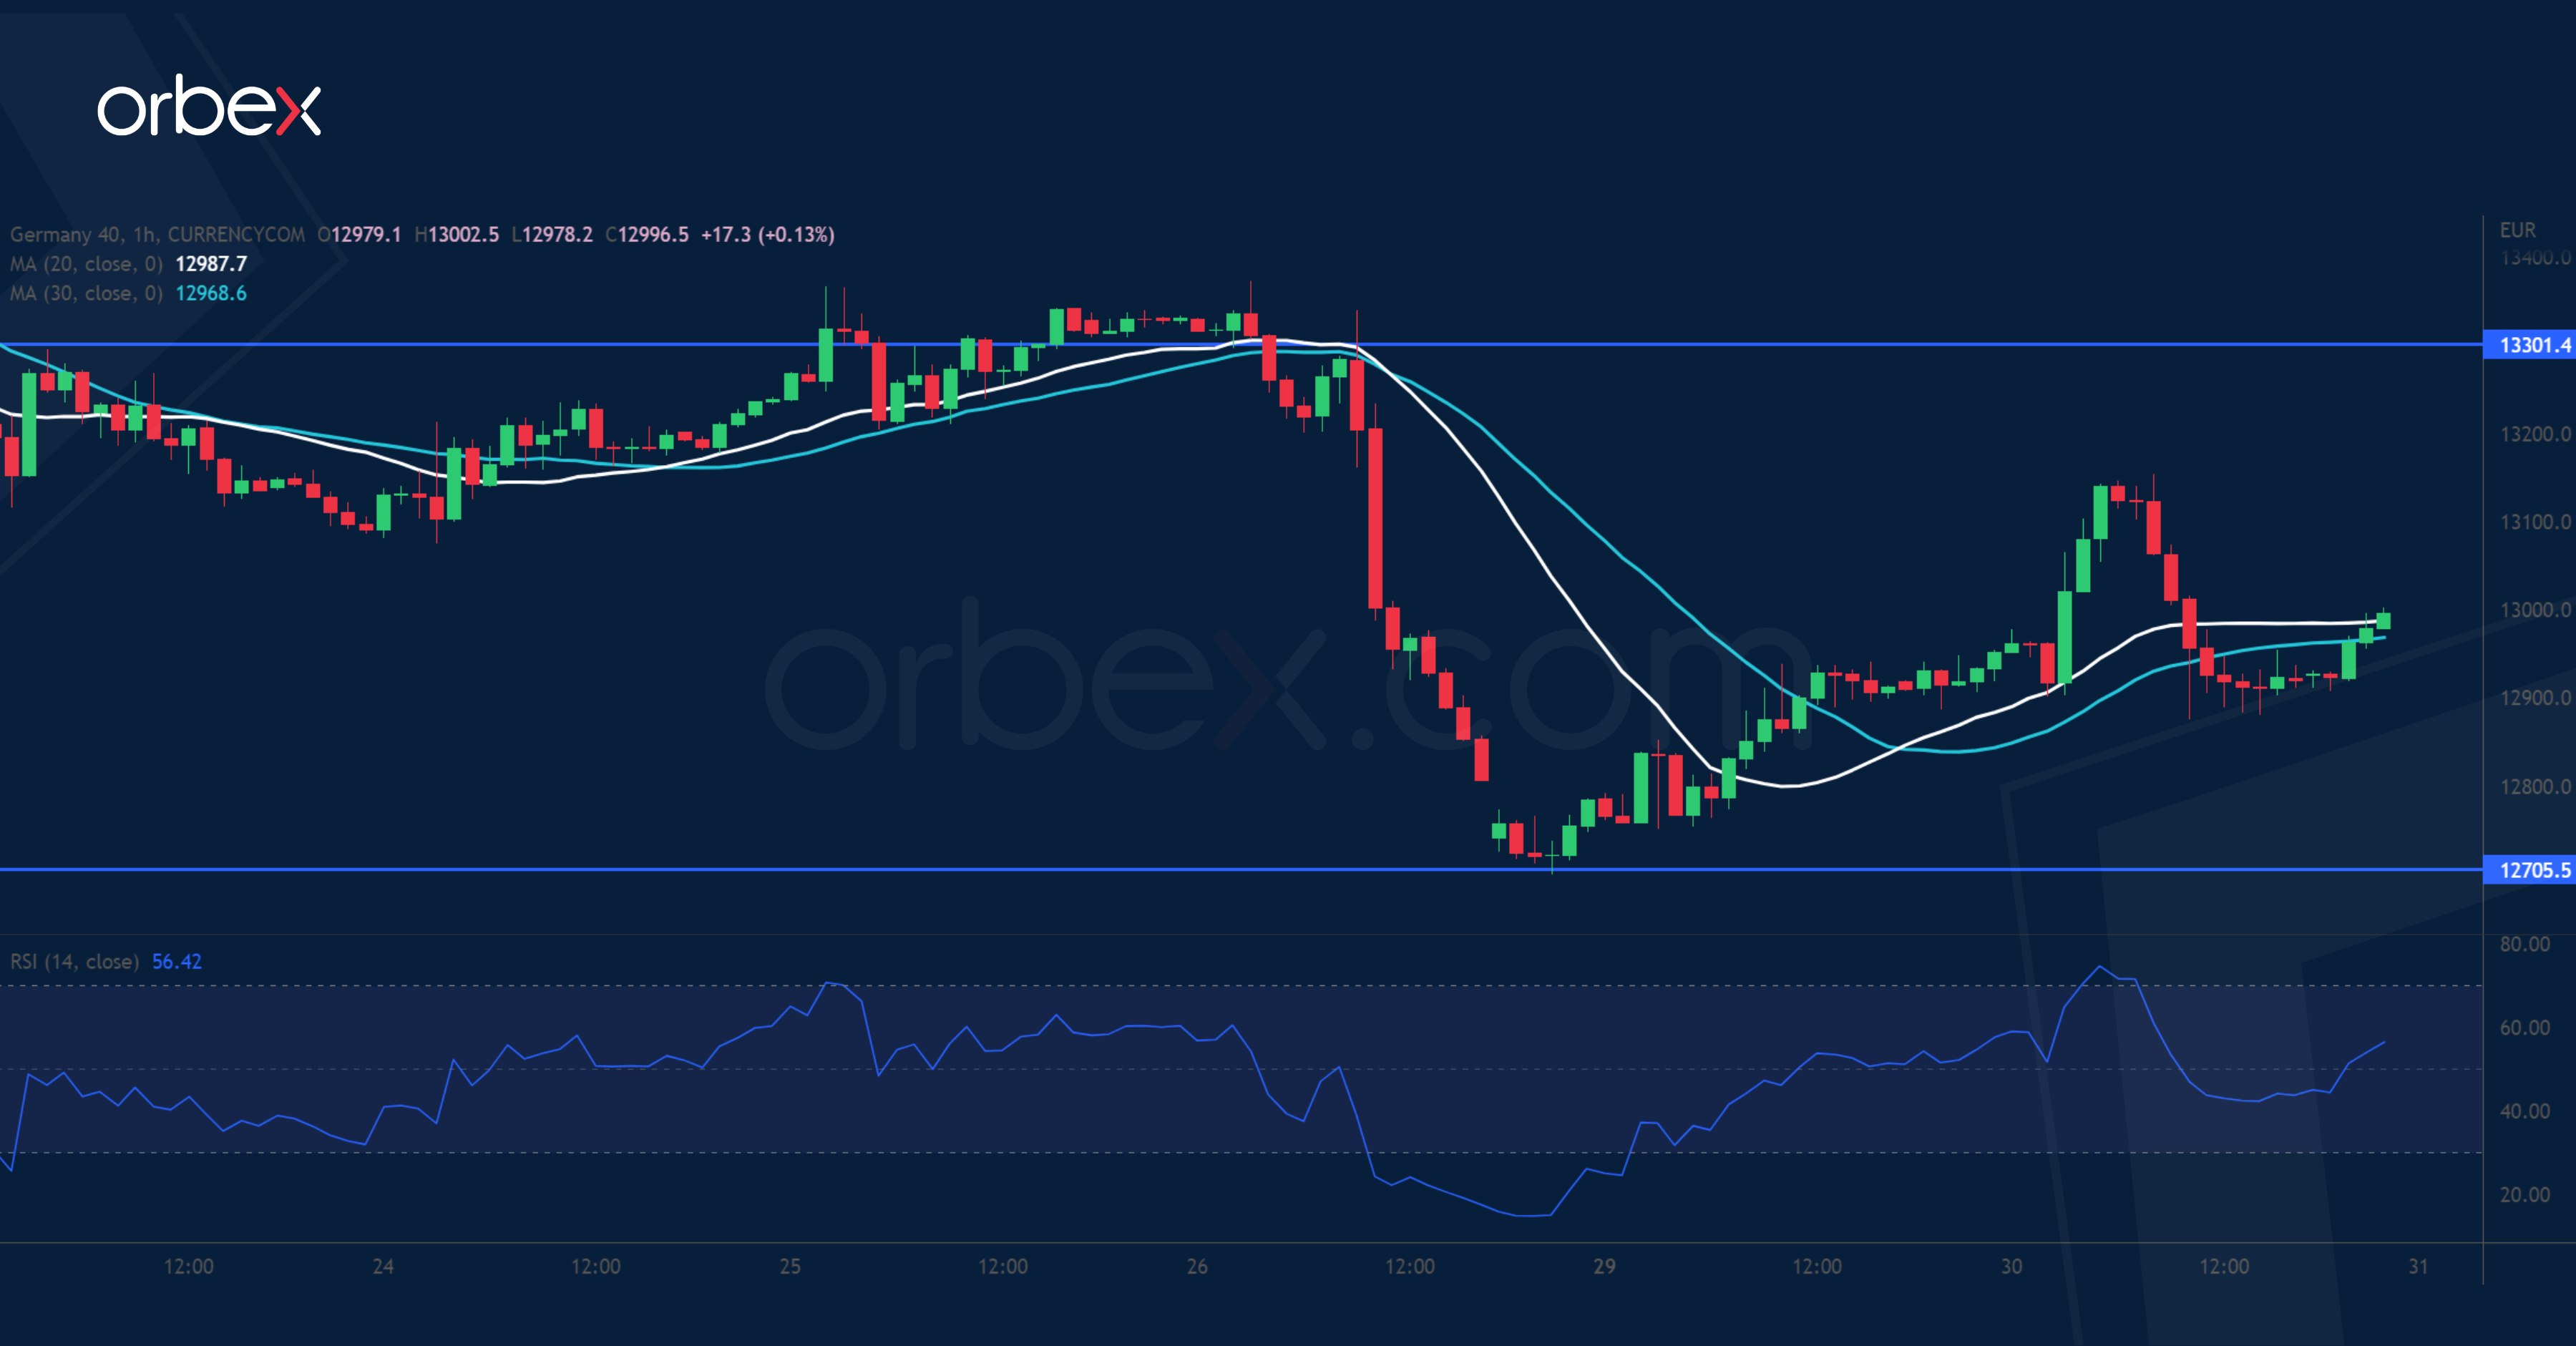
The Dax 40 remains under pressure as a brewing energy crisis compounds a hawkish ECB. The index bounced off the base of a bullish breakout in mid-July (12700). A combination of profit-taking and fresh buying led the recovery after the RSI fell into the oversold area. However, trend followers were eager to sell into strength near 13300 from the last leg of sell-off. The lack of purchasing power may continue to depress the price action. A fall below 12700 would send the index to the double bottom (12400) on the daily chart.
GBP/USD Breaks Lower
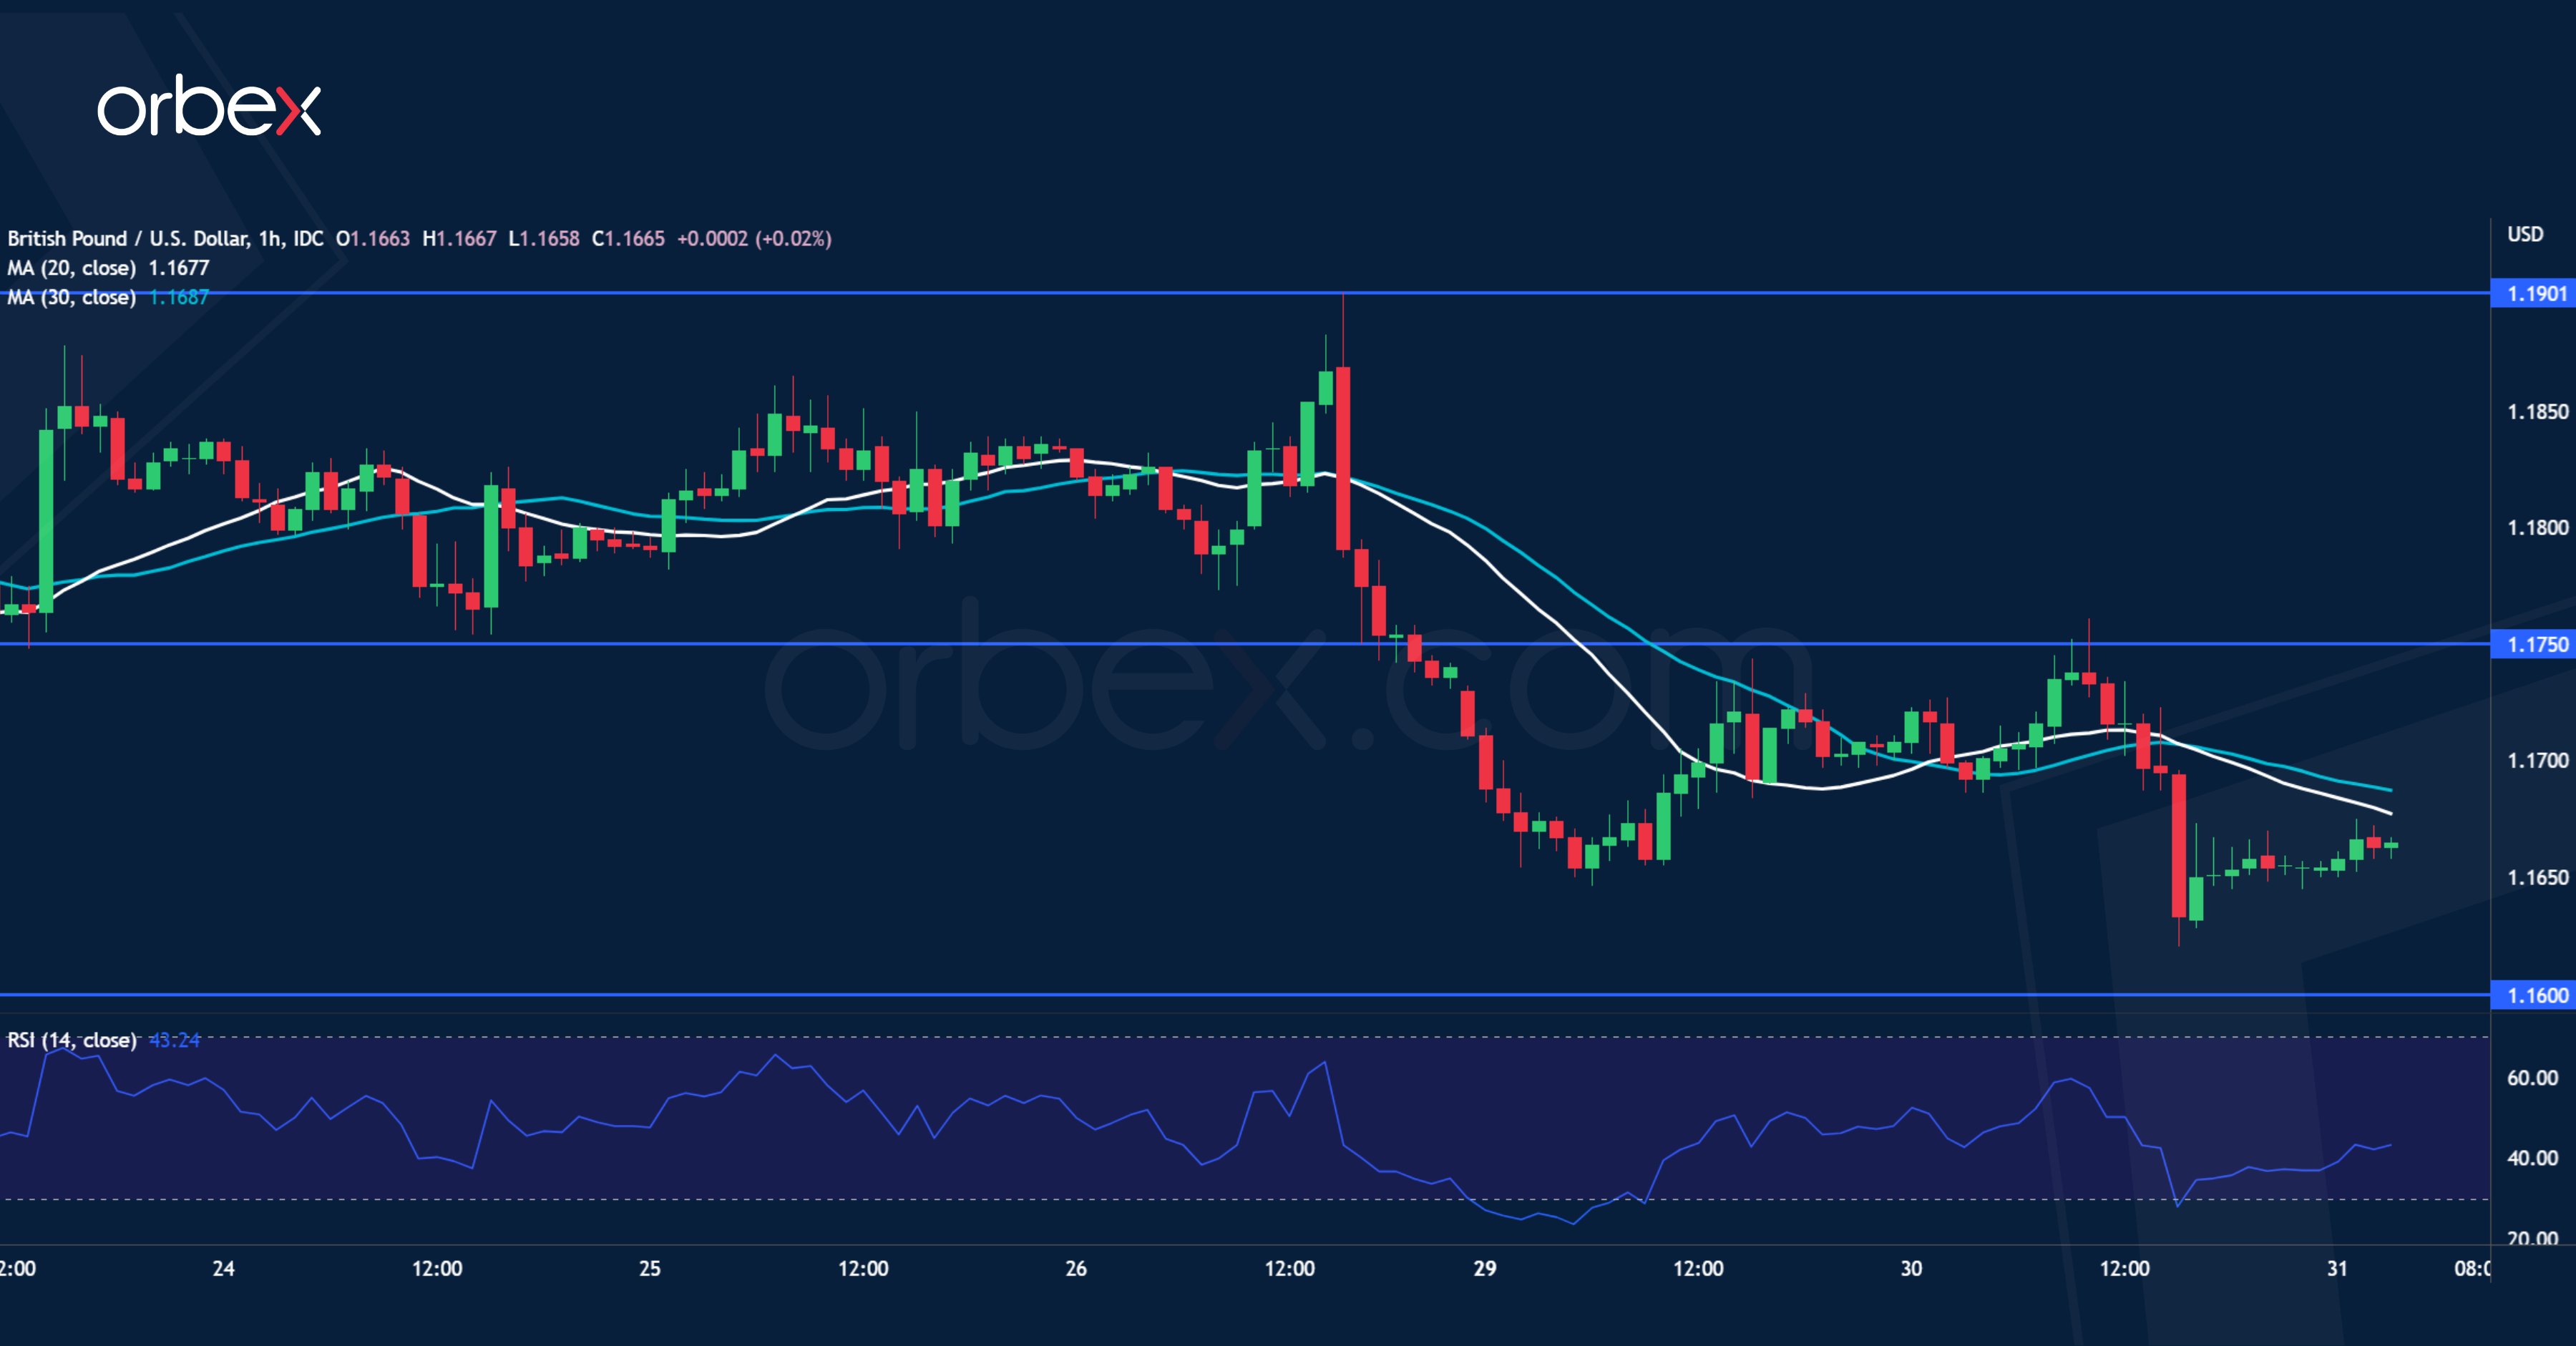
The pound plunges over fears of a pronounced recession as energy bills soar across the UK. Following a brief consolidation in July, a bearish MA cross on the daily chart indicates a continuation to the downside. The RSI’s oversold condition attracted some buying near 1.1650. But buyers’ failure to hold onto their timid gains foreshadows more rooms on the way down. A drop below 1.1600 would open the door to March 2020’s lows near 1.1400. 1.1750 has turned into a resistance and is likely to cap the next bounce.
EUR/USD Tests Resistance
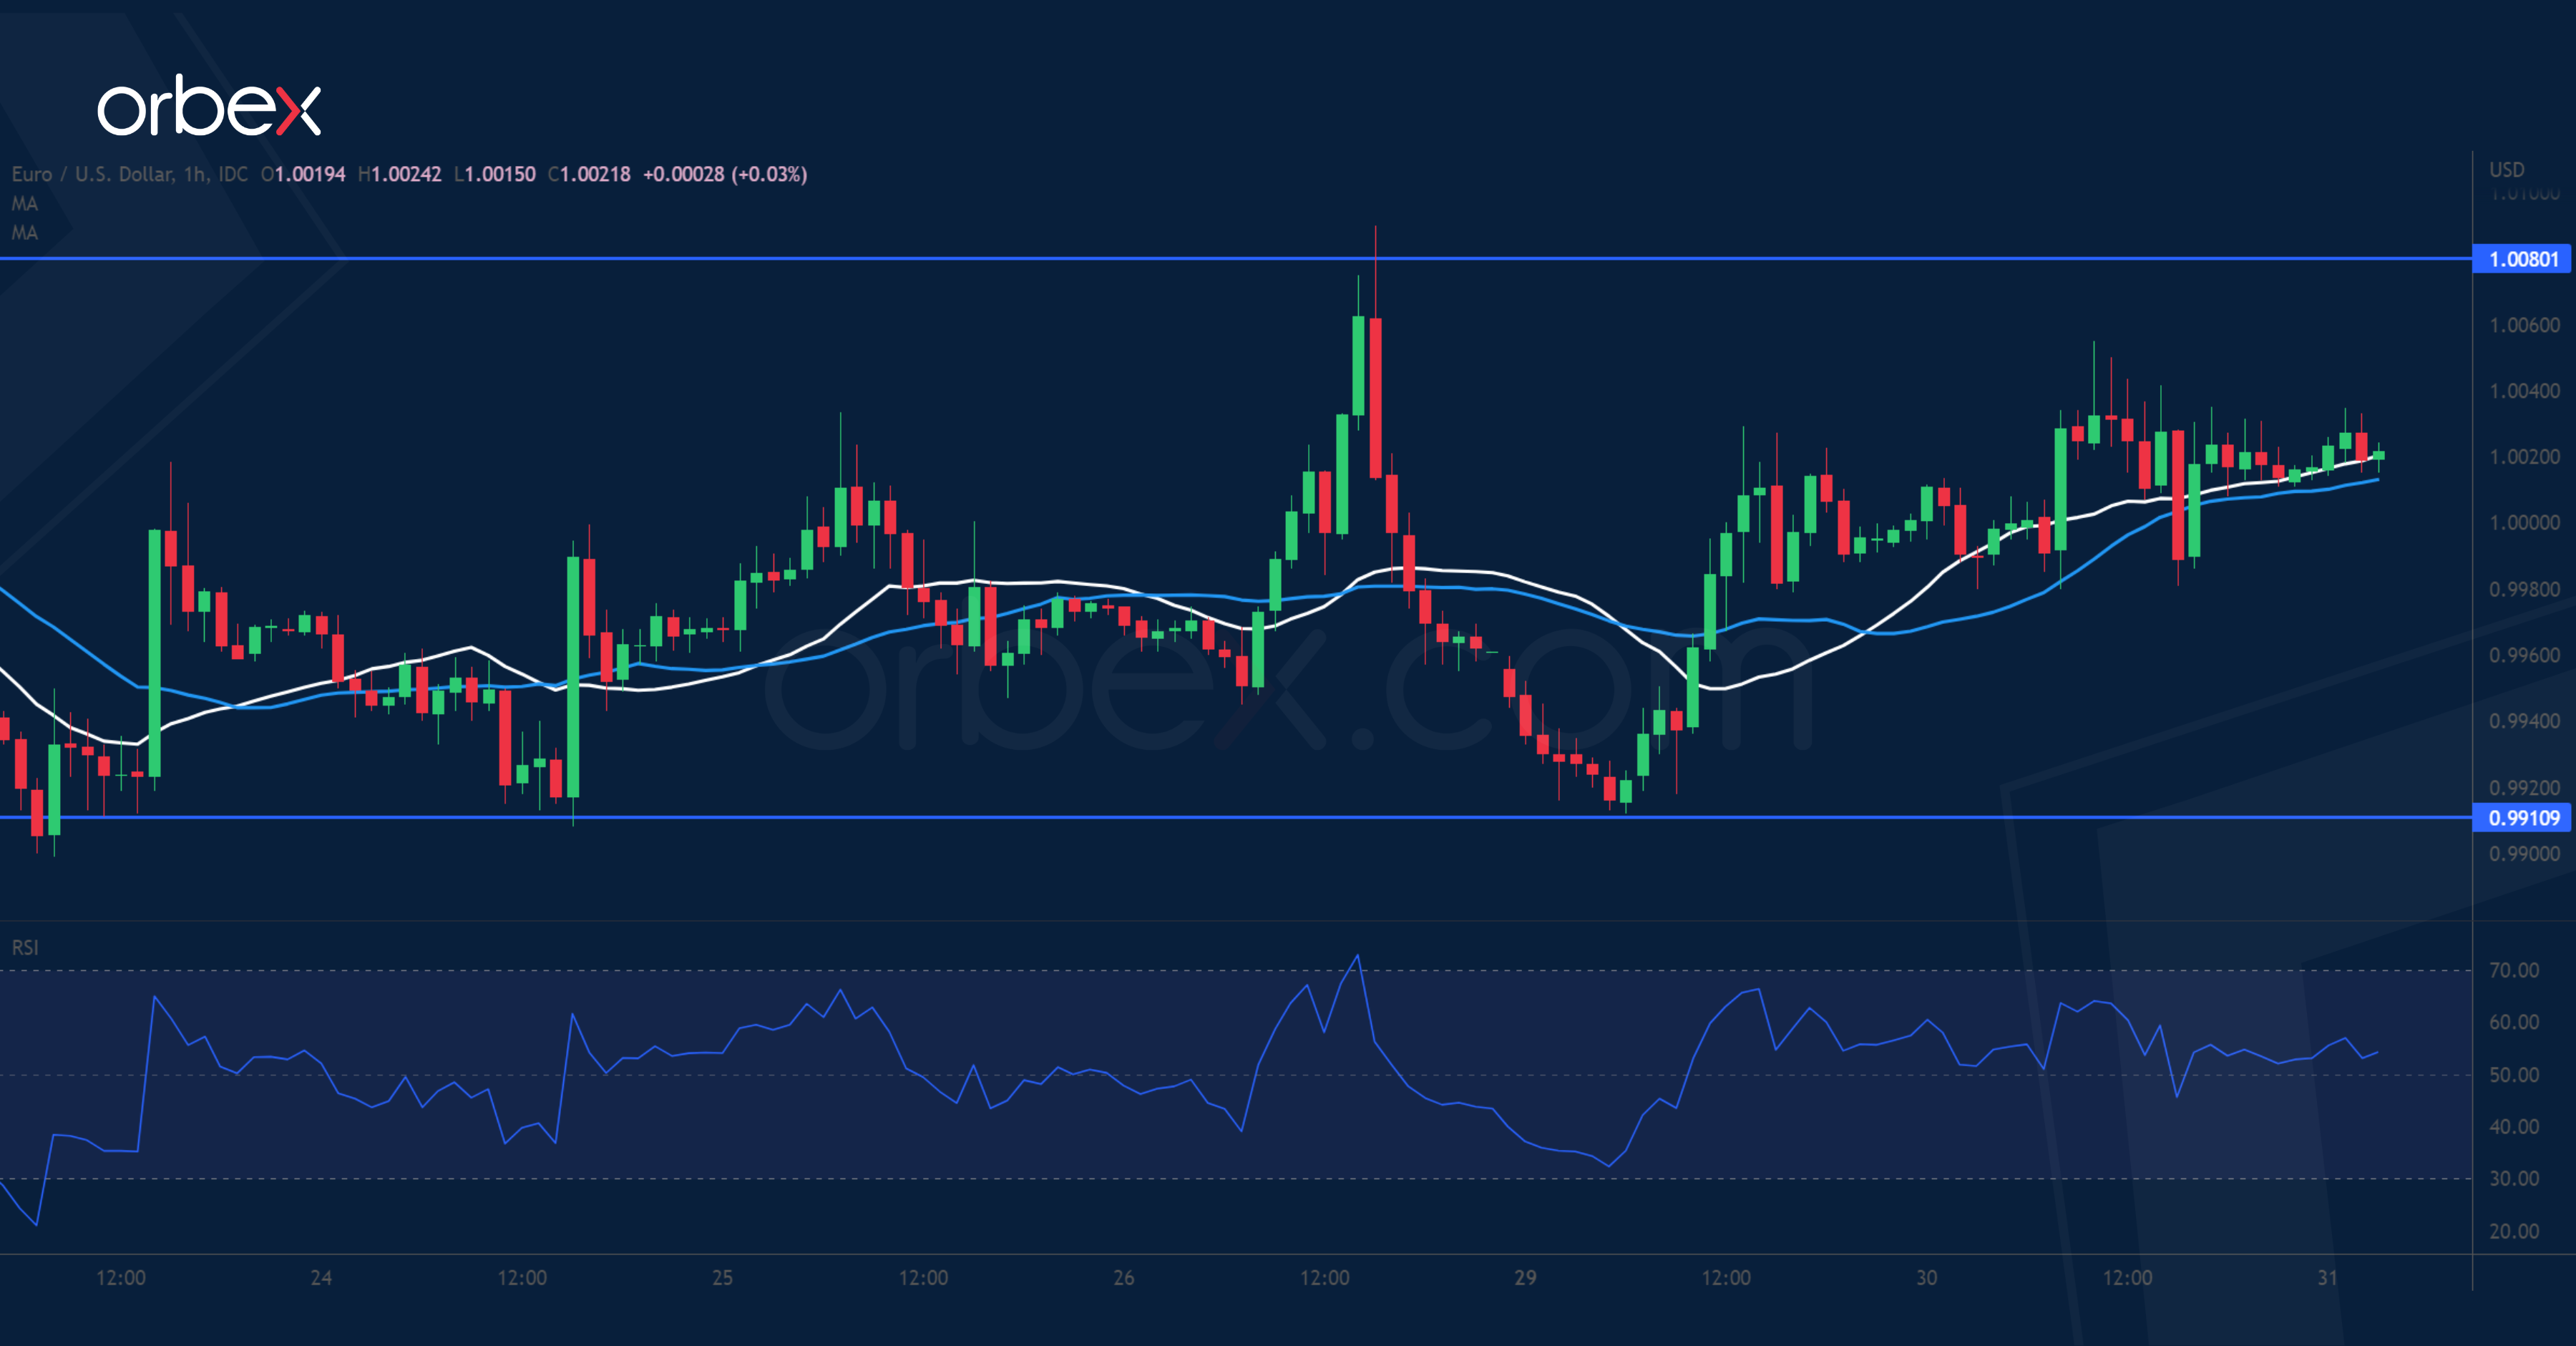
The euro claws back losses as traders price in the likelihood of a large-sized rate hike by the ECB. The single currency has been struggling to hold onto the parity threshold. A whipsaw around 1.0080 suggested stiff selling pressure, but the long side has managed to keep the latest correction contained at 0.9910. A bullish breakout would extend the rebound to the support-turned-resistance at 1.0220 where renewed selling interest could be expected as medium-term sentiment remains pessimistic.
Technical Outlook and Review
USD/JPY:
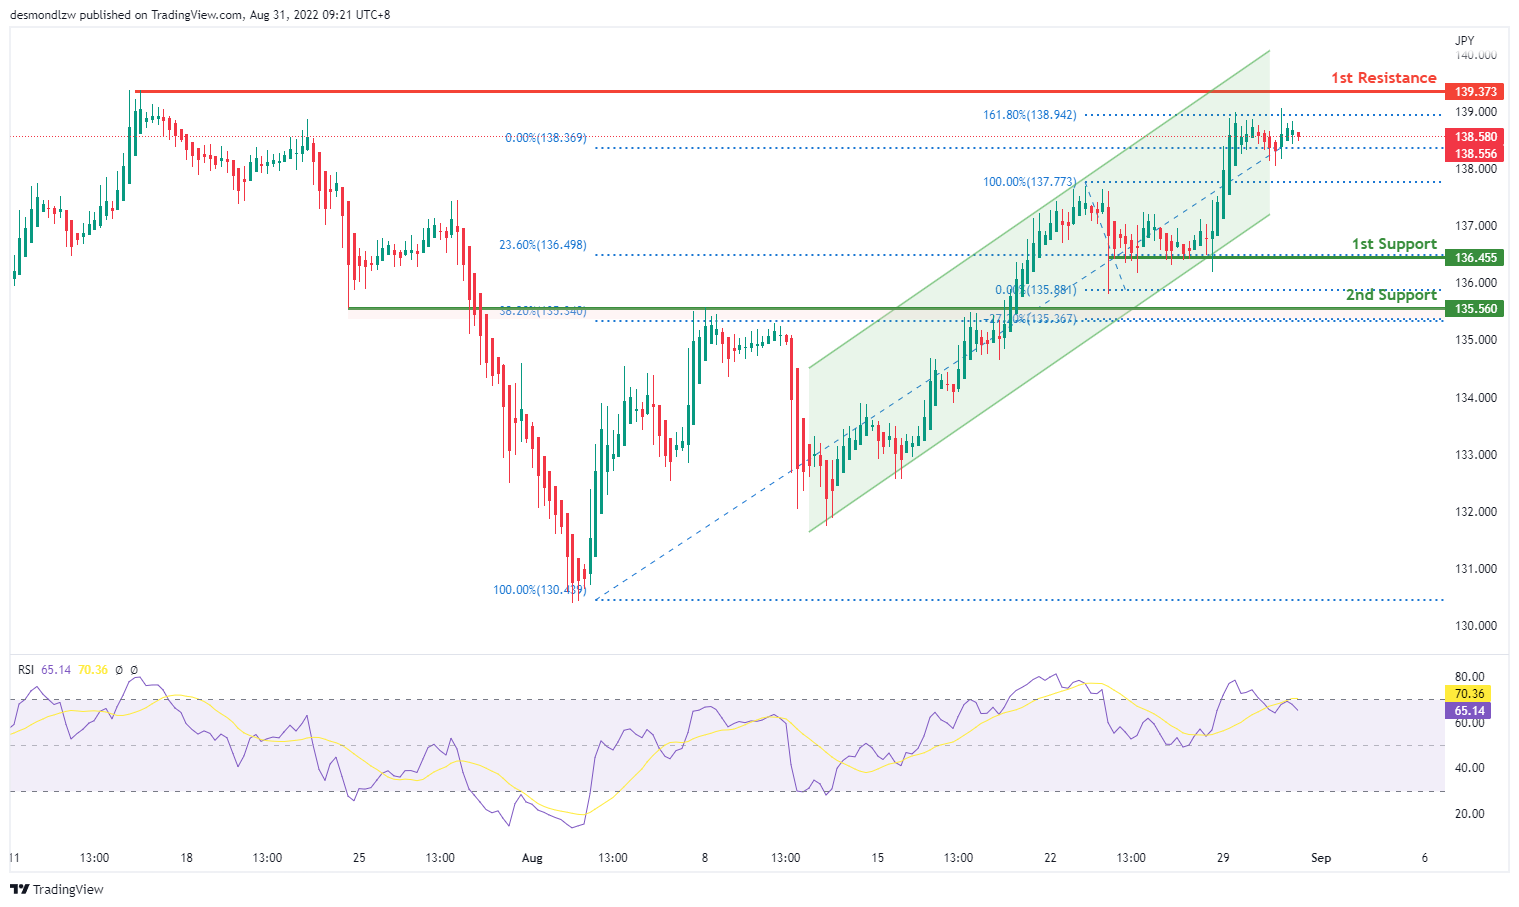
On the H4 chart, price has confirmed a bullish momentum breaking the previous high. We are bullish bias- Price has tested 138.870 where the previous swing high and 161.8% extension sits and is looking to move toward the first resistance at 139.373 where the previous swing high sits. Alternatively, if price reverse, it might pull back to test the first support at 136.455 where the 23.6% fibonacci retracement sits then subsequently the second support at 135.560 where the 38.2% retracement sits
Areas of consideration:
- H4 time frame, 1st resistance at 139.373
- H4 time frame, 1st support at 136.455
DXY:
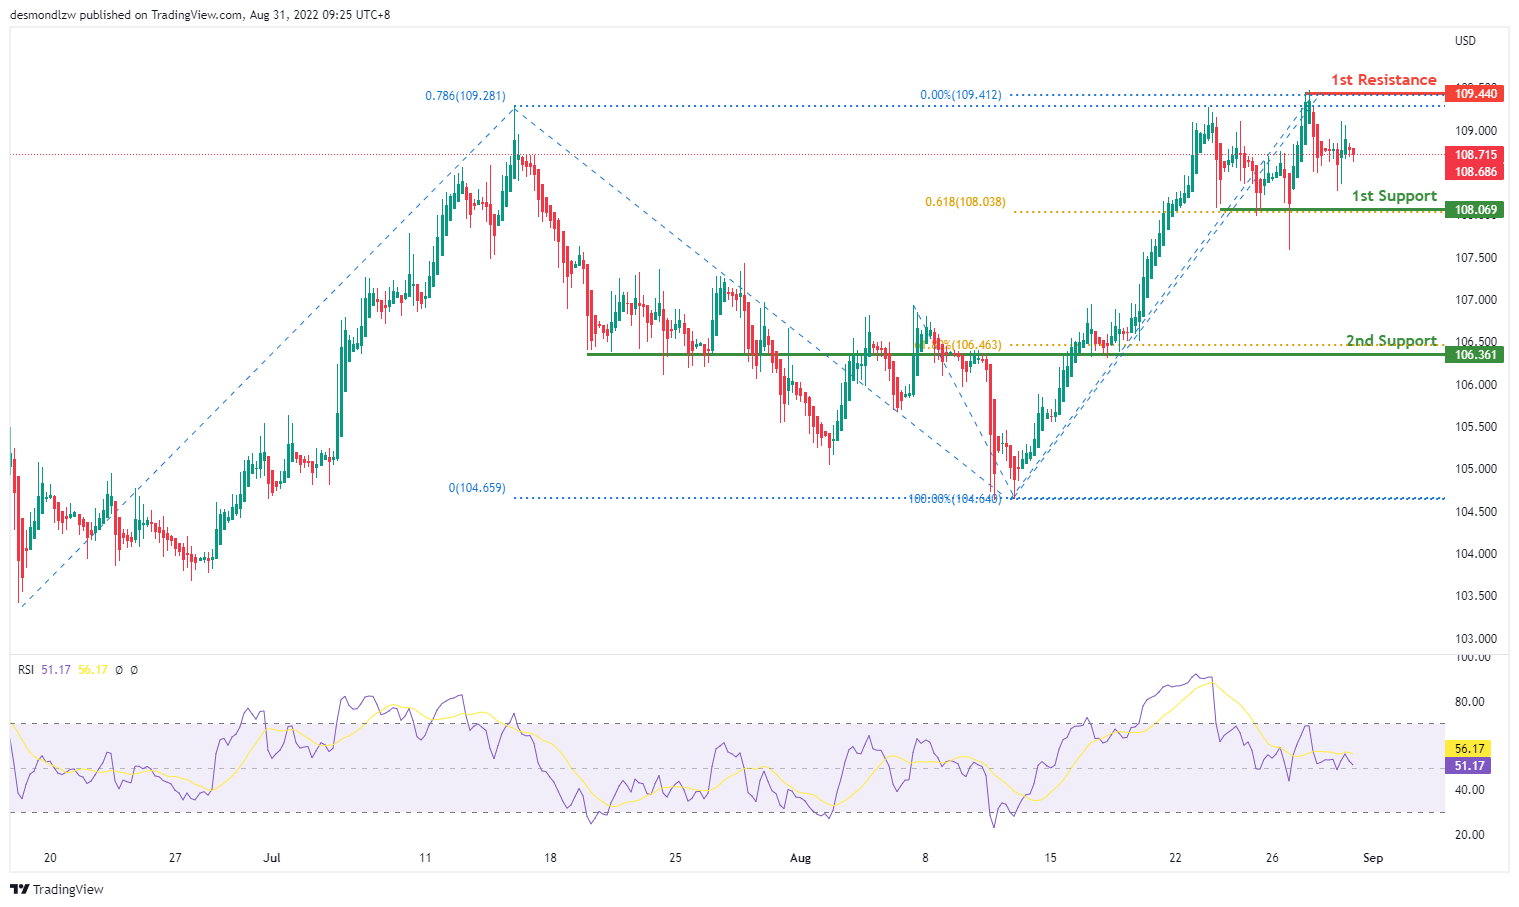
On the H4, price is still moving in an ascending trend and is in a bullish momentum. Price has tested the first resistance at 109.440 where the 78.6% Fibonacci projection and the previous swing high sits. If price fails to break this level, it will pull back to test the first support at 108.069 where the 61.8% projection sits and subsequently the second support at 106.235 where the 61.8% retracement sits
Areas of consideration:
- H4 time frame, 1st resistance at 109.440
- H4 time frame, 1st support at 108.069
EUR/USD:
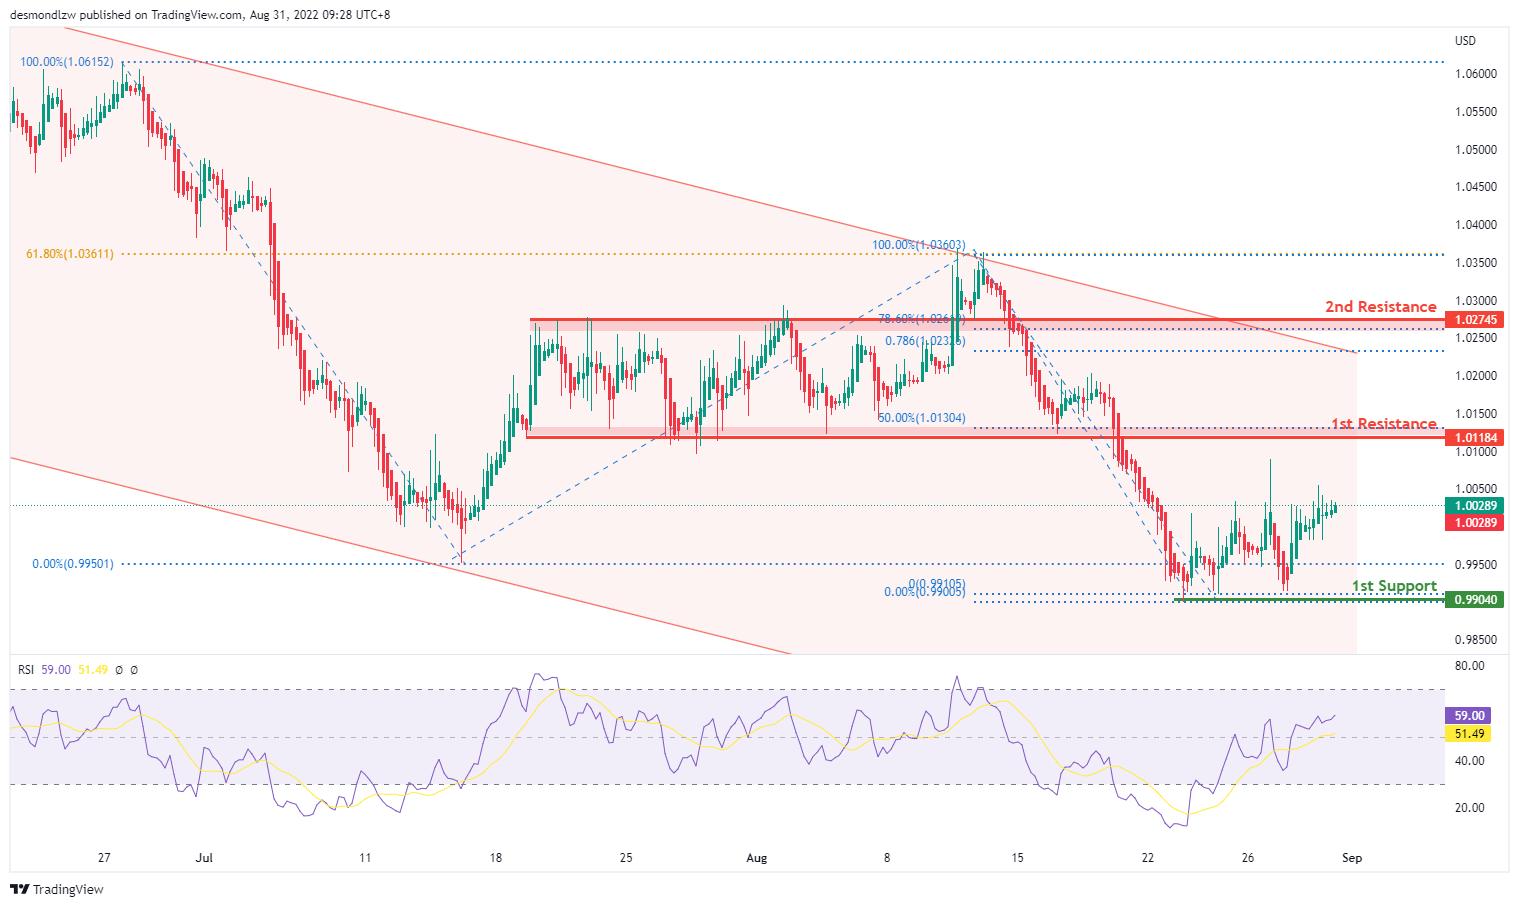
On the H4, prices seem to have formed a triple bottom and have reversed – we are in a slightly bullish bias. Price look like it’s pulling back to test the first resistance at 1.0118 where the previous swing low and 50% retracement sits and subsequently the second resistance at 1.0274 where the 78.6% retracement and swing high sits
Areas of consideration :
- H4 1st resistance at 1.0118
- H4 1st support at 0.9904
GBP/USD:
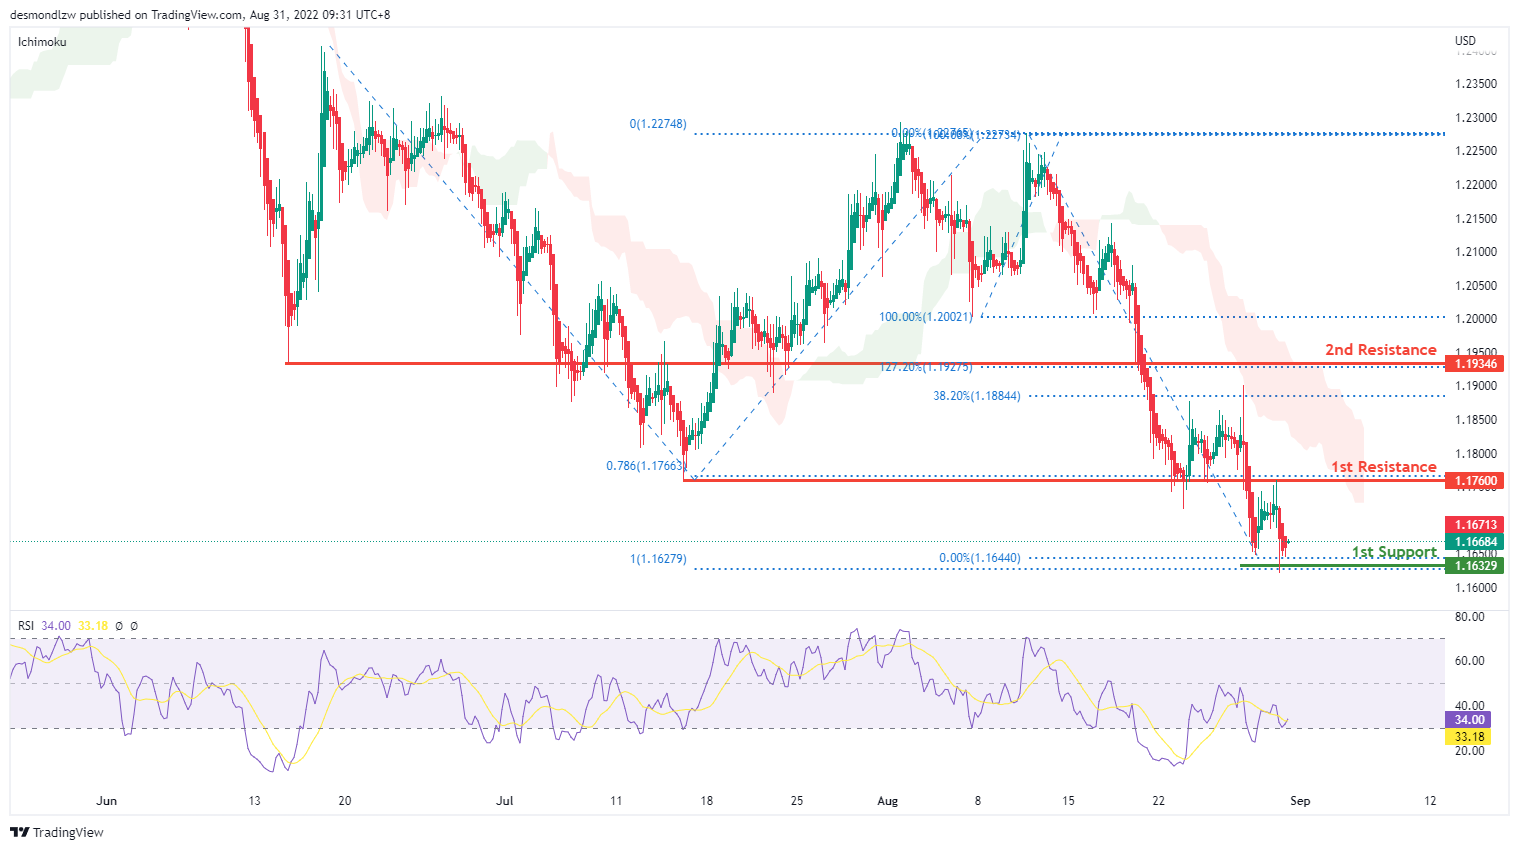
On the H4, prices seem to be in a bearish momentum and respecting the ichimoku cloud. Prices have broken the 78.6% projection level and is testing the first support, 100% projection at 1.1632 levels again. If price fails to break this level, it might look to test the first resistance at 1.1760 level where the 78.6% projection sits then the second resistance at 1.1934 level where the previous swing low and 127.2% extension sits
Areas of consideration:
- H4 1st resistance at 1.176
- H4 1st support at 1.1632
USD/CHF:
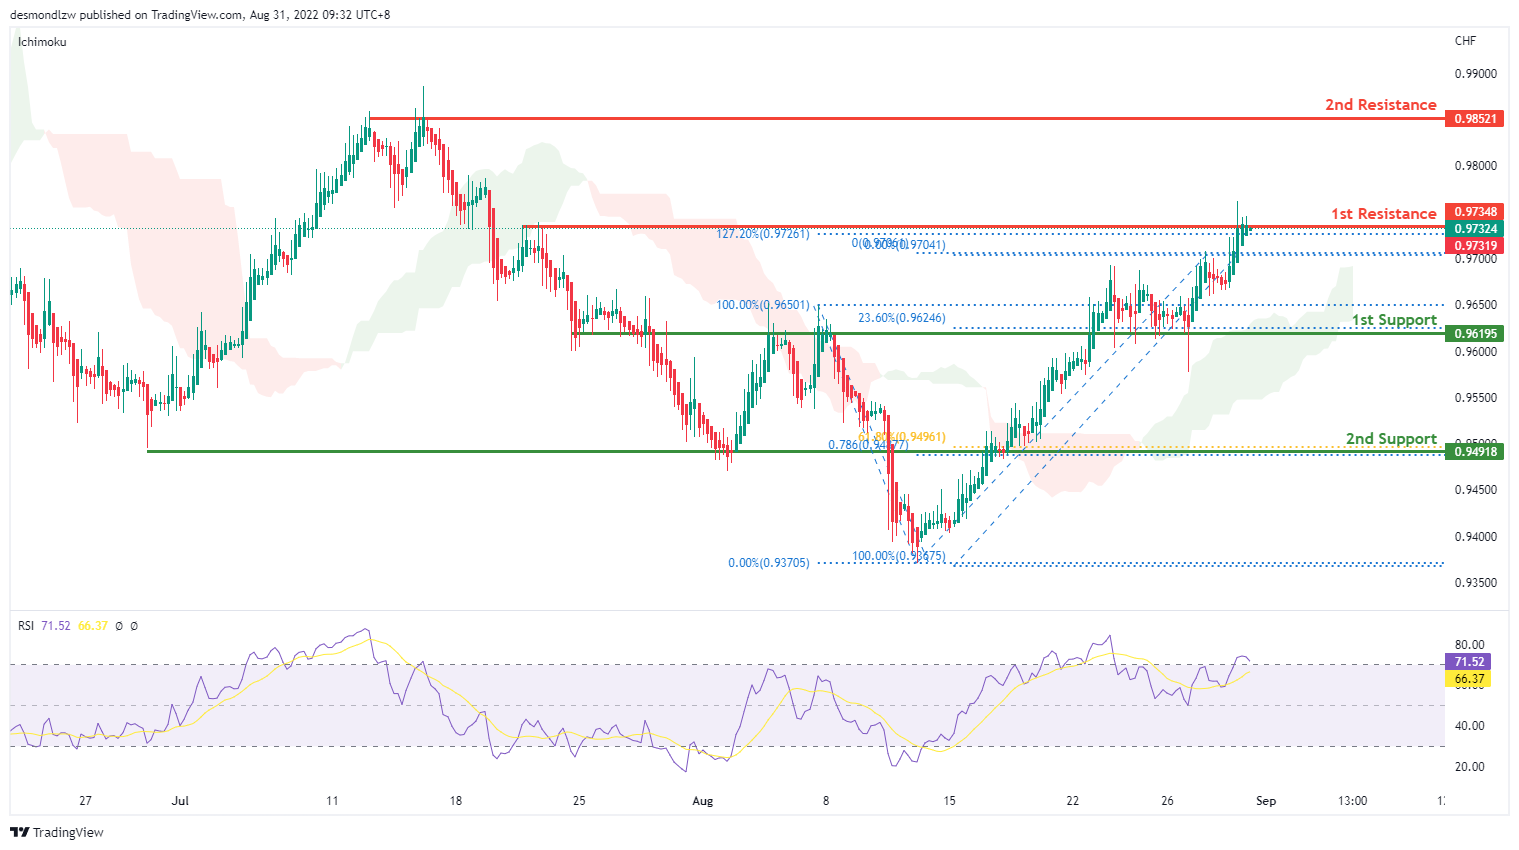
On the H4, with prices moving above the ichimoku cloud and breaking the descending trend, we are bullish. Price is currently testing the first resistance at 0.9734 where the 127.2% extension sits. If price continues with bullish momentum, it will bring price to second resistance at 0.9852. Alternatively, prices could pull back to test the first support at 0.96282 where the 23.6% fibonacci retracement and previous swing low sits then the second support at 0.9491 where the 61.8% retracement and 78.6% projection sits
Areas of consideration
- H4 1st support at 0.9628
- H4 1st resistance at 0.9734
XAU/USD (GOLD):
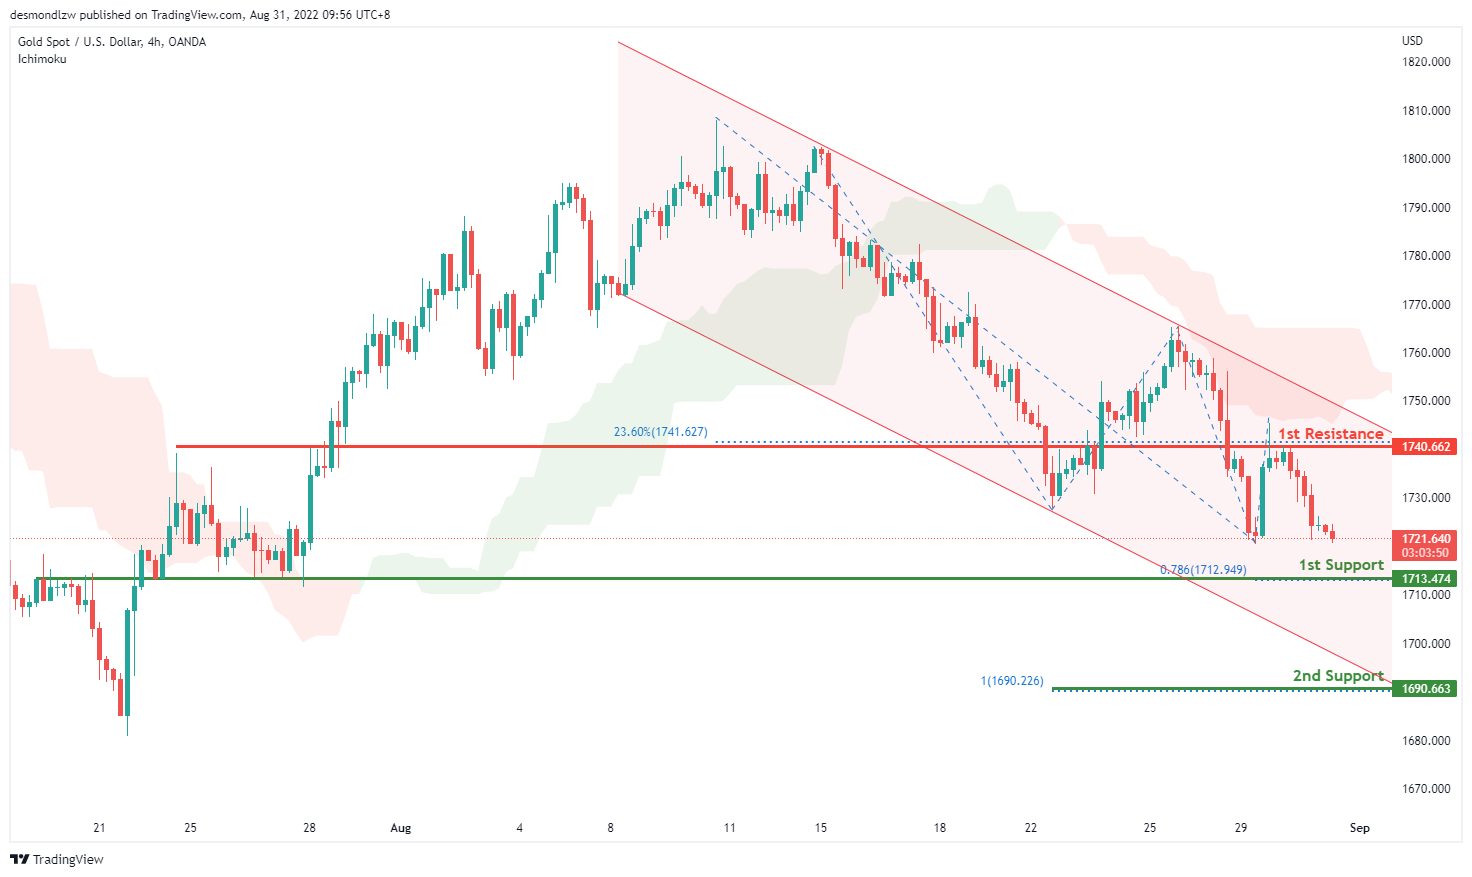
On the H4, with prices below ichimoku cloud and moving within the descending channel, we have a bearish bias that the price may drop to the 1st support at 1713.474, where the overlap support and 78.6% fibonacci projection are. If the price can break this support line, the next support level could be at 1690.663, where the 100% fibonacci projection is. Alternatively, the price may rise to the 1st resistance at 1740.662, where the swing highs and 23.6% fibonacci retracement are.
Areas of consideration:
- H4 time frame, 1st support at 1713.474
- H4 time frame, 2nd support at 1690.663
AUD/USD:
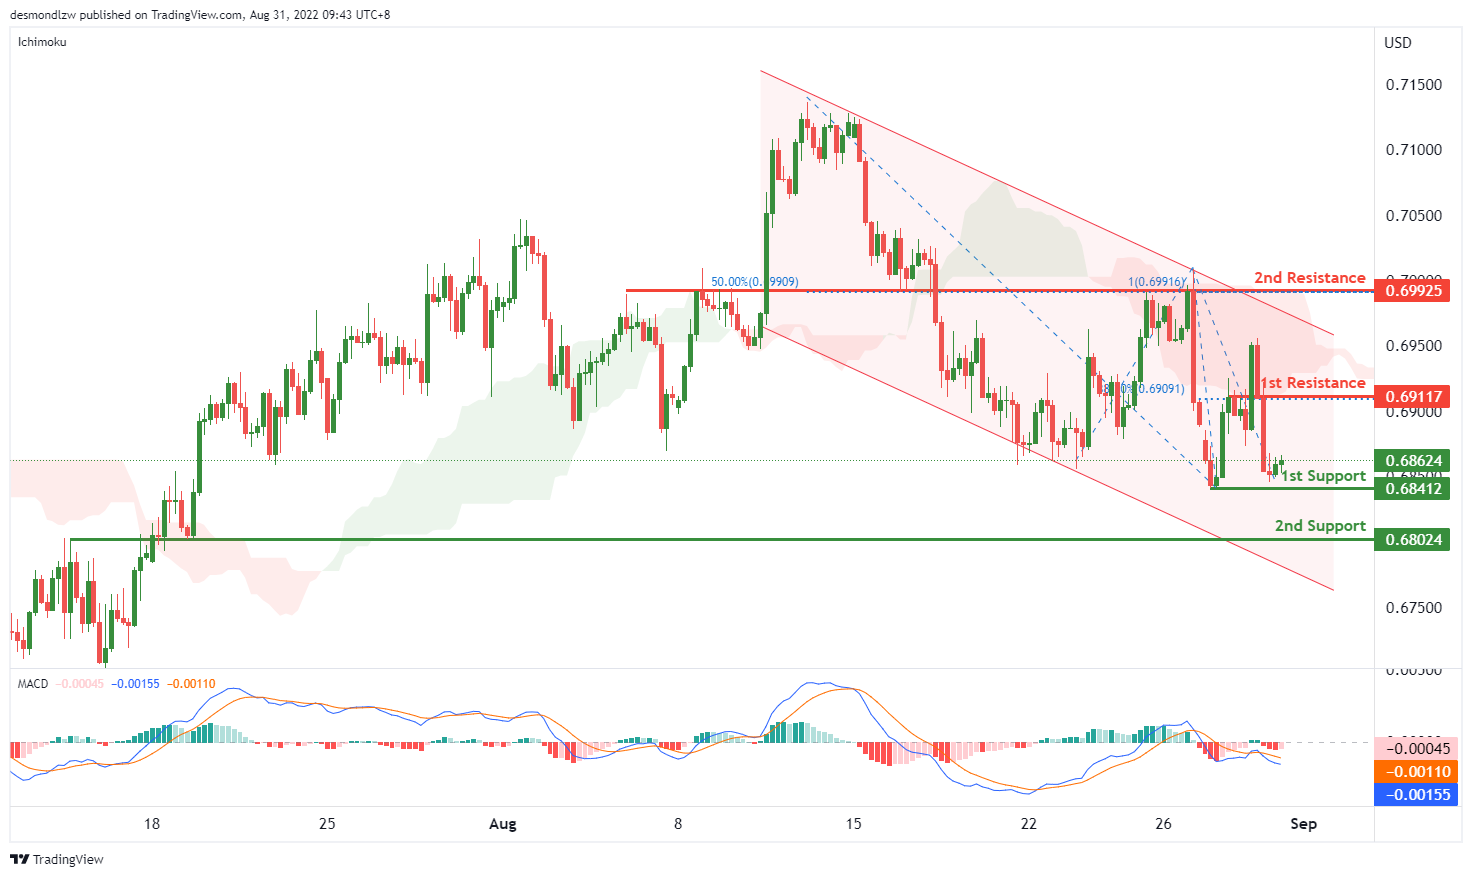
On the H4, with the price moving below the ichimoku cloud, moving within the descending channel and MACD is showing a death cross, we have a bearish bias that the price may drop to the 1st support at 0.68412, which is in line with the swing low to the 2nd support at 0.68024, where the overlap support is. Alternatively, the price may rise to the 1st resistance at 0.69118, where the 38.2% fibonacci retracement and previous swing high are. If the price can break this resistance level, we can expect the price to rise to the 2nd resistance at 0.69925, where the swing highs, 50% fibonacci retracement and 100% fibonacci projection are.
Areas of consideration
- H4 1st support at 0.68412
- H4 2nd support at 0.68024
NZD/USD:
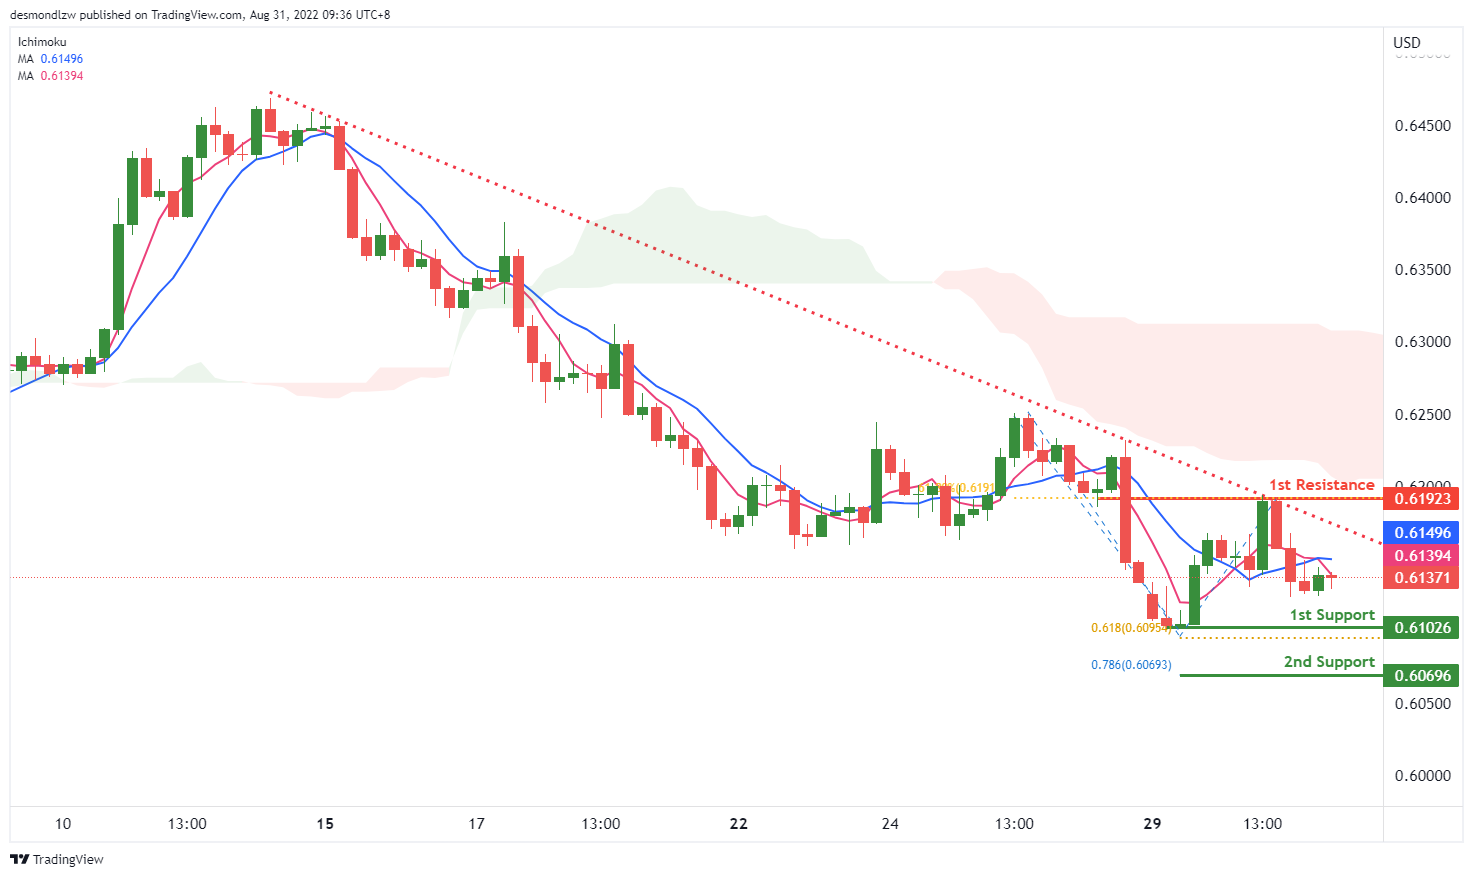
On the H4, with price moving within the descending trendline, below the ichimoku indicator and there is a death cross of MA, we have a bearish bias that price may drop to 1st support at 0.61026, where the swing low and 61.8% fibonacci projection are to the 2nd support at 0.60696, where the 78.6% fibonacci projection is. Alternatively, price could rise to 1st resistance at 0.61923, which is in line with 61.8% fibonacci retracement.
Areas of consideration:
- H4 time frame, 1st support at 0.61026
- H4 time frame, 2nd support at 0.60696
USD/CAD:
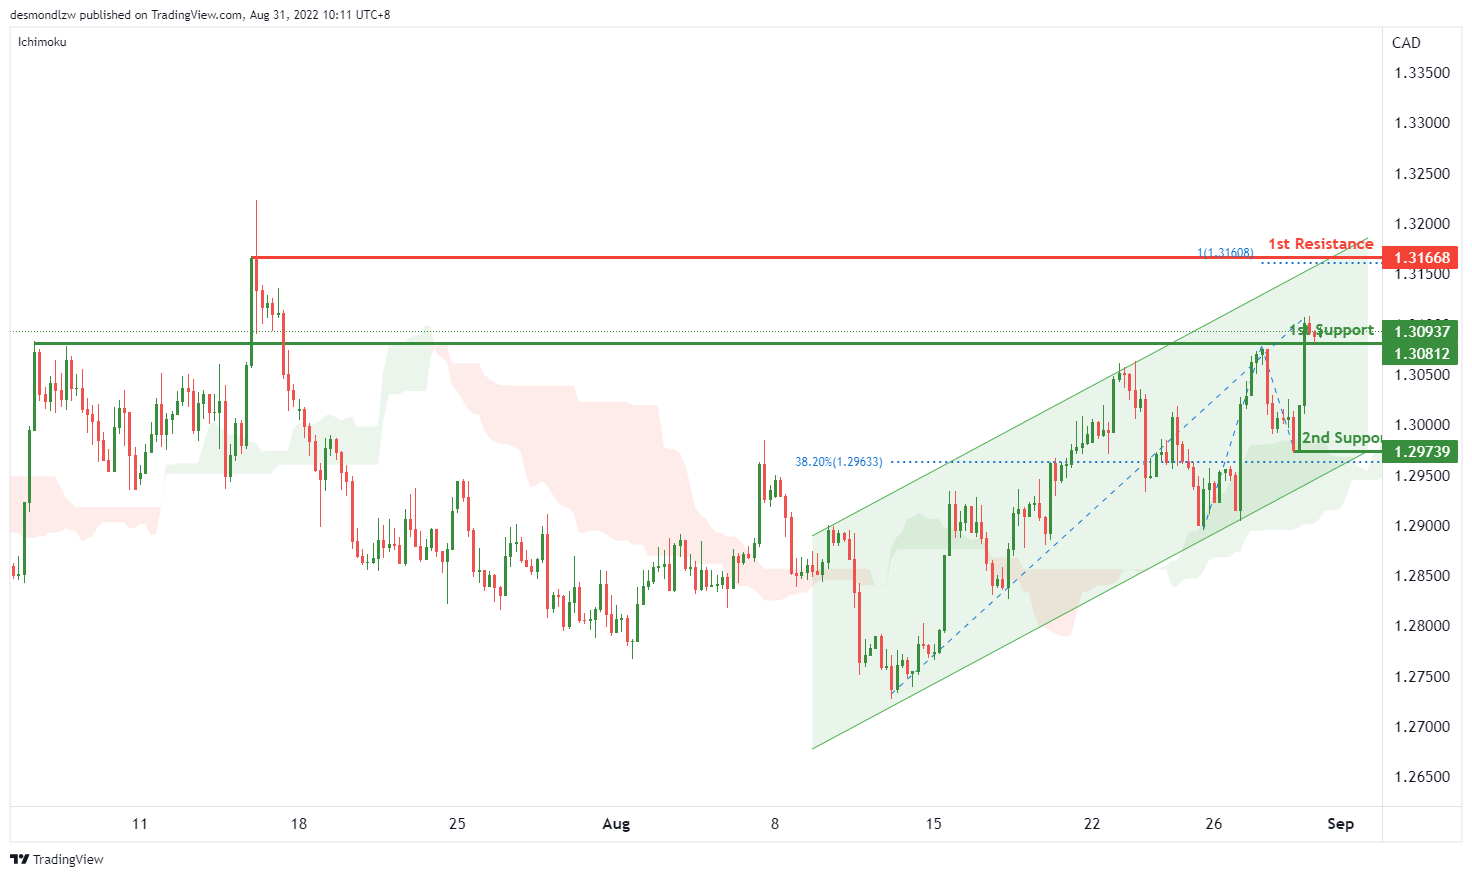
On the H4, with the price moving within the ascending channel, above ichimoku cloud, we have a bullish bias that the price may rise from the 1st support at 1.30812, where the swing highs are to the 1st resistance at 1.31668, where the swing high and 100% fibonacci projection are. Alternatively, price could break the 1st support and drop to the 2nd support at 1.29739, where the 38.2% fibonacci retracement and swing low are.
Areas of consideration:
- H4 time frame, 1st support at 1.30812
- H4 time frame, 1st resistance at 1.31668
OIL:
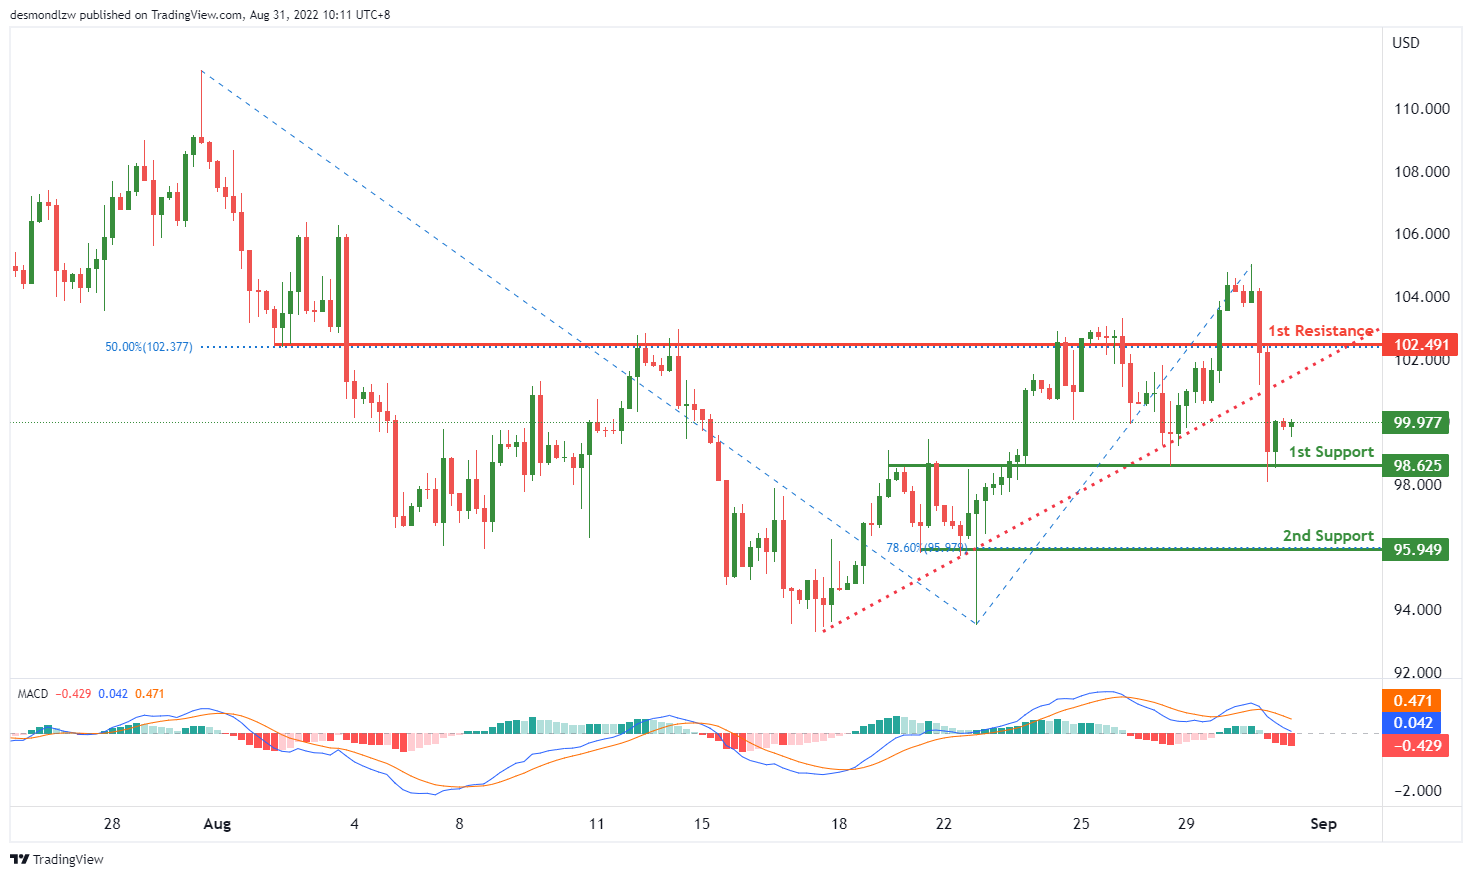
On the H4, with price breaking the ascending trendline and MACD is showing a death cross, we have a bearish bias that the price may drop from the 1st support at 98.625, where the overlap support is to the 2nd support at 95.949, where the swing low and 78.6% fibonacci retracement are. Alternatively, the price may rise to the 1st resistance at 102.491, where the overlap support and 50% fibonacci retracement are.
Areas of consideration:
- H4 time frame, 1st support at 98.625
- H4 time frame, 1st resistance at 95.949
Dow Jones Industrial Average:
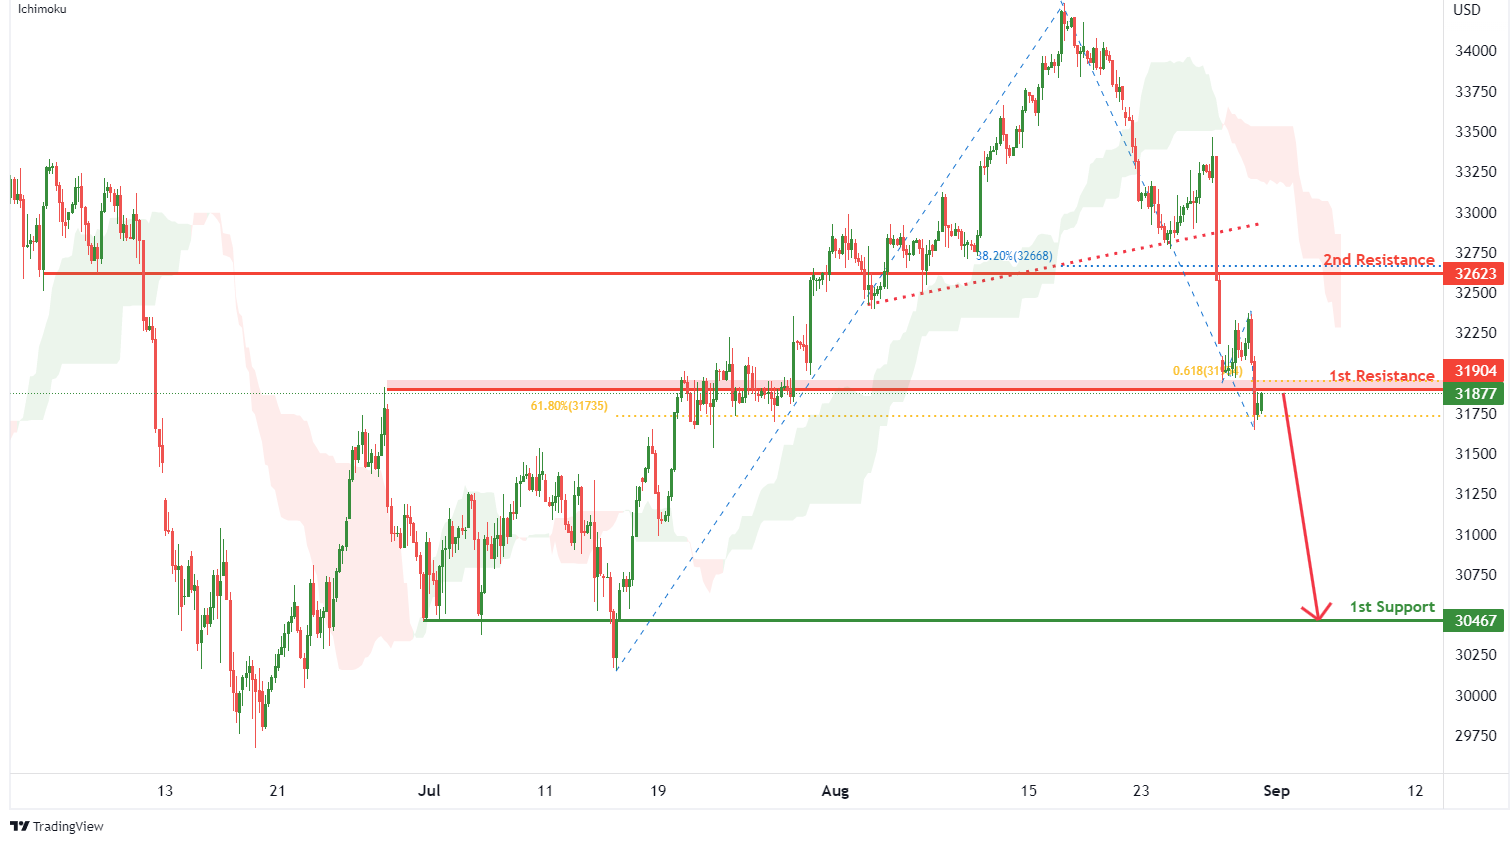
On the H4, with price breaking the ascending trendline and moving below the ichimoku indicator, ,we have a bearish bias that price will drop from 1st resistance at 31904 where the pullback resistance, 61.8% fibonacci retracement and 61.8% fibonacci projection are to 1st support at 30467 where the pullback support is. Alternatively, price could break 1st resistance structure and rise to 2nd resistance at 32623 in line with pullback resistance and 38.2% fibonacci retracement.
Areas of consideration:
- H4 time frame, 1st resistance of 31904
- H4 time frame, 1st support at 30467
DAX:
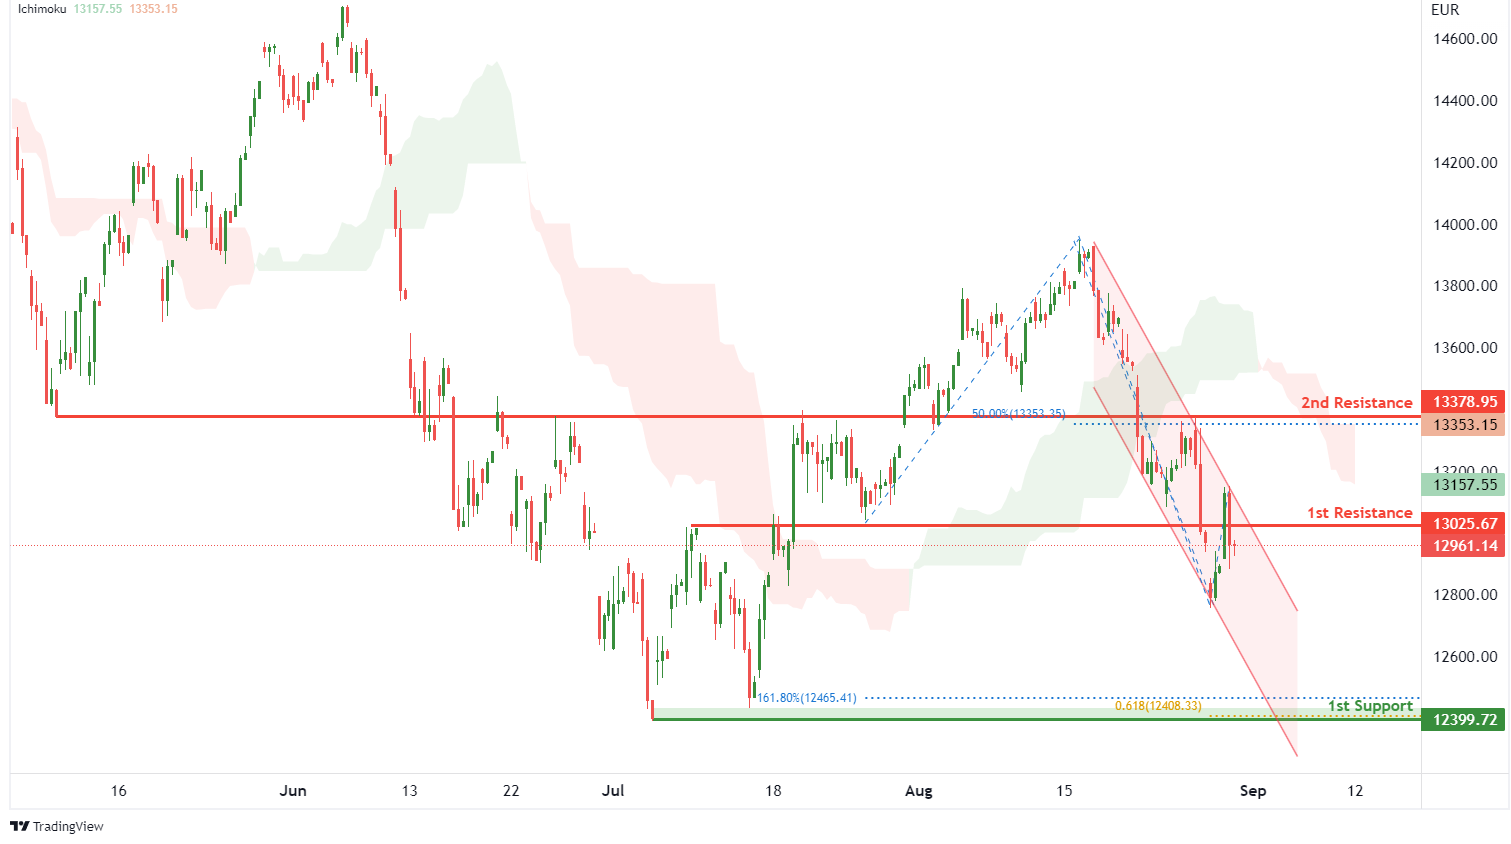
On the H4, with price moving within a descending channel and below the ichimoku indicator, we have a bearish bias that price will drop from 1st resistance at 13025.67 where the pullback resistance is to the 1st support at 12399.72 where the swing low support, 61.8% fibonacci projection and 161.8% fibonacci extension are. Alternatively, price could rise to 2nd resistance at 13378.95 where the overlap resistance and 50% fibonacci retracement are.
Areas of consideration:
- H4 time frame, 1st resistance of 13025.67
- H4 time frame, 1st support at 12399.72
ETHUSD:
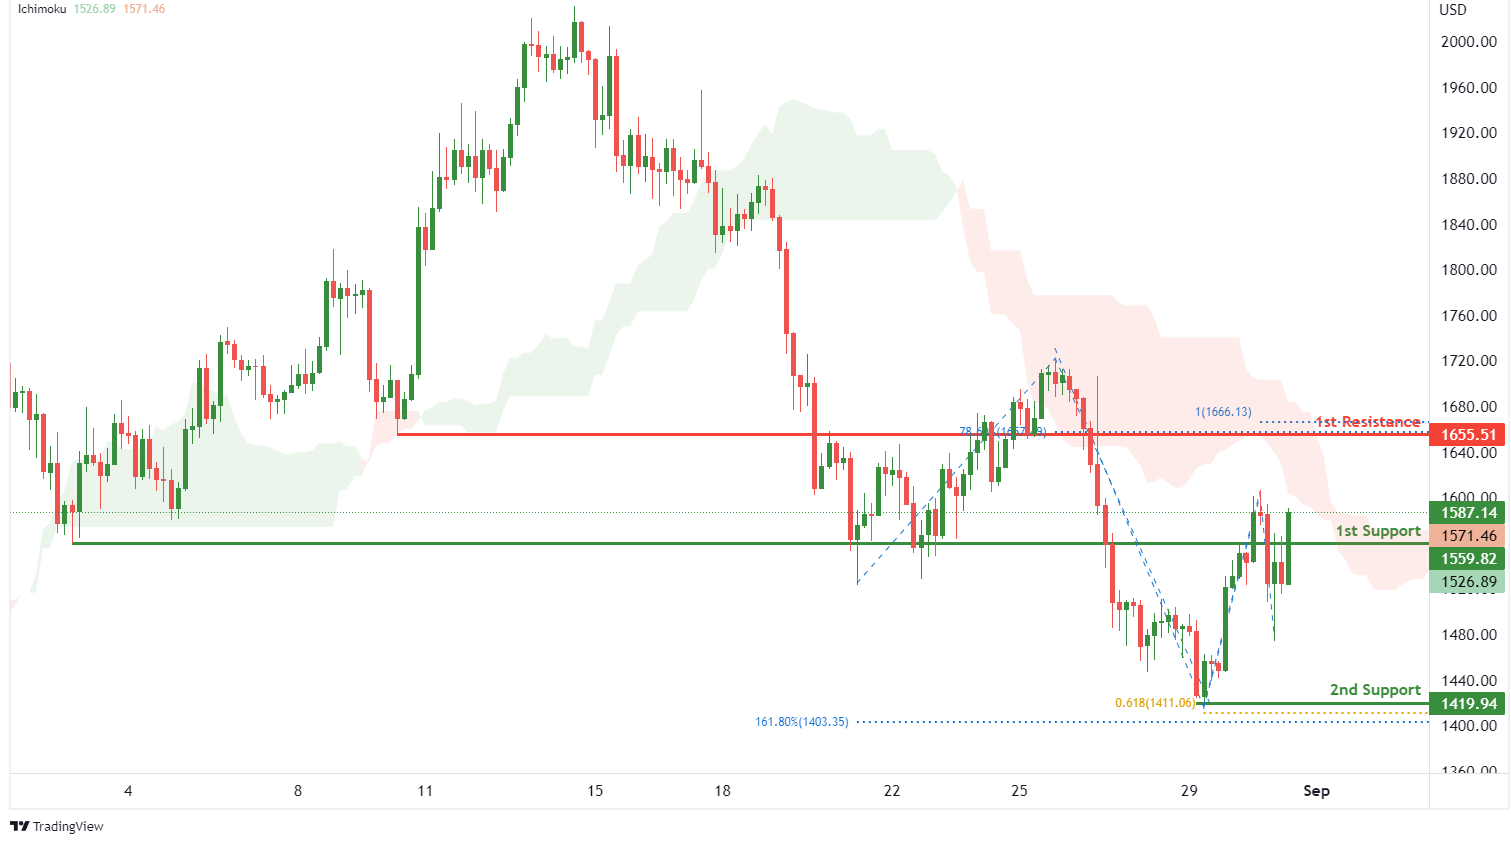
On the H4, with price moving below the ichimoku indicator, we have a bearish bias that price will drop to 1st support at 1559.82 where the overlap support is. Once there is downside confirmation of price breaking 1st support, we would expect bearish momentum to carry price to 2nd support at 1419.94 where the swing low support, 61.8% fibonacci projection and 161.8% fibonacci extension. Alternatively, price could rise to 1st resistance at 1655.51 where the pullback resistance, 100% fibonacci projection and 78.6% fibonacci retracement are.
Areas of consideration:
- H4 time frame, 1st resistance of 1655.51
- H4 time frame, 1st support at 1559.82
BTCUSD:
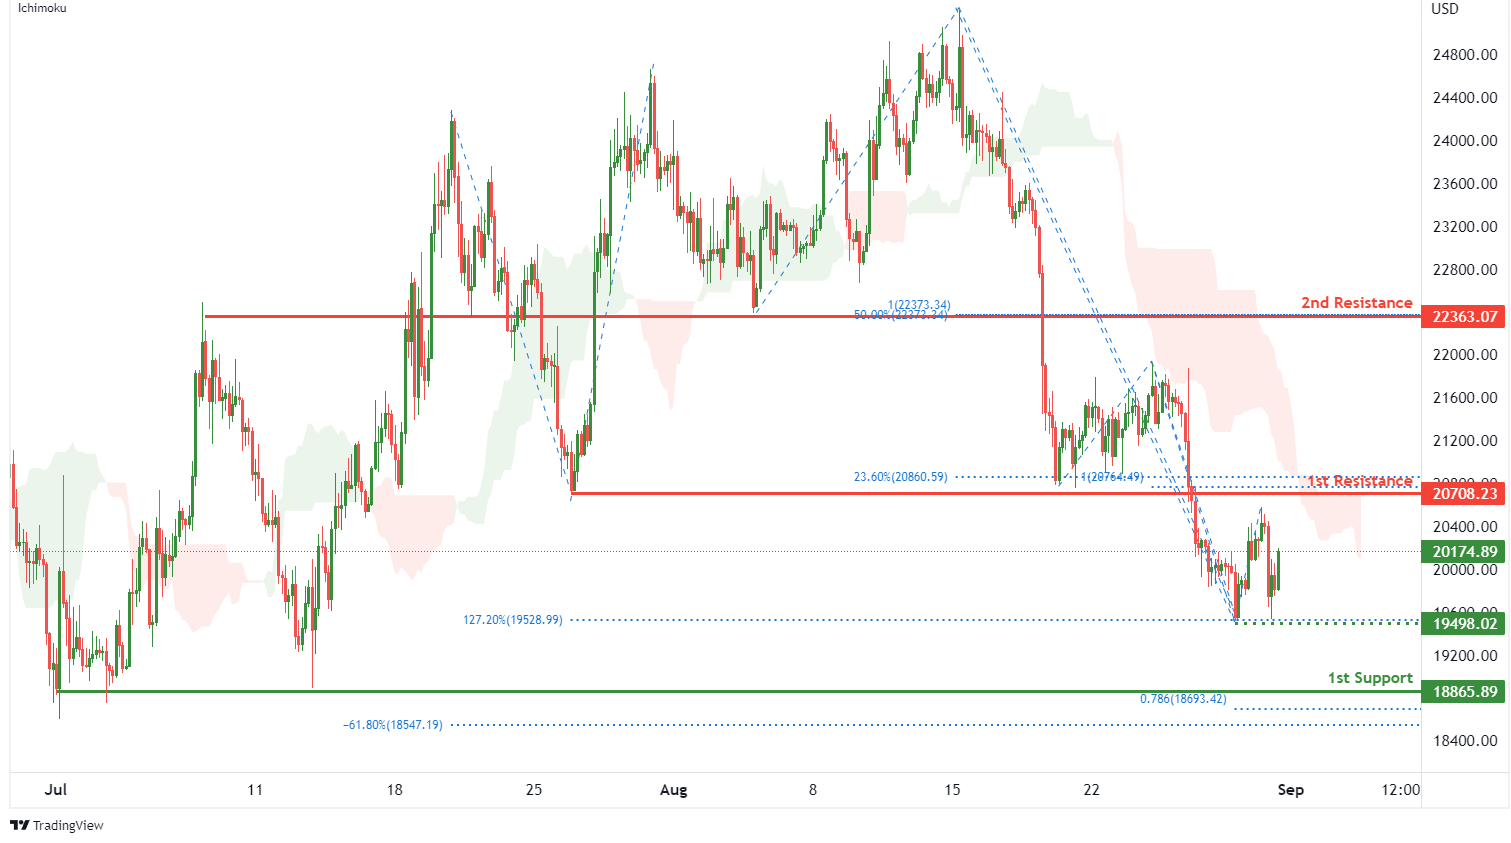
On the H4, with price moving below an ichimoku indicator, we have a bearish bias that price will drop from 1st resistance at 20708.23 where the pullback resistance, 100% fibonacci projection and 23.6% fibonacci retracement are to the 1st support at 18865.89 where the swing low support, 78.6% fibonacci projection and -61.8% fibonacci expansion are. Take note of intermediate support at 19498.02 where the 127.2% fibonacci extension and swing low support are. Alternatively, price could break 1st resistance structure and rise to 2nd resistance at 22363.07 where the overlap resistance, 100% fibonacci projection and 50% fibonacci retracement are.
Areas of consideration:
- H4 time frame, 1st resistance of 20708.23
- H4 time frame, 1st support at 18865.89
S&P 500:
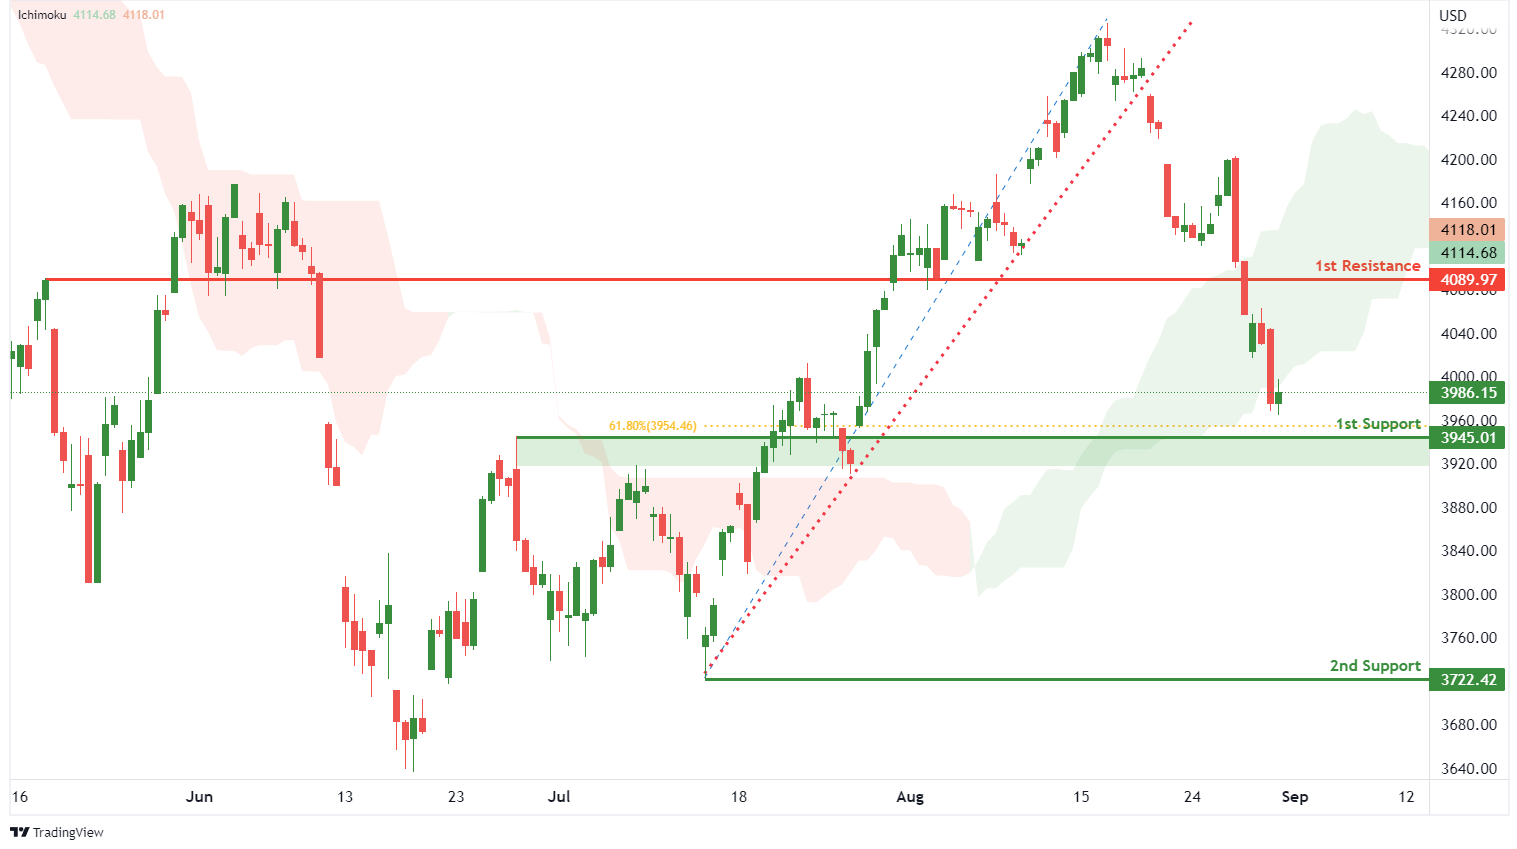
On the H4, with prices breaking out of the ascending trendline and moving below the ichimoku indicator, we have a bearish bias that price will drop to 1st support at 3945.01 where the pullback support and 61.8% fibonacci retracement are. Once there is downside confirmation that price has broken 1st support structure, we would expect bearish momentum to carry price to 2nd support at 3722.42 where the swing low support is. Alternatively, price could rise to 1st resistance at 4089.97 where the pullback resistance is.
Areas of consideration:
- H4 time frame, 1st resistance of 4089.97
- H4 time frame, 1st support at 3945.01
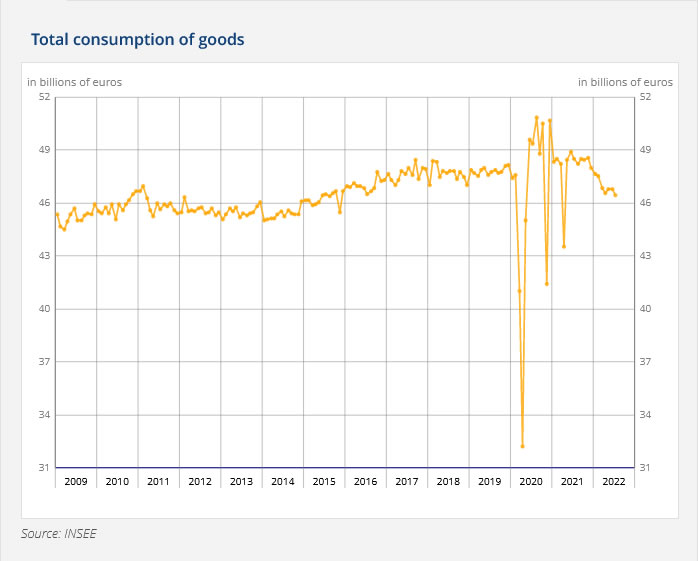
France goods consumption volume dropped -0.8% mom in Jul, CPI slowed to 5.8% yoy in Aug
France household consumption in goods, in volume, dropped -0.8% mom in July. The decline was mainly due to further decrease of consumption of manufactured goods (–1.4% after –0.7%). Food consumption also decreased further (–0.4% after –0.3%). Energy consumption fell back (–0.4% after +2.7% in June).
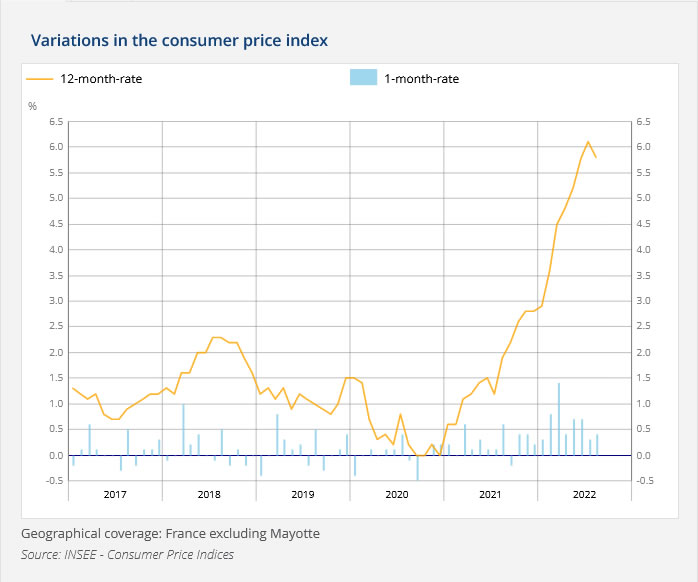
All item CPI slowed from 6.1% yoy to 5.8% yoy in August. Food inflation rose from 6.8% yoy to 7.7% yoy. Energy inflation slowed from 28.5% yoy to 22.2% yoy. Manufactured products inflation rose from 2.7% yoy to 3.5% yoy. Services inflation was unchanged at 3.9% yoy.
EUR/USD Daily Outlook
Daily Pivots: (S1) 0.9980; (P) 1.0018; (R1) 1.0053; More...
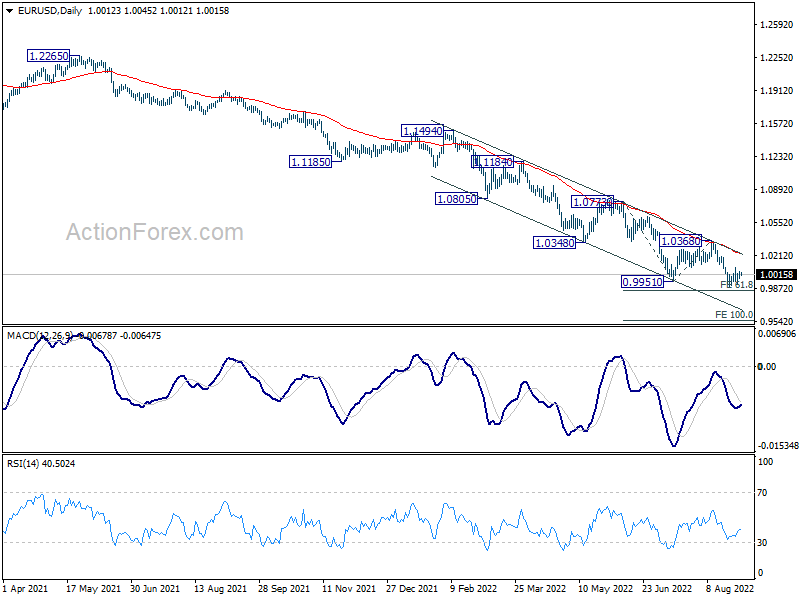
EUR/USD is still bounded in sideway trading and intraday bias remains neutral. Further decline is expected with 1.0094 resistance intact. On the downside, break of 0.9899 will resume larger down trend to 61.8% projection of 1.0773 to 0.9951 from 1.0368 at 0.9860. Firm break there should prompt downside acceleration to 100% projection at 0.9546. However, firm break of 1.0094 minor resistance will dampen this bearish view, and turn bias back to the upside for 1.0368 resistance instead.
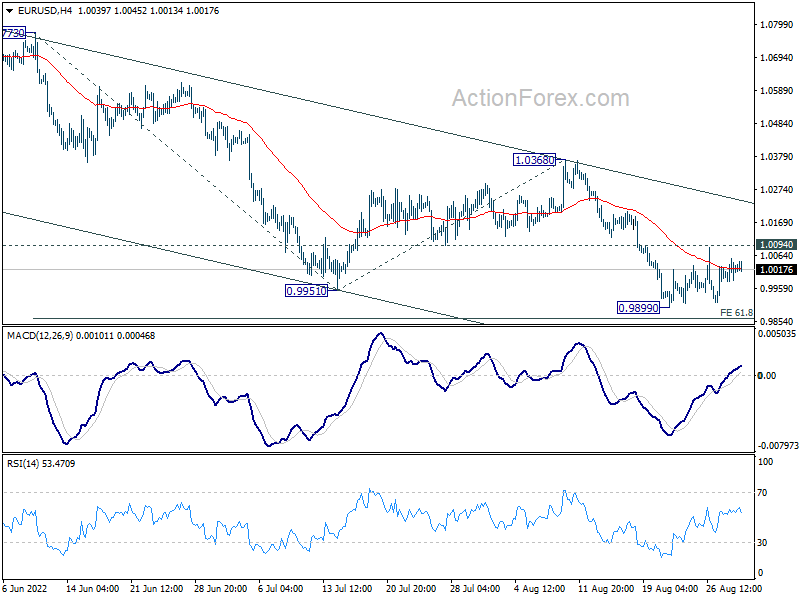
In the bigger picture, down trend from 1.6039 (2008 high) is still in progress. Next target is 100% projection of 1.3993 to 1.0339 from 1.2348 at 0.8694. In any case, outlook will stay bearish as long as 1.0368 resistance holds, in case of strong rebound.
GBP/USD Daily Outlook
Daily Pivots: (S1) 1.1597; (P) 1.1679; (R1) 1.1736; More...
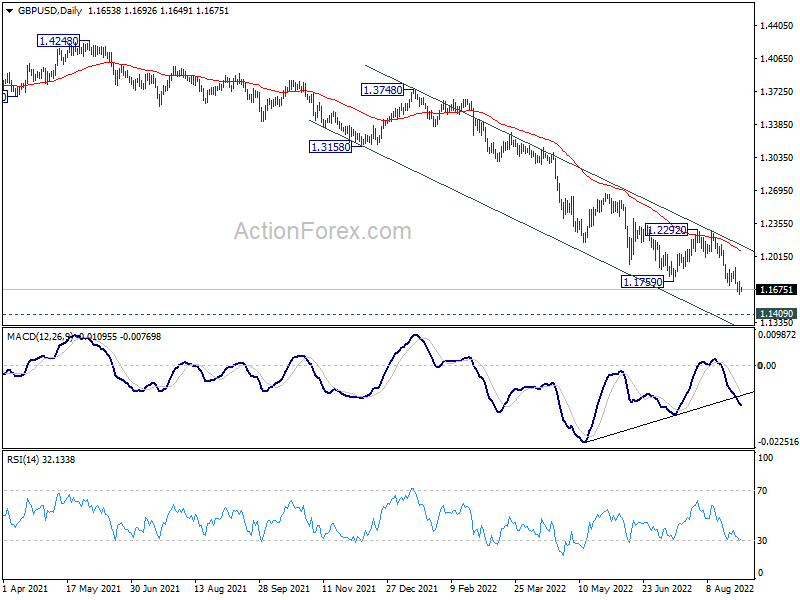
Intraday bias in GBP/USD stays on the downside a this point. Current down trend should target 1.1409 long term support. On the upside, above 1.1899 minor resistance will turn intraday bias neutral for consolidations. But outlook will stay bearish as long as 1.2292 resistance holds, in case of recovery.
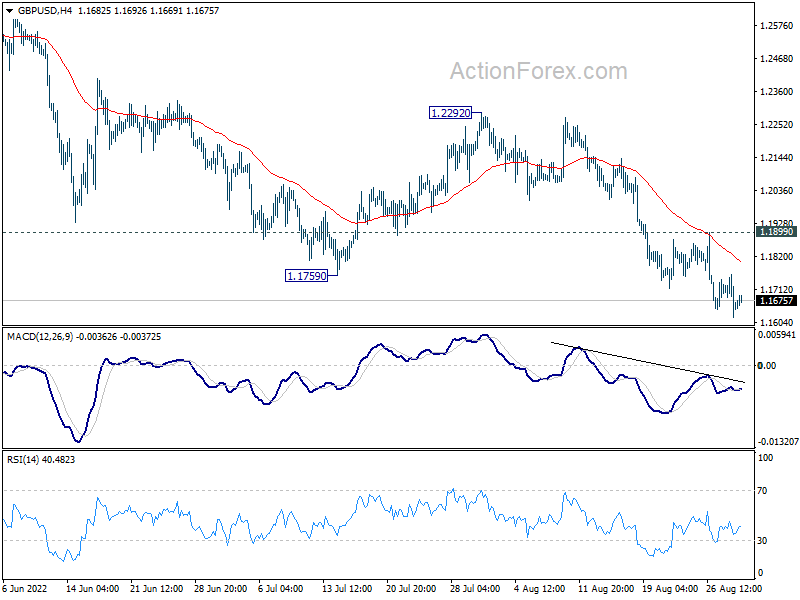
In the bigger picture, fall from 1.4248 (2018 high) could be a leg inside the pattern from 1.1409 (2020 low), or resuming the longer term down trend. Deeper decline is expected as long as 1.2292 resistance holds. Next target is 1.1409 low. However, firm break of 1.2292 will bring stronger rise back to 55 week EMA (now at 1.2859).