
Sample Category Title
USD/CAD Daily Outlook
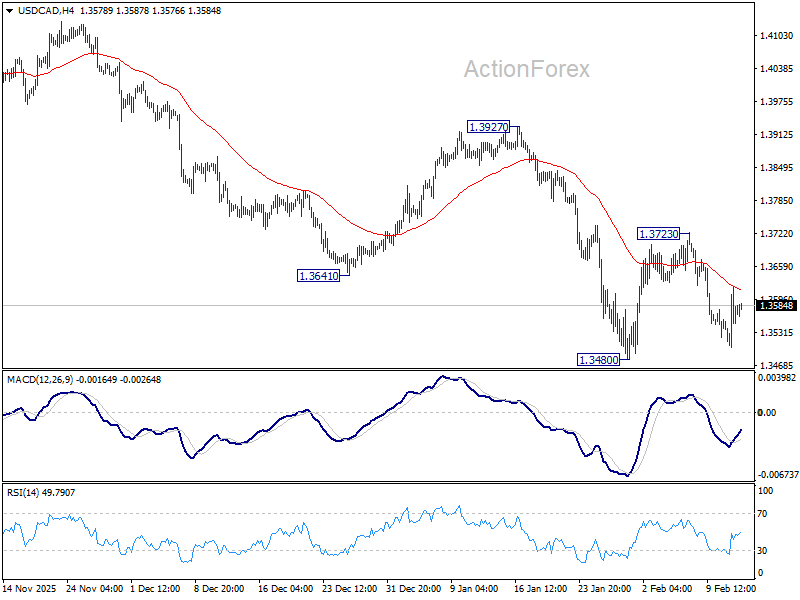
Daily Pivots: (S1) 1.3515; (P) 1.3567; (R1) 1.3630; More...
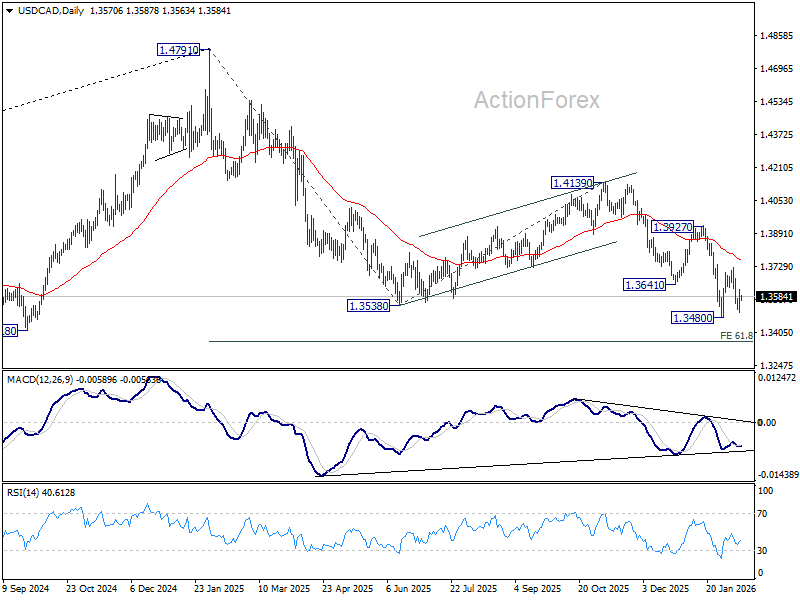
Intraday bias in USD/CAD is neutral for the moment as consolidation pattern from 1.3480 is extending. Strong rebound cannot be ruled out, but upside should be limited by 55 D EMA (now at 1.3757). On the downside, break of 1.3480 low will resume larger down trend from 1.4791 to 61.8% projection of 1.4791 to 1.3538 from 1.4139 at 1.3365.
In the bigger picture, price actions from 1.4791 are seen as a corrective pattern to the whole up trend from 1.2005 (2021 low). Deeper fall could be seen as the pattern extends, to 61.8% retracement of 1.2005 to 1.4791 at 1.3069. For now, medium term outlook will be neutral at best, until there are signs that the correction has completed, or that a bearish trend reversal is confirmed.
EUR/CHF Daily Outlook
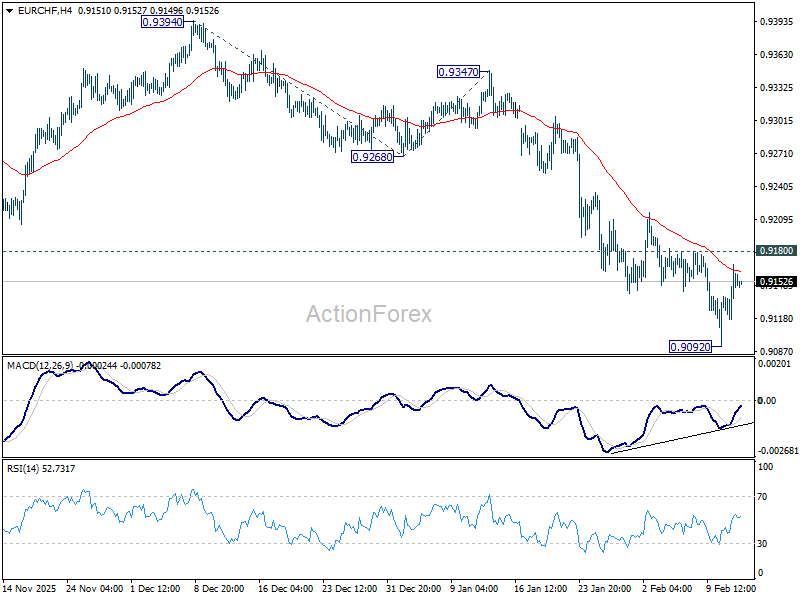
Daily Pivots: (S1) 0.9129; (P) 0.9150; (R1) 0.9181; More....
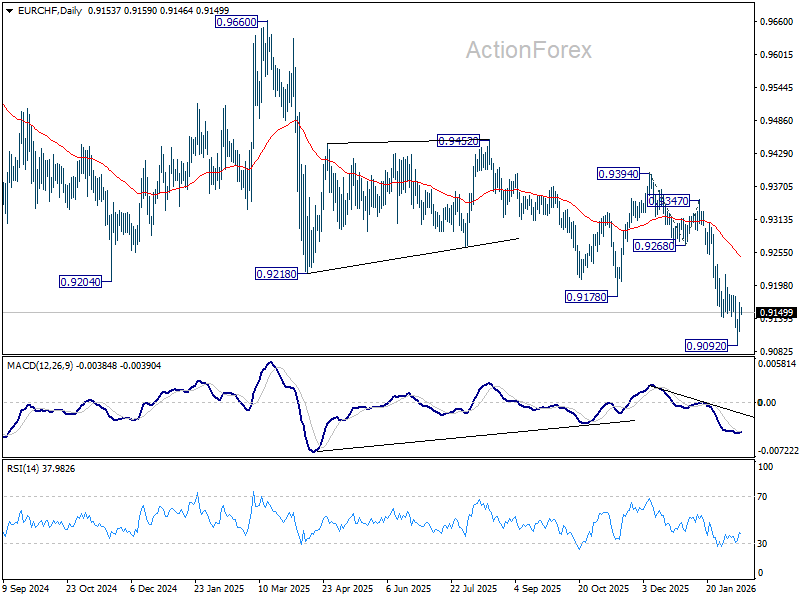
Intraday bias in EUR/CHF is turned neutral first with current recovery. Further decline is expected as long as 0.9180 resistance holds. Below 0.9092 will resume larger down trend to 261.8% projection of 0.9394 to 0.9268 from 0.9347 at 0.9017 next. However, considering bullish convergence condition in 4H MACD, firm break of 0.9180 will indicate short term bottoming, and bring stronger rebound towards 55 D EMA (now at 0.9246).
In the bigger picture, down trend from 0.9928 (2024 high) is still in progress with falling 55 W EMA (now at 0.9334) intact. Next target is 61.8% projection of 1.1149 to 0.9407 from 0.9928 at 0.8851. Outlook will stay bearish as long as 0.9394 resistance holds, in case of recovery.
EUR/GBP Daily Outlook
Daily Pivots: (S1) 0.8688; (P) 0.8706; (R1) 0.8729; More…
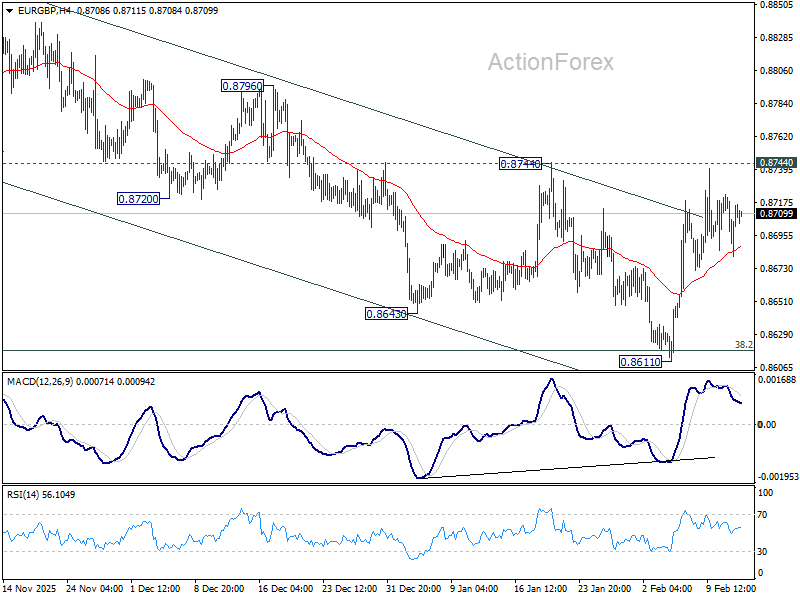
No change in EUR/GBP's outlook and intraday bias stays neutral at this point. On the upside, firm break of 0.8744 resistance will argue that fall from 0.8863 has completed at 0.8611 as a correction. Further rally should be seen back to retest 0.8863 high. On the downside, sustained break of 38.2% retracement of 0.8221 to 0.8663 at 0.8618 will carry larger bearish implications and turn outlook bearish.
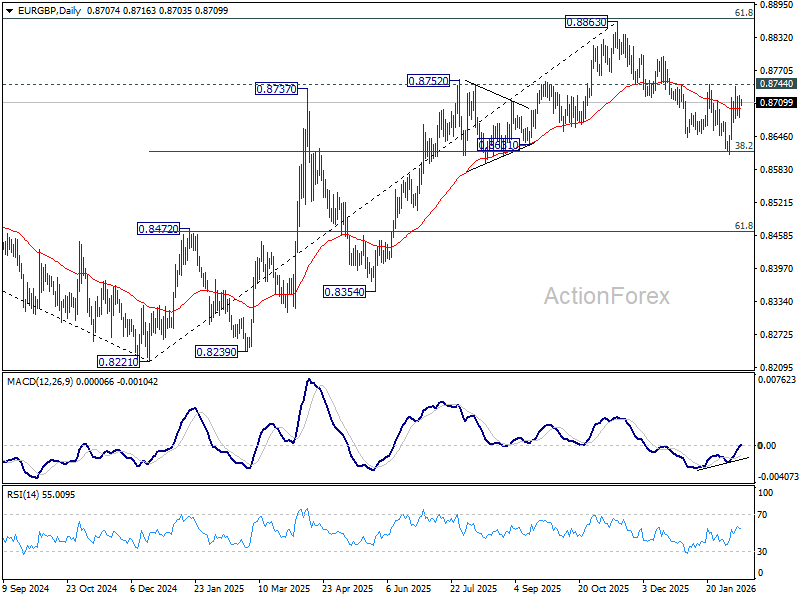
In the bigger picture, rise from 0.8221 medium term bottom (2024 low) is seen as a corrective move. Upside should be limited by 61.8% retracement of 0.9267 to 0.8221 at 0.8867. Sustained trading below 55 W EMA (now at 0.8629) should confirm that this corrective bounce has completed. In this case, deeper fall would be seen back to 0.8201/21 key support zone. However, decisive break of 0.8867 will suggest that EUR/GBP is already reversing whole decline from 0.9267 (2022 high). That should pave the way back to 0.9267.
EUR/AUD Daily Outlook
Daily Pivots: (S1) 1.6584; (P) 1.6708; (R1) 1.6782; More...
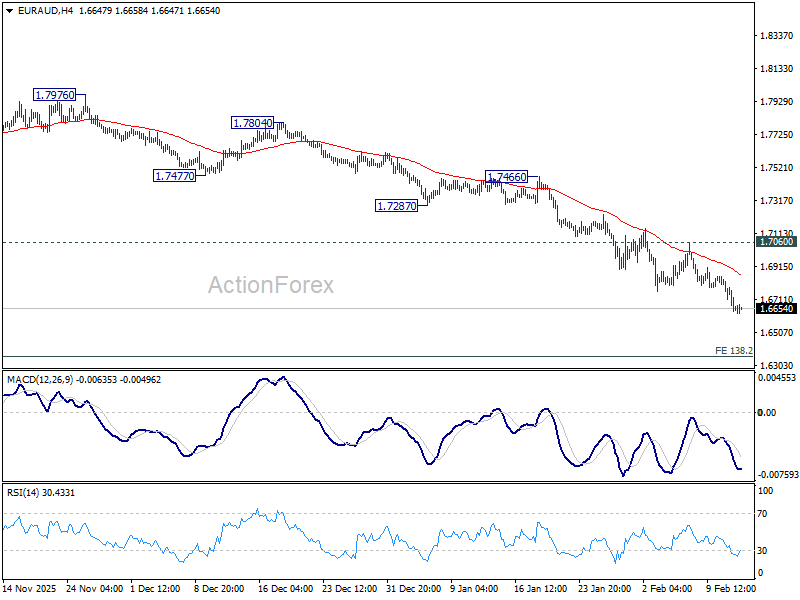
Intraday bias in EUR/AUD remains on the downside for the moment. Current fall is part of the whole down trend from 1.8554 and should target 138.2% projection of 1.8554 to 1.7245 from 1.8160 at 1.6351 next. For now, outlook will stay bearish as long as 1.7060 resistance holds, in case of recovery.
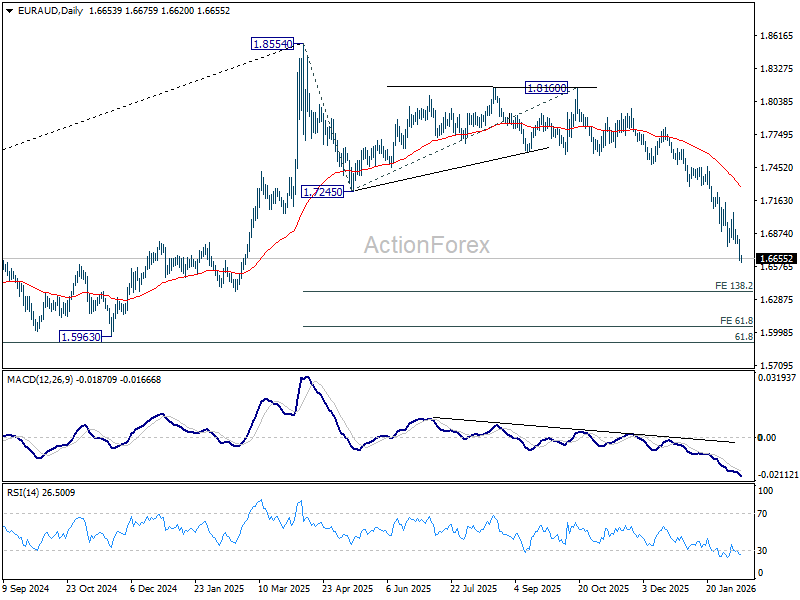
In the bigger picture, fall from 1.8554 medium term top is seen as reversing the whole up trend from 1.4281 (2022 low). Deeper decline should be seen to 61.8% retracement of 1.4281 to 1.8554 at 1.5913, which is slightly below 1.5963 structural support. For now, risk will stay on the downside as long as 1.7245 support turned resistance holds even in case of strong rebound.
GBP/JPY Daily Outlook
Daily Pivots: (S1) 207.73; (P) 209.35; (R1) 210.51; More...
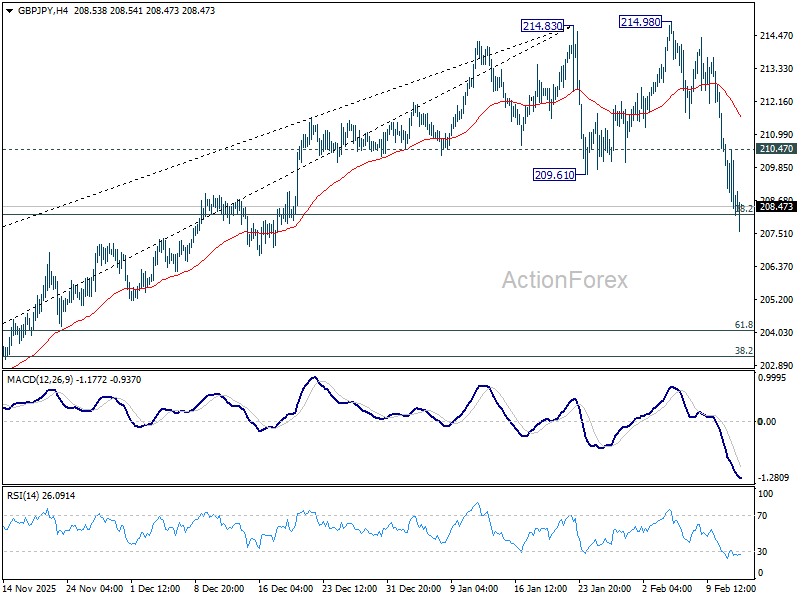
GBP/JPY's fall from 214.83 accelerated lower and immediate focus is now on 38.2% retracement of 197.47 to 214.83 at 208.19. Sustained break there will argue that it's already correcting whole up trend from 184.35. However, strong rebound from current level, followed by break of 210.47 minor resistance will retain near term bullishness, and bring retest of 214.83/98 resistance zone.
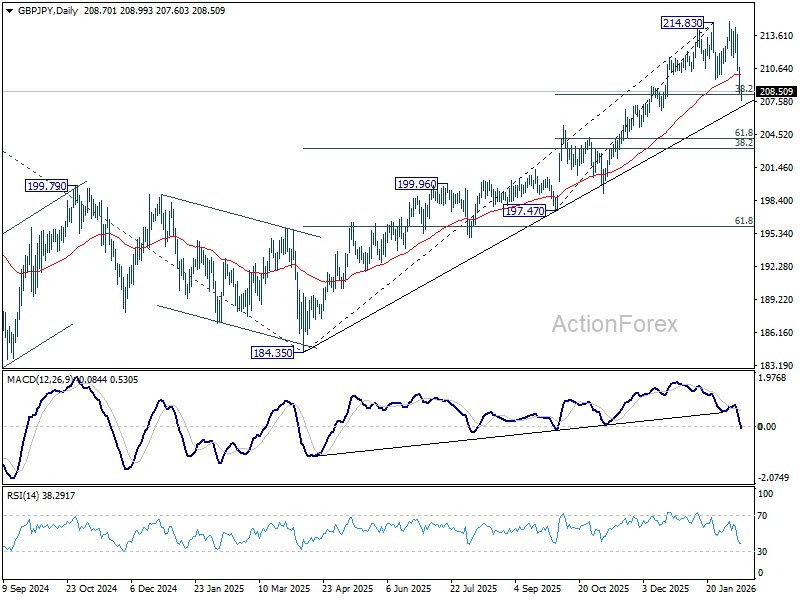
In the bigger picture, up trend from 123.94 (2020 low) is in progress. Next target is 61.8% projection of 148.93 (2022 low) to 208.09 (2024 high) from 184.35 at 220.90. On the downside, break of 205.30 resistance turned support is needed to indicate medium term topping. Otherwise, outlook will stay bullish even in case of deep pullback.
EUR/JPY Daily Outlook
Daily Pivots: (S1) 180.91; (P) 182.36; (R1) 183.39; More...
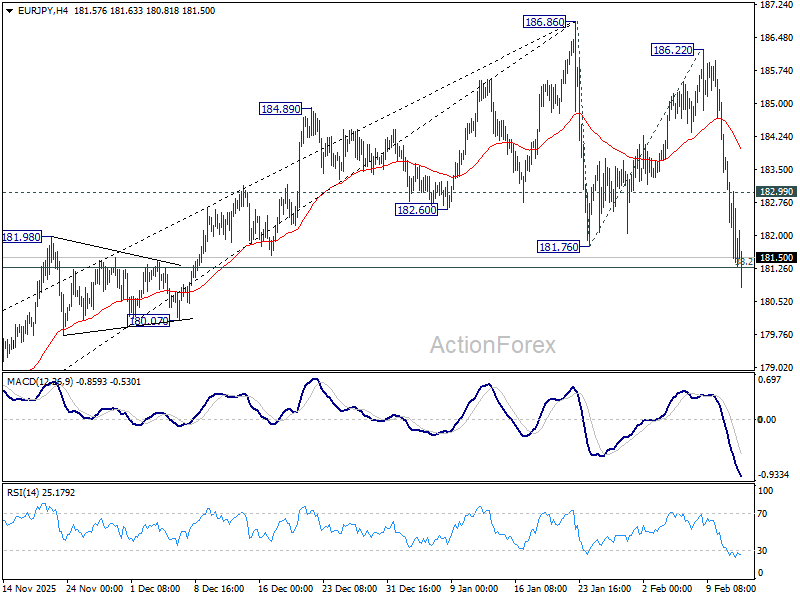
Immediate focus is now on 38.2% retracement of 172.24 to 186.86 at 181.27 as EUR/JPY's fall accelerated lower. Decisive break there will argue that fall from 186.86 is correcting whole up trend from 154.77. Next near term target will be 161.8% projection of 186.86 to 181.76 from 186.22 at 177.96. Nevertheless, strong rebound from current level, followed by break of 182.99 minor resistance will retain near term bullishness, and bring retest of 186.86 high first.
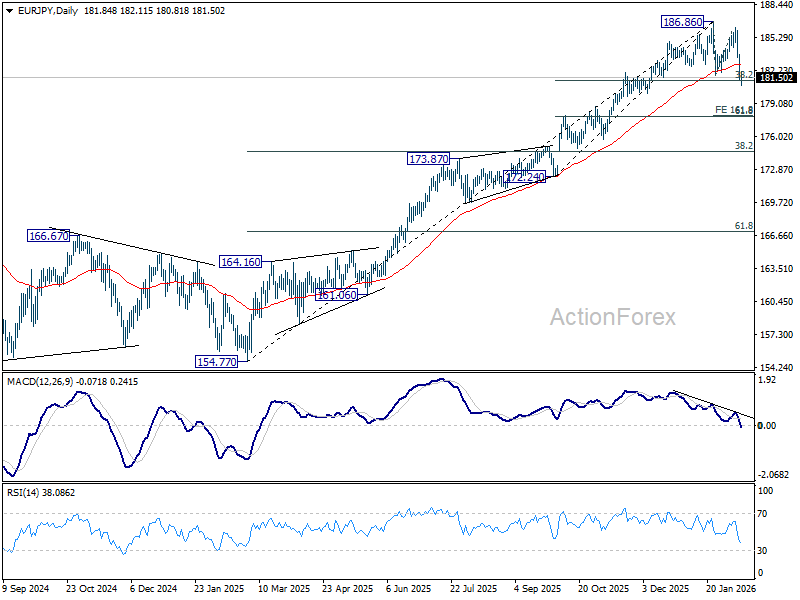
In the bigger picture, up trend from 114.42 (2020 low) is in progress. Upside momentum has been diminishing as seen in bearish divergence condition in D MACD. But there is no clear sign of topping yet. On resumption, next target is 78.6% projection of 124.37 to 175.41 from 154.77 at 194.88 next. Meanwhile, outlook will stay bullish as long as 55 W EMA (now at 174.22) holds, even in case of deep pullback.
Yen Reversal Case Builds as Nikkei Rally Looks Overextended
Risk sentiment was mixed in Asia today as Japan returned from holiday with Nikkei extending its post-election surge and briefly breaching the 58,000 mark for the first time on record. The breakout, however, lacked follow-through, with the index quickly trimming gains and hinting that near-term momentum may be stretched. Elsewhere in the region, trading was subdued. Broader Asian markets mirrored the near-flat close in the US overnight.
In currency markets, Yen remains the standout performer, extending its rally. The move partly reflects repeated official vigilance over currency volatility. Japan’s top currency diplomat, Atsushi Mimura, issued fresh warnings today. While declining to comment on speculation over rate checks following US employment data, he stressed that authorities are maintaining a “high sense of urgency” and have “not lowered our guard at all.” Mimura also confirmed that Tokyo remains in close contact with US authorities, reinforcing the perception that officials are prepared to act jointly if volatility becomes excessive.
Technically, the breach of near-term Fibonacci support in both EUR/JPY and GBP/JPY suggests that Yen’s reversal may be gaining traction. However, confirmation would require USD/JPY to break corresponding support levels to solidify the broader trend shift.
For Dollar, the boost from stronger-than-expected US payrolls proved short-lived. While the report effectively cemented expectations that the Fed will hold rates steady in March, it did little to firm up pricing for June. Attention now turns to January CPI data due tomorrow. A single inflation print may trigger volatility, but unless it materially shifts the inflation outlook, it is unlikely to establish a durable trend in Fed expectations.
In the US fiscal backdrop, January’s deficit narrowed compared to a year earlier as tariff collections surged. Customs duties reached USD30 billion for the month, lifting fiscal year-to-date revenue to USD124 billion — more than triple the level seen over the same period in 2025.
However, legal and political risks around tariffs remain elevated. The Supreme Court has yet to rule on challenges to the legal basis for the measures, keeping concerns that an adverse decision could force reimbursement of collected duties. Meanwhile, the House narrowly passed a resolution opposing tariffs on Canada, though any legislative reversal is unlikely given the high bar required to override a presidential veto.
On performance, Dollar remains the weakest currency of the week so far, followed by Sterling, which is awaiting UK GDP data. Euro is the third-worst performer. Yen leads gains, followed by Aussie and Loonie, while Swiss Franc and Kiwi trade mid-pack.
In Asia, at the time of writing, Nikkei is up 0.24%. Hong Kong HSI is down -0.89%. China Shanghai SSE is up 0.12%. Singapore Strait Times is up 0.63%. Japan 10-year JGB yield is down -0.02 at 2.217. Overnight, DOW fell -0.13% S&P fell -0.00%. NASDAQ fell -0.16%. 10-year yield rose 0.025 to 4.172.
Japan PPI eases to 2.3%, but import costs accelerate
Japan’s producer price index slowed slightly to 2.3% year-on-year in January from 2.4%, matching expectations and suggesting pipeline price pressures are stabilizing. The moderation came despite sharp divergences across components.
Fuel prices dropped -12.9% yoy, providing a significant drag on overall wholesale inflation. In contrast, nonferrous metal prices surged 33%, while agricultural goods rose 22.4%. Food and beverage prices also remained elevated, increasing 4.7% from a year earlier, highlighting persistent cost pressures in parts of the supply chain.
Meanwhile, Yen-based import prices climbed 0.5% yoy, up from a 0.2% gain in December. Despite a recent rebound in the currency, Yen’s broader weakness over recent months has raised the cost of imported energy and raw materials.
RBA’s Bullock says inflation above 3% “unacceptable,” keeps door open to more hikes
RBA Governor Michele Bullock reinforced the hawkish stance at a Senate estimates hearing today, making clear that further tightening remains on the table. “If we need to go up further because inflation is entrenched, the board will do so,” she said, stressing that returning inflation to target remains the central bank’s primary mandate.
Bullock said inflation running “with a three in front of it” is unacceptable. She noted that, at present, total demand is judged to be exceeding the economy’s capacity to supply, helping to explain ongoing inflation pressures. At the same time, she struck a more balanced tone on growth, pointing to the labour market as a key "positive". While productivity remains weak and limits how fast the economy can expand, employment conditions are holding up. “We’re in this position because the economy is actually doing okay,” Bullock said,.
The RBA raised the cash rate by 25 bps last week to 3.85%, reversing one of last year’s cuts, after underlying inflation accelerated to 3.4% in the latest quarter. With forecasts pointing to inflation reaching 3.7% this year, markets now price roughly a 75% chance of another hike to 4.10% at the May meeting.
BoC minutes stress geopolitical risks, keep policy optionality
The BoC left its benchmark overnight rate at 2.25% in January, and the published summary of deliberations underlined how elevated uncertainty has reshaped policy discussions. Members agreed that maintaining "optionality" in setting monetary policy was critical given the unusually turbulent backdrop.
The minutes highlighted that recent geopolitical events — including tensions in Venezuela, Iran and Greenland — along with perceived threats to the independence of the Fede — have amplified global uncertainty. U.S. trade policy, increasingly seen as driven by geopolitical aims, was identified as a key source of unpredictability that could disrupt global supply chains and impact economic activity.
BoC officials also flagged downside risks associated with the upcoming review of the United States-Mexico-Canada Agreement (USMCA), suggesting that unresolved trade negotiations could weigh on Canadian growth.
Against this backdrop, the minutes reinforce the view that the BoC is likely to stay on hold for now, with flexibility to respond as data evolve.
EUR/JPY Daily Outlook
Daily Pivots: (S1) 180.91; (P) 182.36; (R1) 183.39; More...
Immediate focus is now on 38.2% retracement of 172.24 to 186.86 at 181.27 as EUR/JPY's fall accelerated lower. Decisive break there will argue that fall from 186.86 is correcting whole up trend from 154.77. Next near term target will be 161.8% projection of 186.86 to 181.76 from 186.22 at 177.96. Nevertheless, strong rebound from current level, followed by break of 182.99 minor resistance will retain near term bullishness, and bring retest of 186.86 high first.
In the bigger picture, up trend from 114.42 (2020 low) is in progress. Upside momentum has been diminishing as seen in bearish divergence condition in D MACD. But there is no clear sign of topping yet. On resumption, next target is 78.6% projection of 124.37 to 175.41 from 154.77 at 194.88 next. Meanwhile, outlook will stay bullish as long as 55 W EMA (now at 174.22) holds, even in case of deep pullback.
GBP/USD Rejection Risk Grows Ahead Of Crucial UK GDP
Key Highlights
- GBP/USD started a fresh increase from the 1.3500 support.
- It cleared a key bearish trend line with resistance at 1.3640 on the 4-hour chart.
- EUR/USD struggled to continue higher above 1.1920.
- The UK GDP could grow 0.2% in Q4 2025 (Preliminary) (QoQ).
GBP/USD Technical Analysis
The British Pound started a fresh upward move above 1.3550 against the US Dollar. GBP/USD surpassed 1.3600 to enter a positive zone.
Looking at the 4-hour chart, the pair even cleared a key bearish trend line with resistance at 1.3640. The pair tested the 50% Fib retracement level of the downward move from the 1.3869 swing high to the 1.3508 low.
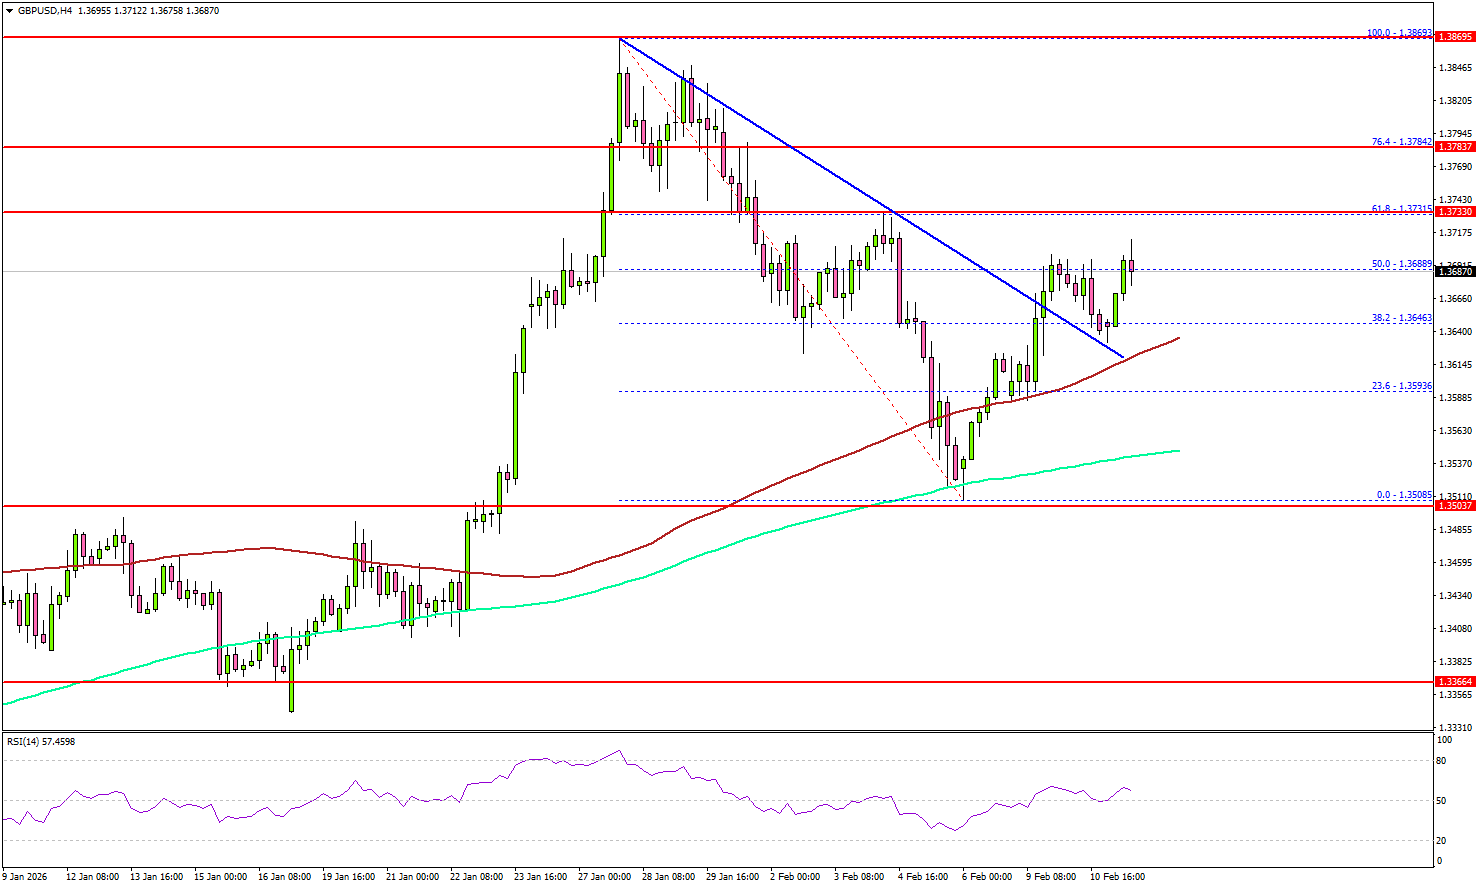
The pair is stable above the 100 simple moving average (red, 4-hour) and the 200 simple moving average (green, 4-hour). On the upside, the pair could face hurdles near 1.3700.
The next stop for the bulls might be 1.3735 or the 76.4% Fib retracement level of the downward move from the 1.3869 swing high to the 1.3508 low. A close above 1.3735 could open the doors for more gains.
In the stated case, the bulls could aim for a move toward 1.3785. Any more gains could set the pace for a fresh move to 1.3880. Immediate support could be 1.3580. The first major area for the bulls might be near 1.3550. The main support sits at 1.3500, below which the pair might gain bearish momentum. In the stated case, it could even revisit 1.3320.
Looking at EUR/USD, the pair faced hurdles near 1.1920 and might again decline to 1.1780 if the bears remain in action.
Upcoming Key Economic Events:
- UK GDP for Q4 2025 (Preliminary) (QoQ) - Forecast +0.2%, versus +0.1% previous.
- US Initial Jobless Claims - Forecast 222K, versus 231K previous.
Japan PPI eases to 2.3%, but import costs accelerate
Japan’s producer price index slowed slightly to 2.3% year-on-year in January from 2.4%, matching expectations and suggesting pipeline price pressures are stabilizing. The moderation came despite sharp divergences across components.
Fuel prices dropped -12.9% yoy, providing a significant drag on overall wholesale inflation. In contrast, nonferrous metal prices surged 33%, while agricultural goods rose 22.4%. Food and beverage prices also remained elevated, increasing 4.7% from a year earlier, highlighting persistent cost pressures in parts of the supply chain.
Meanwhile, Yen-based import prices climbed 0.5% yoy, up from a 0.2% gain in December. Despite a recent rebound in the currency, Yen’s broader weakness over recent months has raised the cost of imported energy and raw materials.
RBA’s Bullock says inflation above 3% “unacceptable,” keeps door open to more hikes
RBA Governor Michele Bullock reinforced the hawkish stance at a Senate estimates hearing today, making clear that further tightening remains on the table. “If we need to go up further because inflation is entrenched, the board will do so,” she said, stressing that returning inflation to target remains the central bank’s primary mandate.
Bullock said inflation running “with a three in front of it” is unacceptable. She noted that, at present, total demand is judged to be exceeding the economy’s capacity to supply, helping to explain ongoing inflation pressures. At the same time, she struck a more balanced tone on growth, pointing to the labour market as a key "positive". While productivity remains weak and limits how fast the economy can expand, employment conditions are holding up. “We’re in this position because the economy is actually doing okay,” Bullock said,.
The RBA raised the cash rate by 25 bps last week to 3.85%, reversing one of last year’s cuts, after underlying inflation accelerated to 3.4% in the latest quarter. With forecasts pointing to inflation reaching 3.7% this year, markets now price roughly a 75% chance of another hike to 4.10% at the May meeting.