Sample Category Title
Dollar Rises as Risk Sentiment Turns Sour, Sterling Shrugs Strong Inflation
Overall risk sentiment appears to have turned sour again today, with major European indexes trading in red, while US futures point to lower open. Australian Dollar is leading commodity currencies lower. Even New Zealand Dollar wasn't supported by the hawkish RBNZ hike. At the same time, Yen is also among the weakest, as pressured by rise in major European and US yields. Dollar is the strongest one, followed by Euro and then Swiss Franc. Sterling is just mixed despite another month of strong inflation reading.
Technically, USD/JPY is now pressing 135.57 minor resistance. Firm break there will resume the rebound from 130.38 towards 139.37 high. The move could take EUR/JPY through corresponding resistance at 138.38, and GBP/JPY through 163.91.
In Europe, at the time of writing, FTSE is down -0.35%. DAX is down -1.55%. CAC is down -0.84%. Germany 10-year yield is up 0.110 at 1.082. Earlier in Asia, Nikkei rose 1.23%. Hong Kong HSI rose 0.46%. China Shanghai SSE rose 0.45%. Japan 10-year JGB yield rose 0.0156 to 0.186.
US retail sales rose 0.0% mom in Jul, ex-auto sales up 0.4% mom
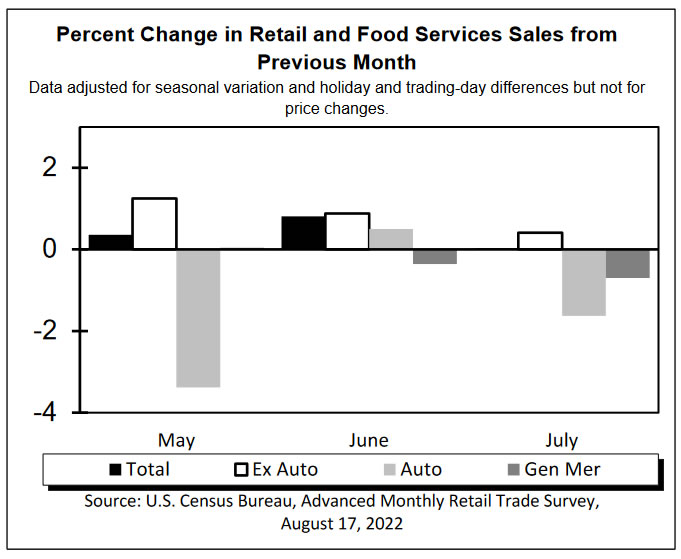
US retail sales rose 0.0% mom to USD 682.8B in July, below expectation of 0.2% mom. Ex-auto sales rose 0.4% mom, above expectation of 0.1% mom. Ex-gasoline sales rose 0.2% mom. Ex-auto, gasoline sales rose 0.7% mom.
Also total sales were up 10.3% yoy comparing with July 2021. Total sales for the May through July 2022 period were up 9.2% from the same period a year ago.
UK CPI jumped to 10.1% yoy in Jul, core CPI up to 6.2% yoy
UK CPI rose 0.6% mom in July, largest monthly rise between June and July since the start of the series in 1988. The food and non-alcoholic beverages, and transport divisions made the largest upward contributions.
For the 12 month period, CPI accelerated from 9.4% yoy to 10.1% yoy, above expectation of 9.8% yoy. Indicative models suggest that CPI was last high in 1982, estimated at around 11%. Core CPI accelerated from 5.8% yoy to 6.2% yoy, below expectation of 6.4% yoy.
RPI rose 0.9% mom, 12.3% yoy, versus expectation of 0.8% mom, 12.9% yoy. PPI input came in at 0.1% mom, 22.6% yoy, versus expectation of 1.0% mom, 24.8% yoy. PPI output was at 1.6% mom, 17.1% yoy, versus expectation of 1.6% mom, 17.6% yoy. PPI core output was at 1.0% mom, 14.6% yoy, versus expectation of 0.0% mom, 15.9% yoy.
Japan export rose 19.0% yoy in Jul, imports rose 47.2% yoy
Japan exports rose 19.0% yoy to JPY 8753B in July, with gains led by auto shipments to US and chips to China. Imports rose 47.2% yoy to JPY 10190B, driven by higher costs of crude oil, coal and liquid natural gas. Trade deficit came in at JPY -1437B. July's figure marked a full straight year of monthly trade deficits, the longest streak since the 32-month run to February 2015.
In seasonally adjusted terms, exports rose 2.1% mom to JPY 8437B. Imports rose 3.5% mom to JPY 10570B. Trade deficit widened to JPY -2133B.
RBNZ hikes 50bps, monetary conditions needed to continue to tighten
RBNZ raises the Official Cash Rate by 50bps to 3.00% as widely expected, as "core consumer price inflation remains too high and labour resources remain scarce". It also maintains hawkish bias as "committee members agreed that monetary conditions needed to continue to tighten until they are confident there is sufficient restraint on spending to bring inflation back within its 1-3 percent per annum target range."
The central bank noted domestic spending has "remained resilient", supported by a "robust employment level, continued fiscal support, an elevated terms of trade, and sound household balance sheets in aggregate." Production is being "constrained by acute labour shortages", heightened by seasonal illnesses and COVID-19. Spending and investment continues to "outstrip supply capacity". Wage pressures are "heightened". A range of indicators highlight broad-based domestic pricing pressures.
USD/JPY Mid-Day Outlook
Daily Pivots: (S1) 133.25; (P) 133.96; (R1) 134.97; More...
Intraday bias in USD/JPY remains neutral first and range trading continues. Overall, corrective pattern from 139.37 will extend further. On the upside, above 135.57 will resume the rebound to retest 139.37 high. But a decisive break there is not expected this time. On the downside, below 131.72 will resume the fall from 139.37 through 130.38 support.
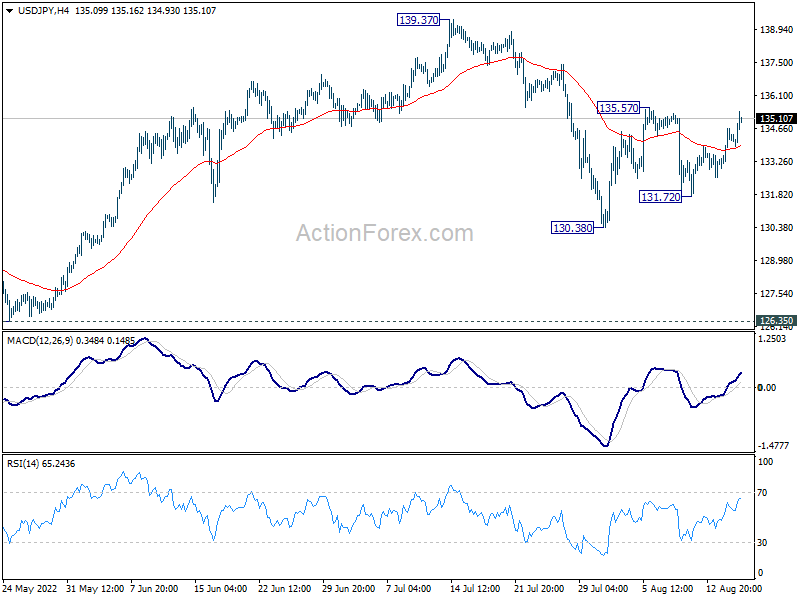
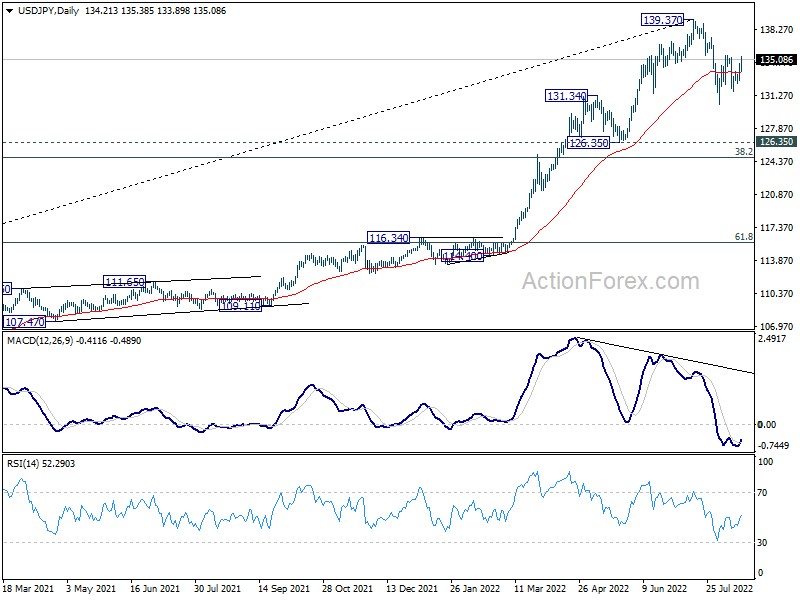
In the bigger picture, fall from 139.37 medium term top is seen as correcting whole up trend from 101.18 (2020 low). While deeper decline cannot be ruled out, outlook will stays bullish as long as 55 week EMA (now at 122.70) holds. Long term up trend is expected to resume through 139.37 at a later stage, after the correction finishes.
Economic Indicators Update
| GMT | Ccy | Events | Actual | Forecast | Previous | Revised |
|---|---|---|---|---|---|---|
| 22:45 | NZD | PPI Input Q/Q Q2 | 3.10% | 2.10% | 3.60% | 3.40% |
| 22:45 | NZD | PPI Output Q/Q Q2 | 2.40% | 1.90% | 2.60% | |
| 23:50 | JPY | Trade Balance (JPY) Jul | -2.13T | -1.94T | -1.93T | -1.95T |
| 23:50 | JPY | Machinery Orders M/M Jun | 0.90% | 1.30% | -5.60% | |
| 00:30 | AUD | Westpac Leading Index M/M Jul | -0.20% | -0.20% | ||
| 01:30 | AUD | Wage Price Index Q/Q Q2 | 0.70% | 0.80% | 0.70% | |
| 02:00 | NZD | RBNZ Interest Rate Decision | 3.00% | 3.00% | 2.50% | |
| 06:00 | GBP | CPI M/M Jul | 0.60% | 0.00% | 0.80% | |
| 06:00 | GBP | CPI Y/Y Jul | 10.10% | 9.80% | 9.40% | |
| 06:00 | GBP | Core CPI Y/Y Jul | 6.20% | 6.40% | 5.80% | |
| 06:00 | GBP | RPI M/M Jul | 0.90% | 0.80% | 0.90% | |
| 06:00 | GBP | RPI Y/Y Jul | 12.30% | 12.90% | 11.80% | |
| 06:00 | GBP | PPI Input M/M Jul | 0.10% | 1.00% | 1.80% | |
| 06:00 | GBP | PPI Input Y/Y Jul | 22.60% | 24.80% | 24.00% | 24.10% |
| 06:00 | GBP | PPI Output M/M Jul | 1.60% | 1.60% | 1.40% | |
| 06:00 | GBP | PPI Output Y/Y Jul | 17.10% | 17.60% | 16.50% | 16.40% |
| 06:00 | GBP | PPI Core Output M/M Jul | 1.00% | 0.00% | 0.80% | 0.70% |
| 06:00 | GBP | PPI Core Output Y/Y Jul | 14.60% | 15.90% | 15.20% | 14.90% |
| 09:00 | EUR | Eurozone GDP Q/Q Q2 P | 0.60% | 0.70% | 0.70% | |
| 09:00 | EUR | Eurozone Employment Change Q/Q Q2 P | 0.30% | 0.60% | 0.60% | |
| 12:30 | USD | Retail Sales M/M Jul | 0.00% | 0.20% | 1.00% | 0.80% |
| 12:30 | USD | Retail Sales ex Autos M/M Jul | 0.40% | 0.10% | 1.00% | 0.90% |
| 14:00 | USD | Business Inventories Jun | 1.40% | 1.40% | ||
| 14:30 | USD | Crude Oil Inventories | 0.3M | 5.5M | ||
| 18:00 | USD | FOMC Minutes |
USD/JPY Mid-Day Outlook
Daily Pivots: (S1) 133.25; (P) 133.96; (R1) 134.97; More...
Intraday bias in USD/JPY remains neutral first and range trading continues. Overall, corrective pattern from 139.37 will extend further. On the upside, above 135.57 will resume the rebound to retest 139.37 high. But a decisive break there is not expected this time. On the downside, below 131.72 will resume the fall from 139.37 through 130.38 support.
In the bigger picture, fall from 139.37 medium term top is seen as correcting whole up trend from 101.18 (2020 low). While deeper decline cannot be ruled out, outlook will stays bullish as long as 55 week EMA (now at 122.70) holds. Long term up trend is expected to resume through 139.37 at a later stage, after the correction finishes.
US retail sales rose 0.0% mom in Jul, ex-auto sales up 0.4% mom
US retail sales rose 0.0% mom to USD 682.8B in July, below expectation of 0.2% mom. Ex-auto sales rose 0.4% mom, above expectation of 0.1% mom. Ex-gasoline sales rose 0.2% mom. Ex-auto, gasoline sales rose 0.7% mom.
Also total sales were up 10.3% yoy comparing with July 2021. Total sales for the May through July 2022 period were up 9.2% from the same period a year ago.
Inflation in Britain Hasn’t Peaked, and the GBPUSD is Not Bottomed Out
While economists in the US and Canada, and later policymakers, are talking about peak inflation, that moment is yet to come for the UK. Annual inflation has reached double-digit territory at 10.1%. At the same time, the monthly price growth rate remains elevated.
It is also important to note the spread of inflation beyond energy. The core CPI has accelerated from 5.8% to 6.2%, higher than the expected 5.9%, indicating an active consumer cost pass-through.
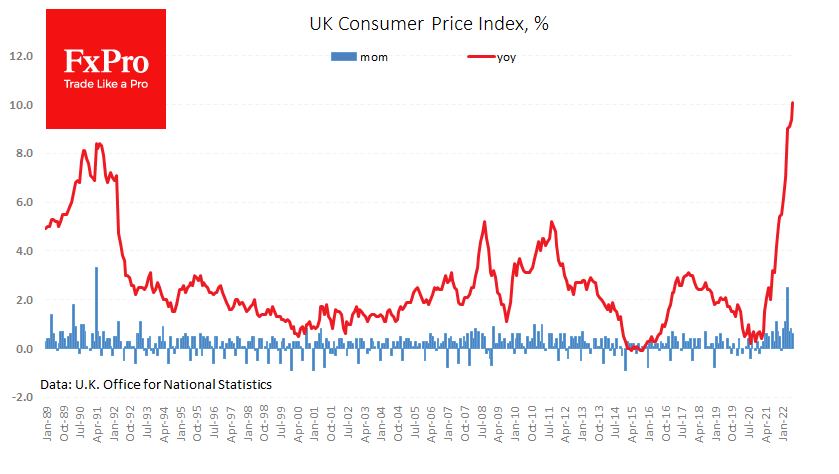
Retailers are finding it difficult to avoid as manufacturers raised their selling prices by 1.6% over July and have increased by 17.1% over the past 12 months.
However, one of the leading inflation indicators – the Input Producer Price Index – indicated light at the end of the tunnel. This indicator rose by only 0.1% in July, sharply below the forecasted 0.7%. The annual rate slowed down from 24.1% to 22.6%.
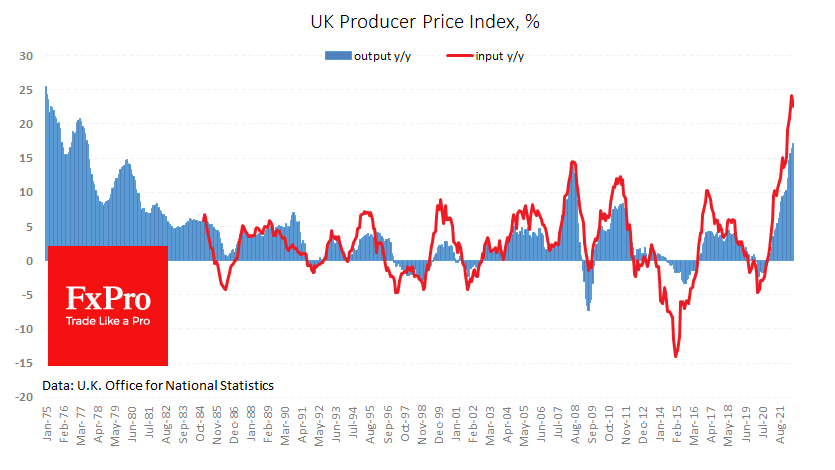
This cooling of the early price indicator further fuels confidence in the Bank of England’s forecasts that consumer inflation will peak in November and levels near 11%.
It is difficult for the Bank of England to maintain the same rate hikes as the Fed due to a less bright labour market picture, which thickens the cloud over the economic outlook. As a result, the British pound is under additional pressure, losing more than 12.5% to the dollar.
Historically, due to higher inflation in the UK compared to the US, GBPUSD has been dominated by a downtrend. Currently, the pair is testing the area near 1.20 for the fourth time in modern history. The difference in monetary policy potential and actual inflation data are set up that the GBPUSD will finally dip into lower territory in the coming weeks.
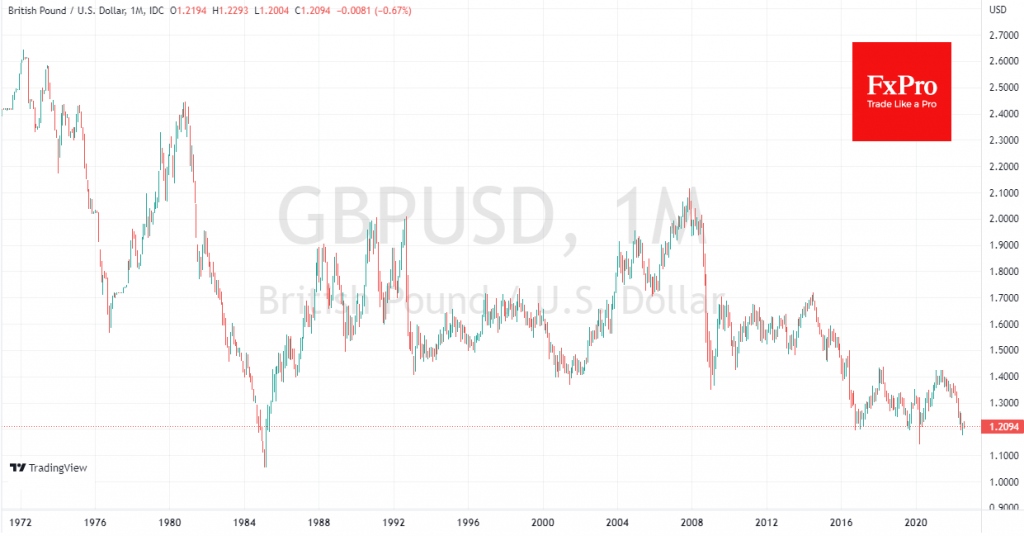
There is a considerable risk that, unlike the episodes of the last six years, this time, investors will not rush to buy the pound but will sell it out, repeating the 1984 dynamic. Having settled at 1.20 in November of that year, the pound plummeted to 1.05 in the next four months, and only Plaza Accord reversed the trend. But the big question now is whether the US need a new such accord.
AUDUSD Breaks Below an Upside Support Line
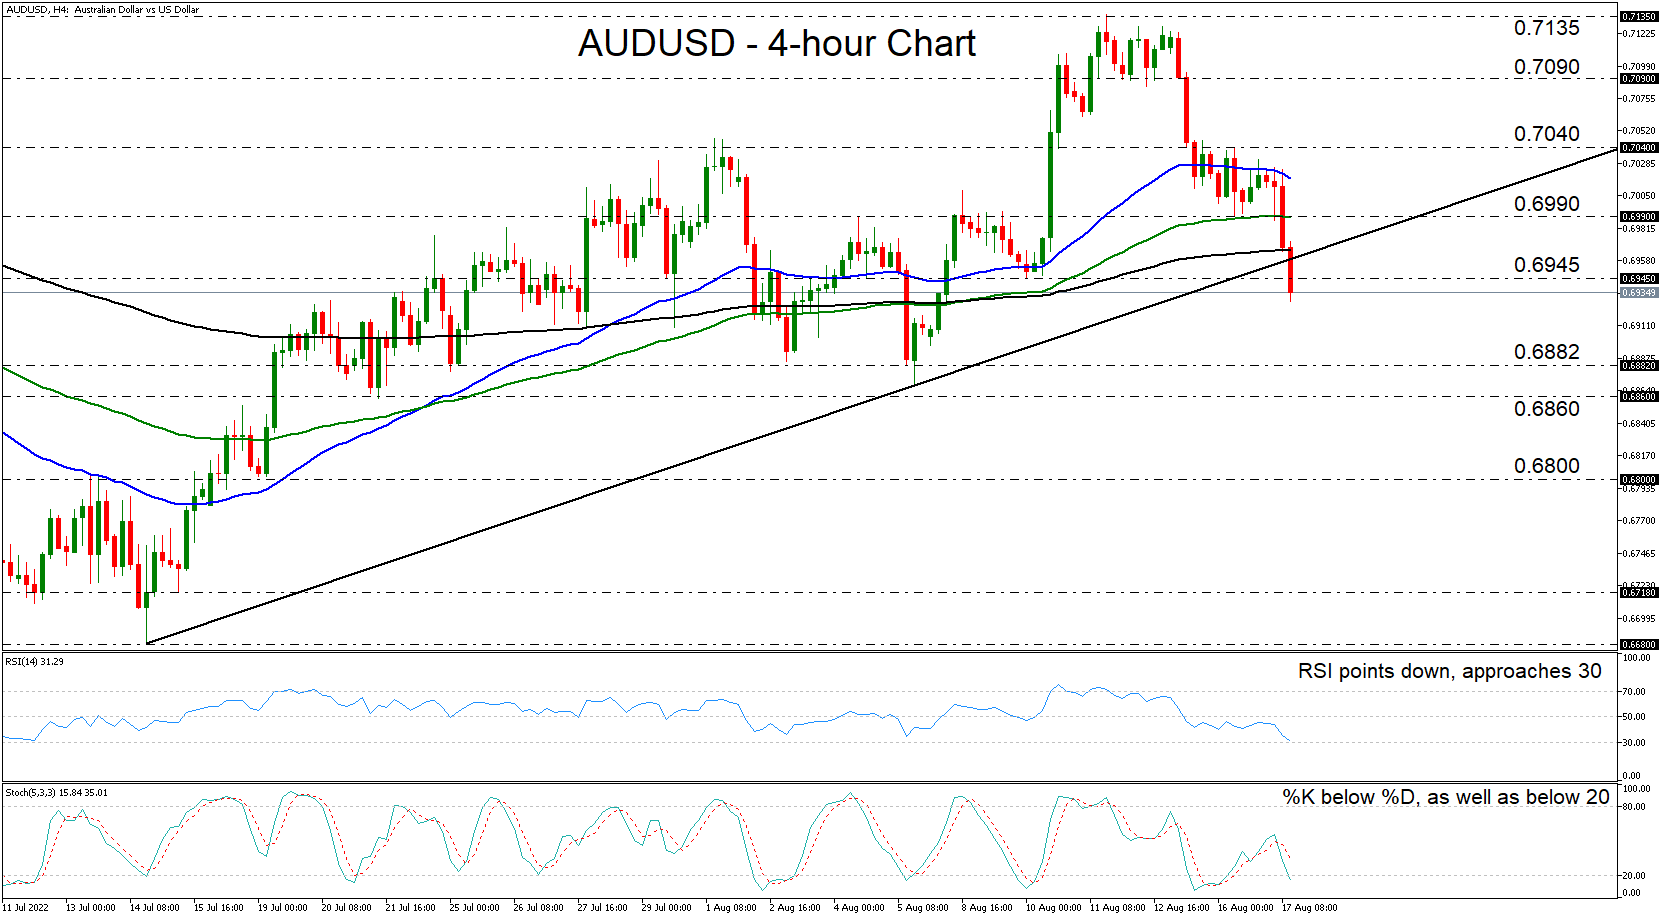
AUDUSD entered a phase of steep declines on Monday, after hitting resistance a few pips below the peak of Friday, at around 0.7135. Although some buyers sought to take advantage of the slide between the 0.6990 and 0.7040 levels, they were unable to withhold the pressure. This resulted in another round of selling and a break below the upside line drawn from the low of July 14th.
The switch in the short-term bias is also confirmed by our short-term oscillators. The RSI moved lower and is now flirting with its 30 line, while in the stochastic, the %K lies below the %D. Although it also dipped below 20, it continues to point south, which implies strong downside momentum.
After breaking the aforementioned upside line, the pair also dropped below the low of August 10, which could be seen as the confirmation of a short-term bearish reversal. More bears could join the action soon and perhaps shoot for the 0.6882 hurdle, which provided decent support between July 25 and August 5. That said, for more declines to be considered, a dip below 0.6860 may be required. Such a move could see scope for extensions towards the low of July 19, at around 0.6800.
On the upside, a rebound back above 0.6990 may signal that the bulls are reigniting attempts to steal the bears’ swords, as it would take the pair back above the upside support line. The next stop might be yesterday’s peak, at around 0.7040, the break of which could encourage advances towards the 0.7090 zone, near the inside swing low of August 12.
To wrap up, AUDUSD has been under selling pressure since Monday, with the price slipping below an upside line and a key support territory today. From a technical standpoint, this suggests a short-term trend reversal.
Pound Yawns as UK Inflation Hits 10.1%
The British pound is almost unchanged today, trading just above the 1.21 level.
UK inflation hits double-digits
It hasn’t been a good week for the UK, with today’s inflation report following grim wage growth numbers. Headline inflation in July hit 10.1% YoY, up from 9.4% and above the estimate of 9.8%. It was a similar story with core CPI, which rose to 6.2% YoY, up from 5.8% and ahead of the forecast of 5.9%.
UK consumers, already hammered by the cost-of-living crisis, shouldn’t expect things to improve anytime soon. The energy price cap is expected to jump in October due to high gas prices, and the BoE is projecting that inflation will rise up to 13.3% in October. British 2-year Gilt yields have surged to 2.41%, its highest level since November 2008, as the markets brace for higher interest rates from the BoE.
To add to the misery, British workers are seeing a decline in their wages. Wage growth came in at 5.1% in Q2 on an annualized basis, but real wages, which are adjusted for inflation, fell by 3.2%, a record low. The cost of living is thus increasing at an even faster rate and is far outpacing wage growth.
The FOMC minutes will be released later today, and we can expect the Fed to continue to drum out a hawkish message that that the inflation battle is far from over and more hikes are coming. The markets have caught on to the idea that the Fed will pivot and reverse policy next year, and it will be interesting to see how investors react to the minutes. If there are any dovish comments in the minutes, the market may latch on to them and ignore the hawkish remarks which don’t fit into what the market wants to hear.
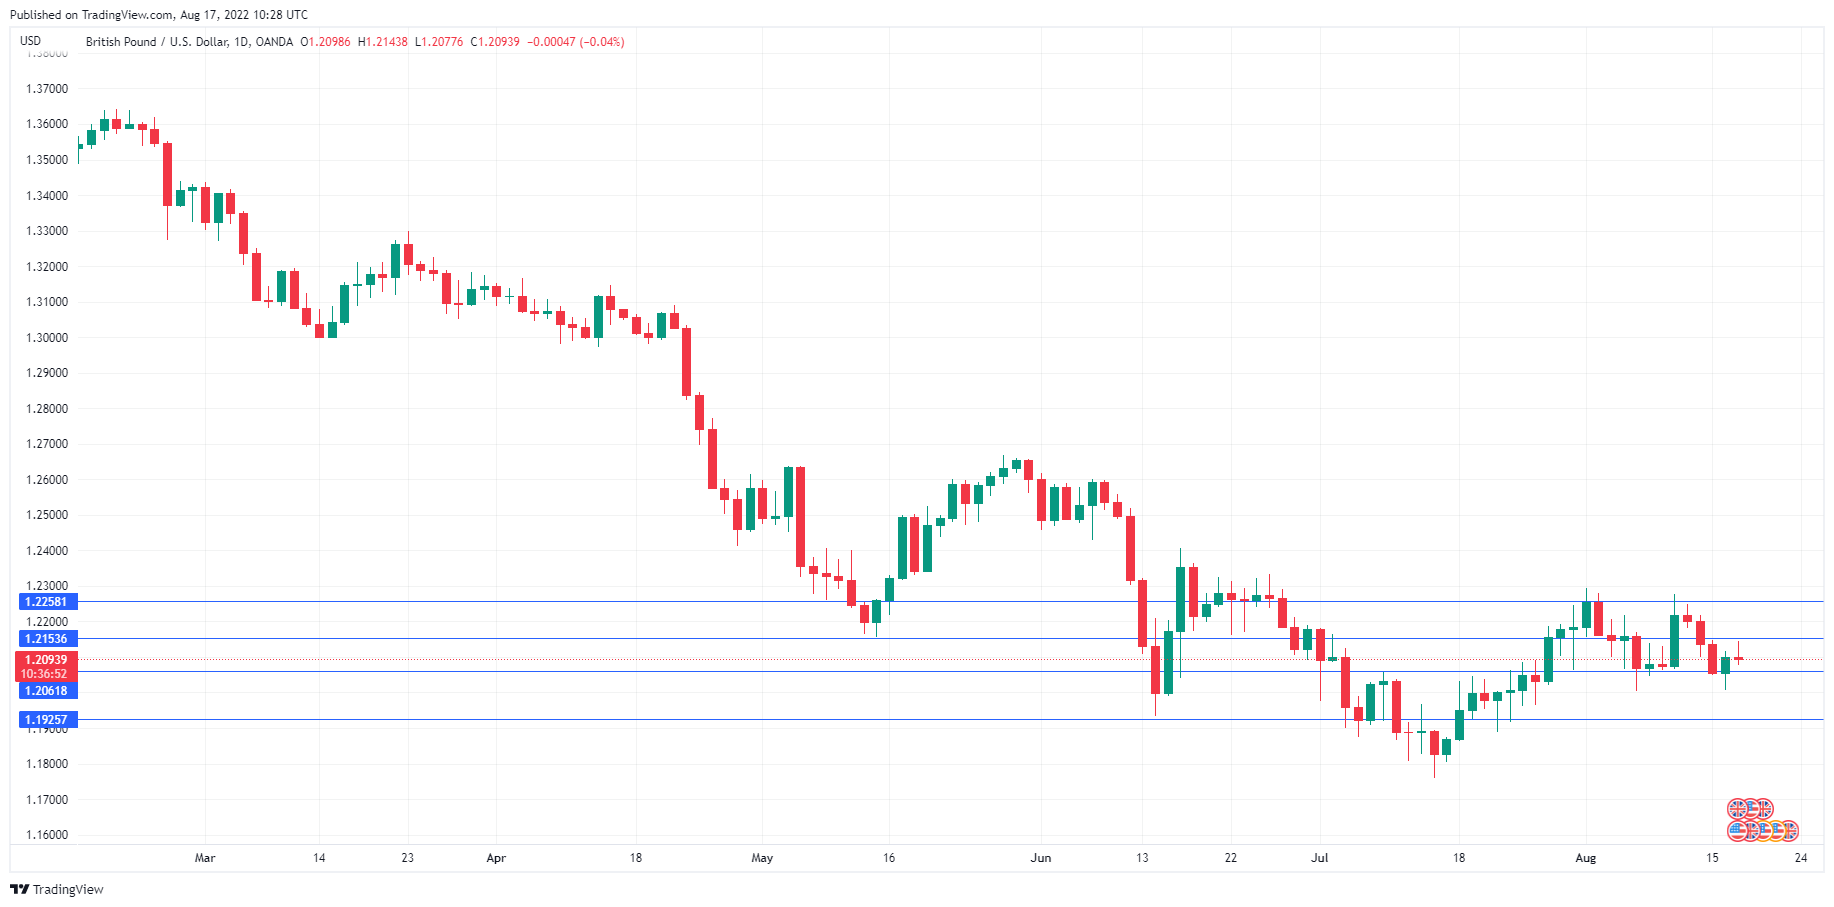
GBP/USD Technical
- GBP/USD is testing support at 1.2030. Below, there is support at 1.1925
- There is resistance at 1.2153 and 1.2258
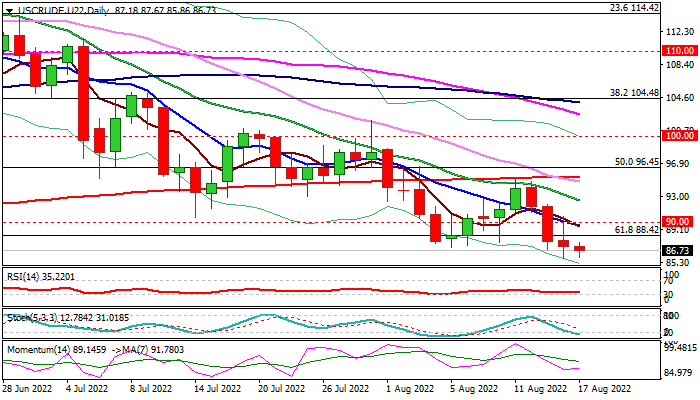
WTI Price Holds Near 7-month Low on Renewed Concerns about Global Growth
WTI oil price remains under pressure and holding near new seven-month low on Wednesday, following short-lived recovery attempt on Tuesday, which stalled at $90 zone.
The price action holds in red for the fourth straight day, driven by fresh negative sentiment of renewed concerns about global economic growth, as prospects of a global recession warn that demand for oil would weaken.
The most recent data from China showed that industrial production and retail sales unexpectedly slowed, adding to concerns about the recovery of the world’s second largest economy and the biggest oil importer from the slowdown in the second quarter and a narrow escape from contraction is running out of steam.
The negative sentiment was additionally fueled by unexpected and strong fall of the US Empire State Manufacturing Index which fell to the lowest since May 2020.
Positive signal from the US API report on Tuesday which showed a drop in crude inventories was offset by overall negative sentiment and made no significant impact on oil prices.
Technical studies on daily chart show moving averages in full bearish setup and rising negative momentum, while repeated close below broken Fibo support at $88.42 (61.8% of $62.42/$130.48 upleg) boost negative signal.
Also, completion of failure swing pattern on weekly chart add to bearish tone, with weekly close below $88.42 pivot to confirm.
Although bears are in control, oversold stochastic and headwinds from former high at $85.39 (Oct 25 2021) may slow the action for extended consolidation before bears resume towards targets at $80 (psychological) and $78.48 (Fibo 76.4% of $62.42/$130.48).
Broken Fibo support at $88.42 reverted to solid resistance which should ideally cap, with extended upticks to stay under $90.00/$90.36 (psychological / daily Tenkan-sen) to keep bears intact.
Res: 87.67; 88.42; 90.00; 90.36.
Sup: 85.71; 85.39; 81.89; 80.00.
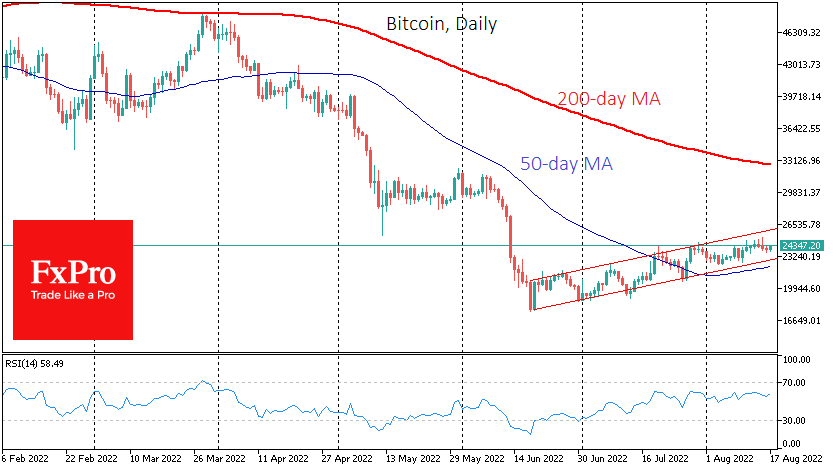
Bitcoin, Ethereum corridor and new dog race
Market picture
Bitcoin has added 1.5% to $24.3K in the past 24 hours. Over the past couple of hours, the first cryptocurrency has regained Tuesday’s slump, finding support from buyers at last Friday’s local lows.
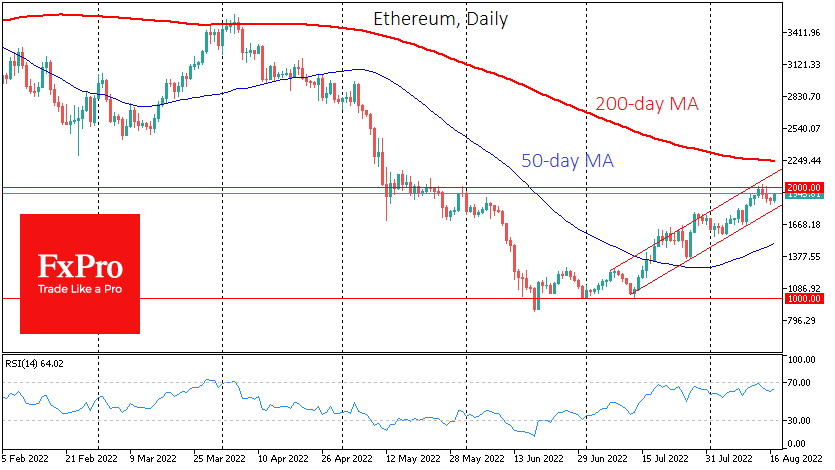
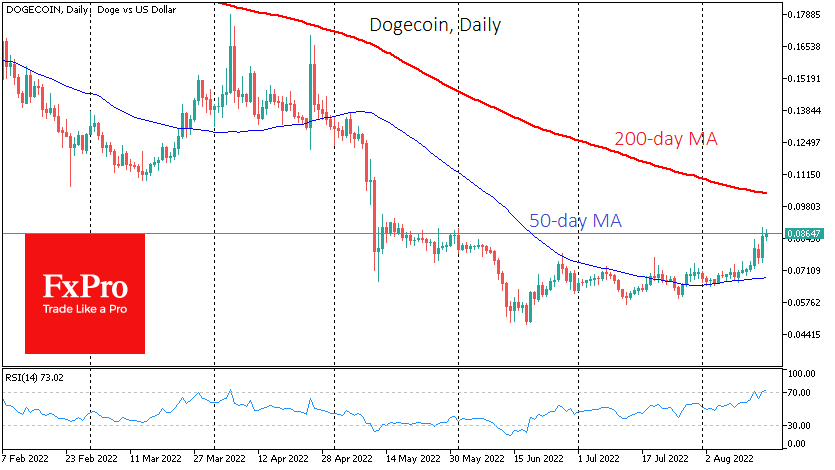
Ethereum, following trends in recent weeks, is returning the drawdown even more vividly, adding 3.3% overnight to $1940. Top altcoins are rising between 1.7% (BNB) and 11.3% (Dogecoin).
The total capitalisation of the crypto market, according to CoinMarketCap, rose 2% to $1.16 trillion overnight.
Gold and silver crypto are firmly in an uptrend corridor, turning to rise today before touching the lower boundary.
Dogecoin was the highest gainer in the top 100 crypto assets, adding around 30% for the week. Another dog coin, Shiba Inu, is also growing. The community has already managed to call it a dog race. In both cases, it is a manifestation of retail investor activity, like the run-up in meme stocks that is happening again in the stock markets.
News background
According to Arcane Research, miners have been selling more BTC than mining for three consecutive months since May. While bitcoin’s rise in July has eased the pressure on miners, they continue to sell off previously accumulated stockpiles.
PayPal, the largest electronic payment system, has added the ability to buy, sell and transfer cryptocurrencies via a mobile app. One of Brazil’s largest banks, BTG Pactual, has launched a platform for investing in cryptocurrencies.
The US Federal Reserve is issuing new rules for cryptocurrency banks, under which they can be granted master accounts, a key financial status, allows direct payments and access to the regulator.
The European Union authorities will create a new regulatory authority, AMLA, to directly oversee the industry.
Last Eurozone Inflation Data Before ECB Meeting
The ECB won't meet until September 8th, which is before the next release of inflation data. Meaning that they will likely be deciding monetary policy on the data that comes out tomorrow. And this could be a pretty big deal, because inflation in Europe is expected to surpass inflation in the US, while the ECB has rates still at zero. By comparison, the Fed's rate is at 2.5%.
However, what drives currencies is the real rate spread. That is, how much return investors can expect, taking into account inflation for both currencies. Even if interest rates are moving, inflation can move even more and shift the calculus. And that could be one of the driving forces for the currency pair and might mean the EURUSD makes another run at parity.
But first, let's go over the expectations before delving into rate spread
EuroZone inflation is expected to move up to 8.9% from 8.6% prior, once again, a record since the shared currency was created. Though, to be fair, not a record for the currencies of the countries that joined the Euro. The bright spot is that monthly inflation is expected to slow to 0.1% growth from 0.8% in June. But, that is expected to be almost entirely from the reduction in fuel costs, just like in the report from the US last week.
For ECB policy, however, we might want to look at the core inflation rate, which is expected to move up to 4.0% from 3.7% prior. That's also the highest ever, once again.
Also at the same time is the release of Construction Output for June, which is expected to slow to 1.8% from 2.9% in May. Not expected to influence the market directly, but it could be a sign of the impact the expected ECB policy has on one of the major economic sectors.
What the projections mean for the currency
Back to the analysis of pressure on the EURUSD. If the projections turn out to be correct, it would mean that the real interest rate for the dollar is -6.0%, while the real rate for the Euro is -8.9%. In other words, a 2.9% spread.
Last month, the real rate for the dollar was -7.4% while for the Euro it was -8.1% (taking into account before the latest moves by the Fed and the ECB respectively). That means the spread was just 0.7%.
So, given the differences in inflation and interest rates, having dollars has become a significantly better investment. Or, because both have negative real rates, the dollar is a significantly less bad investment. The pressure to hold dollars and not Euros would likely increase, especially going forward.
What it means for the future
Raising rates is meant to get inflation down. So, higher rates not only mean a better return on investment, but also that inflation would be expected to be less in the future. If the ECB is hesitant about raising rates, it could mean inflation keeps rising, making the Euro a worse investment.
The combination of these two factors could keep driving the spread between the currencies, and increased pressure on the EURUSD. That is, as long as the Fed doesn't pivot, or the ECB doesn't start raising rates at least as fast as the Fed.
GBP/USD Pair Climbed above the 1.2050 Resistance
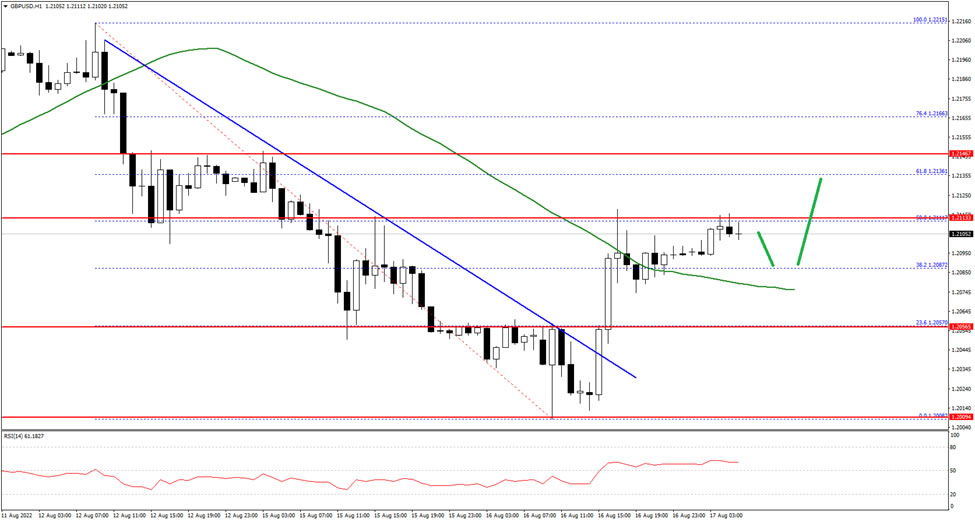
The British Pound started a short-term recovery wave from the 1.2000 support zone against the US Dollar. The GBP/USD pair climbed above the 1.2050 resistance.
The pair even climbed above a major bearish trend line with resistance near 1.2055 on the hourly chart. It is now trading above the 1.2080 level and the 50 hourly simple moving average. An immediate resistance is near the 1.2110 level.
The first major resistance sits near the 1.2140 zone. If there is a clear upside break above the 1.2140 resistance, the pair could rise steadily towards the 1.2200 level in the near term.
On the downside, an initial support is near 1.2080 on FXOpen. The main support is forming near the 1.2055 level. A break below the 1.2055 support could even push the pair below the 1.2000 support.