Sample Category Title
GBP/USD Daily Outlook
Daily Pivots: (S1) 1.2031; (P) 1.2075; (R1) 1.2141; More...
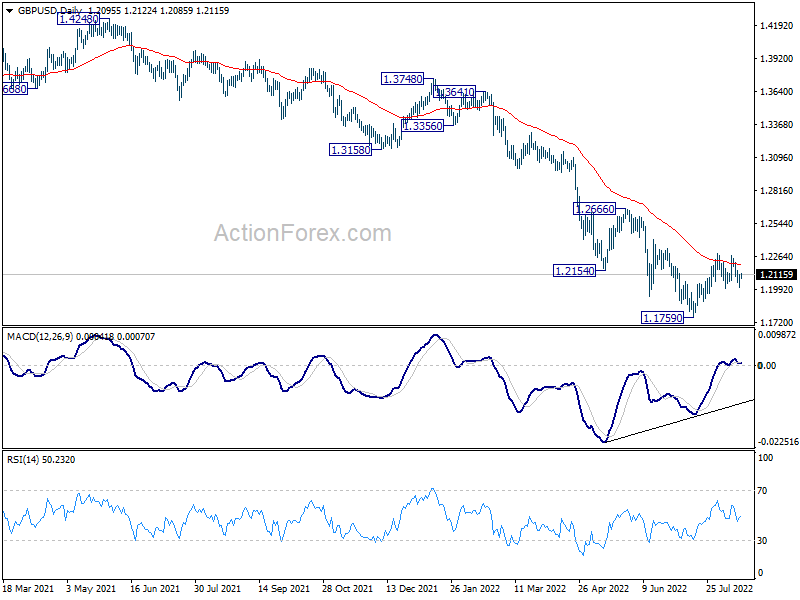
Intraday bias in GBP/USD remains neutral as it's still bounded in range of 1.2002/2292. On the downside, break of 1.2002 minor support will argue that rebound from 1.1759 has completed, after rejection by 55 day EMA. Intraday bias will be back on the downside for retesting 1.1759 low first. Break there will resume larger down trend. On the upside, above 1.2922 will resume the rebound from 1.1759 towards 1.2666 resistance.
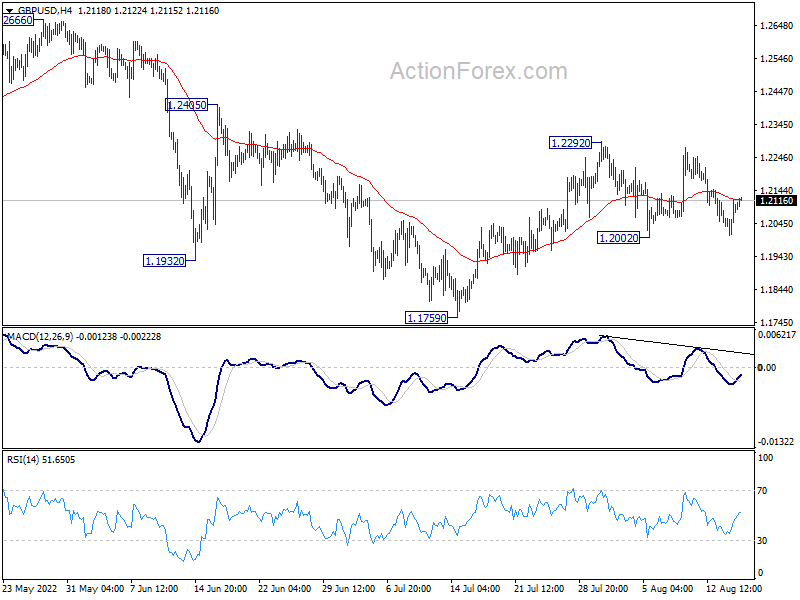
In the bigger picture, fall from 1.4248 (2018 high) could be a leg inside the pattern from 1.1409 (2020 low), or resuming the longer term down trend. Deeper decline is expected as long as 1.2666 resistance holds. Next target is 1.1409 low. However, firm break of 1.2666 will bring stronger rise back to 55 week EMA (now at 1.2897).
Kiwi Rebounds after RBNZ, Sterling Awaits Inflation Data
New Zealand Dollar trades broadly higher after RBNZ's rate hike today. But trading is mixed in other currencies. Commodity currencies are generally on the soft side for the week, but there is no follow through selling. Dollar is still the strongest, but it's struggling to extend the near term rally. Yen attempted for a bearish reversal, but there is no follow through selling. Sterling is firming up as UK inflation data is awaited, but it's mixed together with Euro and Swiss Franc. Overall, most major pairs and crosses are stuck inside last week's range.
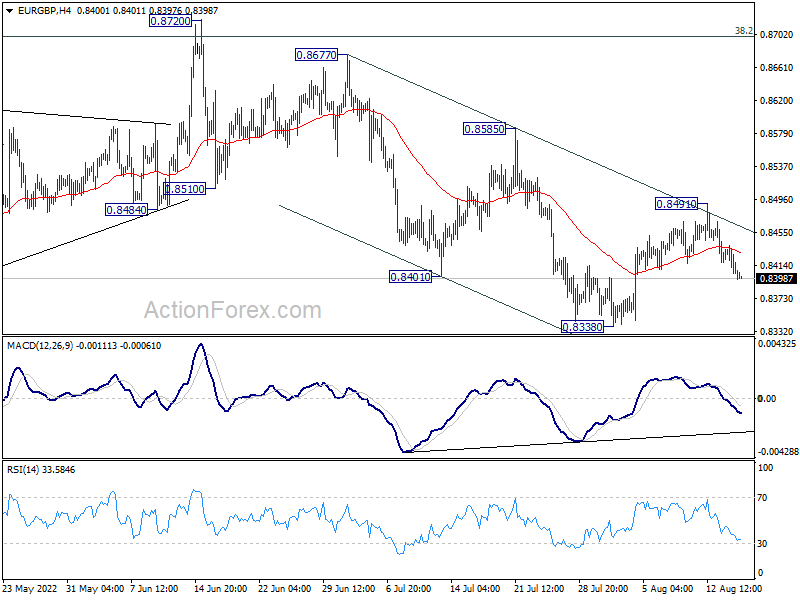
Technically, EUR/GBP's decline suggests that the recovery from 0.8338 might have completed at 0.8491. Deeper fall is mildly in favor towards 0.8338 low and possibly a break below there to resume the decline from 0.8720. The question is, if that's happening, whether it would be accompanied by deeper fall in EUR/USD towards 0.9951 low, or a bounce in GBP/USD back to 1.2292 minor resistance.
In Asia, at the time of writing, Nikkei is up 1.08%. Hong Kong HSI is up 0.98%. China Shanghai SSE is up 0.34%. Singapore Strait Times is up 0.43%. Japan 10-year JGB yield is up 0.0121 at 0.182. Overnight, DOW rose 0.71%. S&P 500 rose 0.19%. NASDAQ dropped -0.19%. 10-year yield rose 0.033 to 2.824.
RBNZ hikes 50bps, monetary conditions needed to continue to tighten
RBNZ raises the Official Cash Rate by 50bps to 3.00% as widely expected, as "core consumer price inflation remains too high and labour resources remain scarce". It also maintains hawkish bias as "committee members agreed that monetary conditions needed to continue to tighten until they are confident there is sufficient restraint on spending to bring inflation back within its 1-3 percent per annum target range."
The central bank noted domestic spending has "remained resilient", supported by a "robust employment level, continued fiscal support, an elevated terms of trade, and sound household balance sheets in aggregate." Production is being "constrained by acute labour shortages", heightened by seasonal illnesses and COVID-19. Spending and investment continues to "outstrip supply capacity". Wage pressures are "heightened". A range of indicators highlight broad-based domestic pricing pressures.
NZD/USD bounces after RBNZ hike, drawing support from HnS neckline
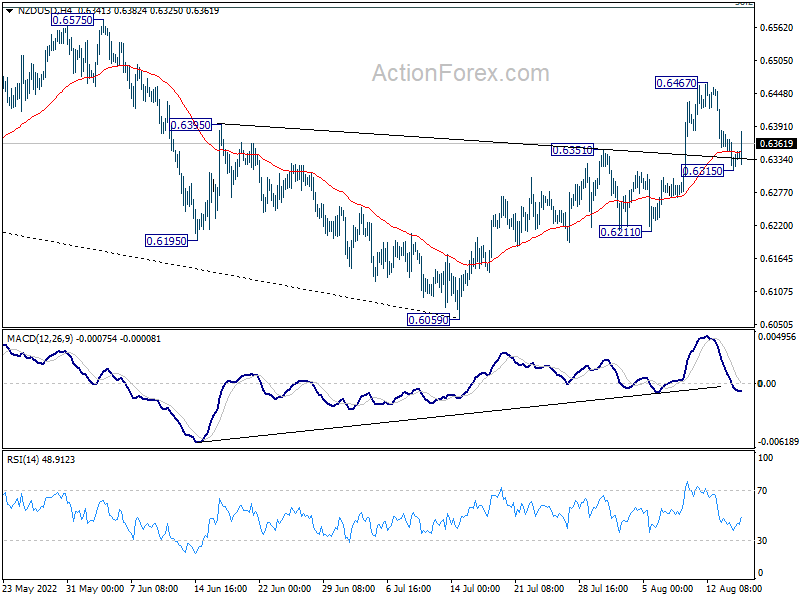
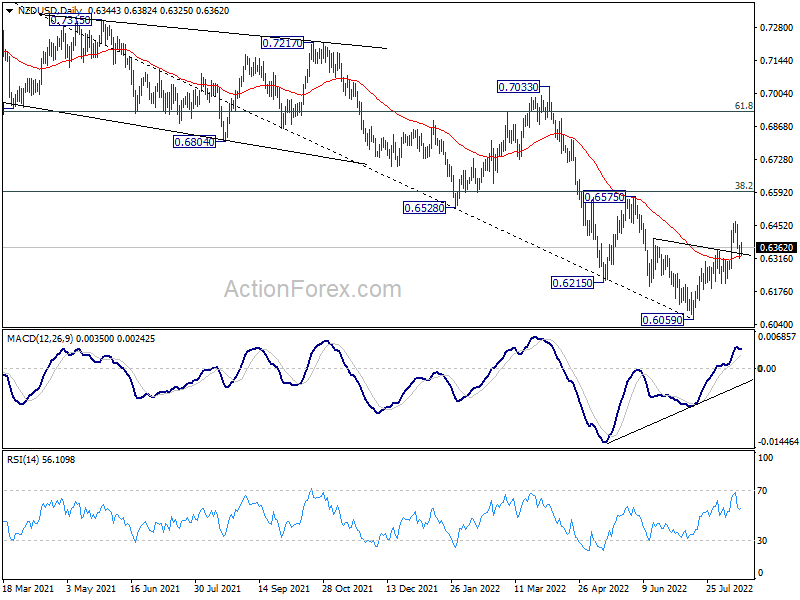
NZD/USD recovers notably after RBNZ rate hike, but stays in range below 0.6467 temporary top. Outlook is staying bullish for now, as NZD/USD is trying to draw support from head and shoulder neckline (ls: 0.6195, h: 0.6059, rs: 0.6211), as well as 55 day EMA (now at 0.6323). Another rise is in favor through 0.6467, sooner rather than later.
Either as a corrective rebound, or part of an up trend, rise from 0.6059 should target 0.6575 resistance zone, which is close to 38.2% retracement of 0.7463 (2021 high) to 0.6059 at 0.6595.
However, another decline, and sustained trading below 55 day EMA will invalidate this view and bring retest of 0.6059 low instead.
Japan export rose 19.0% yoy in Jul, imports rose 47.2% yoy
Japan exports rose 19.0% yoy to JPY 8753B in July, with gains led by auto shipments to US and chips to China. Imports rose 47.2% yoy to JPY 10190B, driven by higher costs of crude oil, coal and liquid natural gas. Trade deficit came in at JPY -1437B. July's figure marked a full straight year of monthly trade deficits, the longest streak since the 32-month run to February 2015.
In seasonally adjusted terms, exports rose 2.1% mom to JPY 8437B. Imports rose 3.5% mom to JPY 10570B. Trade deficit widened to JPY -2133B.
Looking ahead
UK CPI and PPI, Eurozone GDP and employment change will be released in European session. Later in the day, US retail sales and business inventories will be published, and then FOMC minutes.
GBP/USD Daily Outlook
Daily Pivots: (S1) 1.2031; (P) 1.2075; (R1) 1.2141; More...
Intraday bias in GBP/USD remains neutral as it's still bounded in range of 1.2002/2292. On the downside, break of 1.2002 minor support will argue that rebound from 1.1759 has completed, after rejection by 55 day EMA. Intraday bias will be back on the downside for retesting 1.1759 low first. Break there will resume larger down trend. On the upside, above 1.2922 will resume the rebound from 1.1759 towards 1.2666 resistance.
In the bigger picture, fall from 1.4248 (2018 high) could be a leg inside the pattern from 1.1409 (2020 low), or resuming the longer term down trend. Deeper decline is expected as long as 1.2666 resistance holds. Next target is 1.1409 low. However, firm break of 1.2666 will bring stronger rise back to 55 week EMA (now at 1.2897).
Economic Indicators Update
| GMT | Ccy | Events | Actual | Forecast | Previous | Revised |
|---|---|---|---|---|---|---|
| 22:45 | NZD | PPI Input Q/Q Q2 | 3.10% | 2.10% | 3.60% | 3.40% |
| 22:45 | NZD | PPI Output Q/Q Q2 | 2.40% | 1.90% | 2.60% | |
| 23:50 | JPY | Trade Balance (JPY) Jul | -2.13T | -1.94T | -1.93T | -1.95T |
| 23:50 | JPY | Machinery Orders M/M Jun | 0.90% | 1.30% | -5.60% | |
| 00:30 | AUD | Westpac Leading Index M/M Jul | -0.20% | -0.20% | ||
| 01:30 | AUD | Wage Price Index Q/Q Q2 | 0.70% | 0.80% | 0.70% | |
| 02:00 | NZD | RBNZ Interest Rate Decision | 3.00% | 3.00% | 2.50% | |
| 06:00 | GBP | CPI M/M Jul | 0.00% | 0.80% | ||
| 06:00 | GBP | CPI Y/Y Jul | 9.80% | 9.40% | ||
| 06:00 | GBP | Core CPI Y/Y Jul | 6.40% | 5.80% | ||
| 06:00 | GBP | RPI M/M Jul | 0.80% | 0.90% | ||
| 06:00 | GBP | RPI Y/Y Jul | 12.90% | 11.80% | ||
| 06:00 | GBP | PPI Input M/M Jul | 1.00% | 1.80% | ||
| 06:00 | GBP | PPI Input Y/Y Jul | 24.80% | 24.00% | ||
| 06:00 | GBP | PPI Output Y/Y Jul | 17.60% | 16.50% | ||
| 06:00 | GBP | PPI Output M/M Jul | 1.60% | 1.40% | ||
| 06:00 | GBP | PPI Core Output M/M Jul | 0.00% | 0.80% | ||
| 06:00 | GBP | PPI Core Output Y/Y Jul | 15.90% | 15.20% | ||
| 09:00 | EUR | Eurozone GDP Q/Q Q2 P | 0.70% | 0.70% | ||
| 09:00 | EUR | Eurozone Employment Change Q/Q Q2 P | 0.60% | 0.60% | ||
| 12:30 | USD | Retail Sales M/M Jul | 0.20% | 1.00% | ||
| 12:30 | USD | Retail Sales ex Autos M/M Jul | 0.10% | 1.00% | ||
| 14:00 | USD | Business Inventories Jun | 1.40% | 1.40% | ||
| 14:30 | USD | Crude Oil Inventories | 0.3M | 5.5M | ||
| 18:00 | USD | FOMC Minutes |
Japan export rose 19.0% yoy in Jul, imports rose 47.2% yoy
Japan exports rose 19.0% yoy to JPY 8753B in July, with gains led by auto shipments to US and chips to China. Imports rose 47.2% yoy to JPY 10190B, driven by higher costs of crude oil, coal and liquid natural gas. Trade deficit came in at JPY -1437B. July's figure marked a full straight year of monthly trade deficits, the longest streak since the 32-month run to February 2015.
In seasonally adjusted terms, exports rose 2.1% mom to JPY 8437B. Imports rose 3.5% mom to JPY 10570B. Trade deficit widened to JPY -2133B.
NZD/USD bounces after RBNZ hike, drawing support from HnS neckline
NZD/USD recovers notably after RBNZ rate hike, but stays in range below 0.6467 temporary top. Outlook is staying bullish for now, as NZD/USD is trying to draw support from head and shoulder neckline (ls: 0.6195, h: 0.6059, rs: 0.6211), as well as 55 day EMA (now at 0.6323). Another rise is in favor through 0.6467, sooner rather than later.
Either as a corrective rebound, or part of an up trend, rise from 0.6059 should target 0.6575 resistance zone, which is close to 38.2% retracement of 0.7463 (2021 high) to 0.6059 at 0.6595.
However, another decline, and sustained trading below 55 day EMA will invalidate this view and bring retest of 0.6059 low instead.
RBNZ hikes 50bps, monetary conditions needed to continue to tighten
RBNZ raises the Official Cash Rate by 50bps to 3.00% as widely expected, as "core consumer price inflation remains too high and labour resources remain scarce". It also maintains hawkish bias as "committee members agreed that monetary conditions needed to continue to tighten until they are confident there is sufficient restraint on spending to bring inflation back within its 1-3 percent per annum target range."
The central bank noted domestic spending has "remained resilient", supported by a "robust employment level, continued fiscal support, an elevated terms of trade, and sound household balance sheets in aggregate." Production is being "constrained by acute labour shortages", heightened by seasonal illnesses and COVID-19. Spending and investment continues to "outstrip supply capacity". Wage pressures are "heightened". A range of indicators highlight broad-based domestic pricing pressures.
(RBNZ) Ongoing monetary tightening
The Monetary Policy Committee today increased the Official Cash Rate (OCR) to 3 percent from 2.5 percent.
The Monetary Policy Committee today increased the Official Cash Rate (OCR) to 3 percent from 2.5 percent. The Committee agreed it remains appropriate to continue to tighten monetary conditions at pace to maintain price stability and contribute to maximum sustainable employment. Core consumer price inflation remains too high and labour resources remain scarce.
Global consumer price inflation has continued to rise, albeit with some recent reprieve from lower global oil prices. The war in Ukraine continues to underpin high commodity prices, with global production costs and constraints further exacerbated by supply-chain bottlenecks due to the ongoing COVID-19 health challenge. The outlook for global growth continues to weaken, reflecting the ongoing tightening in global monetary conditions.
In New Zealand, domestic spending has remained resilient to global and local headwinds to date. Spending levels are supported by a robust employment level, continued fiscal support, an elevated terms of trade, and sound household balance sheets in aggregate.
However, production is being constrained by acute labour shortages, heightened by seasonal and COVID-19 related illnesses. In these circumstances, spending and investment continues to outstrip supply capacity, and wage pressures are heightened. A range of indicators highlight broad-based domestic pricing pressures.
Committee members agreed that monetary conditions needed to continue to tighten until they are confident there is sufficient restraint on spending to bring inflation back within its 1-3 percent per annum target range. The Committee remains resolute in achieving the Monetary Policy Remit.
Summary Record of Meeting – August 2022
The Monetary Policy Committee discussed developments affecting the outlook for inflation and employment in New Zealand. Consumer price inflation is currently too high and labour remains scarce. The Committee agreed to continue increasing the Official Cash Rate (OCR) at pace to achieve price stability and to support maximum sustainable employment. The Committee is resolute in its commitment to ensure consumer price inflation returns to within the 1 to 3 percent target range.
The Committee judged that the global economic outlook has weakened since May, reflecting tightening financial conditions, ongoing geopolitical tensions, and continued disruption to global supply of goods and services. The war in Ukraine has put upward pressure on global commodity prices, especially oil and food, and disrupted global trade. Lockdowns in some Chinese cities to combat the spread of COVID-19 has contributed to supply-chain bottlenecks and shipping times and costs remain elevated.
Inflation is at the highest level in many decades in most advanced economies, due to disrupted and curtailed global supply coupled with a strong recovery of demand following the disruptions and uncertainties caused by earlier phases of the pandemic. Most central banks are raising interest rates, in many cases at a much faster pace than has been seen in recent history. Higher interest rates abroad have placed downward pressure on New Zealand's exchange rates, making our imports more expensive while supporting exporter returns.
Developments in the New Zealand economy were discussed by the Committee. Demand has remained resilient to global and domestic headwinds to date. However, output is being constrained by the disrupted global supply of goods and services and acute labour shortages, made worse by high levels of sickness from COVID-19 and other illnesses.
Members discussed the outlook for domestic demand. Residential construction activity has been strong, but the Committee discussed downside risks to future construction activity, with some construction firms reporting a fall in forward orders. Business surveys and direct reports from businesses suggest a more general slowing in business activity in the coming months. However, inbound international tourism is recovering from a low base and that is expected to provide some offset to weaker domestic spending.
Household balance sheets on the whole are strong, but higher interest rates and rising costs of living are putting pressure on household finances, and are expected to reduce household spending and house prices. House prices have steadily dropped from high levels since November last year, and are expected to keep falling over the coming year towards more sustainable levels.
Production capacity pressures remain. In particular, labour shortages are a major constraint on business activity. Wage growth has continued to pick up in line with tightness in the labour market, and there is some evidence from discussions with businesses that firms are increasing wages more frequently. However, hourly wage rates are rising more slowly than inflation. The Committee was encouraged by recent declines in survey measures of inflation expectations, but remains alert to the risk of a more pronounced change in wage and price setting behaviour.
The Committee discussed the outlook for fiscal policy, and noted upside risks to overall government spending due to the rising cost of delivering government services.
The Committee expects some easing of the rate of inflation in the near term due to falling petrol prices and stabilisation in international shipping costs. However, inflation pressures have broadened and measures of core inflation have increased. Nevertheless, inflation is expected to return to the Committee's 1-3 percent target range by the middle of 2024, but this will require a better balance between supply and demand.
The Committee discussed changes in the level of commercial bank cash balances held at the central bank. Noting current high levels, the Committee discussed the factors influencing those balances, including the Large Scale Asset Purchases (LSAP) and Funding for Lending programmes (FLP). Both of these programmes provided monetary stimulus through lowering longer-term interest rates.
The Committee noted that the volume of commercial bank lending is determined by several factors including customer demand for loans, banks' perception and appetite for risk, and prudential requirements on banks' capital, cash and other liquid assets and funding. The LSAP and FLP programmes did support bank funding and liquidity positions, but there is no evidence that this is currently having a direct impact on lending activity over and above their impact on interest rates. Credit growth is modest in the context of rising interest rates. Settlement cash balances will gradually reduce as the Reserve Bank sells back government bonds to the government as the LSAP programme is unwound.
The drawdown window of the FLP will expire in early December, and some further usage of the programme is expected in the coming months. In total, the programme will fund no more than 6 percent of bank lending. The programme has lowered funding costs for banks, which has contributed to lower lending rates for borrowers and provided additional stimulus to the economy while the OCR was low. However, the Committee sets policy to achieve the overall desired level of monetary conditions, and has offset the impact of the FLP with a higher OCR as monetary policy stimulus has been removed. The Bank's experience using monetary policy instruments such as LSAP and FLP will be reviewed as part of the five-yearly Review and Assessment of the Formulation and Implementation of Monetary Policy.
The Committee discussed the possibility that neutral interest rates may be higher. For example, market-based estimates of neutral nominal interest rates have increased over the past year. Staff will be undertaking further work to review their estimates.
The Committee agreed that further increases in the OCR were required in order to meet their Remit objectives, and discussed the appropriate pace at which to raise rates. The Committee discussed whether more rapid increases could improve the credibility of the inflation target and reduce the risk of a significant increase in inflation expectations. However, the Committee agreed that maintaining the recent pace of tightening remains the best means by which to meet their Remit.
The Committee noted that a number of central banks had increased interest rates by more than 50 basis points recently, but that most of these countries had started increasing interest rates later than New Zealand did and were often starting at a lower level of interest rates.
The Committee agreed that domestic inflationary pressures had increased since May and to further bring forward the timing of OCR increases. The Committee agreed to continue increasing the OCR until it is confident that monetary conditions are sufficient to maintain expectations of low inflation in the longer term and bring consumer price inflation to within the target range. The Committee viewed this strategy as consistent with achieving their primary inflation and employment objectives without causing unnecessary instability in output, interest rates and the exchange rate.
On Wednesday 17 August, the Committee reached a consensus to increase the OCR to 3 percent from 2.5 percent.
Attendees:
Reserve Bank staff: Adrian Orr, Karen Silk, Christian Hawkesby, Adam Richardson
External: Bob Buckle, Peter Harris, Caroline Saunders
Treasury Observer: Dominick Stephens
Reserve Bank Observer: Paul Conway
Secretary: Chris Bloor
First Impressions: RBNZ Monetary Policy Statement August 2022
Another 50 basis point hike in the OCR to 3%, with the Reserve Bank firmly focused on inflation developments.
RBNZ Monetary Policy Statement, August 2022
• The Reserve Bank has increased the Official Cash Rate by another 50 basis points to 3%. The size of the move was universally expected by economists and financial markets.
• The RBNZ now projects the OCR to reach a peak of 4.1% by the middle of next year, up from a peak of 3.95% in its May forecasts.
• The short media release accompanying the statement focused largely on the extent of inflationary forces in the economy.
• The RBNZ believes that annual inflation peaked at 7.3% in the June quarter, but does not expect it to return within the 1-3% target range until the middle of 2024.
• The RBNZ does not seem to buy into any signs of softening in the local economy, instead highlighting capacity constraints as the biggest restraint on growth.
• The RBNZ repeated its comments that “it remains appropriate to continue to tighten monetary conditions at pace”. This leaves the door open for further 50 basis point hikes at the October and November reviews, in line with our forecast.
• We recently upgraded our OCR forecast to a peak of 4% by the end of this year. Today’s statement is consistent with our forecast.
• However, we remain of the view that tightening is unlikely to continue into next year. We differ from the RBNZ in that we see early signs that higher interest rates hare having the desired impact in terms of cooling domestic demand. We expect that that will become more evident to the RBNZ by the November review.
RBNZ media release
Ongoing monetary tightening
The Monetary Policy Committee today increased the Official Cash Rate (OCR) to 3 percent from 2.5 percent. The Committee agreed it remains appropriate to continue to tighten monetary conditions at pace to maintain price stability and contribute to maximum sustainable employment. Core consumer price inflation remains too high and labour resources remain scarce.
Global consumer price inflation has continued to rise, albeit with some recent reprieve from lower global oil prices. The war in Ukraine continues to underpin high commodity prices, with global production costs and constraints further exacerbated by supply-chain bottlenecks due to the ongoing COVID-19 health challenge. The outlook for global growth continues to weaken, reflecting the ongoing tightening in global monetary conditions.
In New Zealand, domestic spending has remained resilient to global and local headwinds to date. Spending levels are supported by a robust employment level, continued fiscal support, an elevated terms of trade, and sound household balance sheets in aggregate.
However, production is being constrained by acute labour shortages, heightened by seasonal and COVID-19 related illnesses. In these circumstances, spending and investment continues to outstrip supply capacity, and wage pressures are heightened. A range of indicators highlight broad-based domestic pricing pressures.
Committee members agreed that monetary conditions needed to continue to tighten until they are confident there is sufficient restraint on spending to bring inflation back within its 1-3 percent per annum target range. The Committee remains resolute in achieving the Monetary Policy Remit.
Technical Outlook and Review
USD/JPY:
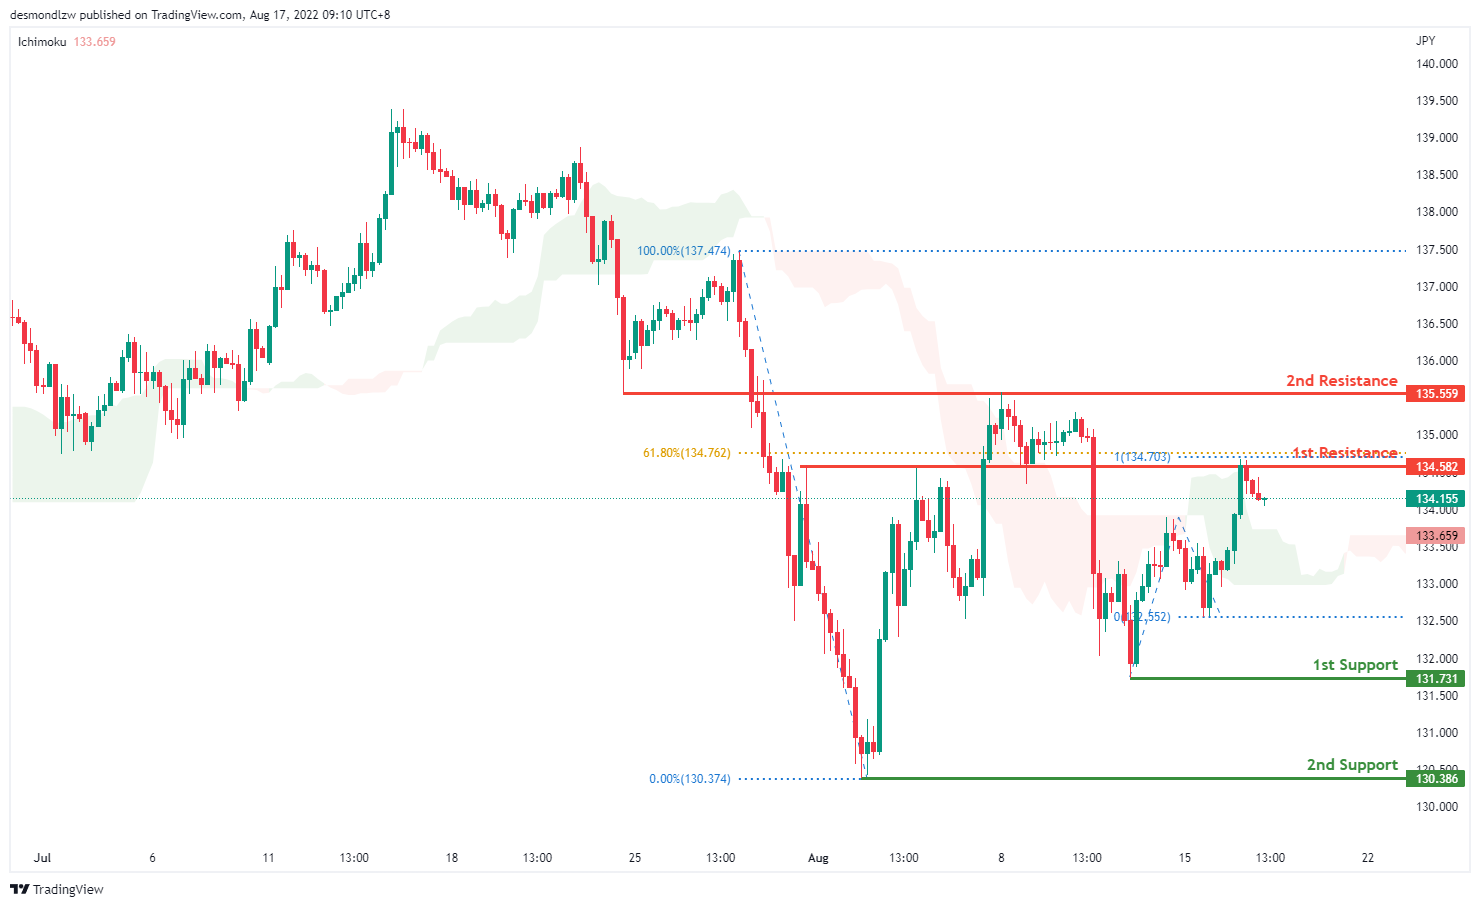
On the H4 chart, prices seem to have pulled back a little but the overall trend is still bearish biased. Price has broken the intermediate resistance at 133.908 which is the 50% Fibonacci retracement and is now testing the first resistance at 134.582 where the previous swing high. 61.8% fibonacci retracement and 100% projection sits.If the bearish momentum continues it will pull back to test the first support at 131.731
Areas of consideration:
- H4 time frame, 1st resistance at 134.582
- H4 time frame, 1st support at 131.731
DXY:
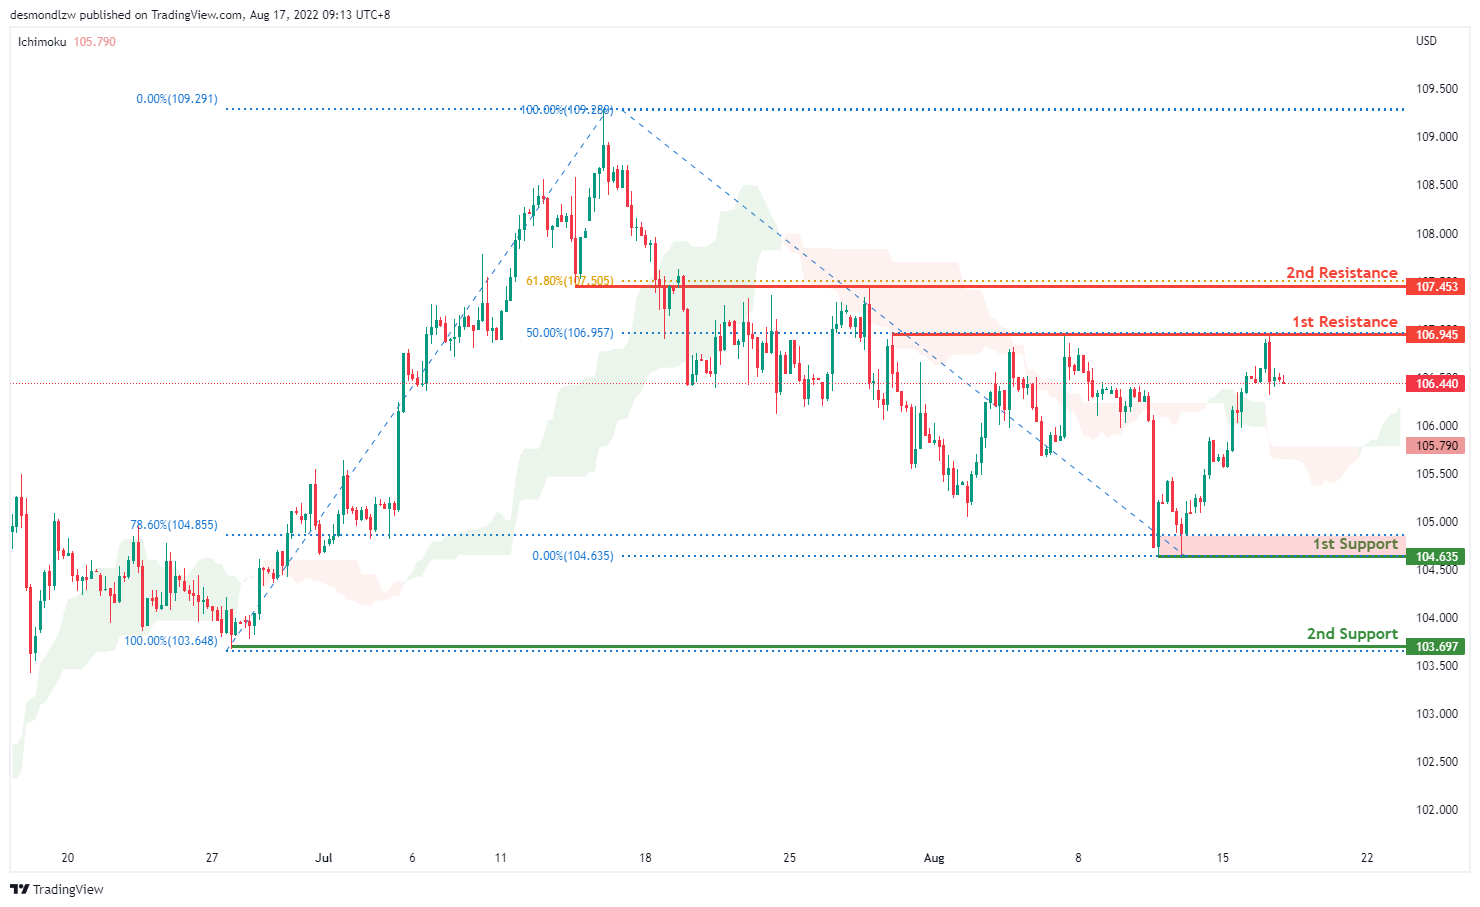
On the H4, prices seem to be moving in an ascending trend and is in a bullish momentum. Prices has tested the first resistance at 106.945 where the 50% Fibonacci retracement and the previous swing high sits. If price continues with bullish momentum, it will test the second resistance at 107.453 where the 61.8% fibonacci retracement sits. If fails to break the first resistance, it will pull back to test the first support at 104.635 where the 78.6% retracement is and subsequently the second support at 103.697 which is the previous swing low
Areas of consideration:
- H4 time frame, 1st resistance at 106.945
- H4 time frame, 1st support at 104.635
EUR/USD :
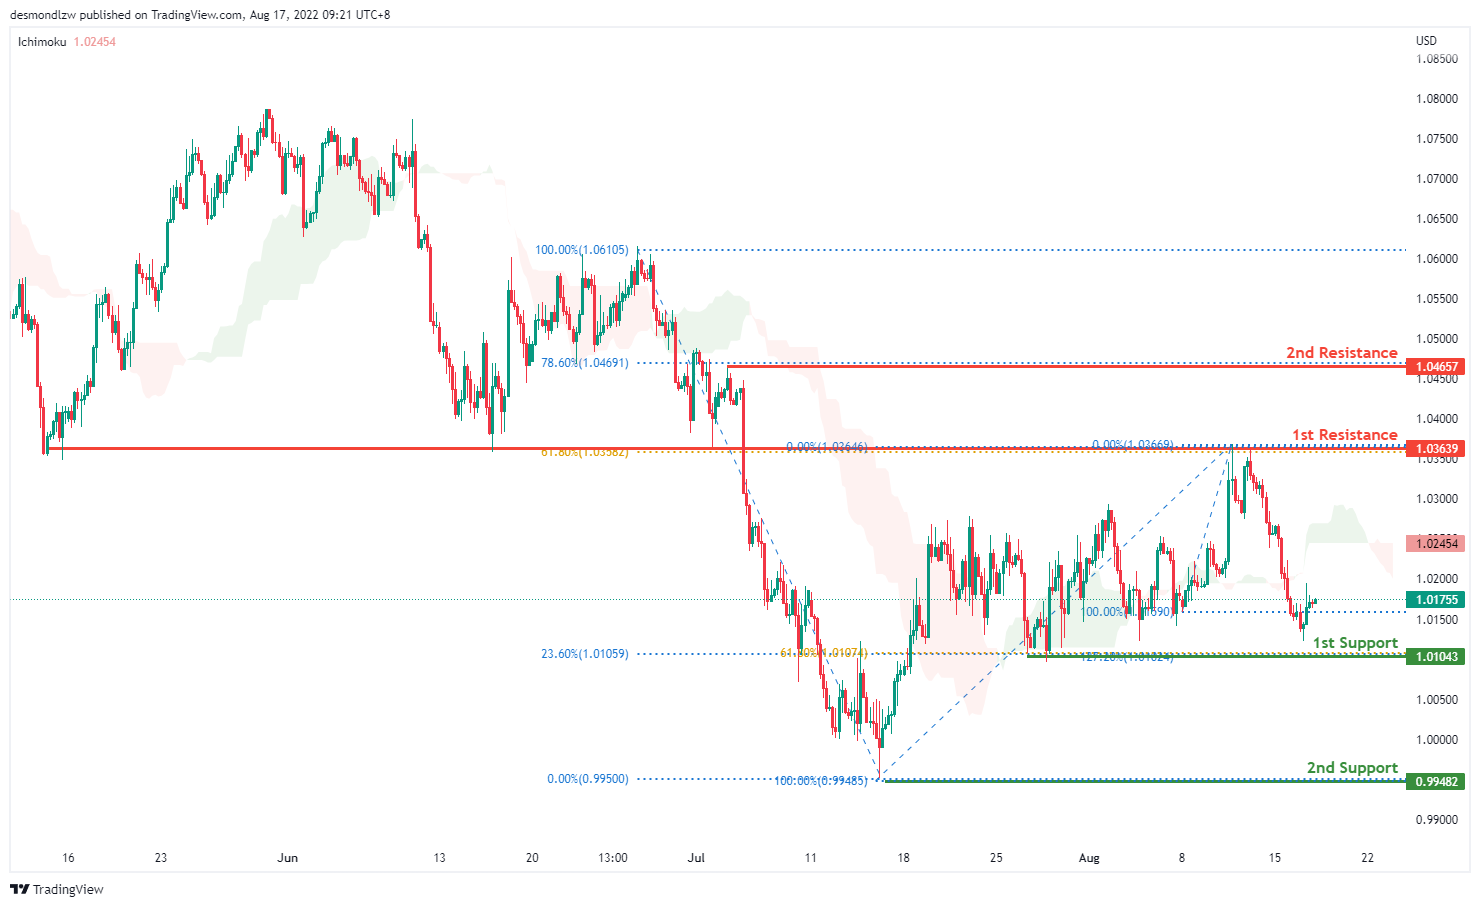
On the H4, prices have broken the ascending trend and are below the ichimoku indicator, we are bearish bias. Prices are pulling back to test the first support at 1.0104 where the 61.8% Fibonacci retracement and 127.2% extension sits. If prices continue in the bearish momentum, it will test the second support at 0.9952. Alternatively price could go back to test the first resistance at 1.0363 where the 61.8% Fibonacci retracement sits and then the second resistance at 1.0465
Areas of consideration :
- H4 1st resistance at 1.0363
- H4 1st support at 1.0104
GBP/USD:
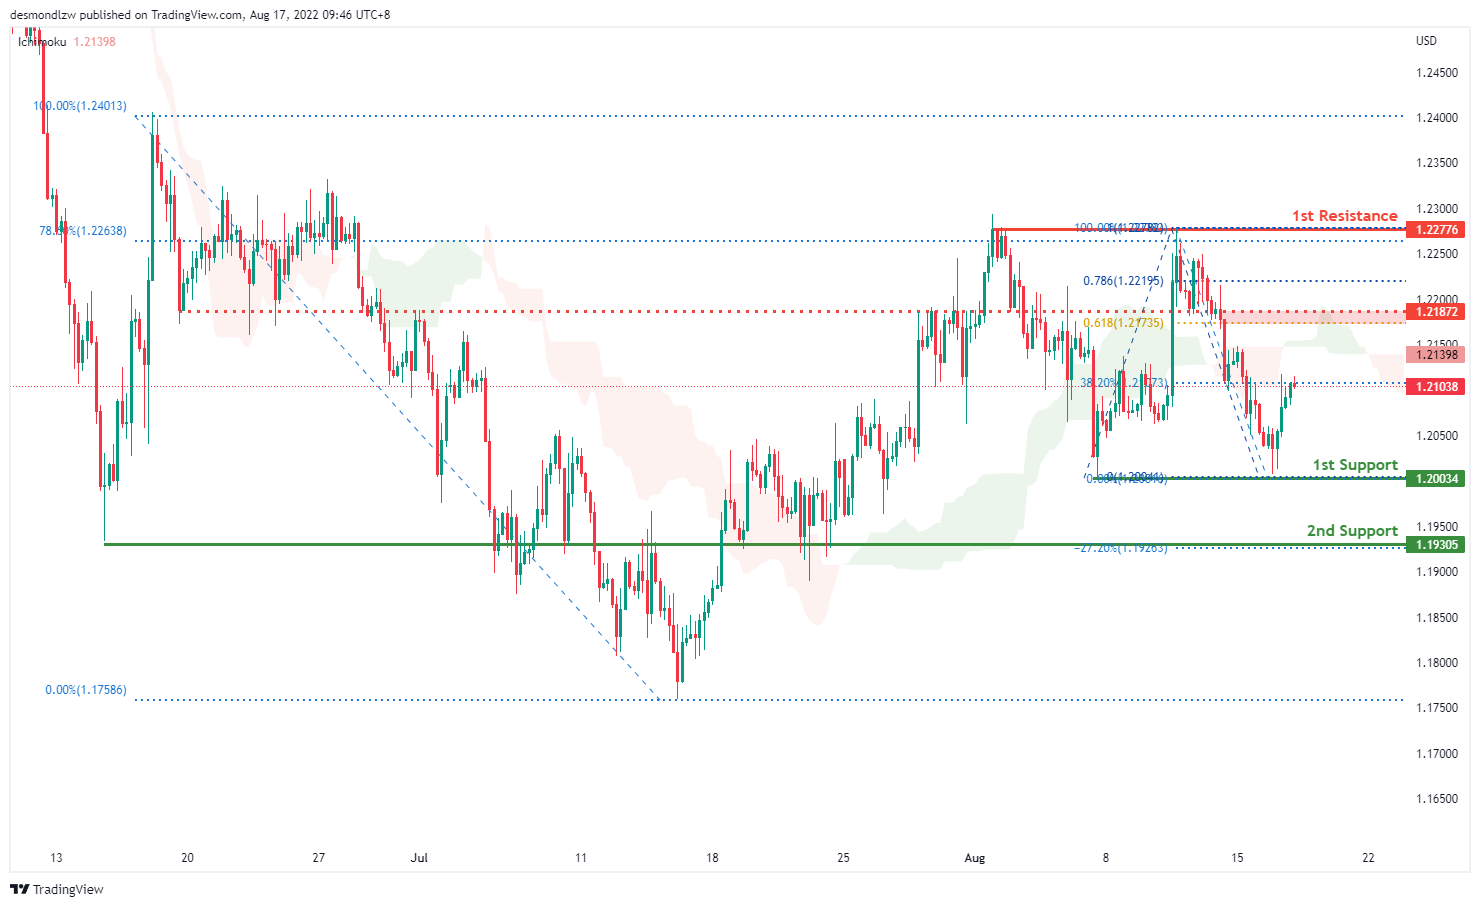
On the H4, prices seem to be in a bearish momentum. It is currently testing the 38.2% Fibonacci retracement and if the bearish momentum continues, it will pull prices to our first support 1.2003 where our swing low sits. If prices pull back further it will test the second support at 1.1930 where our 27.2% Fibonacci expansion sits. Alternatively price could hit our intermediate resistance at 1.2187 around the 61.8% projection and the first resistance at 1.2277 where the 78.6% Fibonacci retracement sits
Areas of consideration:
- H4 1st resistance at 1.2277
- H4 1st support at 1.2003
USD/CHF:
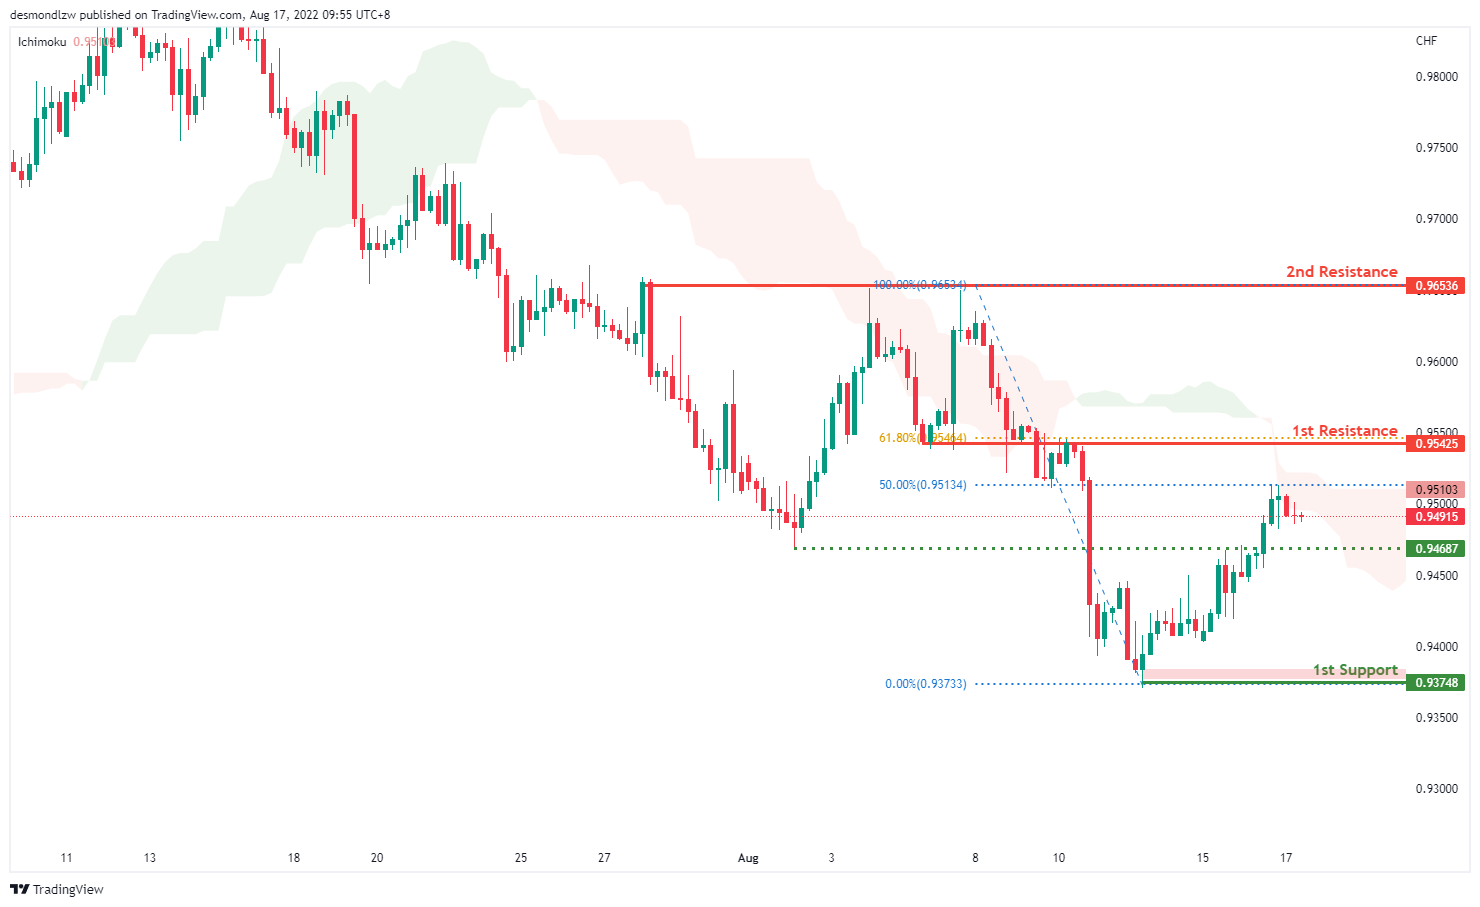
On the H4, with prices moving below the ichimoku cloud hence we have a bearish bias that the price will continue with the bearish momentum. Price is now testing at the 50% Fibonacci projection and it may rise to test the first resistance at 0.9542 where the 61.8% retracement sits. If bearish momentum continues, it should pull back to test at the intermediate support at 0.9468 where the previous swing low is then the first support at 0.9374
Areas of consideration
- H4 1st support at 0.937
- H4 1st resistance at 0.954
XAU/USD (GOLD):
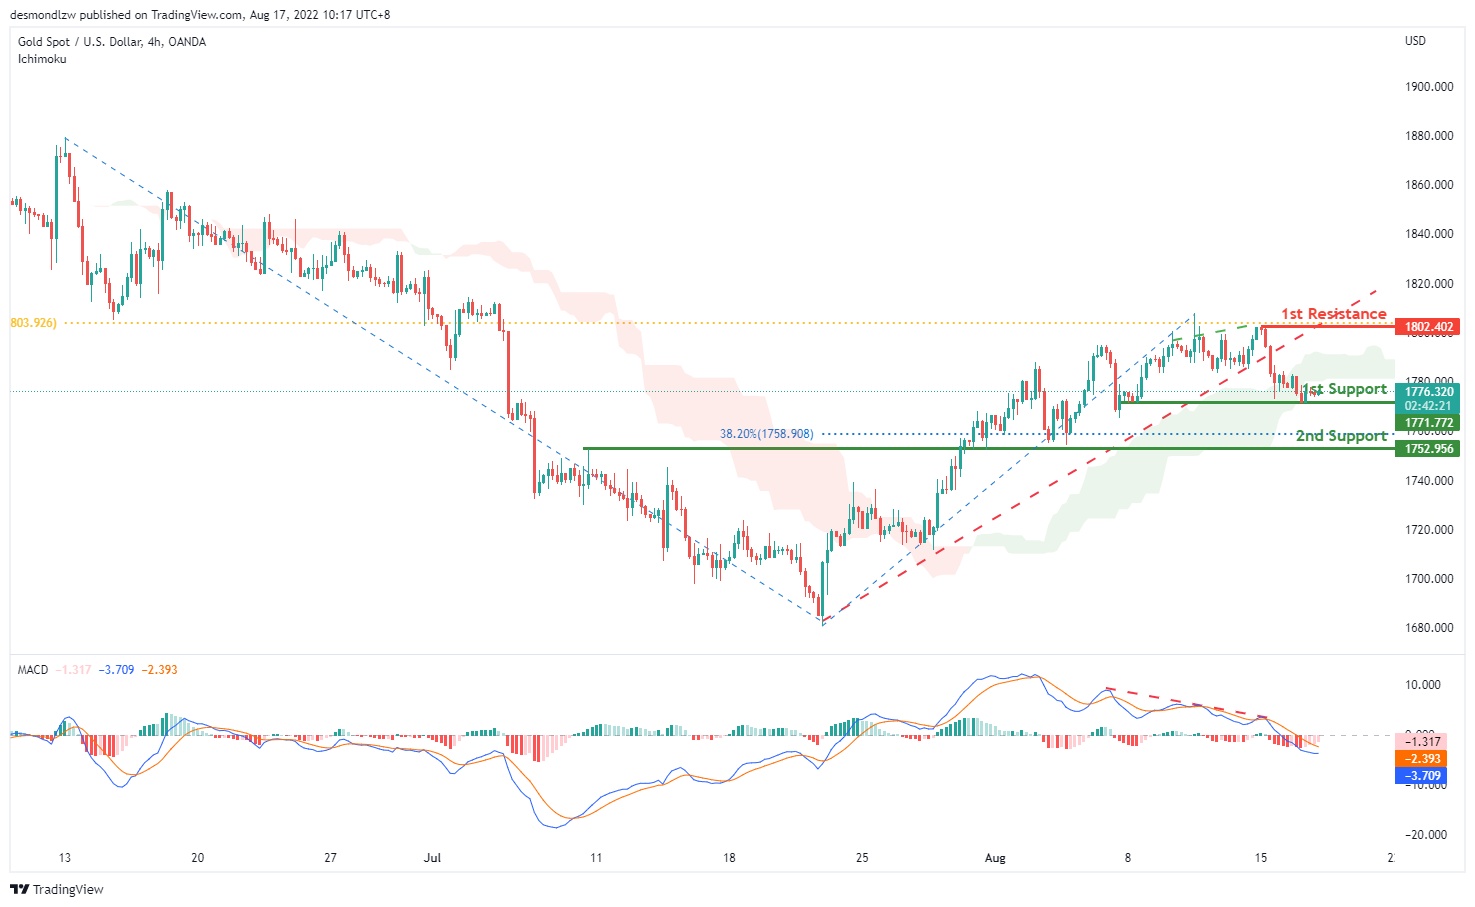
On the H4, with prices breaking the ascending channel and there is a bearish divergence of price and MACD, we have a bearish bias that the price may drop from the 1st support at 1771.772, which is in line with the pullback support to the 2nd support at 1752.956, which is in line with the pullback support and 38.2% fibonacci retracement. Alternatively, the price may rise to the 1st resistance at 1802.402, which is in line with the 61.8% fibonacci retracement and swing high.
Areas of consideration:
- H4 time frame, 1st support at 1771.772
- H4 time frame, 2nd support at 1752.956
AUD/USD:
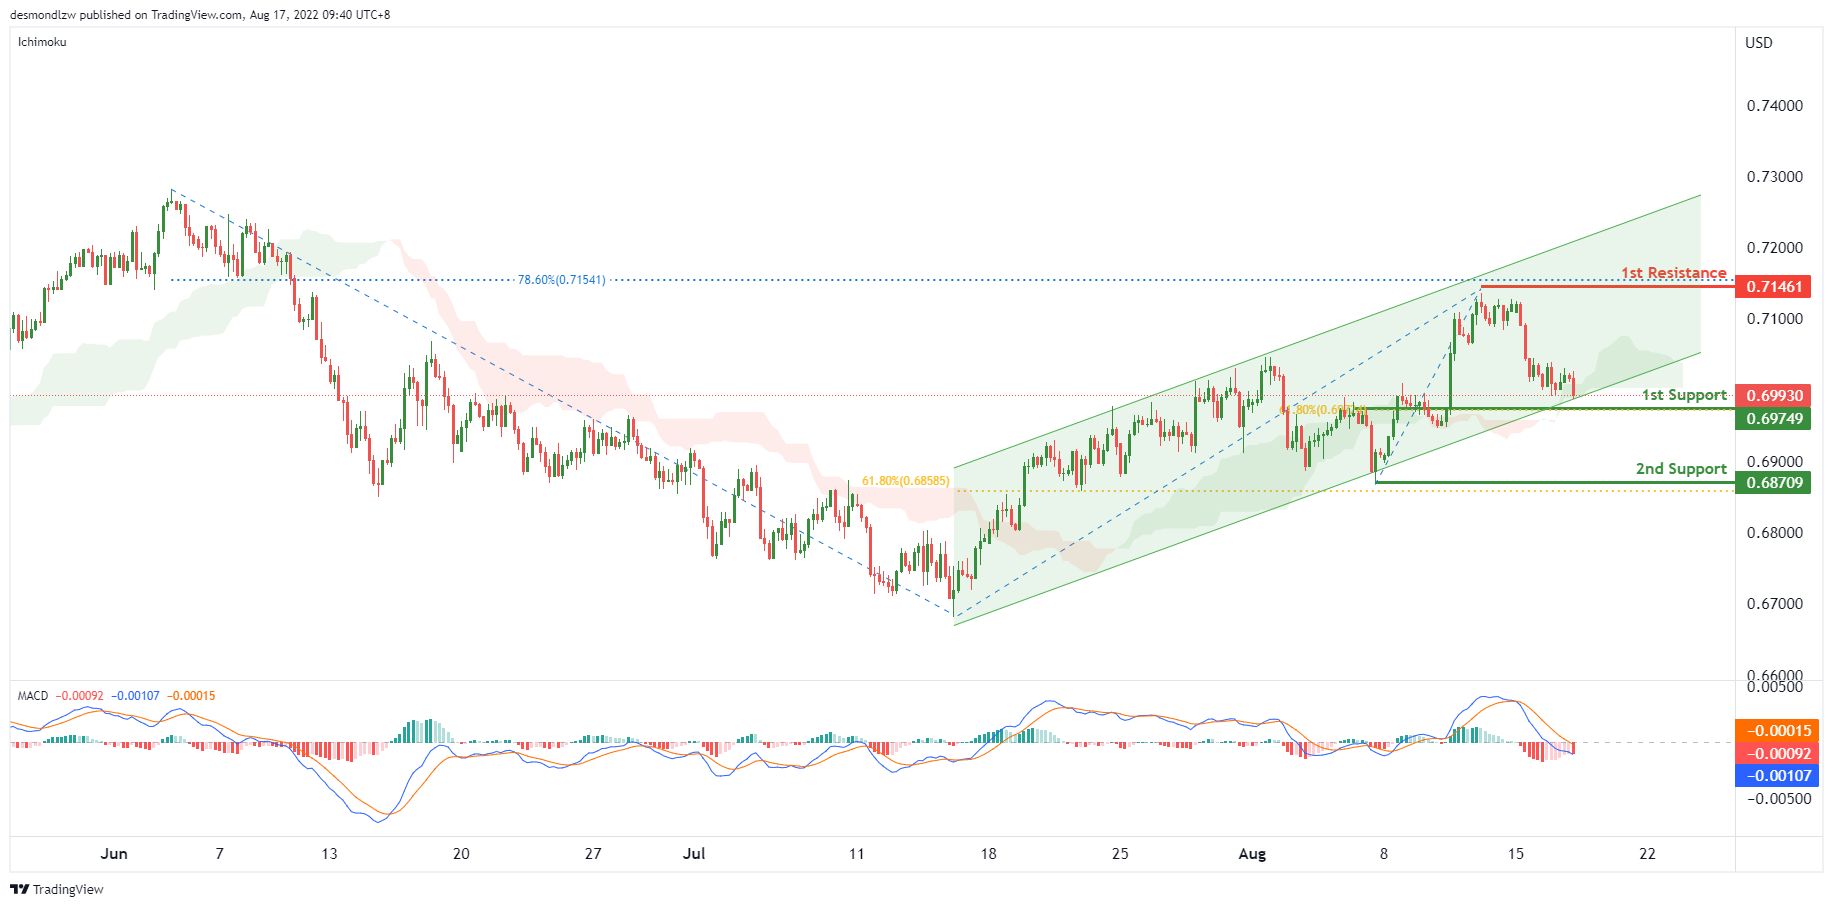
On the H4, with the MACD indicators are under zero, the price almost breaking the ascending channel and crossing below the ichimoku cloud, we have a bearish bias that price may drop from the 1st support at 0.69749, where the 61.80% fibonacci retracement and pullback resistance are to the 2nd support at 0.68709, which is in line with the swing low and 61.8% fibonacci retracement. Alternatively, the price may stay in the ascending channel and rise to the 1st resistance at 0.71461 which is in line with 78.6% fibonacci retracement and swing high.
Areas of consideration
- H4 1st support at 0.69749
- H4 2nd support at 0.68709
NZD/USD:
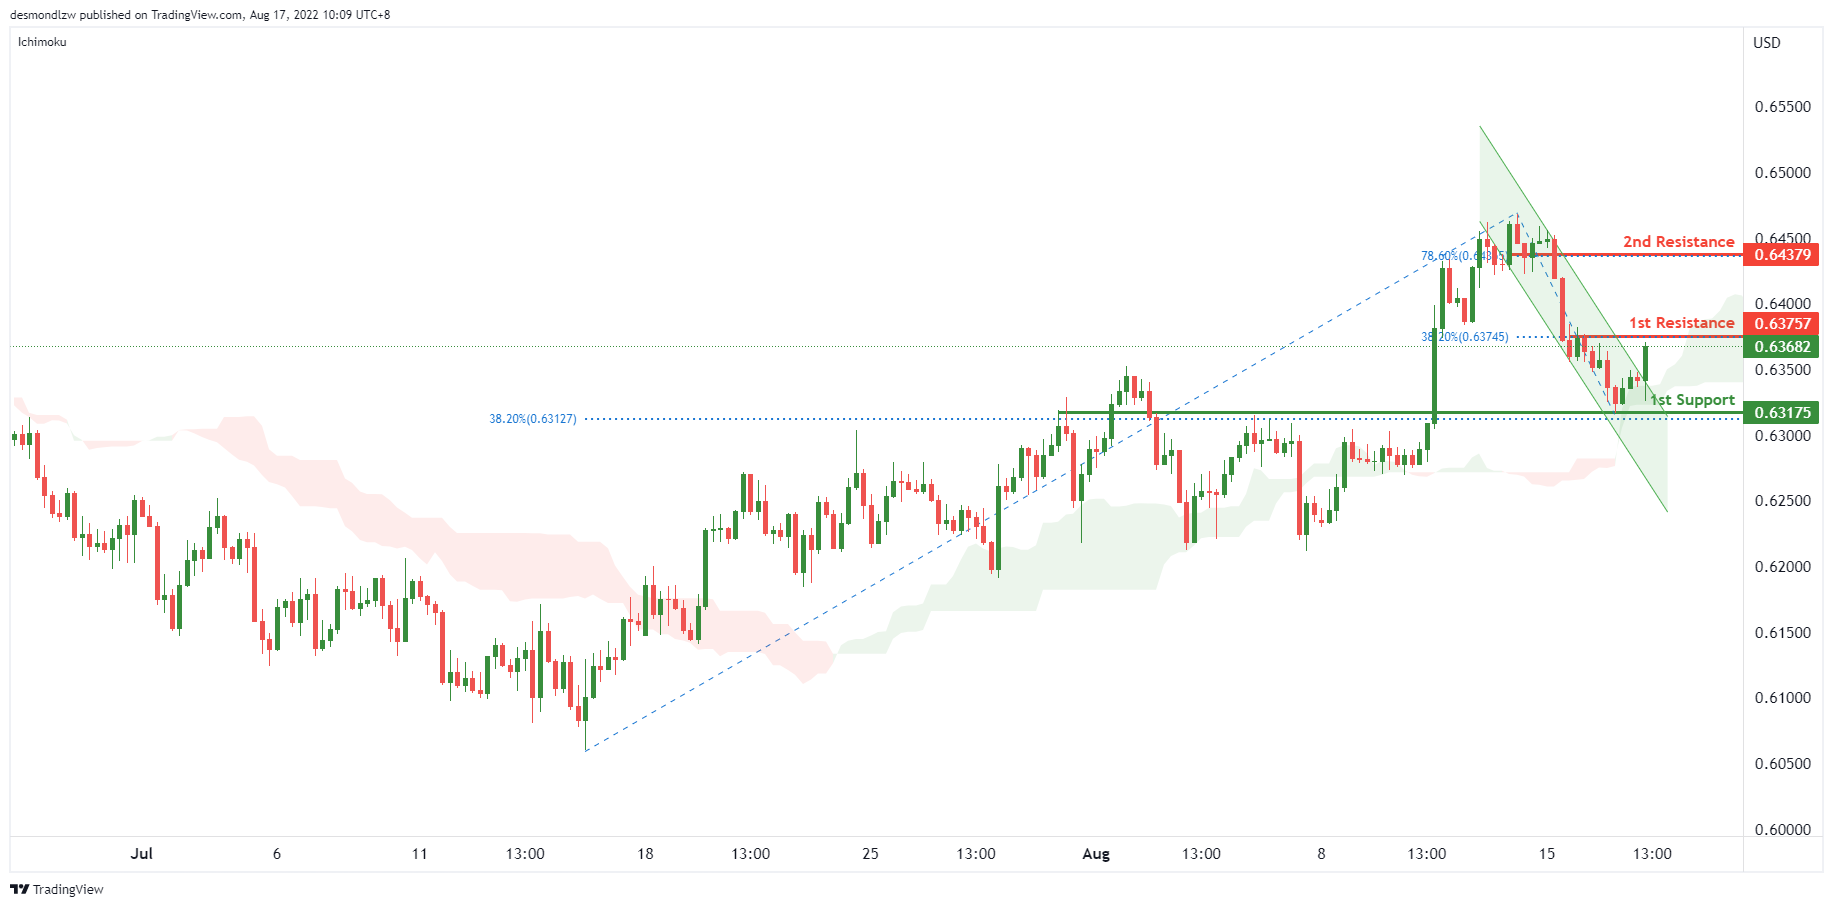
On the H4, with the price breaking the descending channel and above ichimoku cloud, we have a bullish bias that the price may rise from the 1st resistance at 0.63757, which is in line with the 38.2% fibonacci retracement to the 2nd resistance at 0.64379, which is in line with the 78.6% fibonacci retracement. Alternatively, the price may drop to the 1st support at 0.63175, where the 38.2% fibonacci retracement and pullback support is.
Areas of consideration:
- H4 time frame, 1st resistance at 0.63757
- H4 time frame, 2nd resistance at 0.64379
USD/CAD:
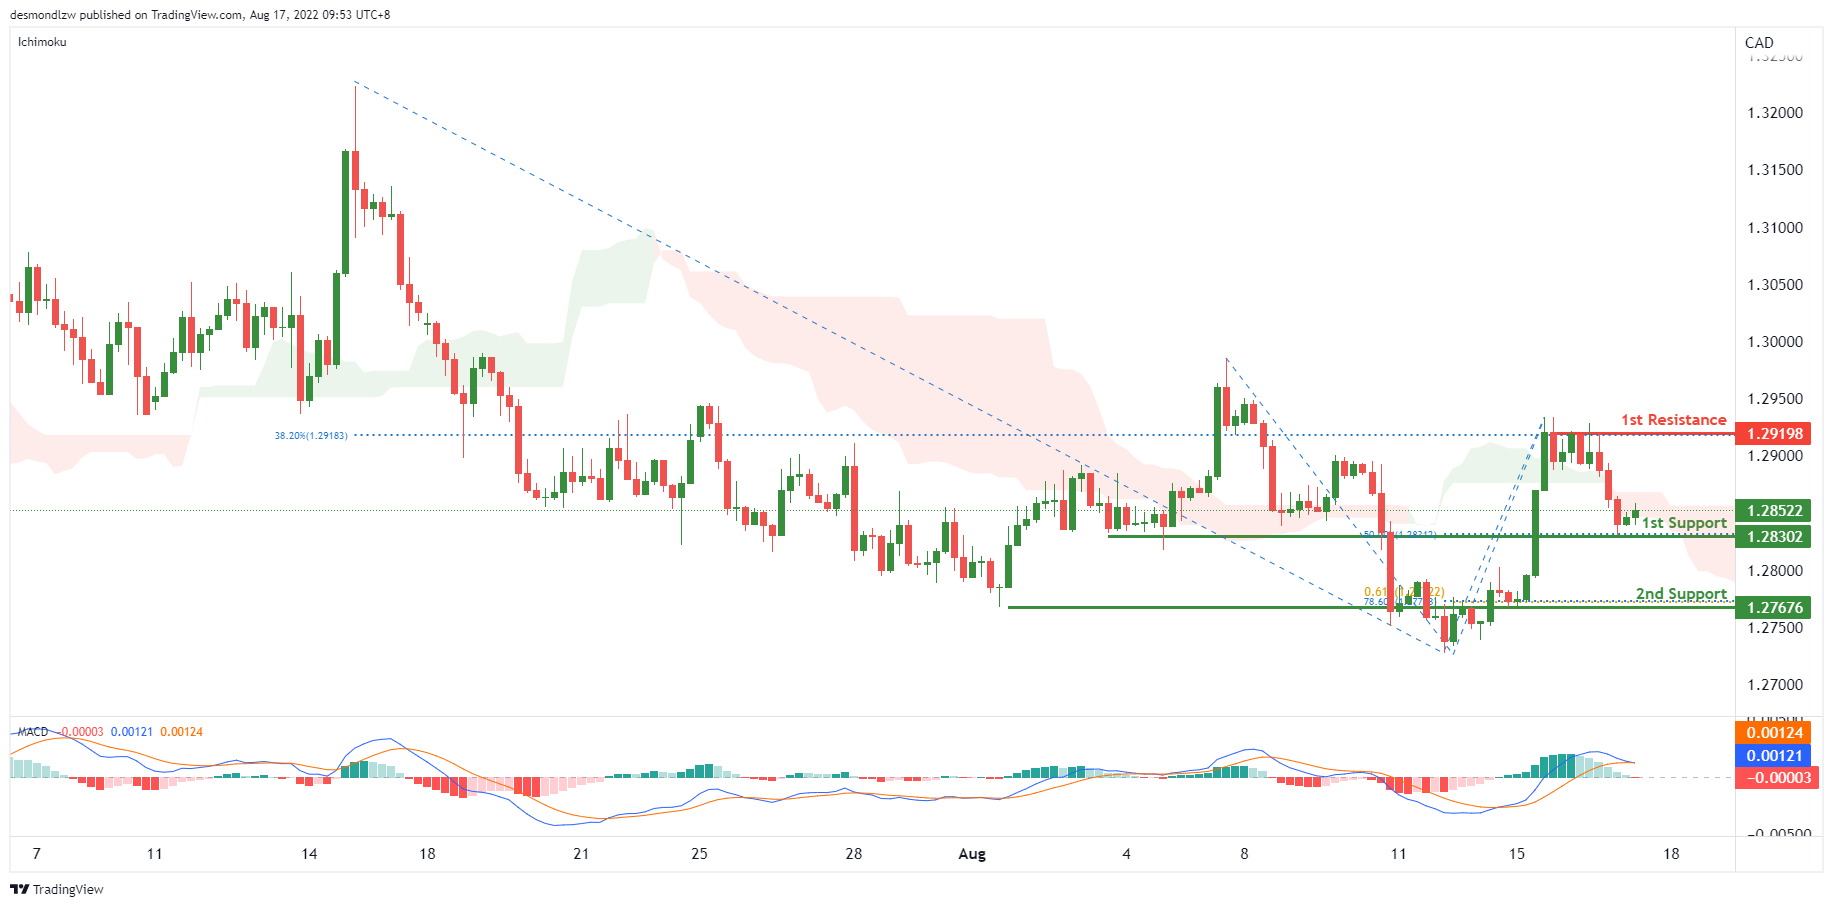
On the H4, with DIF is crossing below the signal line and the price is crossing over the ichimoku cloud, we have a bearish bias that the price may drop from the 1st support at 1.28302, which is in line with the 50% fibonacci retracement to the 2nd support at 1.27676, which is in line with the swing low, 78.6% fibonacci retracement and 61.8% fibonacci projection. Alternatively, the price may rise to the 1st resistance at 1.29198, which is in line with the 38.2% fibonacci retracement and swing high.
Areas of consideration:
- H4 time frame, 1st support at 1.28302
- H4 time frame, 2nd support at 1.27676
OIL:
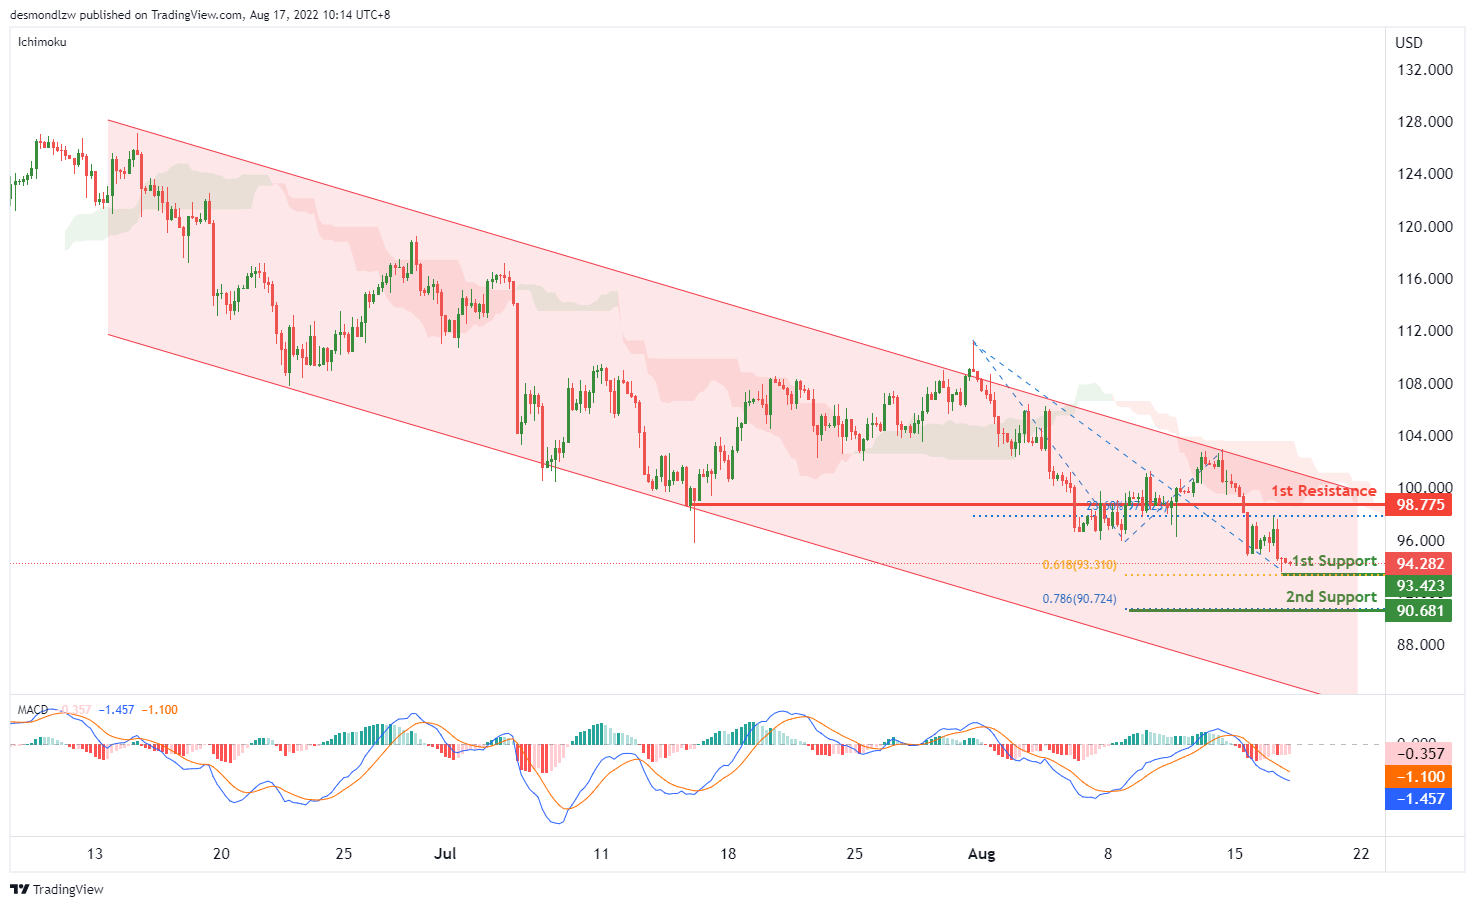
On the H4, with price moving within the descending channel, below ichimoku cloud and the MACD indicators are under zero, we have a bearish bias that the price may drop from our 1st support at 93.423, which is in line with the swing low and 61.8% fibonacci projection to the 2nd support at 90.681, which is in line with the 78.6% fibonacci projection. Otherwise, the price may rise to our 1st resistance at 98.775, which is in line with the overlap resistance and 23.6% fibonacci retracement.
Areas of consideration:
- H4 time frame, 1st support at 93.423
- H4 time frame, 2nd support at 90.681
Dow Jones Industrial Average:
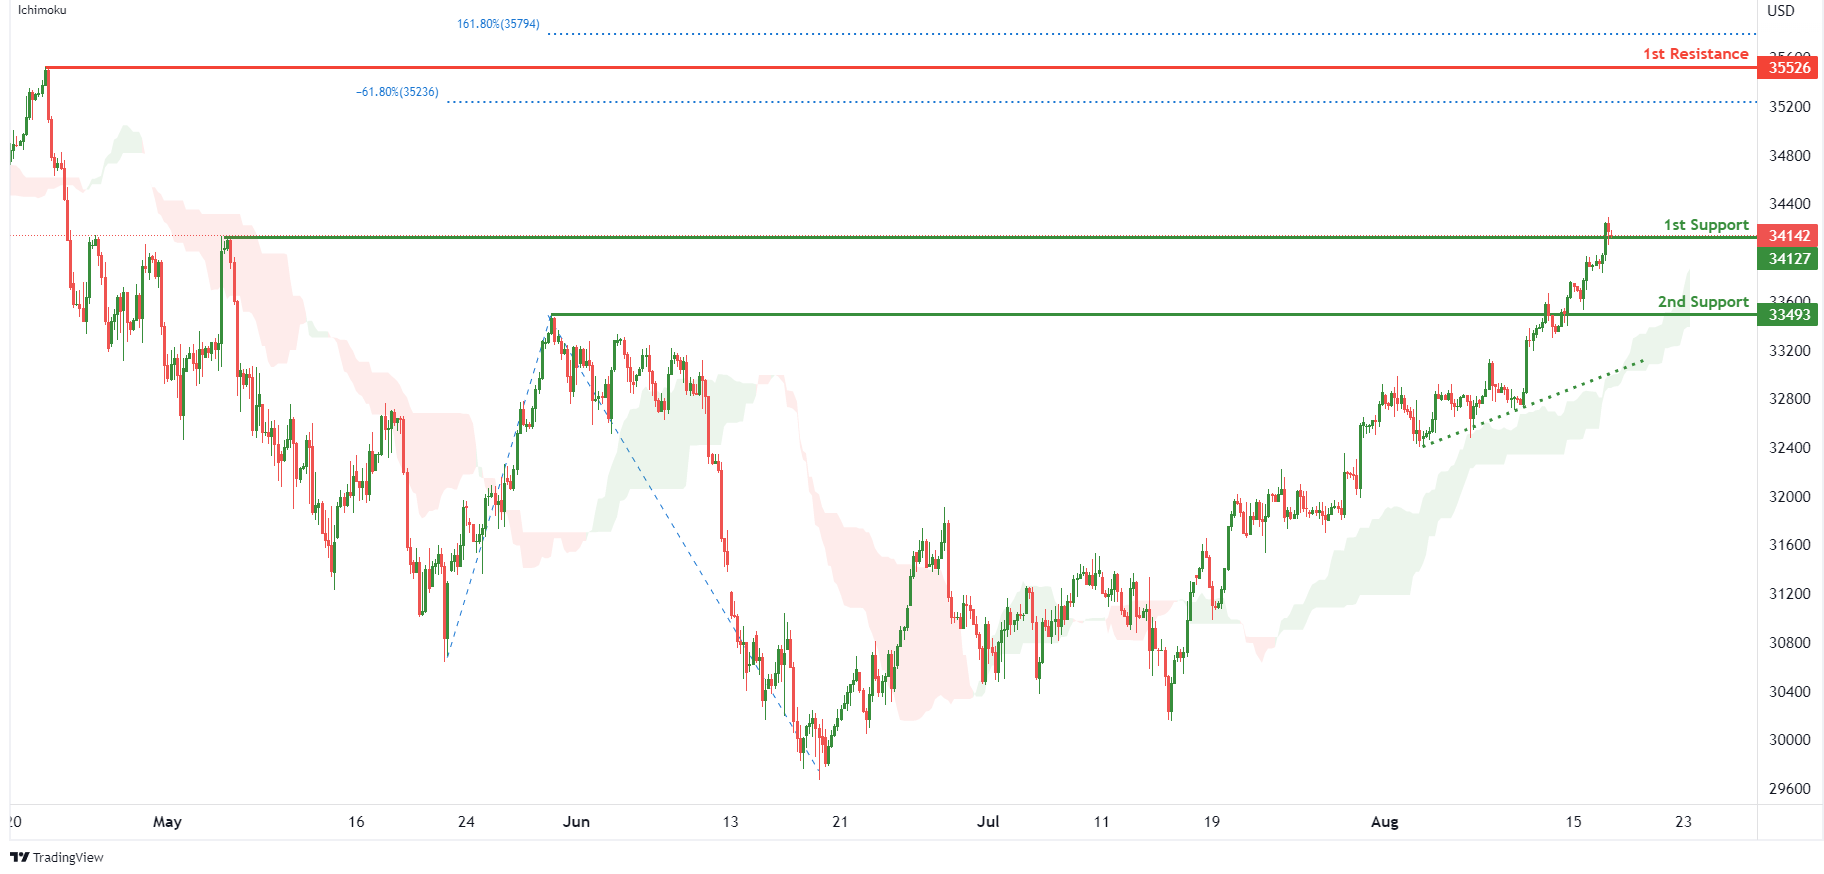
On the H4, with price moving above the ichimoku indicator and along an ascending trendline, we have a bullish bias that price will rise from our 1st support at 34127 where the pullback support is to the 1st resistance at 35526 where the swing high resistance, 161.8% fibonacci extension and -61.8% fibonacci expansion are. Alternatively, price could break 1st support and drop to 2nd support at 33493 where the pullback support is.
Areas of consideration:
- H4 time frame, 1st resistance of 35526
- H4 time frame, 1st support at 34127
DAX:
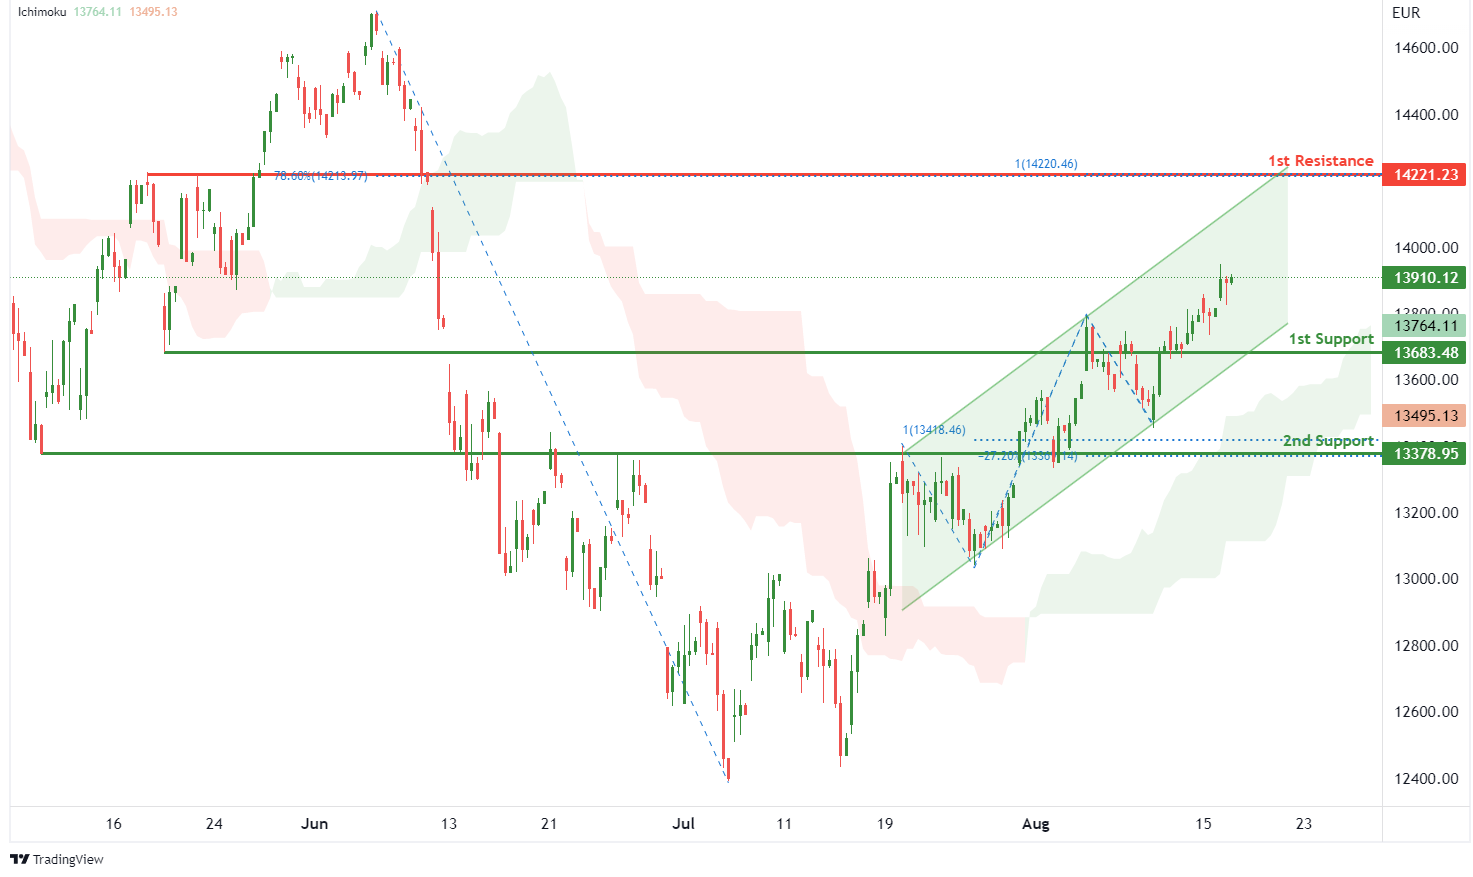
On the H4, with price moving above the ichimoku indicator and within the ascending channel, we have a bullish bias that price will rise from 1st support at 13683.48 where the pullback support is to the 1st resistance at 14221.23 in line with 100% fibonacci projection and 78.6% fibonacci retracement. Alternatively, price could break 1st support and drop to 2nd support at 13378.95 where the overlap support, -27.2% fibonacci expansion and 100% fibonacci projection are.
Areas of consideration:
- H4 time frame, 1st resistance of 14221.23
- H4 time frame, 1st support at 13683.48
ETHUSD:
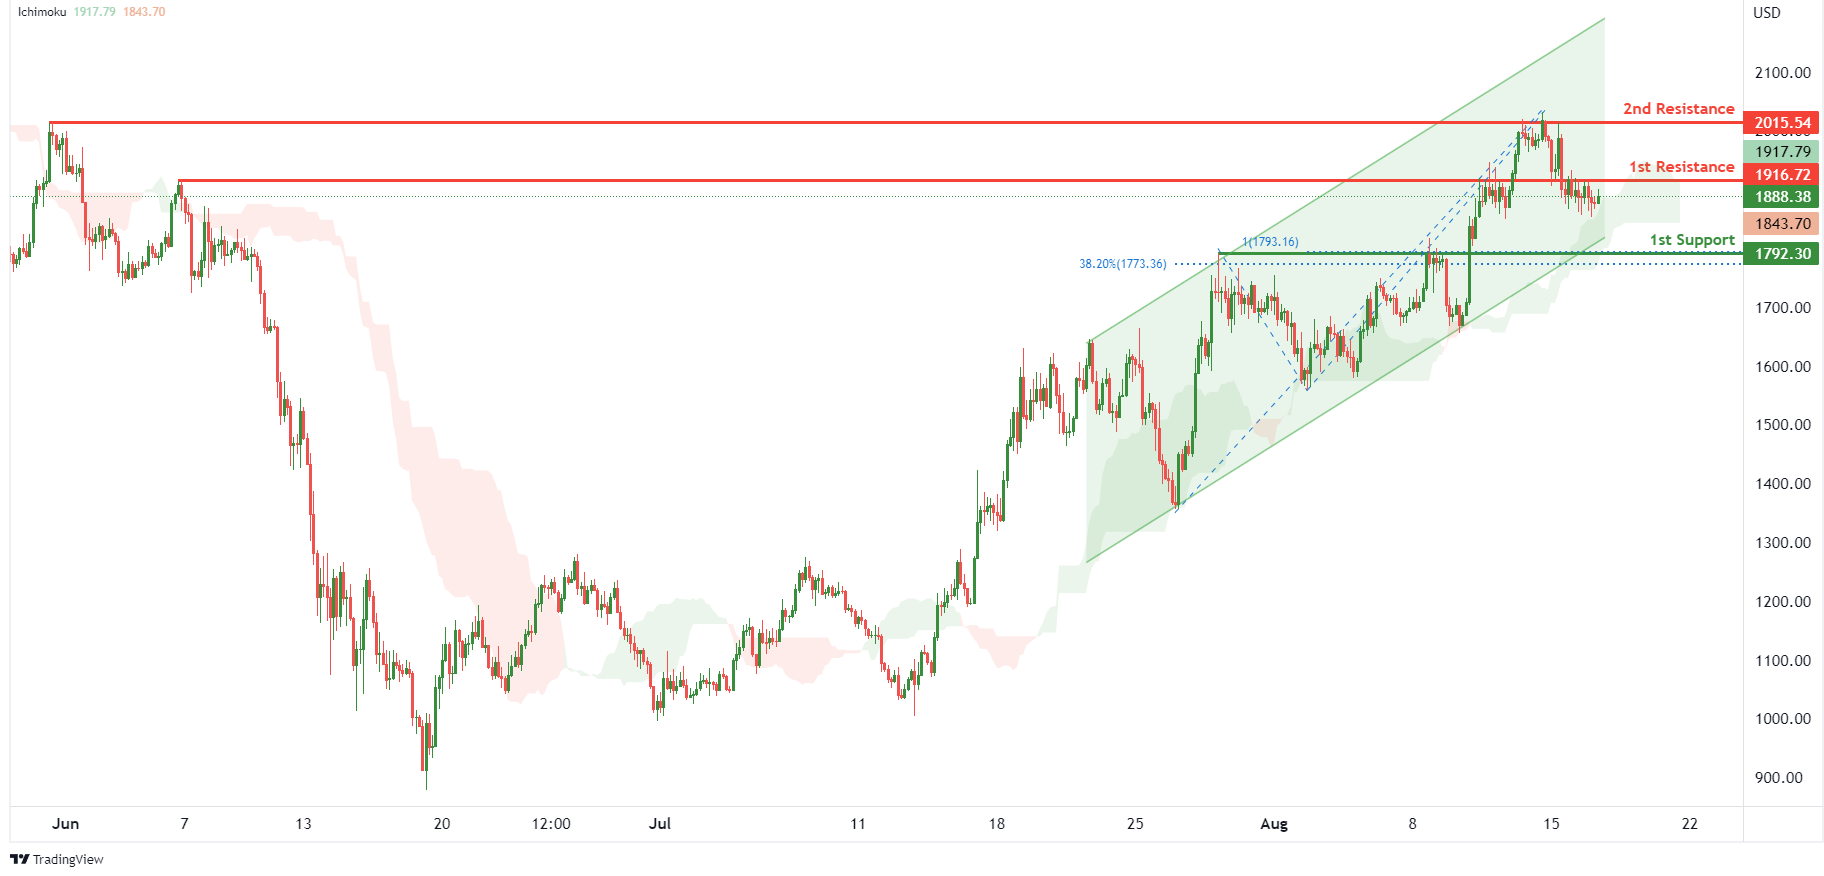
On the H4, with price moving within an ascending channel and bouncing off the ichimoku indicator, we have a bullish bias that price will rise to the 1st resistance at 1916.72 where the pullback support is. Once there is upside confirmation that price has broken 1st resistance structure, we would expect bullish momentum to carry price to 2nd resistance at 2015.54 where the swing high resistance is. Alternatively, price could drop to 1st support at 1792.30 where the overlap support, 38.2% fibonacci retracement and 100% fibonacci projection are.
Areas of consideration:
- H4 time frame, 1st resistance of 1916.72
- H4 time frame, 1st support at 1792.30
BTCUSD:
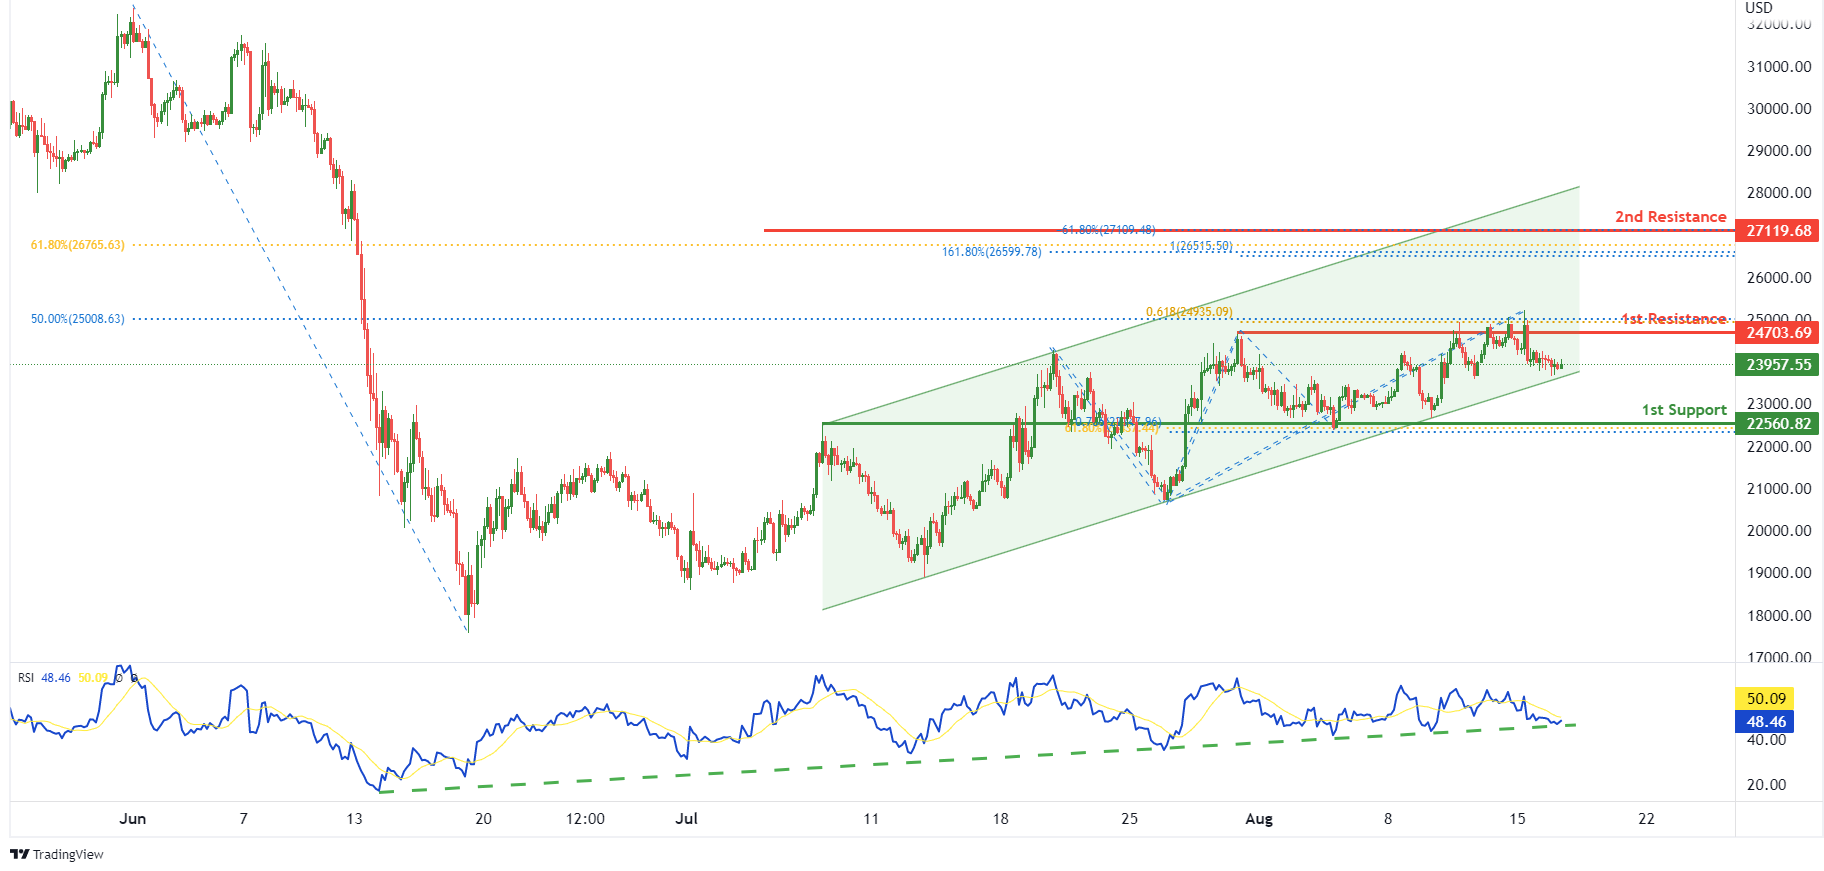
On the H4, with price moving within a bullish channel and RSI moving along an ascending trendline, we have a bullish bias that price will rise to our 1st resistance at 24703.69 where the pullback resistance, 50% fibonacci retracement and 61.8% fibonacci projection are. Once there is upside confirmation that price has broken 1st resistance structure, we would expect bullish momentum to carry price to 2nd resistance at 27119.68 where the 61.8% fibonacci retracement, -61.8% fibonacci expansion, 161.8% fibonacci extension and 100% fibonacci projection are. Alternatively, price could drop to 1st support at 22560.82 where the pullback support, 61.8% fibonacci retracement and 78.6% fibonacci projection are.
Areas of consideration:
- H4 time frame, 1st resistance of 24703.69
- H4 time frame, 1st support at 22560.82
S&P 500:
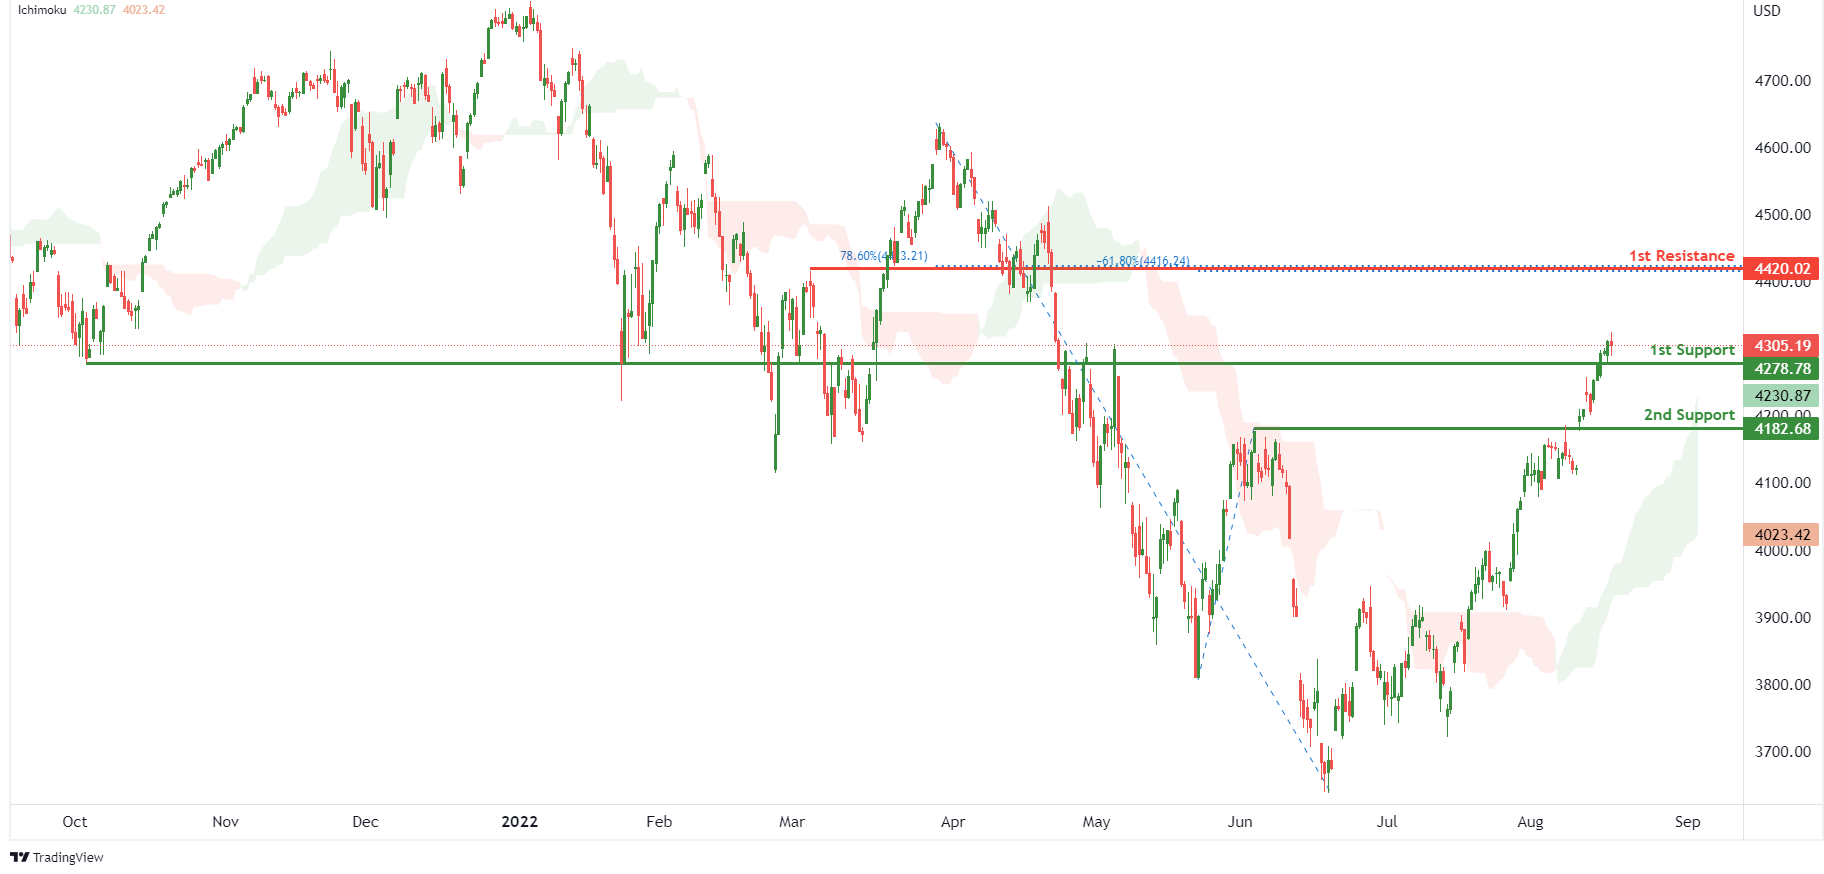
On the H4, with prices moving above the ichimoku indicator, we have a bullish bias that price will rise from 1st support at 4278.78 where the overlap support is to the 1st resistance at 4420.02 where the pullback resistance, 78.6% fibonacci retracement and -61.8% fibonacci expansion are. Alternatively, price could break 1st support structure and drop to 2nd support at 4182.68 where the pullback support is.
Areas of consideration:
- H4 time frame, 1st resistance of 4420.02
- H4 time frame, 1st support at 4278.78
Gold Price Corrects Lower Ahead of FOMC Minutes
Key Highlights
- Gold price started a downside correction from the $1,800 resistance zone.
- It traded below a key bullish trend line with support at $1,792 on the 4-hours chart.
- EUR/USD extended losses below 1.0200 before the bulls appeared.
- GBP/USD tested the key 1.2000 support zone.
Gold Price Technical Analysis
Gold price gained pace above the $1,750 resistance zone against the US Dollar. The price was able to surpass the $1,760 and $1,780 resistance levels.
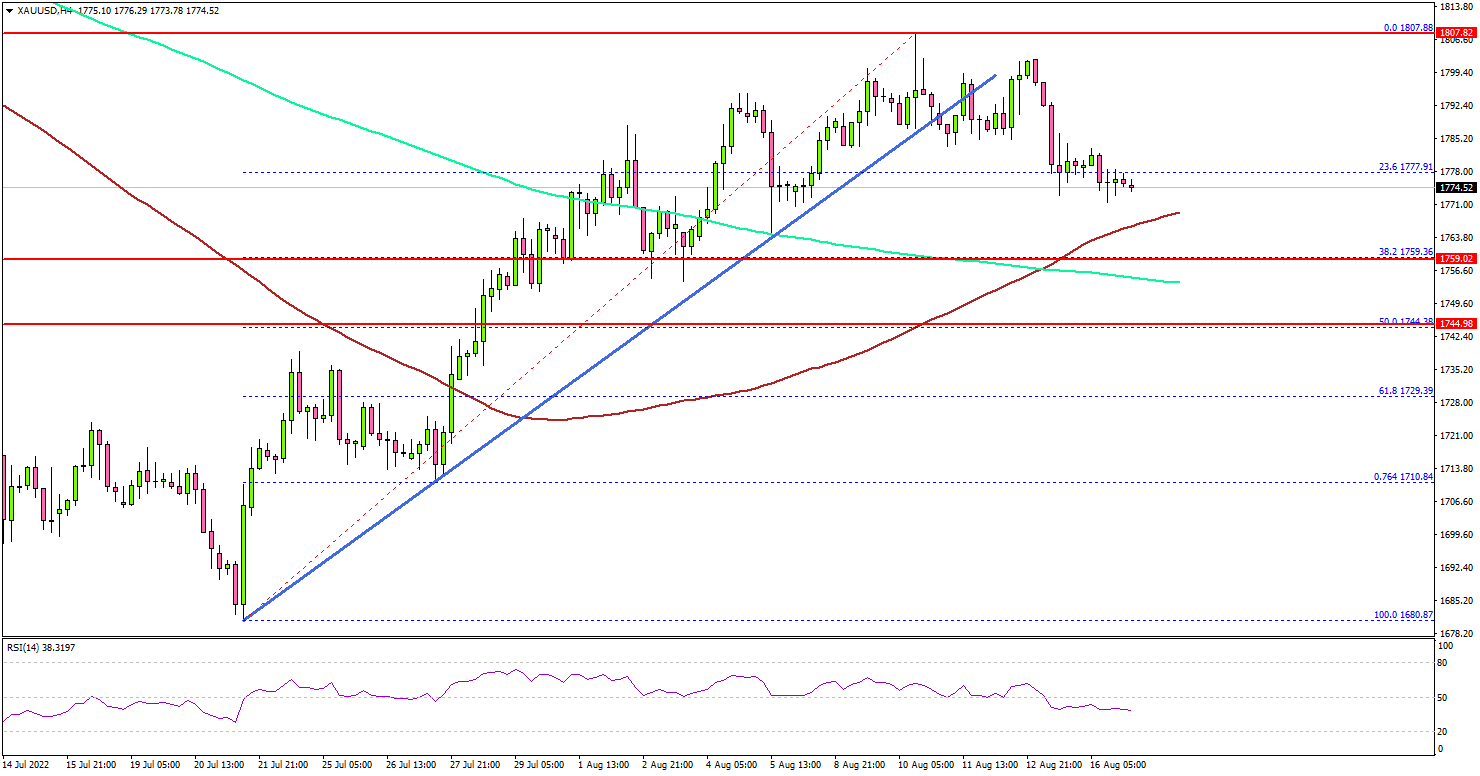
The 4-hours chart of XAU/USD indicates that the price even broke the $1,800 level. However, there were limited upsides above $1,800. The price traded as high as $1,807 before there was a downside correction.
There was a move below the $1,800 and $1,795 levels. The price traded below the 23.6% Fib retracement level of the upward move from the $1,680 swing low to $1,807 high.
Besides, it traded below a key bullish trend line with support at $1,792 on the same chart. On the downside, an initial support is near the $1,768 level and the 100 simple moving average (red, 4-hours).
The next major support is near the $1,755 level or the 200 simple moving average (green, 4-hours), below which the price could accelerate lower. In the stated case, the price may perhaps decline towards the $1,745 level.
On the upside, the price might face sellers near the $1,790 level. The next major resistance is near the $1,800 level. Any more gains might send the price towards the $1,825 level.
Looking at EUR/USD, the pair extended losses below the 1.0200 level and tested the 1.0120 support, where the bulls emerged.
Economic Releases to Watch Today
- UK Consumer Price Index for July 2022 (YoY) – Forecast +9.8%, versus +9.4% previous.
- UK Core Consumer Price Index for July 2022 (YoY) – Forecast +5.9%, versus +5.8% previous.
- Euro Zone Gross Domestic Product Q2 2022 (Preliminary) (QoQ) - Forecast 0.7%, versus 0.7% previous.
- FOMC Meeting Minutes.
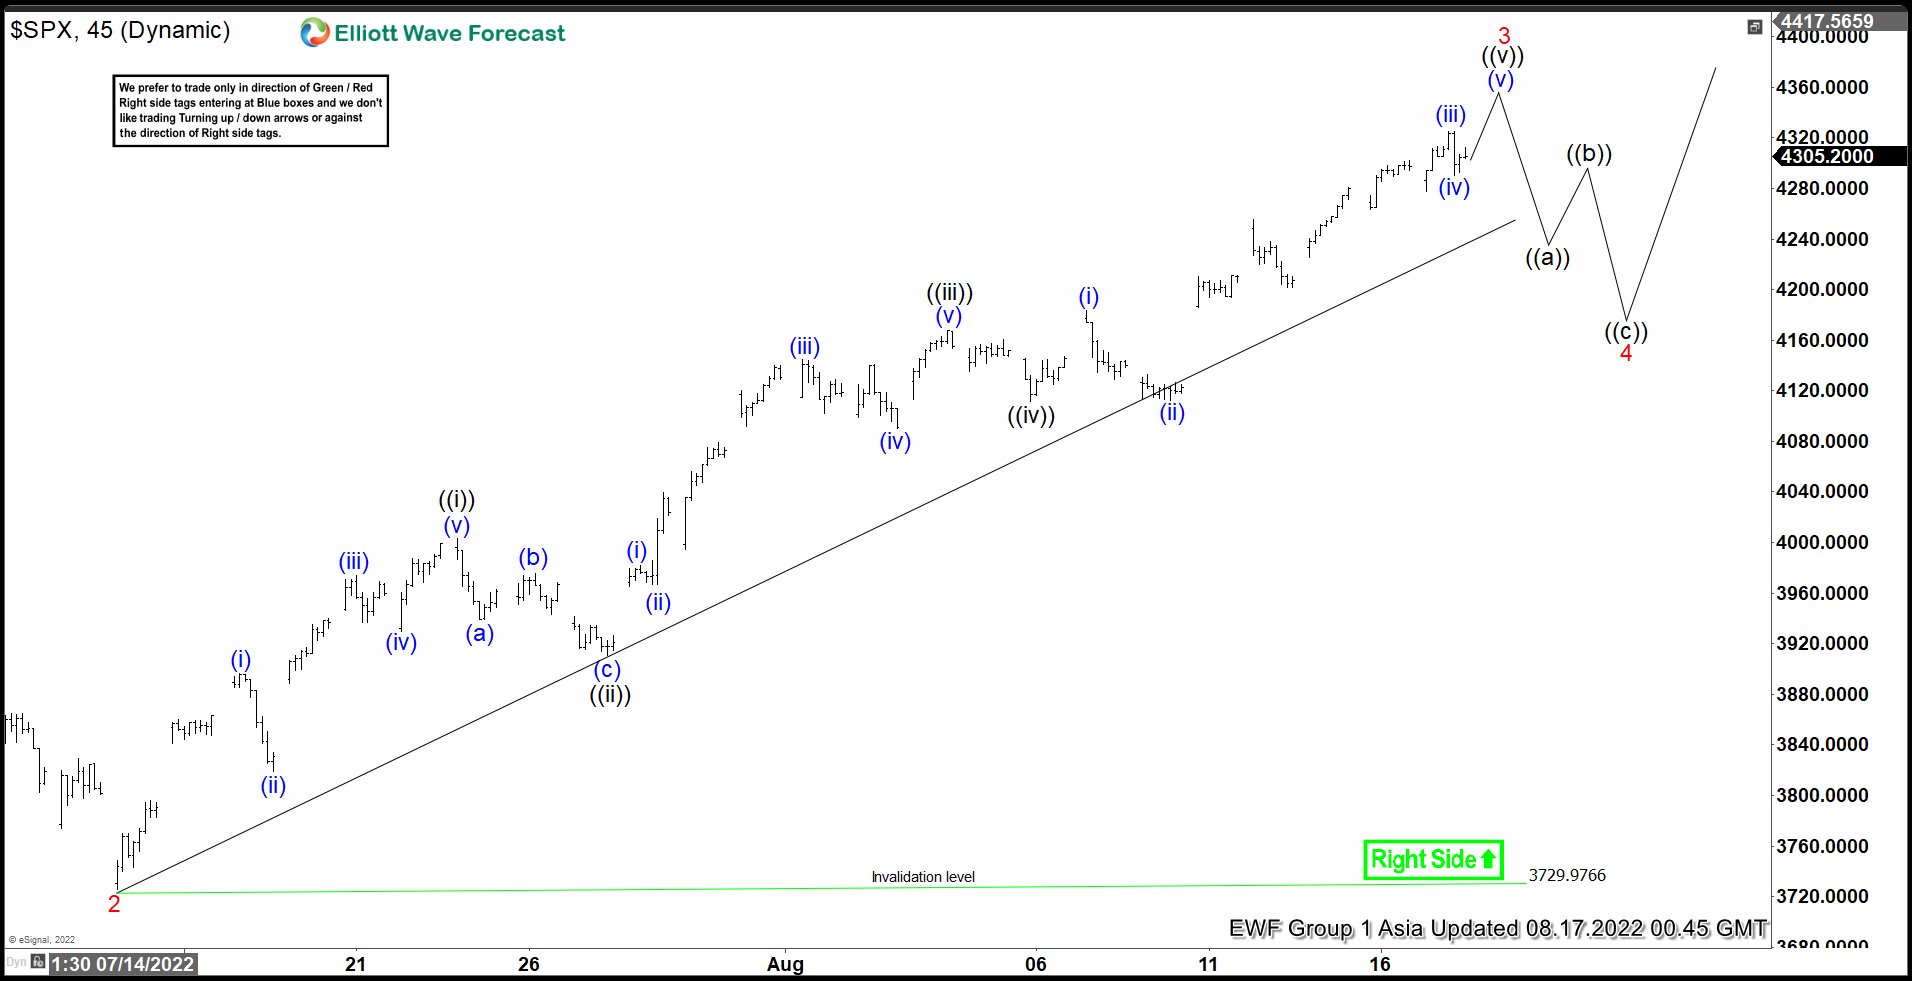
Elliott Wave View: $SPX (S&P 500) 5 Waves Rally Looks Incomplete
Short Term Elliott Wave View in S&P 500 (SPX) suggests the rally from 6.17.2022 low is unfolding as a 5 waves impulse Elliott Wave structure. Up from 6.17.2022 low, wave 1 ended at 3925.75 and pullback in wave 2 ended at 3729.97. Up from there, wave 3 is in progress as another 5 waves in lesser degree. Up from wave 2, wave ((i)) ended at 4002.86 and dips in wave ((ii)) ended at 3910.74.
The Index extended higher in wave ((iii)) towards 4167.66, and pullback in wave ((iv)) ended at 4111.49. Wave ((v)) is in progress and expected to end soon with 1 more marginal high. This should also complete wave 3 in higher degree. Index should then pullback in wave 4 to correct rally from wave 2 low on July 14. Wave 4 pullback ideally ends around 23.6 – 38.2% Fibonacci retracement of wave 3, and not more than 50% retracement. Afterwards, Index should extend higher 1 more time in wave 5 to complete the impulsive structure from 6.17.2022 low. Near term, as far as pivot at 3729.97 low remains intact, expect dips to find support in 3, 7, 11 swing for further upside.
SPX 45 Minutes Elliott Wave Chart