

Sample Category Title
USD/CHF Daily Outlook
Daily Pivots: (S1) 0.9461; (P) 0.9488; (R1) 0.9522; More...
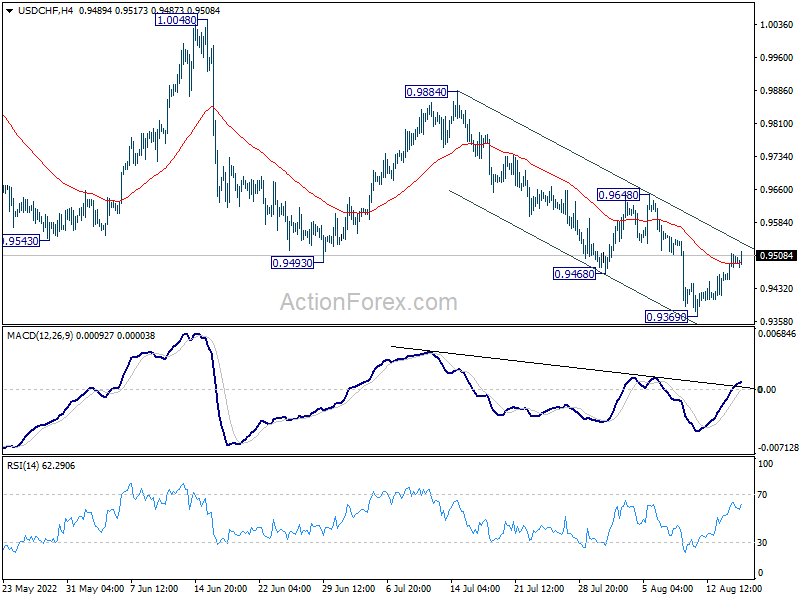
USD/CHF's recovery from 0.9369 is still in progress and intraday bias stays neutral. Upside should be limited well below 0.9648 resistance to bring another fall. On the downside, break of 0.9369 will resume larger decline from 1.0063 towards 0.9149 support next. However, firm break of 0.9648 will turn bias back to the upside for 0.9884 resistance instead.
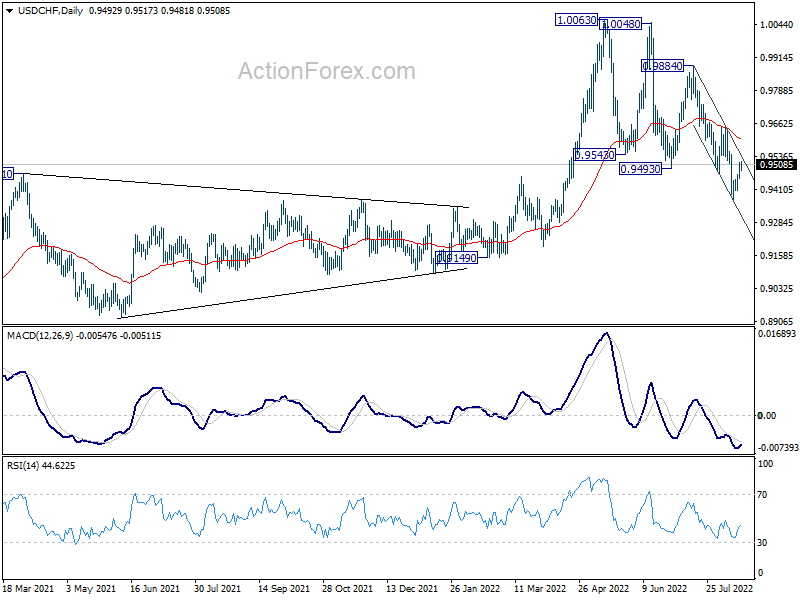
In the bigger picture, break of 0.9471 support turned resistance argues that medium term up trend from 0.8756 has completed with three waves up to 1.0063. Long term sideway pattern might have started another falling leg. Deeper decline would now be in favor as long as 0.9648 resistance holds, to 0.9149 structural support. Sustained break there could pave the way back to 0.8756.
EUR/USD Daily Outlook
Daily Pivots: (S1) 1.0131; (P) 1.0163; (R1) 1.0203; More...
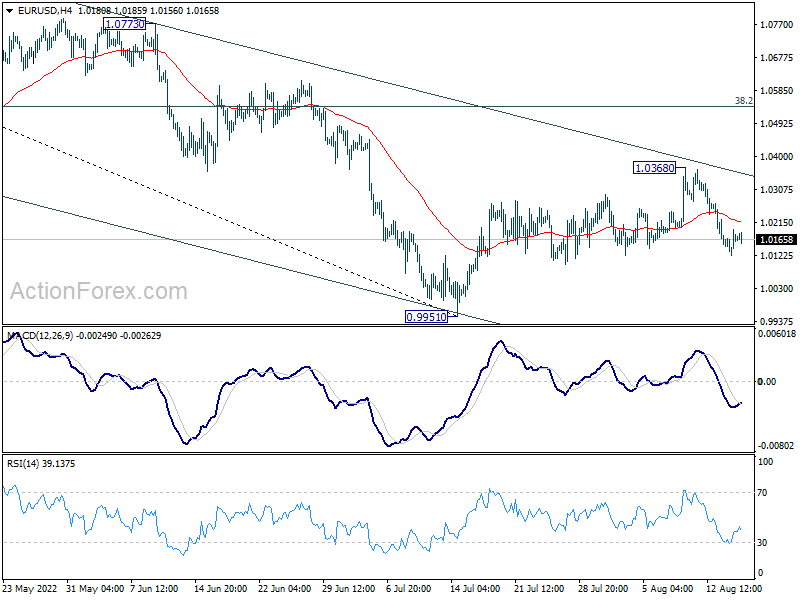
EUR/USD recovers mildly today, but intraday bias stays on the downside at this point. Rebound from 0.9951 should have completed at 1.0368 after rejection by 55 day EMA, as well as falling channel resistance. Deeper fall would be seen to retest 0.9951 low. Firm break there will resume larger down trend. For now, risk will stay on the downside as long as 1.0368 resistance holds, in case of recovery.
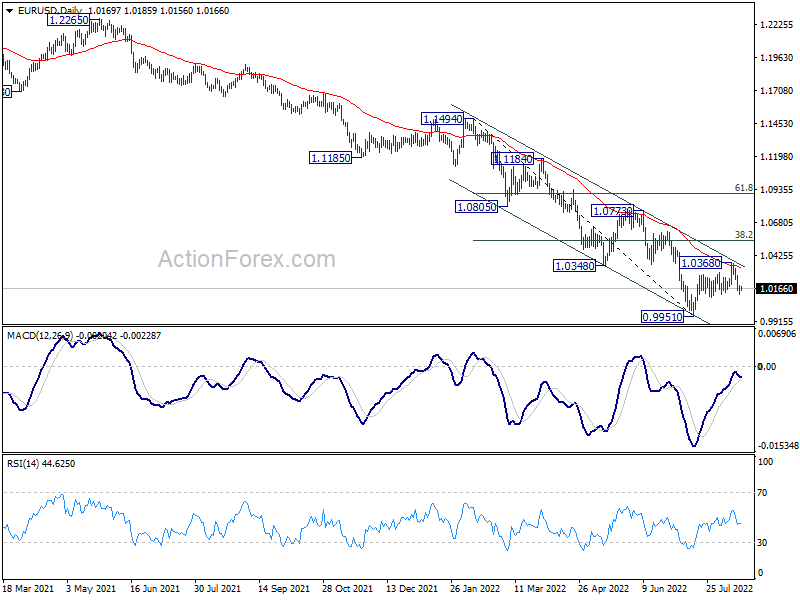
In the bigger picture, down trend from 1.6039 (2008 high) is still in progress. Next target is 100% projection of 1.3993 to 1.0339 from 1.2348 at 0.8694. In any case, outlook will stay bearish as long as 1.0773 resistance holds, in case of strong rebound.
GBPUSD Returns above 1.2100; Bullish Cross Within SMAs Remains Intact
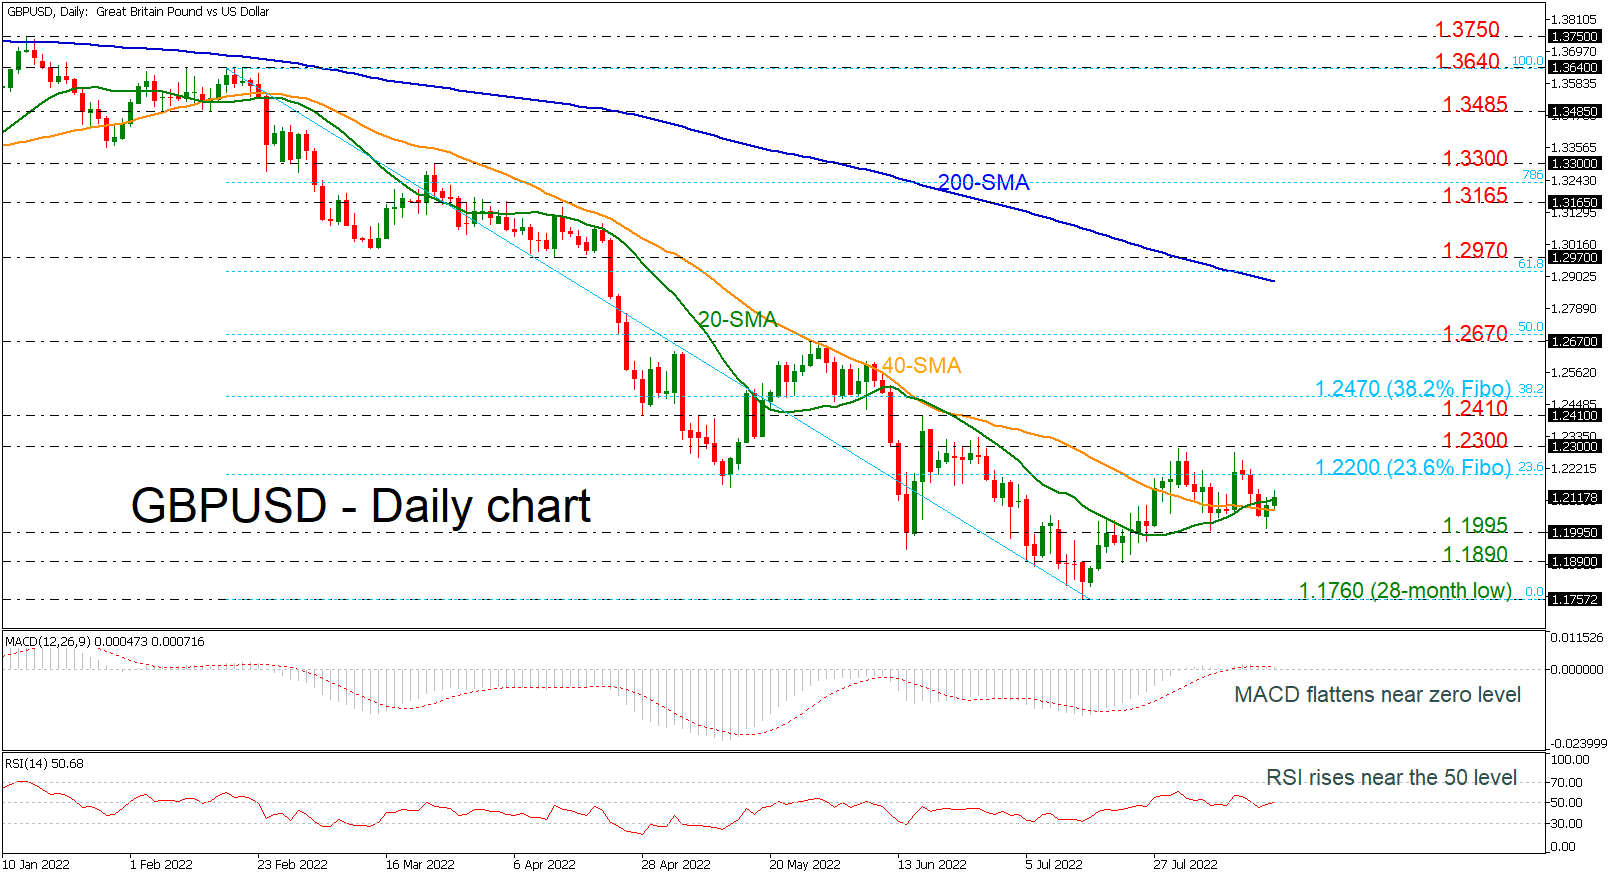
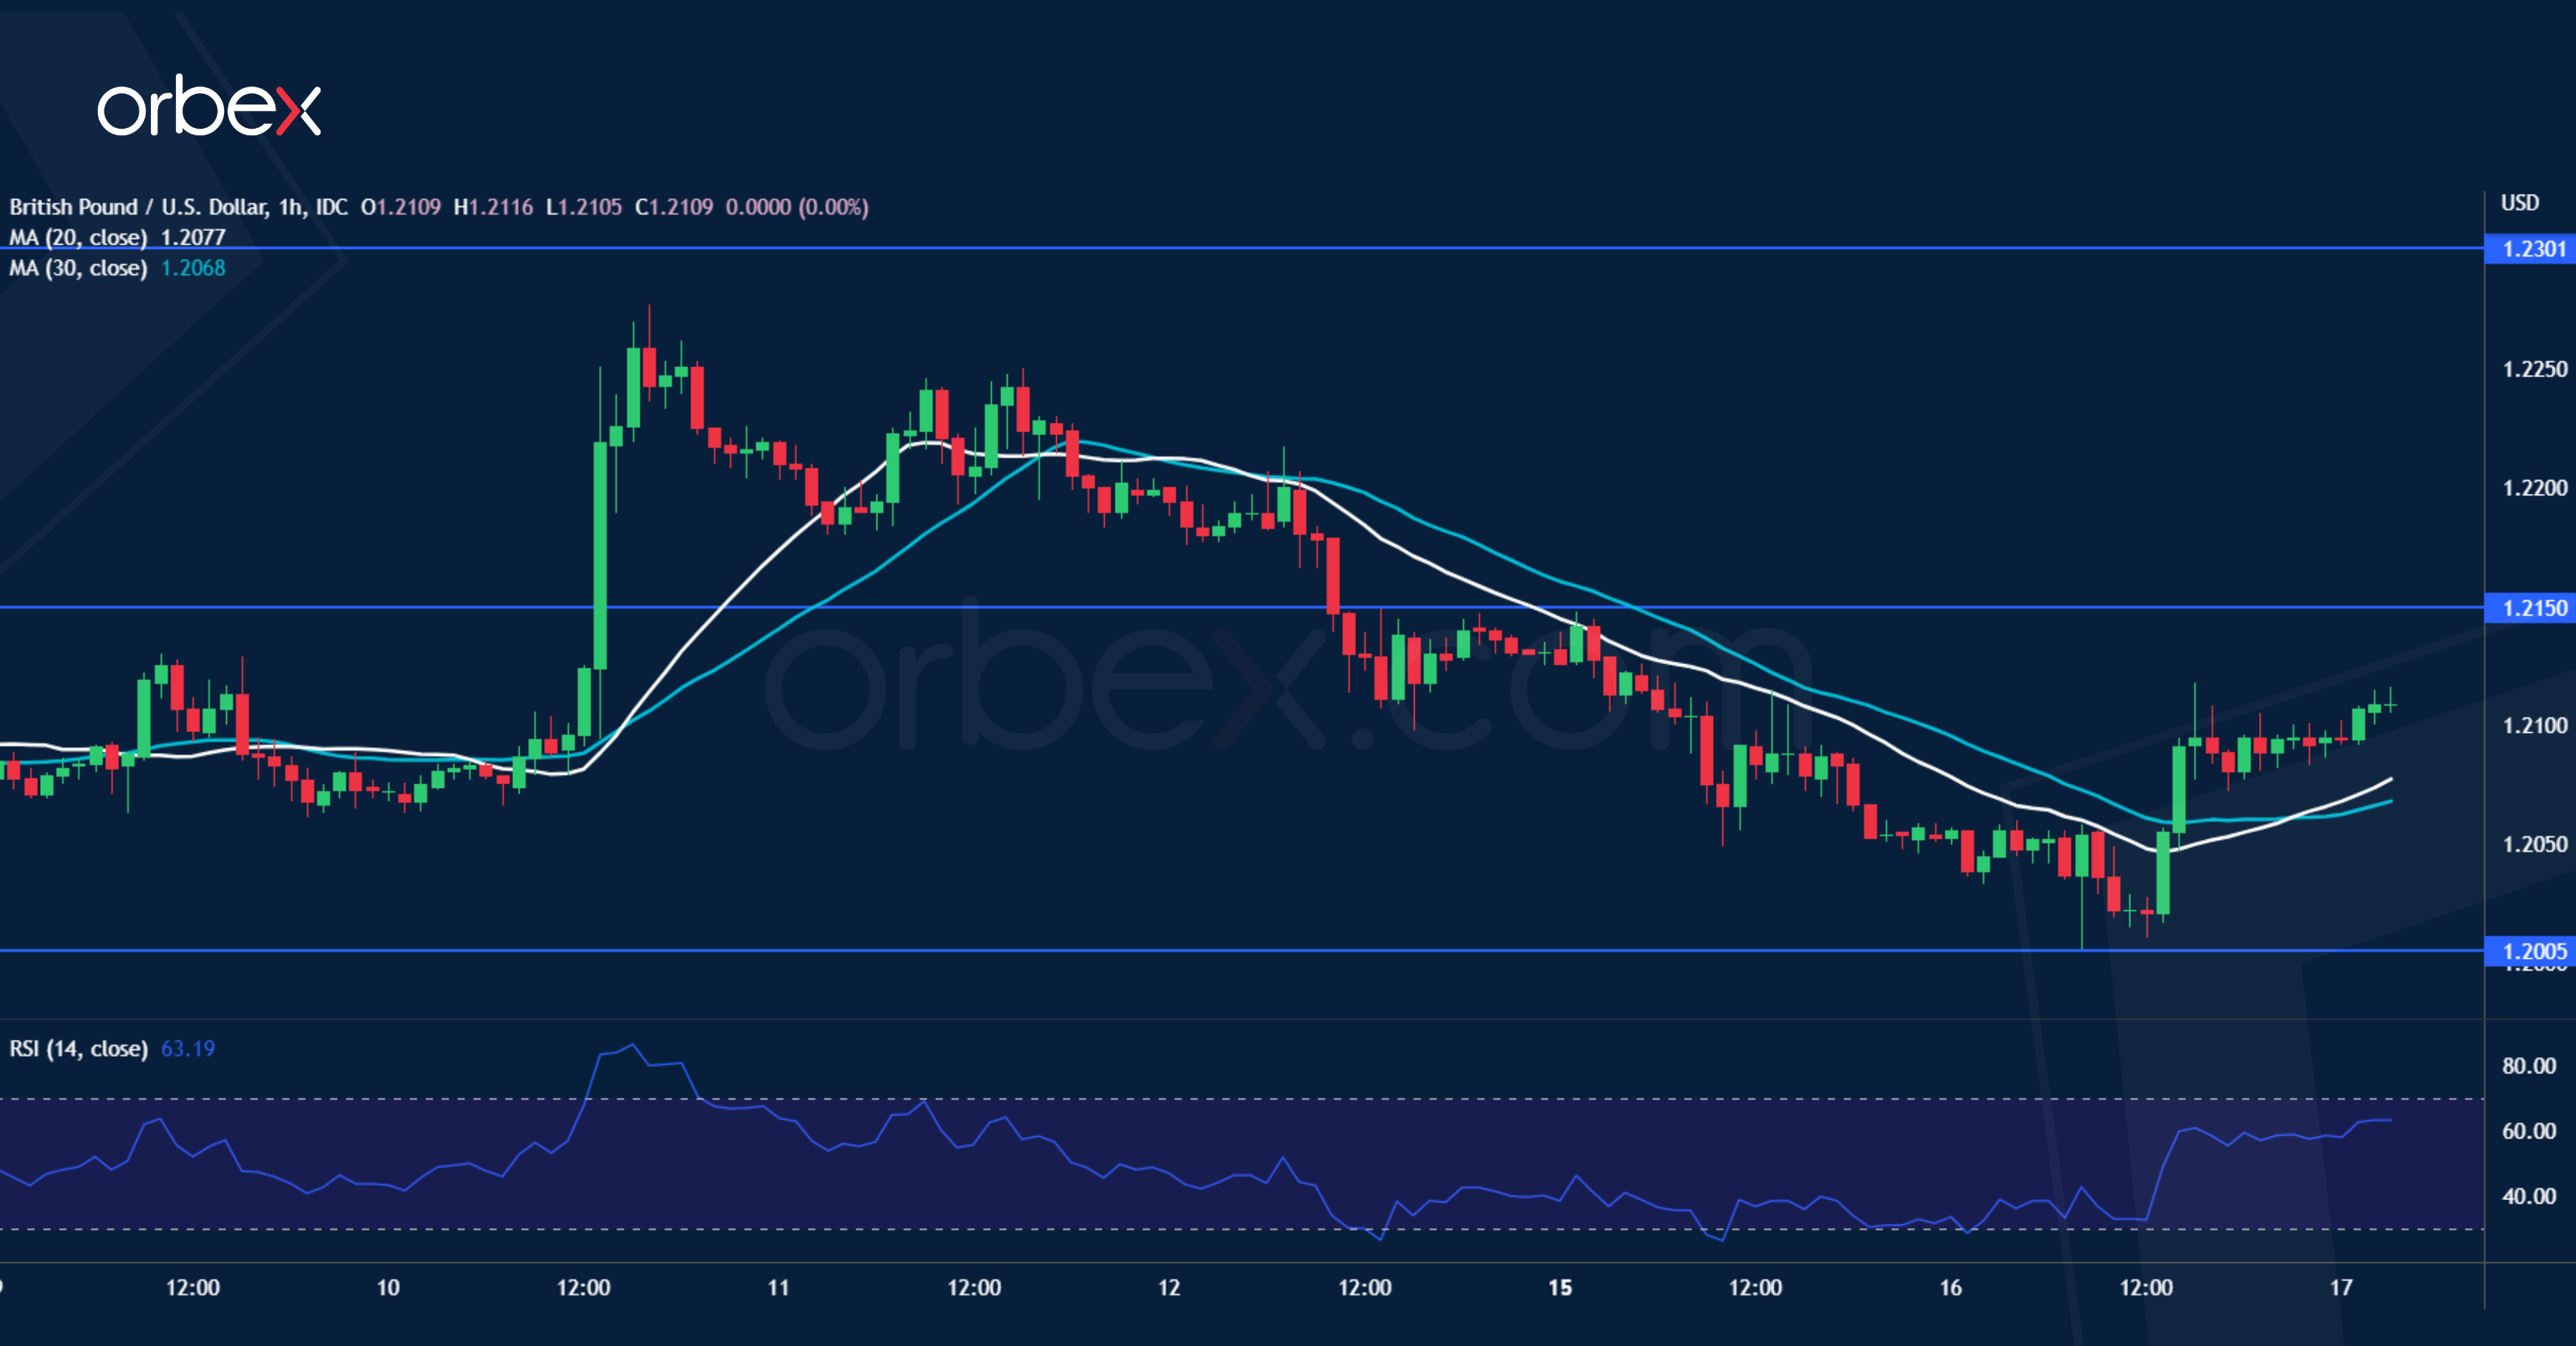
GBPUSD rebounded off the 1.2000 psychological level in the preceding session, flirting with the 20- and 40-day simple moving averages (SMAs). The bullish crossover within the SMAs remains intact, suggesting that a bullish correction may be on the radar in the short-term timeframe. The MACD oscillator is moving sideways near its trigger and zero lines, while the RSI is approaching the neutral threshold of 50.
If the market manages to gain momentum, the 23.6% Fibonacci retracement level of the decline from 1.3640 to 1.1760 at 1.2200 may act as nearby resistance ahead of the 1.2300 barrier. A sustained close above the latter may pave the way for 1.2410 and the 38.2% Fibonacci level at 1.2470.
On the other hand, a move lower again may find next support at 1.1995, a level that has acted as both resistance and support throughout the month of July and the beginning of August. When that level is broken, the next potential support is at 1.1890, after which the attention can turn to the 28-month low at 1.1760.
Since prices are still below the 1.2200 resistance, the medium-term picture is unfavorable and only a successful climb above the 200-day SMA may switch the outlook to bullish.
EURJPY Steps on Familiar Support Zone; 20-SMA in Target
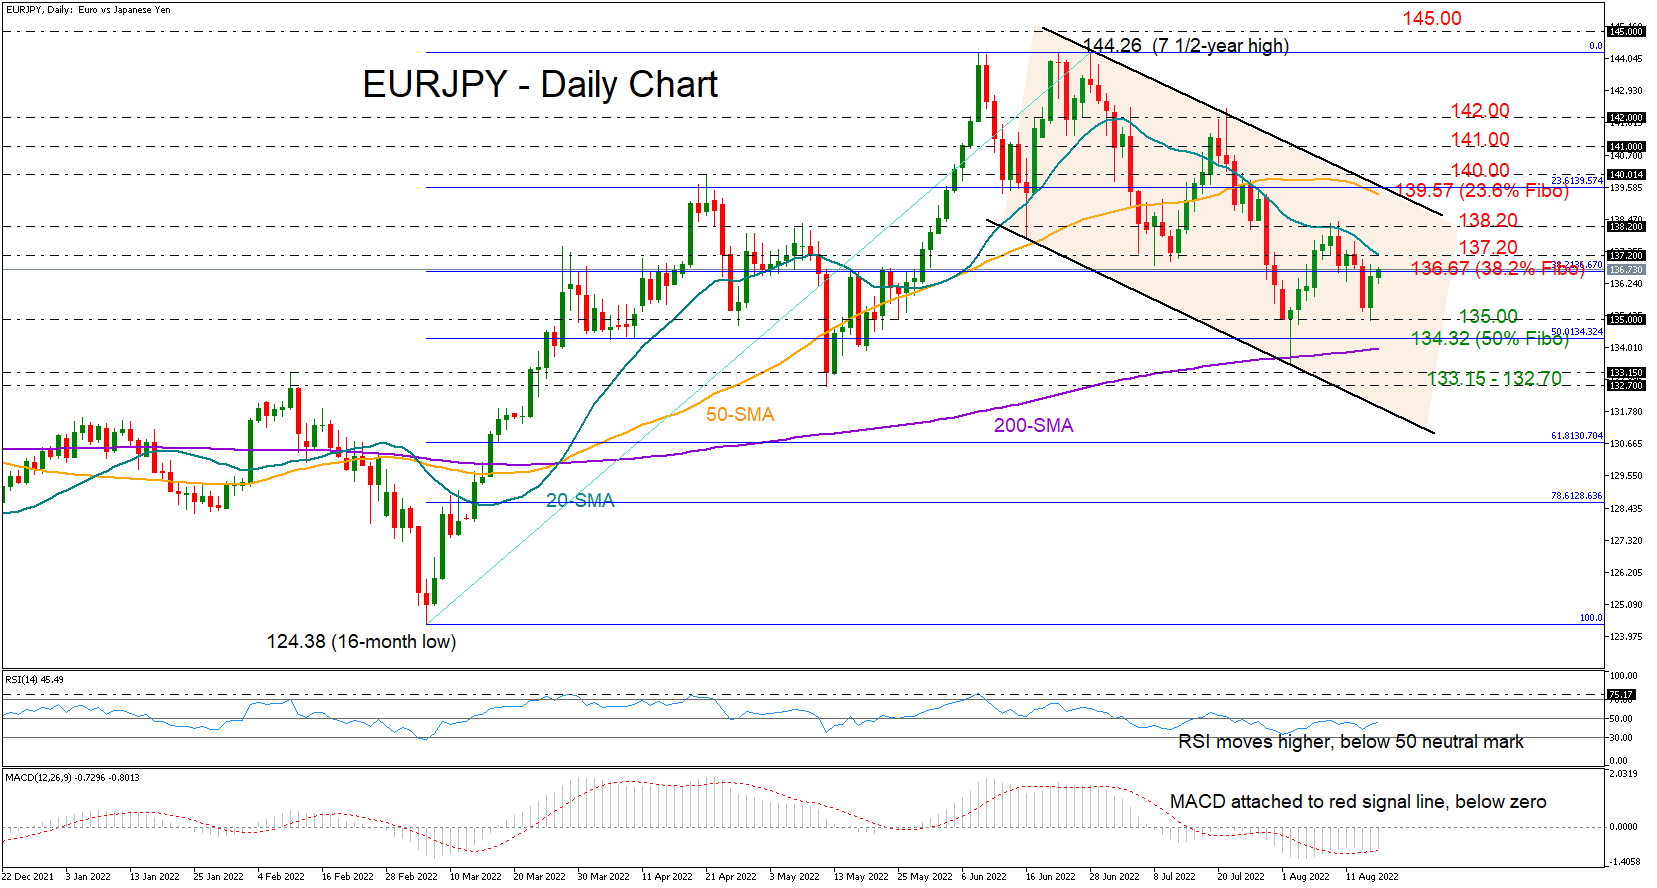
EURJPY stood firm again around the 135.00 support region on Tuesday, which triggered the preceding bullish wave, increasing hopes that the latest bearish correction has found a bottom.
The tough 20-day simple moving average (SMA), however, is still overhead, keeping downside risks alive at 137.20, while the 38.2% Fibonacci of the 124.38 – 144.26 upleg also seems a struggle to overcome today as it lies slightly lower at 136.67.
In other discouraging signs, the RSI and the MACD, although having pivoted northwards, remain within the negative area, with the former below its 50 neutral mark and the latter attached to its red signal line below zero.
Unless the bulls sustain their strength above 137.20, the price could flip back to test the 135.00 base. Failure to bounce here this time may initially see an extension towards the 50% Fibonacci of 134.32 and the 200-day SMA, and then a continuation towards the key constraining zone of 133.15 -132.70. Should selling pressures persist at this point, all eyes will turn to the channel's lower boundary at 131.86.
In the bullish scenario, where the pair finally closes above the 20-day SMA, the first obstacle could pop up around 138.20. A decisive step higher may run until the channel’s surface and the 50-day SMA at 139.42, where the 23.6% Fibonacci is also positioned. Beyond that, the 140.00 psychological mark, which halted April’s upside sequence, could immediately block the way towards the 141.00 and 142.00 round levels.
Summarizing, EURJPY seems to have set the stage for its next upside reversal, though whether it will be successful may depend on the restrictive 20-day SMA.
US 30 Stays Up
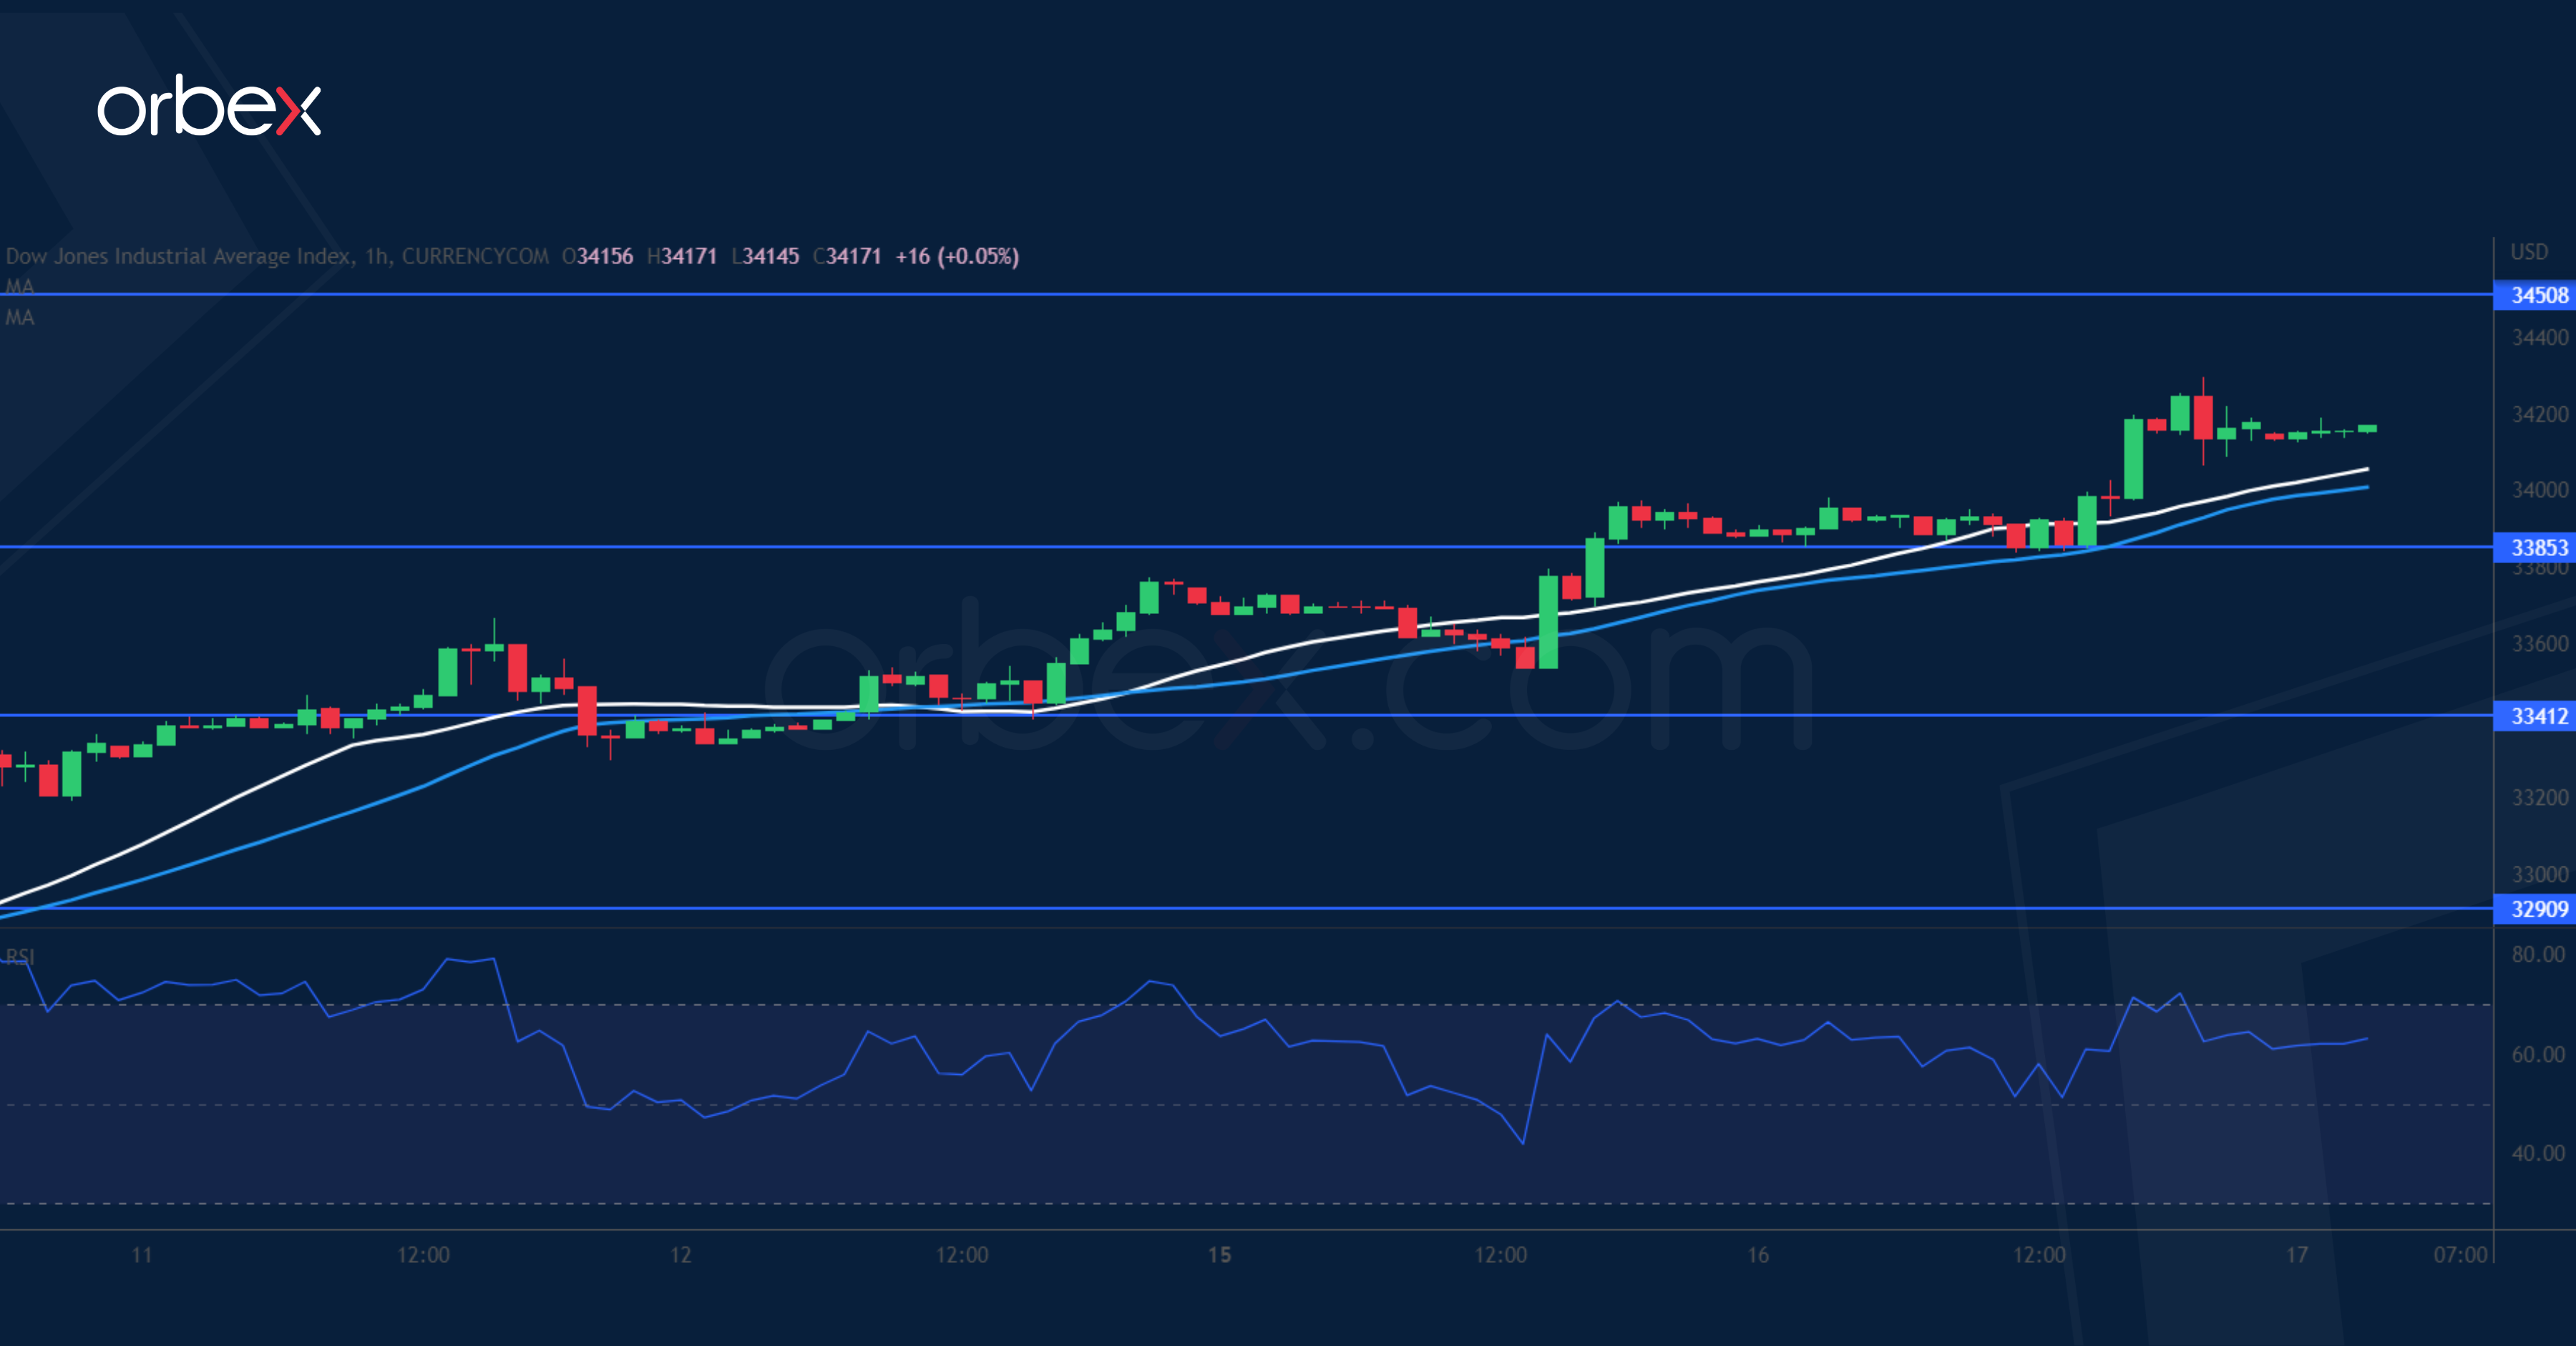
The Dow Jones 30 continues upward supported by upbeat outlooks from blue chip retail stocks. Confidence has shot up after a rise above the daily resistance at 33000 and then May’s high at 34000, setting 34500 at the origin of the liquidation in April as the target. A break above that supply zone would intensify the short squeeze. The RSI’s overbought situation on the daily chart may weigh on the enthusiasm. A retreat below 33850 could trigger a wave of profit-taking, and 33400 would test short-term buyers’ resolve.
USD/CAD Seeks Support
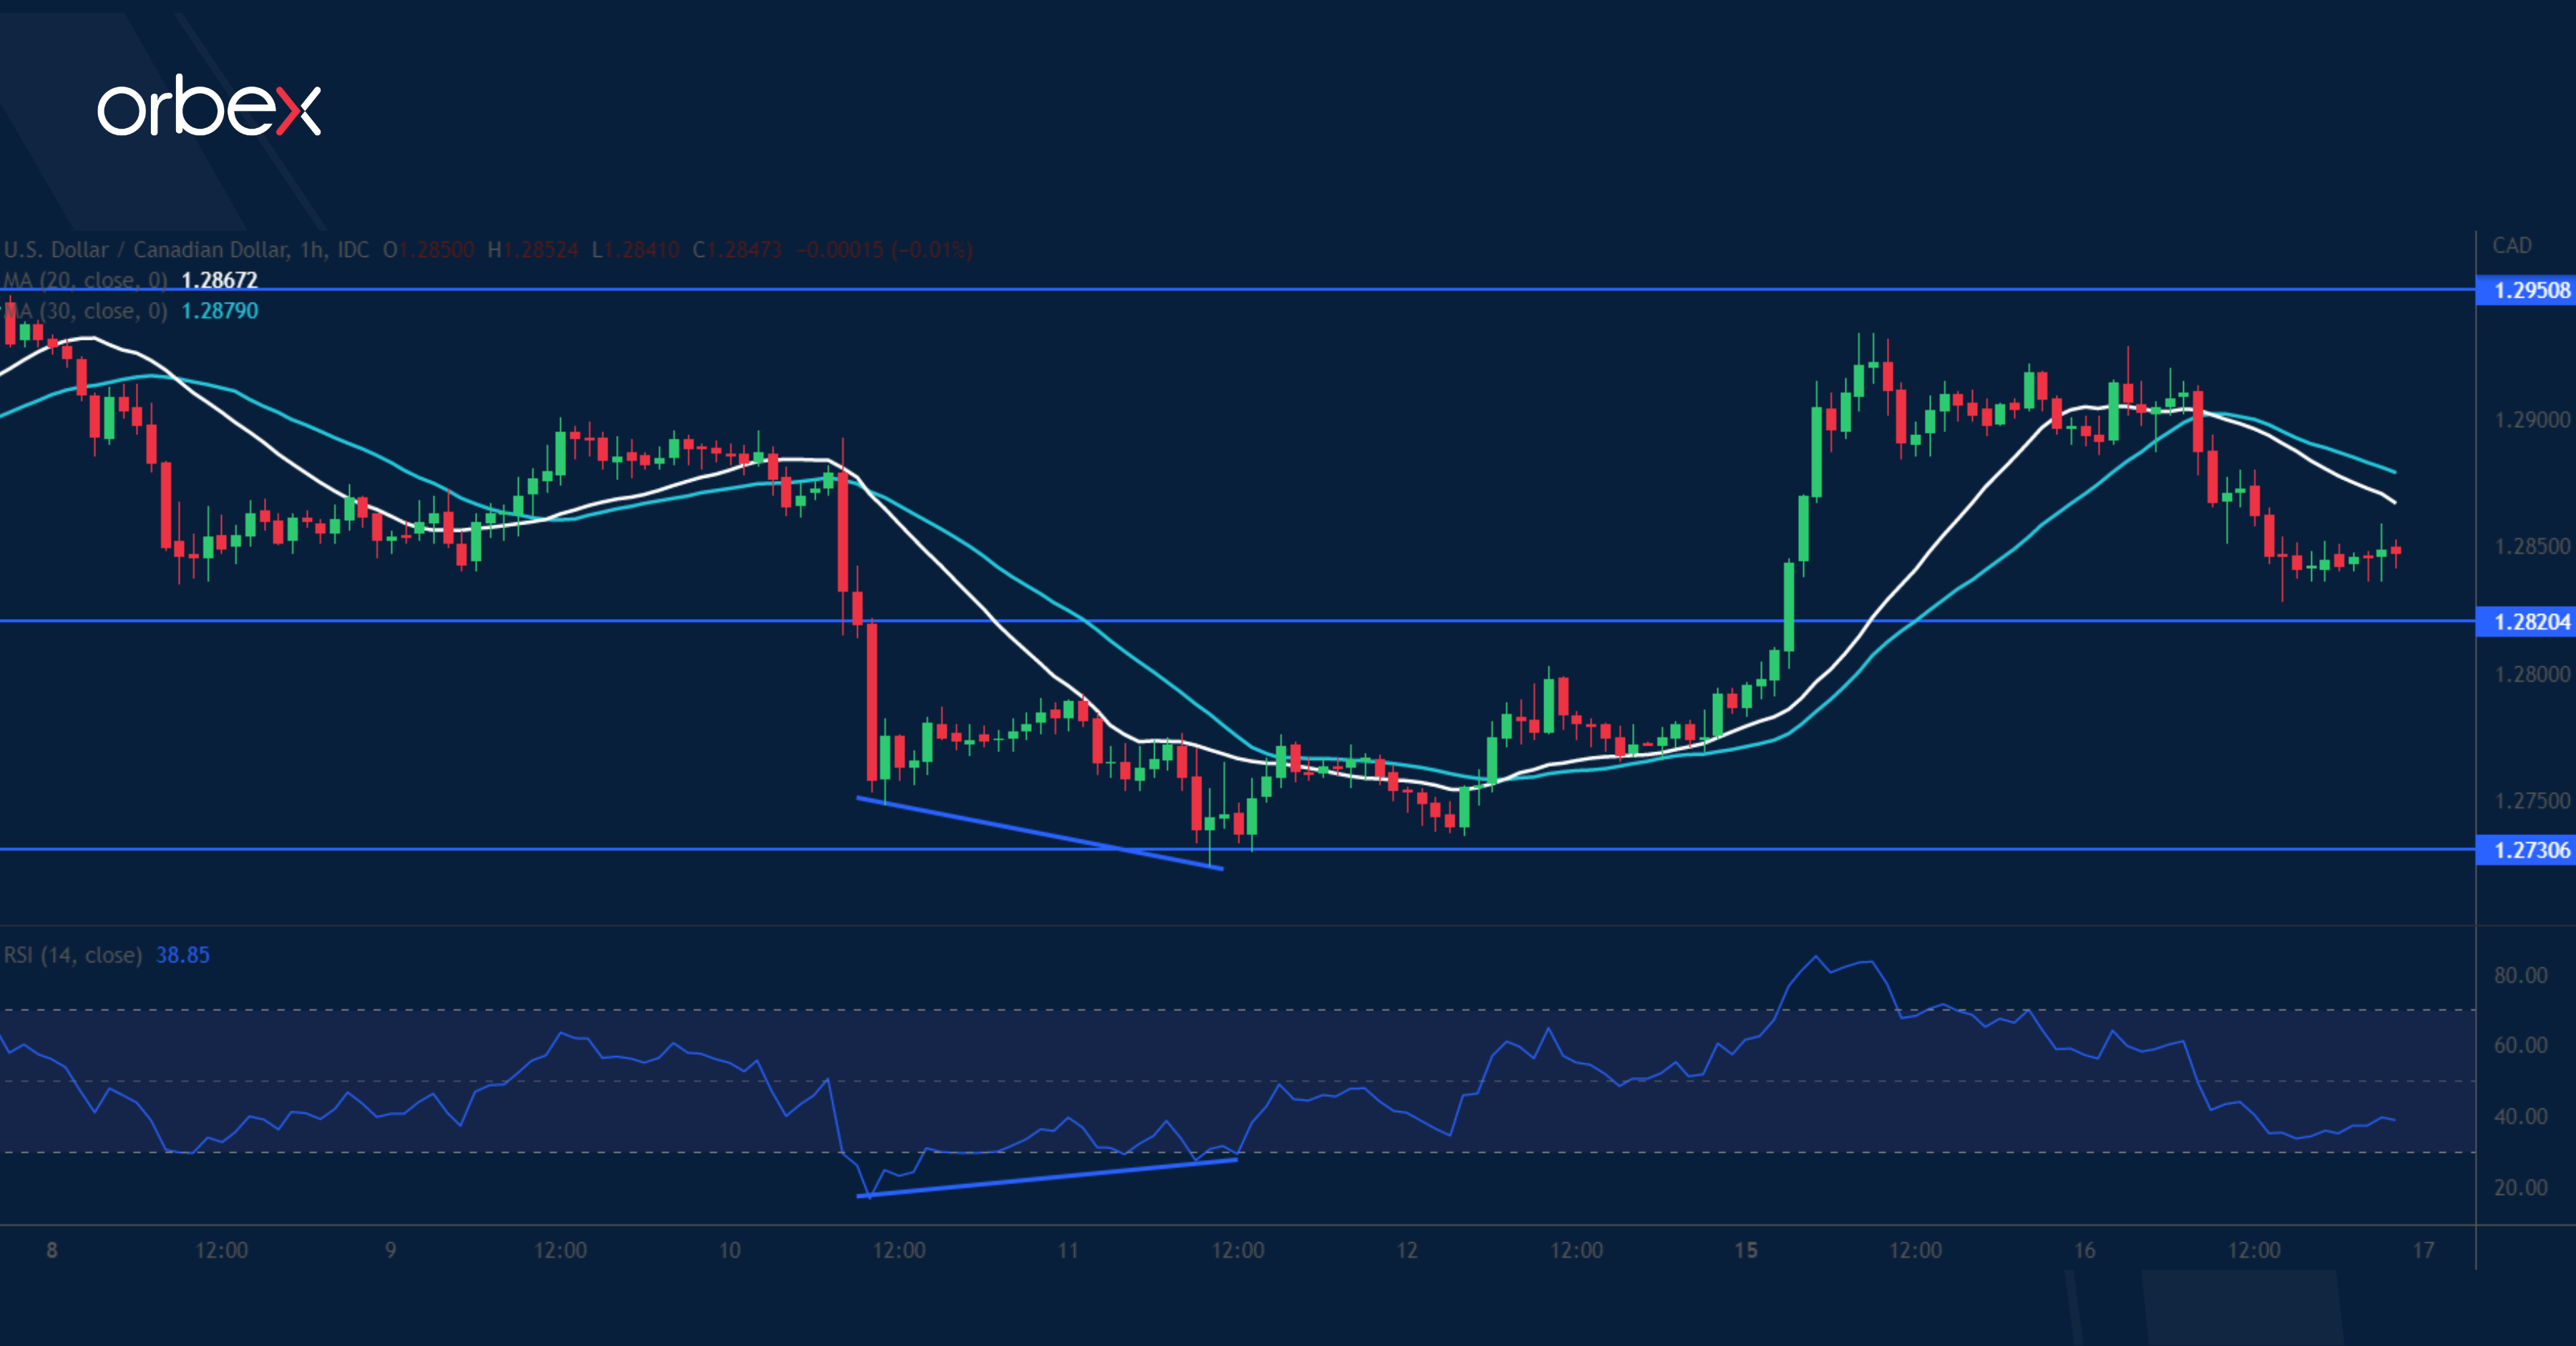
The Canadian dollar holds well against its US counterpart as July’s CPI remains stubbornly high. A bullish RSI divergence showed a deceleration in the sell-off. The greenback’s bounce above 1.2900 led sellers to close their positions. The initial momentum has dried up to let the RSI recover into the neutrality area. 1.2820 around the start of the bullish breakout is a demand zone to see whether there is enough follow up interest in pushing the US dollar higher. A close above 1.2950 could open the door to the recent peak at 1.3170.
GBP/USD Consolidates
The pound steadies as wage growth argues in favour of further BoE tightening. The price action has been struggling to clear the daily resistance near 1.2300. Two consecutive failed rebounds show a lack of buying power. Sterling is resting over the psychological level of 1.2000 thanks to bargain hunting. Its breach would force the bulls out, leaving it vulnerable to momentum selling towards July’s lows around 1.1800, which is a major floor to safeguard the month-long recovery. 1.2150 is the first resistance the buy side needs to lift.
UK Inflation Once More Exceeded Consensus in July
Markets
Yesterday’s eco numbers (German ZEW investor sentiment, US housing numbers) played no role of intraday importance across markets. The main intraday move on bond markets occurred around the start of US trading hours. Bonds sold off following earnings by retailers Wall Mart and Home Depot. Both managed to beat expectations, though we must add that the former downplayed its guidance last month. Nevertheless, the results gave investors some courage that worst recession nightmares might be off the table as the (US) consumer holds stronger than feared. The proof of the pudding could be in today’s July US retail sales numbers. A second-session straight (late) swoon of oil prices (Brent fell from $96 to $92/b) failed to improve the intraday odds for core bonds. The US yield curve turned more inverse with daily yield changes ranging between -1.2 bps (30-yr) to +9.1 bps (3-yr). The German yield curve bear steepened with yields adding 4.6 bps (2-yr) to 7.5 bps (30-yr). From a technical point of view, the German 10-yr yield tested the psychologic 1% barrier, which coincides with last week’s high and with the topside of the downward corrective trend channel since mid-June. A break higher would be significant and call an end to that correction, making way for a further increase towards the 1.12% area. Stock markets continued their comeback higher after escaping from downward trend channels end July/early August. Main indices gained around 0.5% both in Europe and in the US. Ironically, a weak growth scenario (which eventually ends policy normalization cycles) does the trick. From a risk perspective, it beats the alternative of prolonged central bank tightening/inflation fighting. The US dollar failed to profit from yesterday’s relative yield dynamics. The trade-weighted greenback closed near unchanged at 106.50 with EUR/USD even winning some pips, closing at 1.0171 from an open at 1.0161.
Today’s eco data include this mornings Japanese trade numbers and UK inflation figures. Later today we’ll see the second reading of Q2 EMU GDP, US retail sales (see above) and Minutes of the previous FOMC meeting. Japan’s trade deficit hit a record high in July on surging imports. High commodities prices and a weak yen added to this. UK inflation once more exceeded consensus in July. The monthly dynamic remains strong at 0.6% M/M with the Y/Y figure accelerating from 9.4% to 10.1%, exceeding consensus (9.8%) and hitting double digits for the first time since 1982. Core inflation accelerated from 5.8% Y/Y to 6.2% Y/Y. Sterling spikes higher on the numbers as it strengthens the case for the Bank of England to hang on to its increased tightening pace. Governor Bailey and co in August pushed through a first 50 bps rate hike following 5 smaller steps (+25 bps) before. EUR/GBP trades below 0.84.
News Headlines
The Reserve Bank of New Zealand extended its tightening cycle this morning by lifting the policy rate by 50 bps, from 2.5% to 3%, the highest level since July 2015. It’s the fourth consecutive 50 bps rate hike, following three smaller 25 bps steps (inaugural move October 2021). In its new projections, the Monetary Policy Council (MPC) pencils in a more aggressive tightening path than in May. The policy rate is now forecast to peak just above 4% early next year and will only come down from 2025 onwards. More tightening “at pace” is necessary as the MPC judges core consumer inflation remains too high while labour resources remain scarce. Updated inflation forecast show a slowdown from the current 7.3% to 5.8% by the end of 2022 (5.5% forecast in May), to 3.8% by the end of 2023 and below the midpoint of the 1%-3% target range by mid-2024. Annual average projected growth in the year through March 2023 stands at 2.8%, before slowing to 0.8% in the year through March 2024 (from 1.3% in May). The kiwi dollar ticked higher on the decision, but fails to really build on this move. NZD/USD currently changes hands at 0.6360. The kiwi dollar swap curve is broadly unchanged, with yields up to 1.5 bps higher across the curve.
UK Inflation Exceeds 10%
European and US indices traded mostly in the positive on Tuesday. The DAX gained near 0.70% and is preparing to clear the major 38.2% Fibonacci resistance in on year-to-date selloff despite the deepening energy crisis, which has only worsened with the drying Rhine River this summer.
Equities in the US escaped negative pressure thanks to better-than-expected earnings report from Walmart yesterday. The US retail giant revealed that its profit came under pressure as costumers moved to groceries and essentials, with lower profit margin, but that was already priced in, because they had already given that warnings earlier this summer. The lack of further negative news from Walmart sent the retailer’s shares jumped more than 5% yesterday to $140 per share, a level which hasn’t been seen since March this year. And other retail giants gained on optimism.
On the index level, the S&P500 challenged its 200-DMA yesterday, for the first time since April. The index traded above its 200-DMA twice this year, once in early February, then late March, but couldn’t hold on to the gains and rapidly sold off.
We will see if the third time is a charm; earnings and the FOMC minutes will be decisive for the short-term direction. The minutes will likely sound more hawkish than expected, as the Federal Reserve (Fed) rate expectations softened probably too much after last week’s CPI report in the US surprised with a softer-than-expected 8.5% print. But, 8.5% is still very high; it’s more than four times the Fed’s 2% policy target.
Therefore, we don’t expect anything less than a Fed decided to win its war over inflation at today’s minutes.
US dollar re-gains field
US housing starts fell almost 10% last month, but a better-than-expected industrial production maintained the investor mood optimistic into the Fed minutes.
The producer prices in New Zealand eased last month, and the Reserve Bank of New Zealand raised its policy rate to 3% this morning for the first time in seven years. The Kiwi pared a part of past days’ losses against the US dollar.
The US 10-year yield stabilizes around the 2.80% mark, but the 2-year yield continues pushing higher above the 3.20% mark. The widening spread between the 2 and the 10-year yield is a sign that the market is pricing in a, perhaps unavoidable recession.
The US dollar index has been gaining territory since a couple of sessions and is now above the July-August downtrending channel.
Inflation in Canada eased to 7.6% as expected in July, down from the 8.1% printed a month earlier. There was no good surprise on the Canadian data front, there was no doves to be revived unfortunately, and the USDCAD eased as the Loonie strengthened.
Britain was not that lucky. July inflation in the UK came above the 10% mark, versus 9.8% expected by analysts. Surpassing the 10% psychological level revived the Bank of England (BoE) hawks, but it’s unsure whether the post-data rebound in sterling could last, as rising rates apply a decent negative pressure on the British economy, and the deep recession fears keep the pound under pressure against the dollar. From a technical standpoint, Cable is giving signs of a negative breakout from the last month triangle, rather than the contrary.
Elsewhere
The barrel of US crude rebounded from $85 level, as the API data showed a 448’000 barrel decline in the US oil inventories last week versus 117’000 decline expected by analysts. The more official EIA is due today and is expected to print a 300’000 rise in inventories. Remember, there was a 5.5 mio barrel build last week, which helped pushing prices lower. Lower US inventories could help crude recover above the $90 per barrel into the weekend.
Gold, on the other hand, is moving lower, under the pressure of a stronger US dollar into the Fed minutes. The price of an ounce eased back to around its 50-DMA, which stands near $1780 level. We have a clear negative trend in play since the March spike this year, and there is a stronger case for a softer gold than the contrary, until we see a positive breakout.
UK CPI jumped to 10.1% yoy in Jul, core CPI up to 6.2% yoy
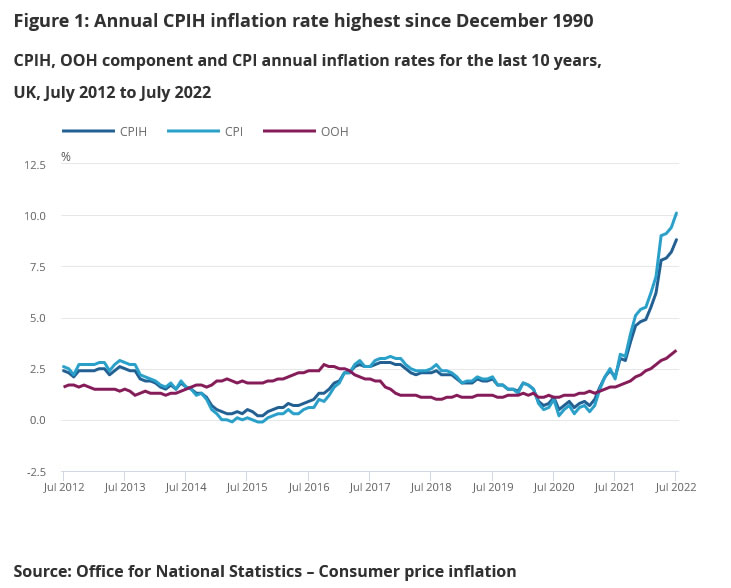
UK CPI rose 0.6% mom in July, largest monthly rise between June and July since the start of the series in 1988. The food and non-alcoholic beverages, and transport divisions made the largest upward contributions.
For the 12 month period, CPI accelerated from 9.4% yoy to 10.1% yoy, above expectation of 9.8% yoy. Indicative models suggest that CPI was last high in 1982, estimated at around 11%. Core CPI accelerated from 5.8% yoy to 6.2% yoy, below expectation of 6.4% yoy.
RPI rose 0.9% mom, 12.3% yoy, versus expectation of 0.8% mom, 12.9% yoy. PPI input came in at 0.1% mom, 22.6% yoy, versus expectation of 1.0% mom, 24.8% yoy. PPI output was at 1.6% mom, 17.1% yoy, versus expectation of 1.6% mom, 17.6% yoy. PPI core output was at 1.0% mom, 14.6% yoy, versus expectation of 0.0% mom, 15.9% yoy.