Sample Category Title
EUR/GBP Tests Supply Zone
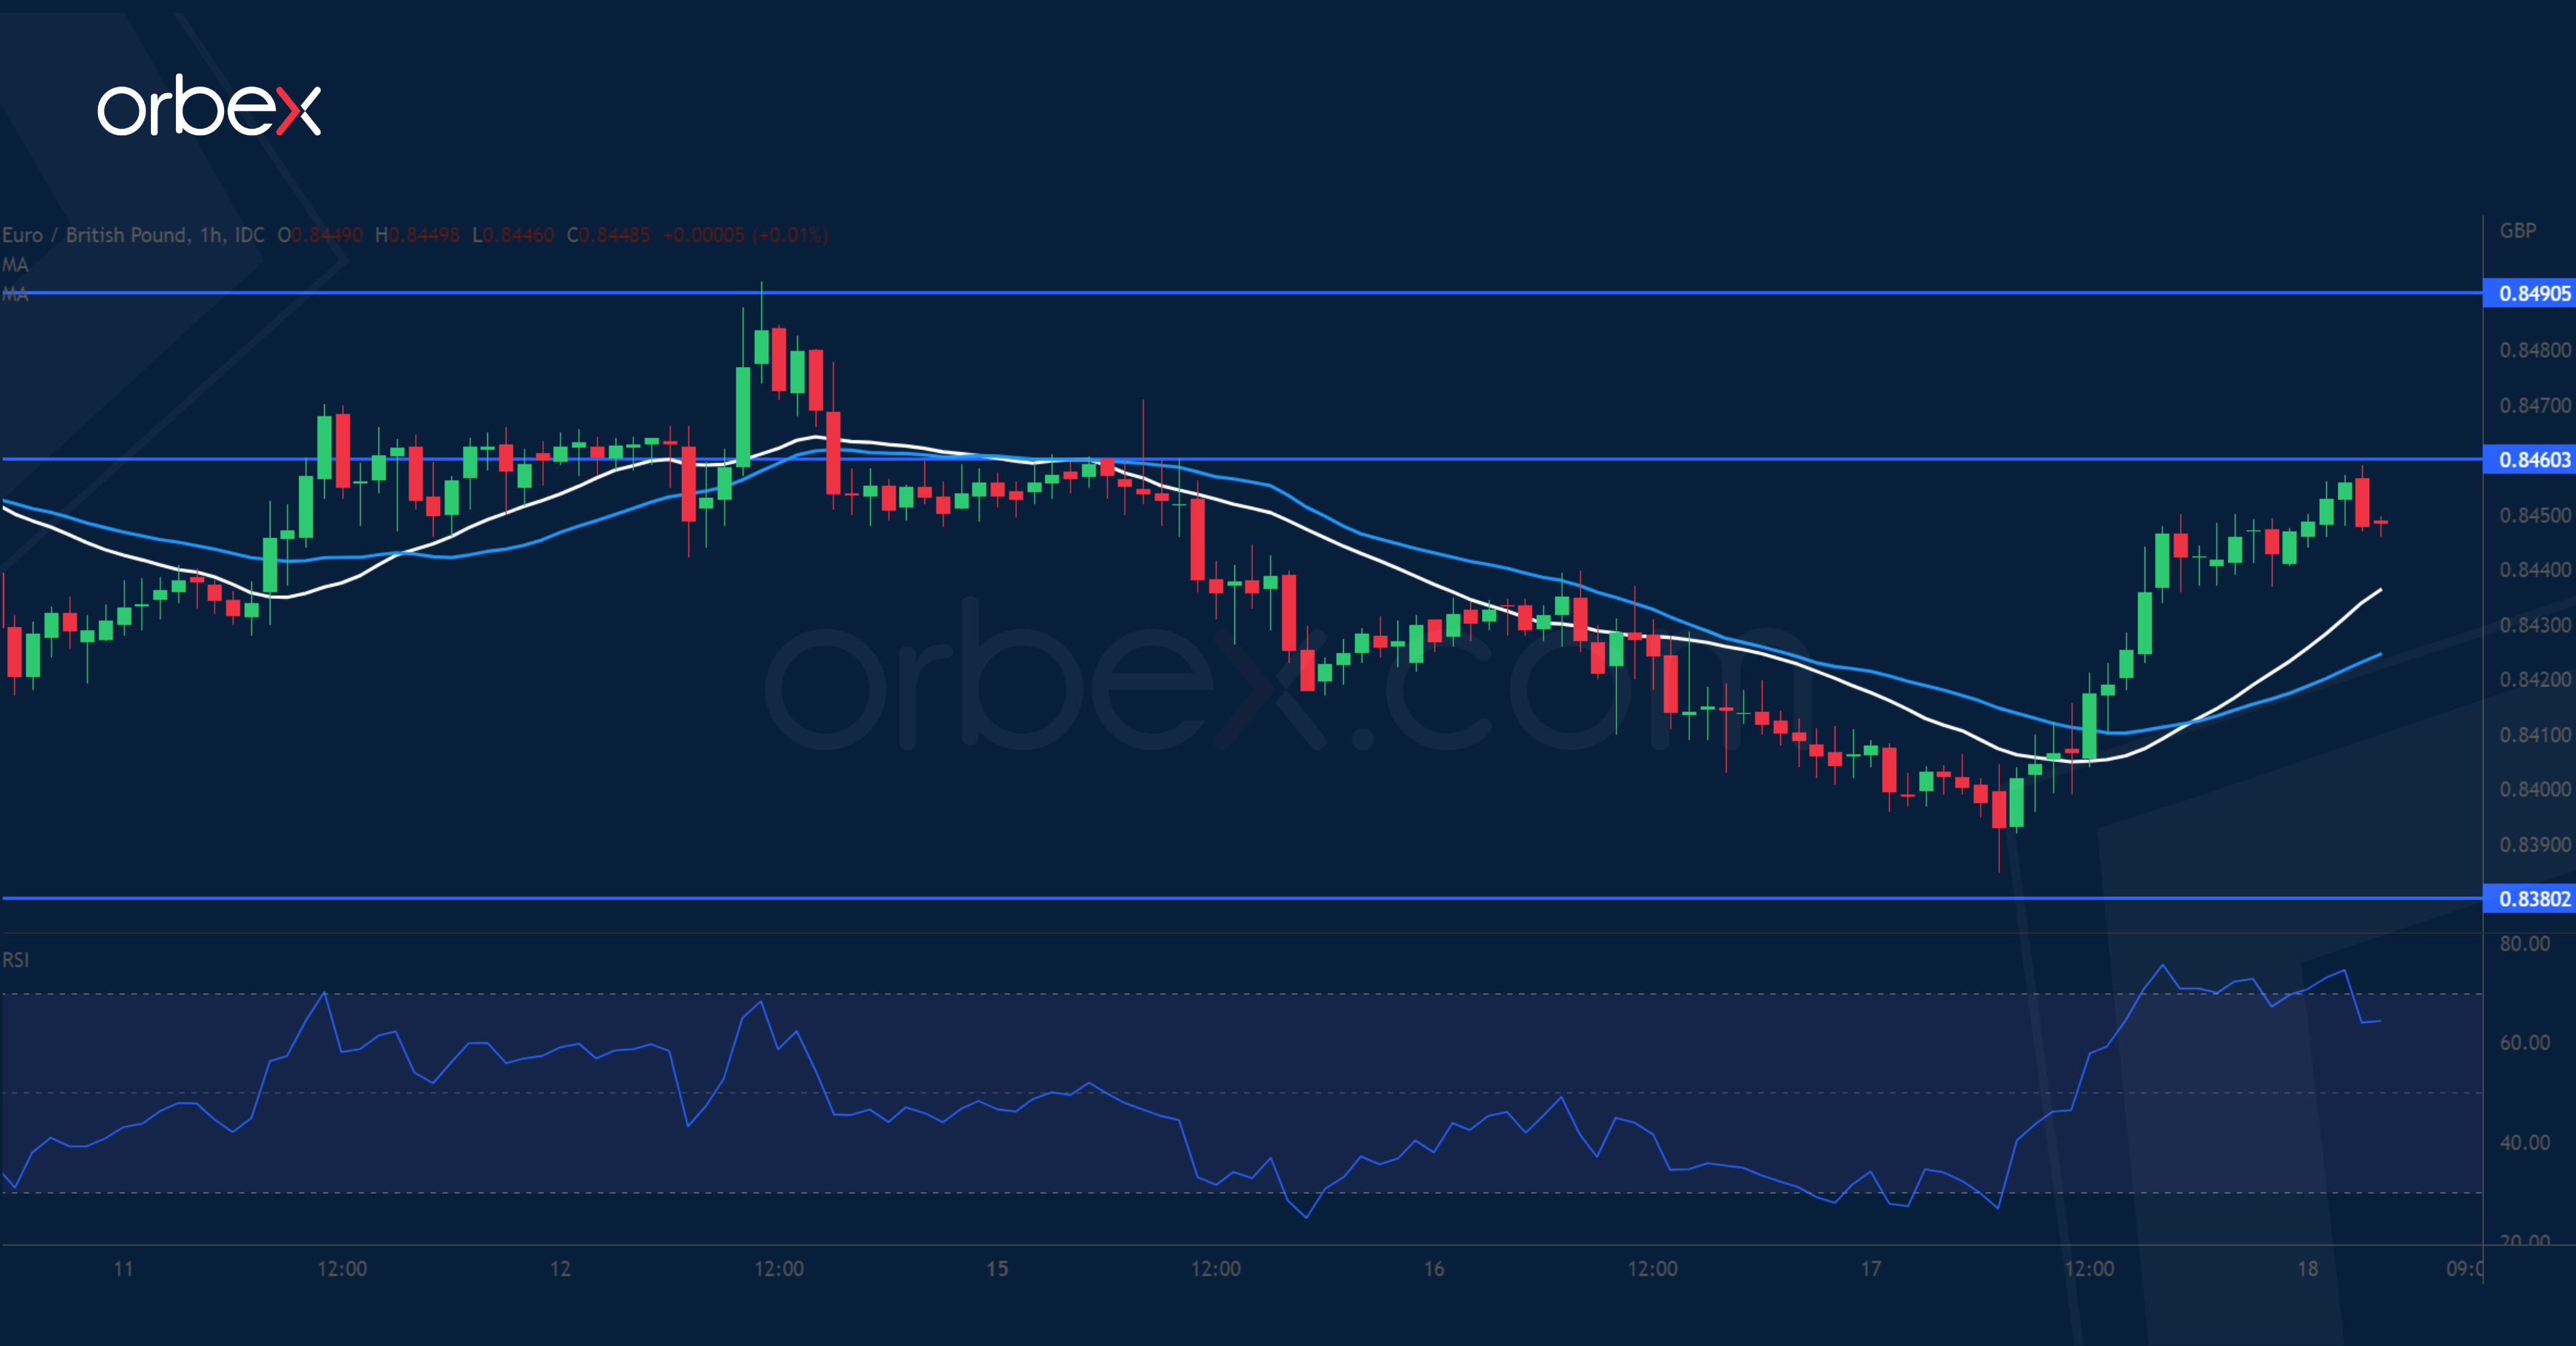
The pound softens as a 40-year high inflation rate could threaten Britain’s economic growth. After failing to hold above 0.8420, the euro has retreated to the start of the previous bullish breakout. 0.8380 is a demand zone to see whether there is strong enough interest. Further down, 0.8340 is a critical floor to keep the single currency afloat. The RSI’s oversold condition has attracted some buying interest, and the bulls will need to lift offers around 0.8460 and 0.8490 before a sustained rebound could materialise.
NZD/USD Breaks Support
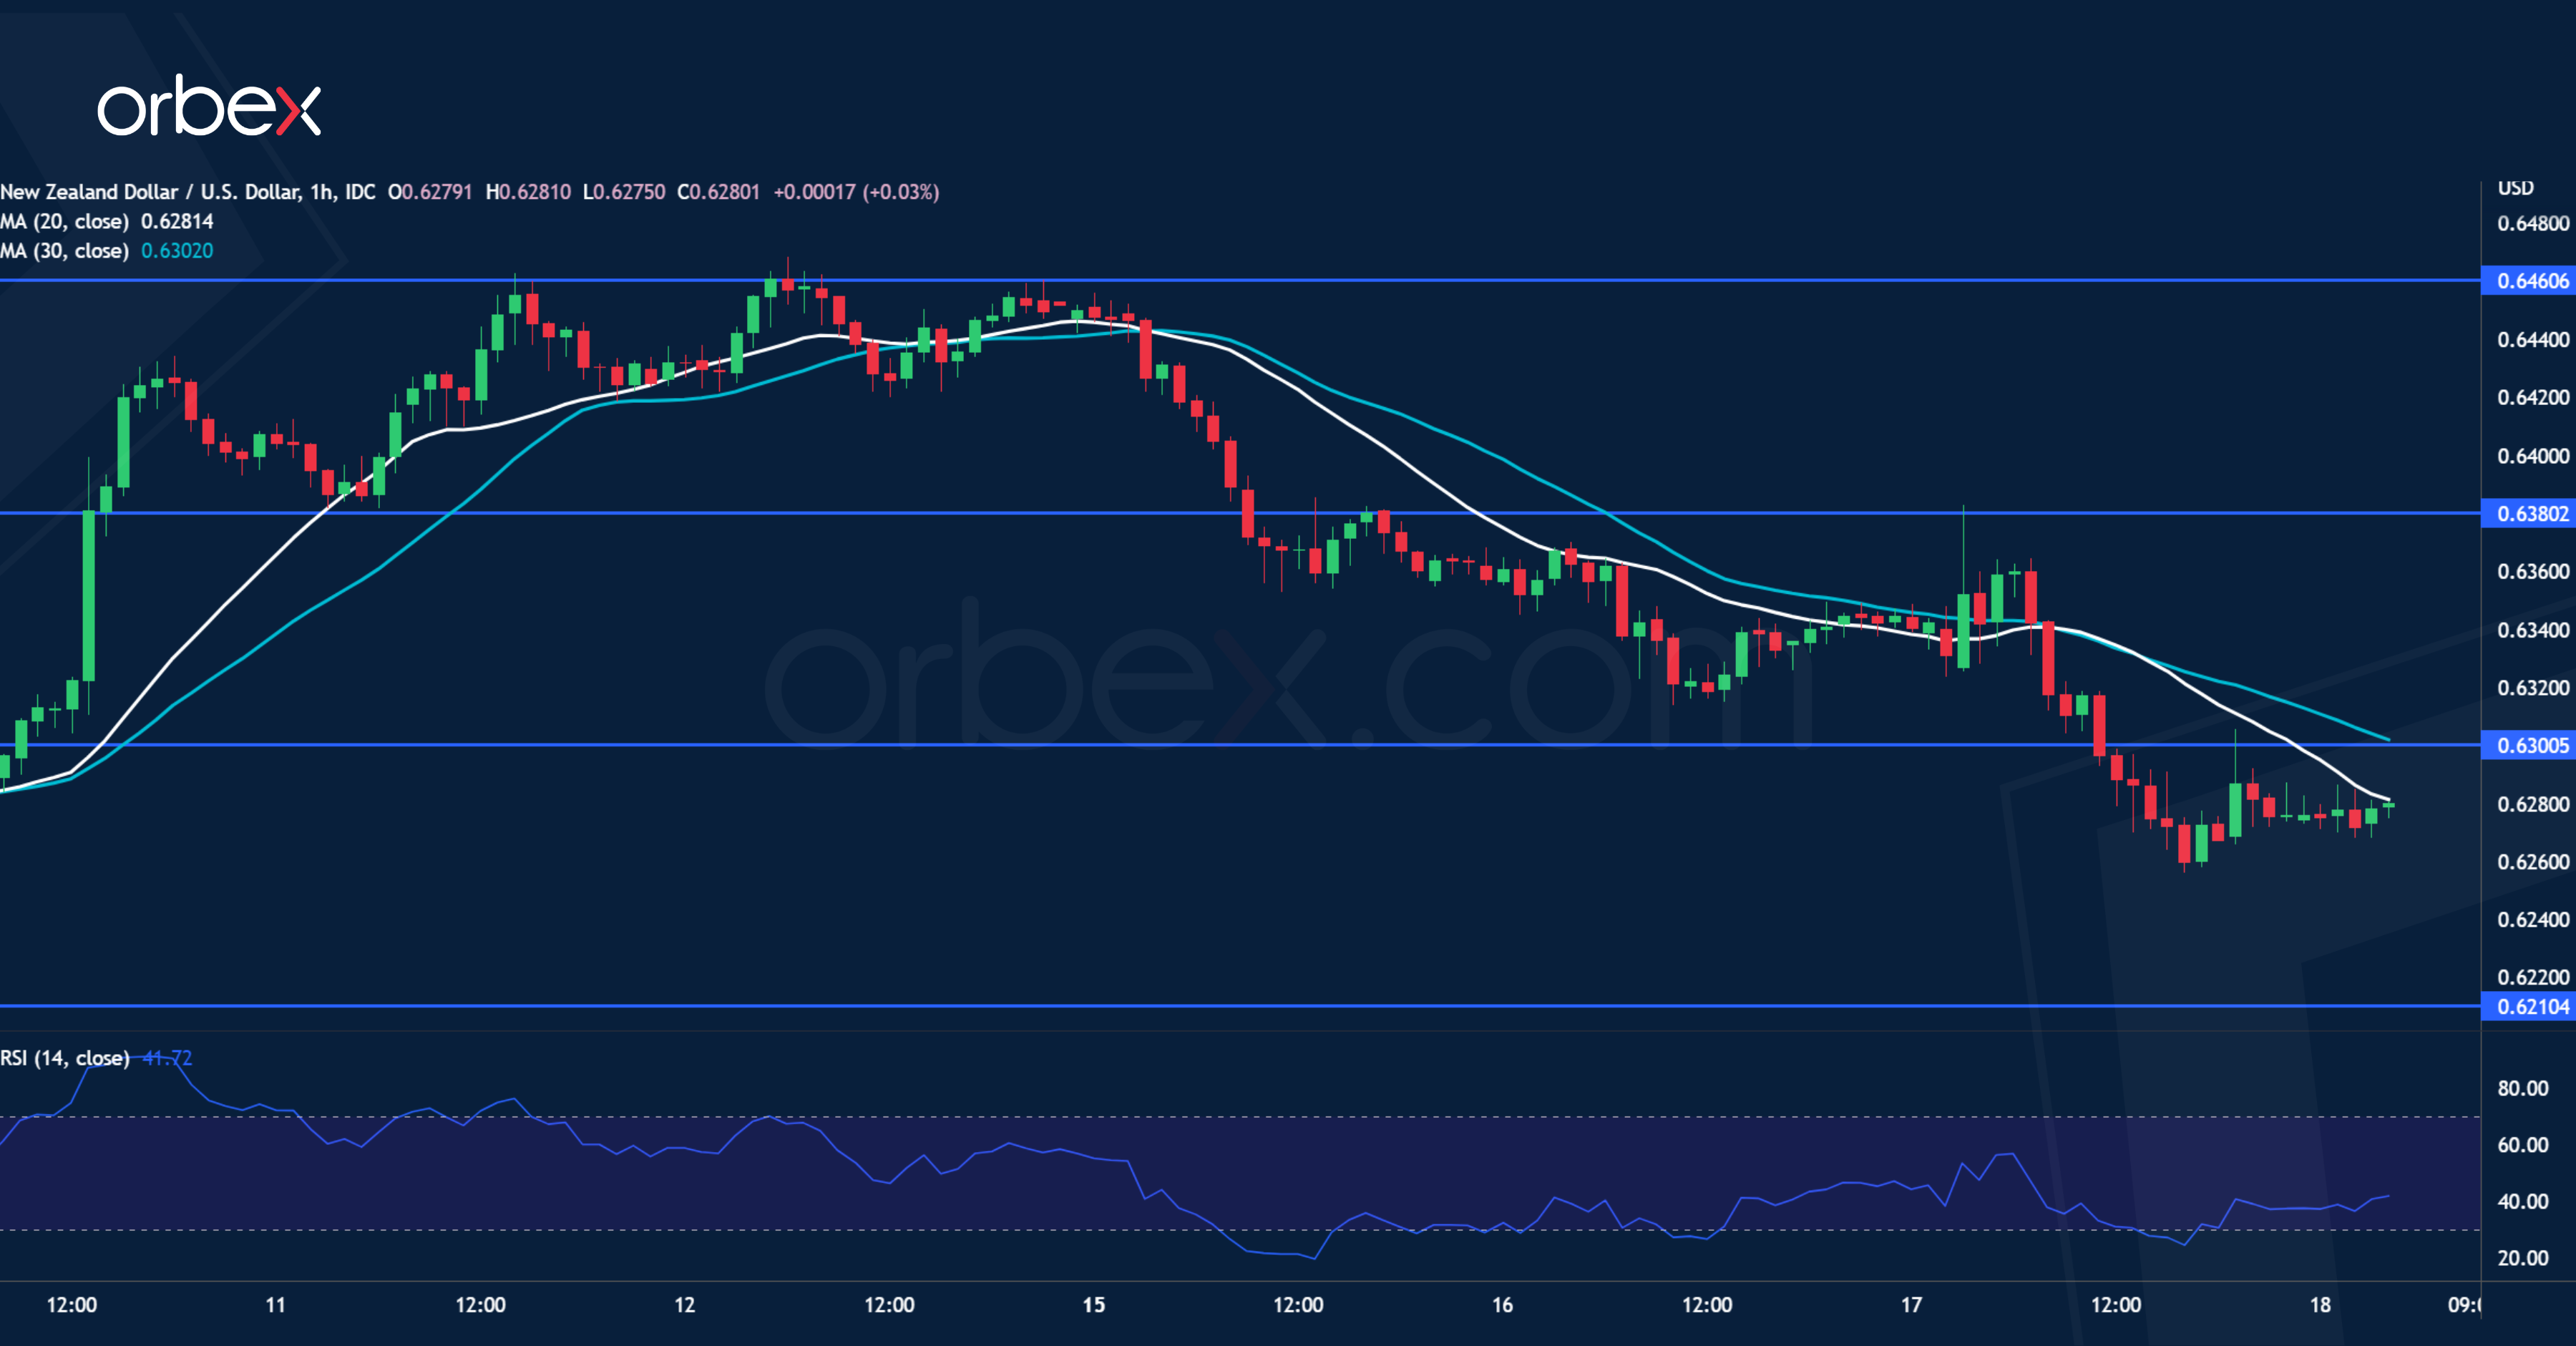
The New Zealand dollar weakened despite a 50bp hike by the RBNZ as risk sentiment fades. The pair hit resistance at 0.6460 and has given up most of its recent gains. A drop below 0.6300 at the base of last week’s bullish breakout shows a lack of commitment from the long side, putting a dent to the market’s optimism by invalidating the rebound. August’s lows near 0.6210 is the bulls’ last stronghold and its breach would send the kiwi to 0.6100. 0.6300 is the first hurdle as the RSI recovers to the neutrality area.
AUD/USD Daily Report
Daily Pivots: (S1) 0.6889; (P) 0.6959; (R1) 0.7008; More...
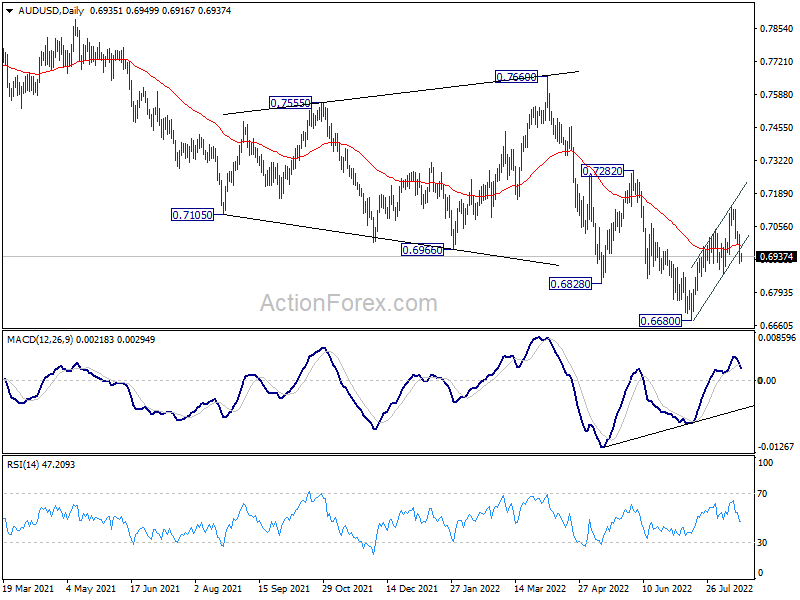
AUD/USD's fall from 0.7135 is still in progress and intraday bias stays mildly on the downside for 0.6868 support. Firm break there argue that whole rebound from 0.6680 is finished, and bring retest of 0.6680 low. On the upside, above 0.7030 minor resistance will turn intraday bias neutral first.
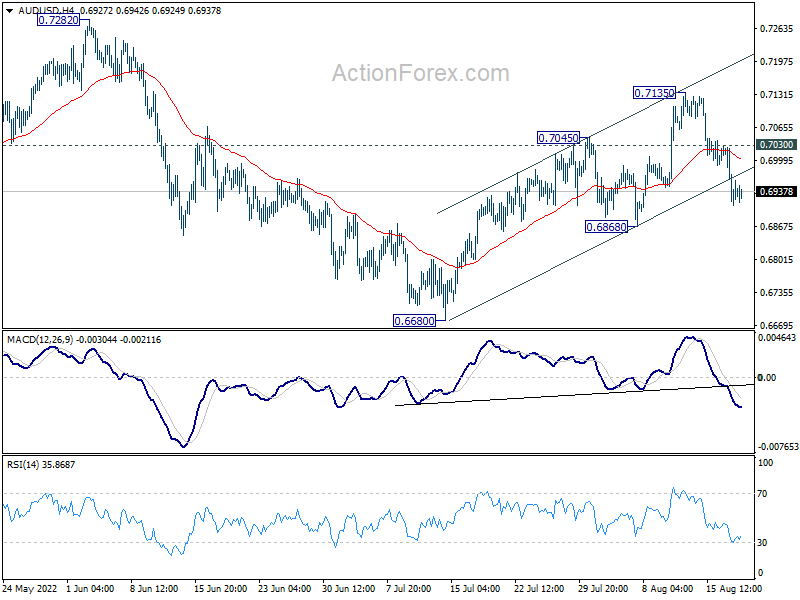
In the bigger picture, price actions from 0.8006 (2021 high) is seen more as a corrective pattern to rise from 0.5506 (2020 low). Or it could be a bearish impulsive move. In either case, outlook will remain bearish as long as 0.7282 resistance holds. Next target is 61.8% retracement of 0.5506 to 0.8006 at 0.6461.
Aussie Soft after Employment Data, Dollar On the Strong Side in Quiet Trading
Dollar is on the strong side in quiet trading in Asia, together with Yen and Swiss Franc. But the greenback is just staying in familiar range against. On the other hand, Euro and Sterling are the softer ones. Aussie is also trading with an undertone after mixed job data. But overall, most major pairs and crosses in the forex markets are still stuck inside last week's range for now.
Technically, attention will be on whether Dollar could break through near term resistance levels before the week ends. The levels include 1.2002 support in GBP/USD, 0.6868 support in AUD/USD, 135.57 resistance in USD/JPY, and 1.2984 resistance in USD/CAD.
In Asia, at the time of writing, Nikkei is down -0.85%. Hong Kong HSI is down -0.54%. China Shanghai SSE is down -0.46%. Singapore Strait Times is up 0.50%. Japan 10-year JGB yield is up 0.0079 at 0.194. Overnight, DOW dropped -0.50%. S&P 500 dropped -0.72%. NASDAQ dropped -1.25%. 10-year yield rose 0.069 to 2.893.
Australia lost -40.9k jobs, but unemployment rate dropped to 3.4%
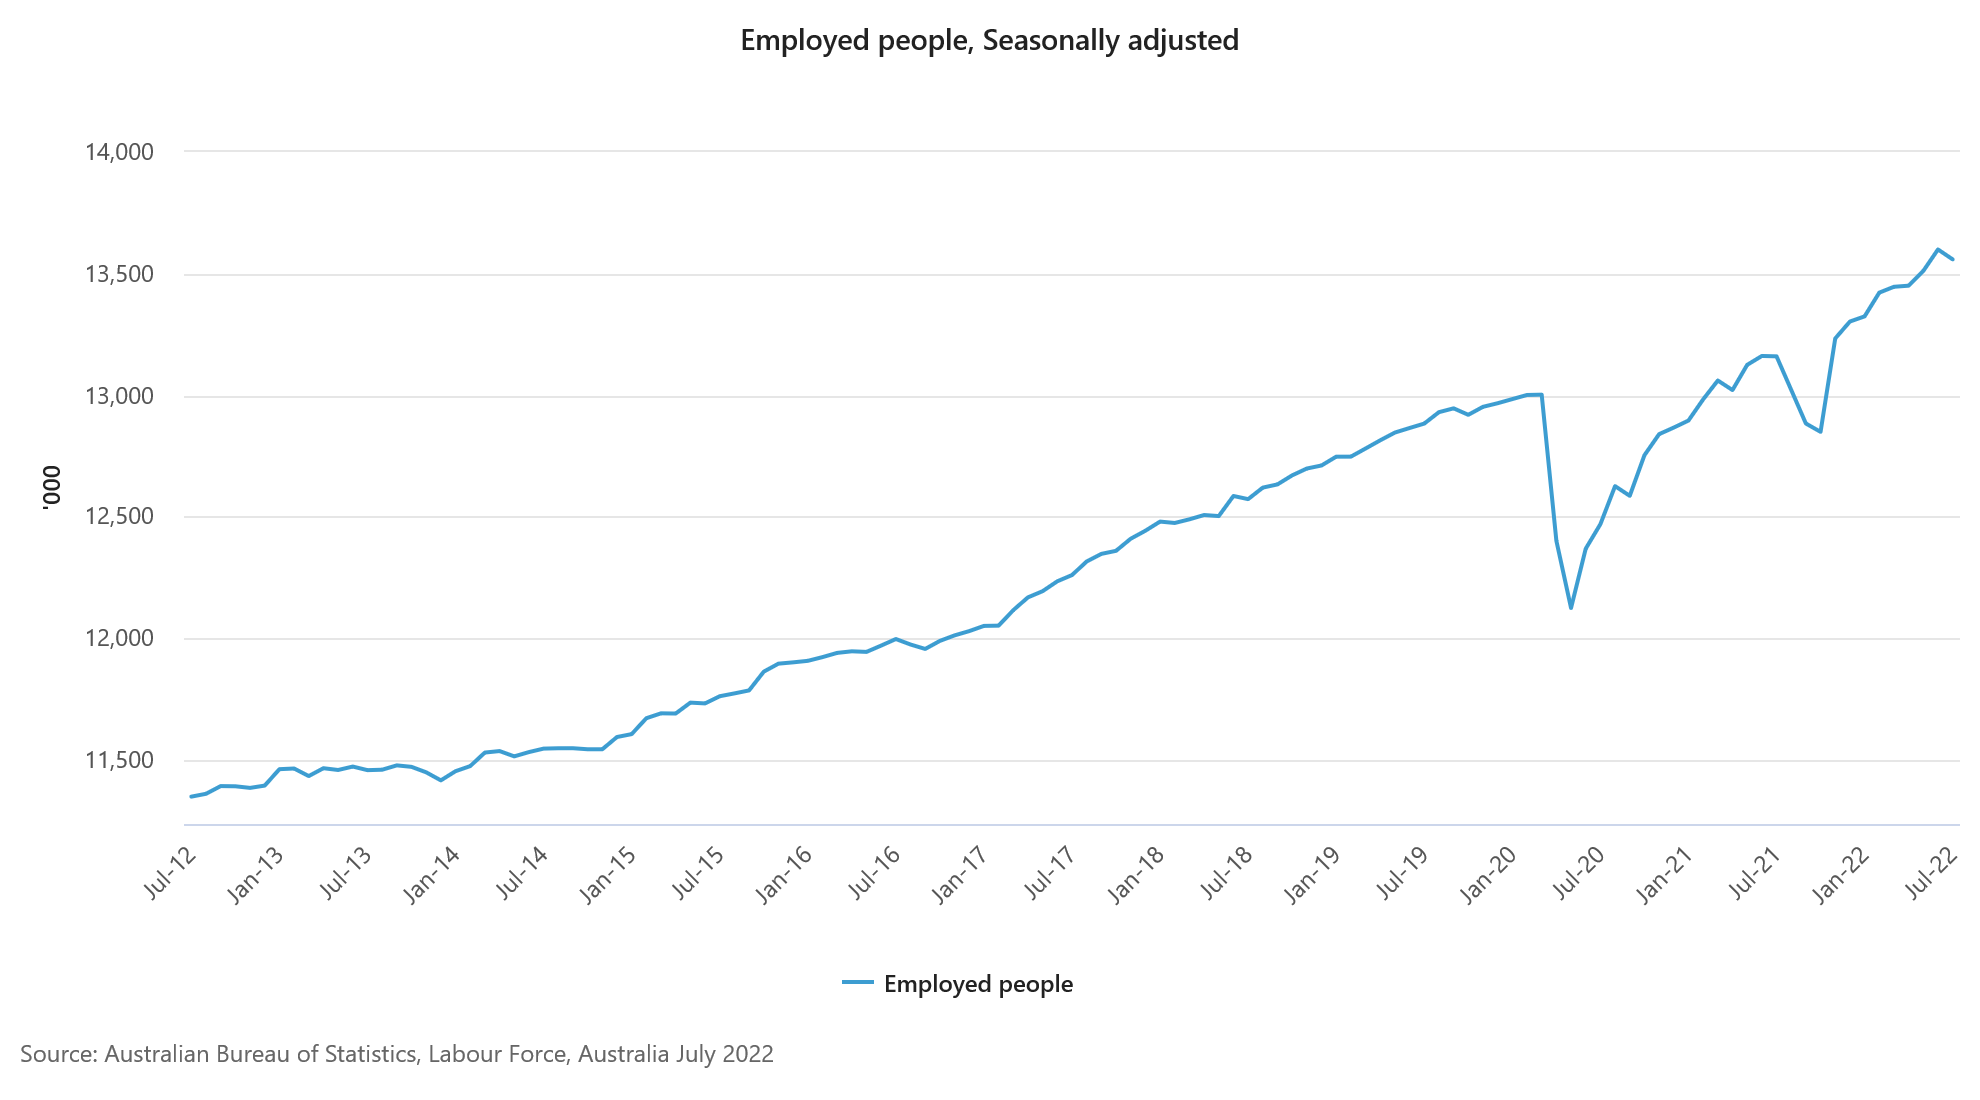
Australia employment contracted -40.9k in July, much worse than expectation of 25.0k growth. Full time jobs decreased by 86.9k while part time jobs rose 46k.
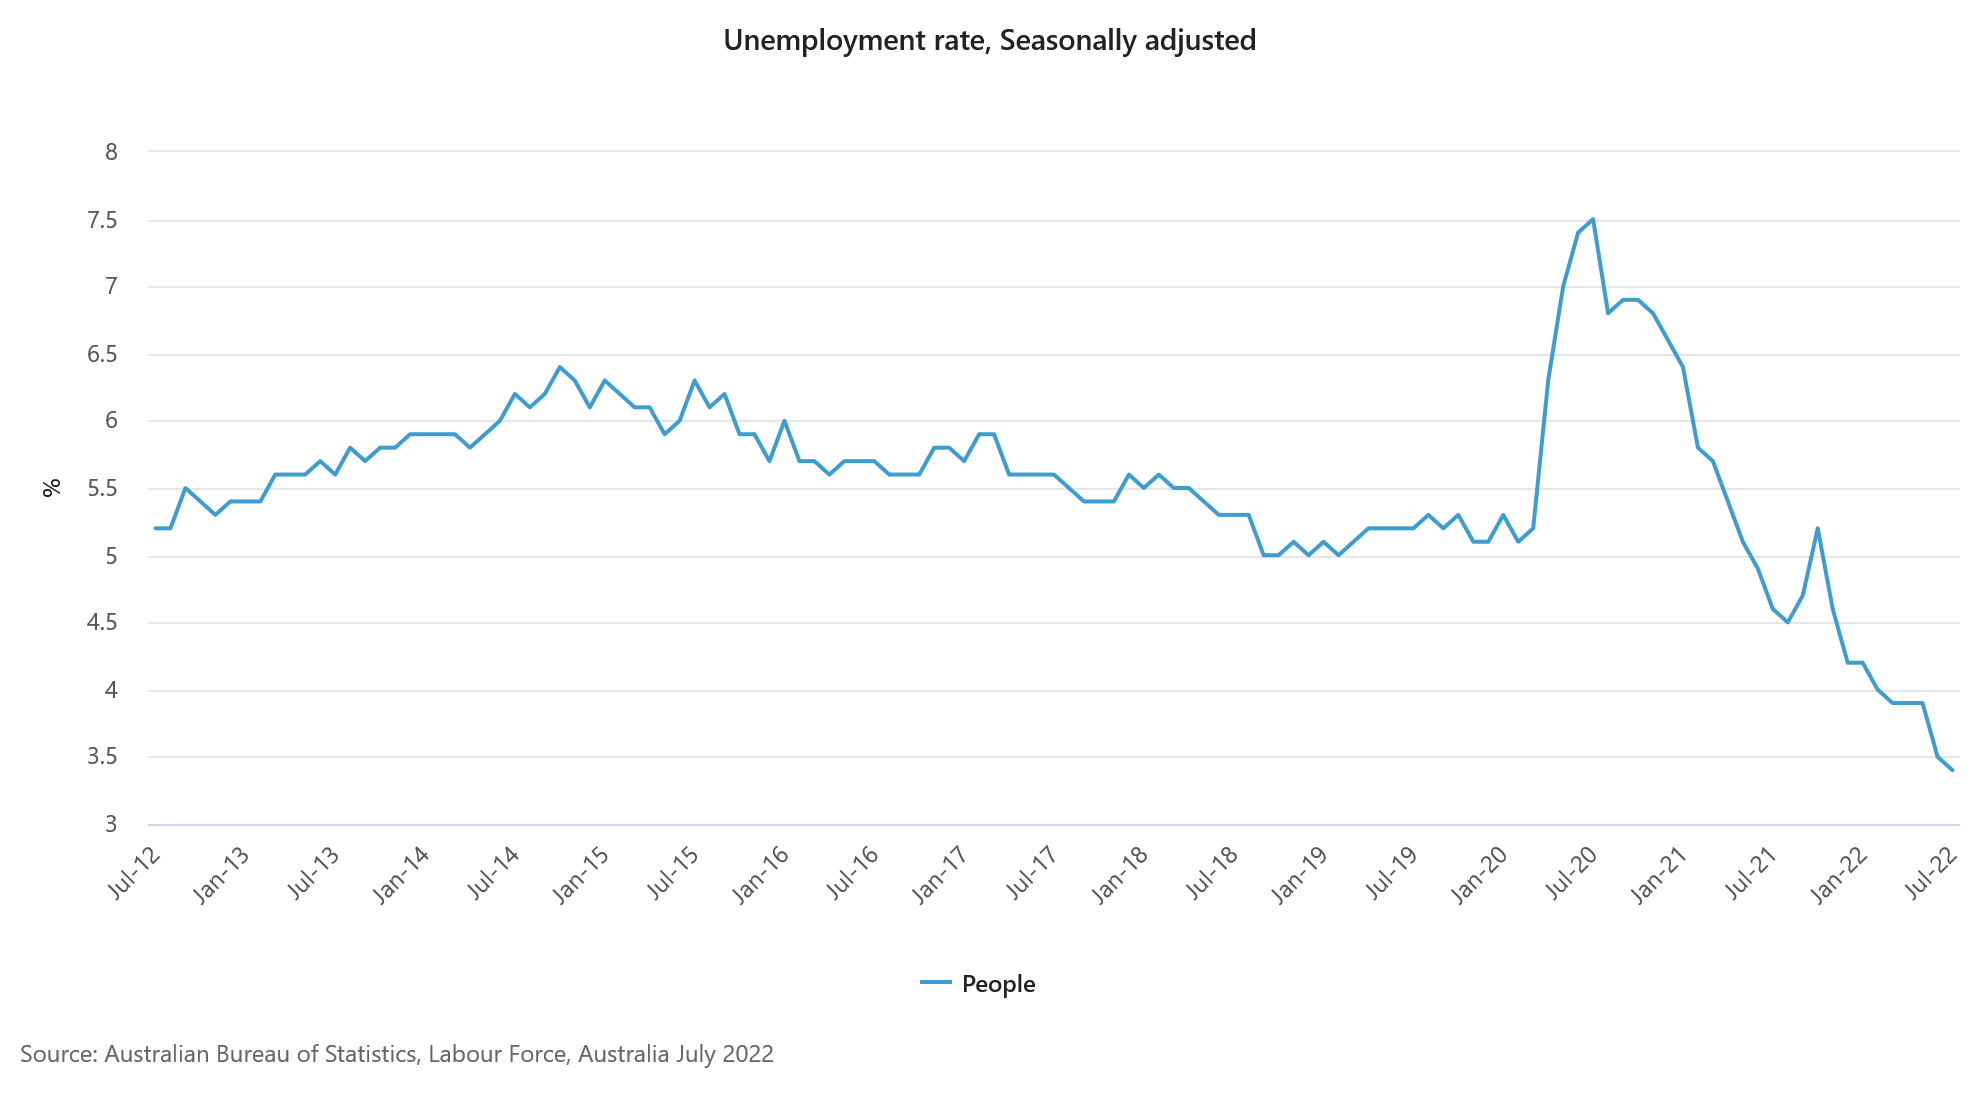
Unemployment rate dropped from 3.5% to 3.4%. Participation rate dropped notably from 66.8% to 55.4%. Monthly hours worked in all jobs dropped -16m hours, or -0.8% mom.
"The fall in unemployment in July reflects an increasingly tight labour market, including high job vacancies and ongoing labour shortages, resulting in the lowest unemployment rate since August 1974," Bjorn Jarvis, head of labour statistics at the ABS, said.
RBNZ Orr: Monetary policy was too loose for a period
RBNZ Governor Adrian Orr told a parliamentary committee, "our core inflation is too high and that suggests at some point monetary policy was too loose for a period."
"I have already apologized for the current level of inflation. I have already said that the Reserve Bank was party to that," he added.
However, "the worst mistake we could be having would be fighting deflation, unnecessary unemployment and economic collapse," he said. "We have ended up with the better problem -- but it is a problem -- which is inflation, core inflation of 4-6% that we need to put back in the bottle."
Looking ahead
Swiss trade balance and Eurozone CPI final will be released in European session. Later in the day, Canada will release IPPI and RMPI. US will release jobless claims, Philly Fed survey and existing home sales.
AUD/USD Daily Report
Daily Pivots: (S1) 0.6889; (P) 0.6959; (R1) 0.7008; More...
AUD/USD's fall from 0.7135 is still in progress and intraday bias stays mildly on the downside for 0.6868 support. Firm break there argue that whole rebound from 0.6680 is finished, and bring retest of 0.6680 low. On the upside, above 0.7030 minor resistance will turn intraday bias neutral first.
In the bigger picture, price actions from 0.8006 (2021 high) is seen more as a corrective pattern to rise from 0.5506 (2020 low). Or it could be a bearish impulsive move. In either case, outlook will remain bearish as long as 0.7282 resistance holds. Next target is 61.8% retracement of 0.5506 to 0.8006 at 0.6461.
Economic Indicators Update
| GMT | Ccy | Events | Actual | Forecast | Previous | Revised |
|---|---|---|---|---|---|---|
| 01:30 | AUD | Employment Change Jul | -40.9K | 25.0K | 88.4K | |
| 01:30 | AUD | Unemployment Rate Jul | 3.40% | 3.50% | 3.50% | |
| 06:00 | CHF | Trade Balance (CHF) Jul | 3.55B | 3.80B | ||
| 09:00 | EUR | Eurozone CPI Y/Y Jul F | 8.90% | 8.90% | ||
| 09:00 | EUR | Eurozone CPI Core Y/Y Jul F | 4.00% | 4.00% | ||
| 12:30 | CAD | Industrial Product Price M/M Jul | -1.10% | |||
| 12:30 | CAD | Raw Material Price Index Jul | -0.10% | |||
| 12:30 | USD | Initial Jobless Claims (Aug 12) | 261K | 262K | ||
| 12:30 | USD | Philadelphia Fed Manufacturing Survey Aug | -6.2 | -12.3 | ||
| 14:00 | USD | Existing Home Sales Jul | 4.85M | 5.12M | ||
| 14:30 | USD | Natural Gas Storage | 38B | 44B |
Australia lost -40.9k jobs, but unemployment rate dropped to 3.4%
Australia employment contracted -40.9k in July, much worse than expectation of 25.0k growth. Full time jobs decreased by 86.9k while part time jobs rose 46k.
Unemployment rate dropped from 3.5% to 3.4%. Participation rate dropped notably from 66.8% to 55.4%. Monthly hours worked in all jobs dropped -16m hours, or -0.8% mom.
"The fall in unemployment in July reflects an increasingly tight labour market, including high job vacancies and ongoing labour shortages, resulting in the lowest unemployment rate since August 1974," Bjorn Jarvis, head of labour statistics at the ABS, said.
RBNZ Orr: Monetary policy was too loose for a period
RBNZ Governor Adrian Orr told a parliamentary committee, "our core inflation is too high and that suggests at some point monetary policy was too loose for a period."
"I have already apologized for the current level of inflation. I have already said that the Reserve Bank was party to that," he added.
However, "the worst mistake we could be having would be fighting deflation, unnecessary unemployment and economic collapse," he said. "We have ended up with the better problem -- but it is a problem -- which is inflation, core inflation of 4-6% that we need to put back in the bottle."
Technical Outlook and Review
USD/JPY:
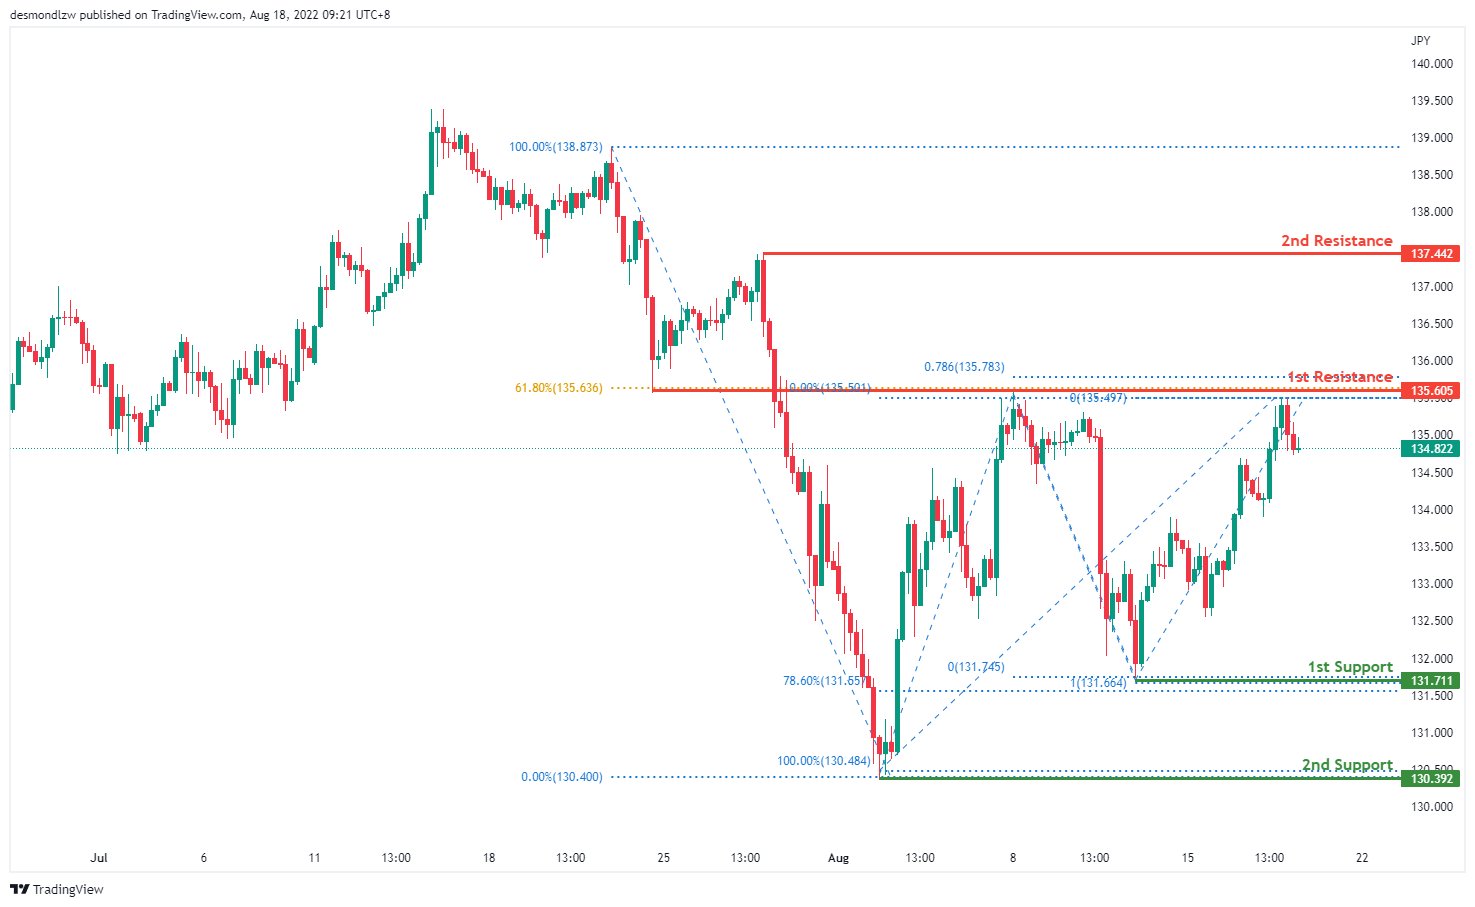
On the H4 chart, prices seem to have pulled back a little but the overall trend is still bearish biased. Price has broken the intermediate resistance at 133.908 which is the 50% Fibonacci retracement and is now testing the first resistance at 135.605 where the previous swing high. 61.8% fibonacci retracement and 78.6% projection sits.If the bearish momentum continues it will pull back to test the first support at 131.711 where the 78.6% retracement and 100% projection sits
Areas of consideration:
- H4 time frame, 1st resistance at 135.605
- H4 time frame, 1st support at 131.711
DXY:
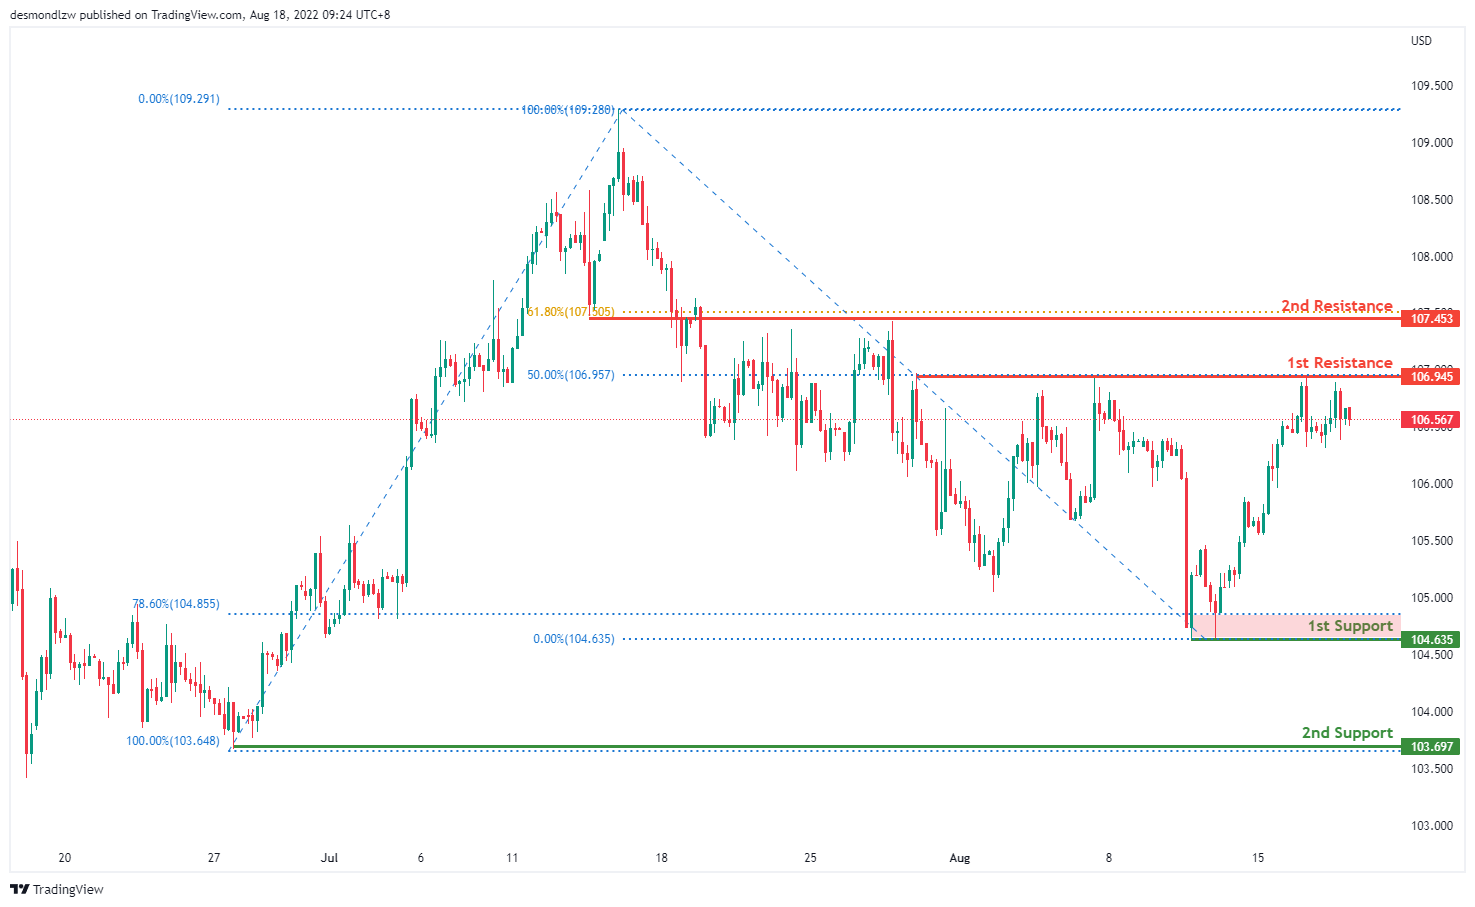
On the H4, prices seem to be moving in an ascending trend and is in a bullish momentum. Price is now around the first resistance at 106.945 where the 50% Fibonacci retracement and the previous swing high sits. We’re looking for price to test the first resistance again and if price continues with bullish momentum, it will test the second resistance at 107.453 where the 61.8% fibonacci retracement sits. If fails to break the first resistance, it will pull back to test the first support at 104.635 where the 78.6% retracement is and subsequently the second support at 103.697 which is the previous swing low
Areas of consideration:
- H4 time frame, 1st resistance at 106.945
- H4 time frame, 1st support at 104.635
EUR/USD :
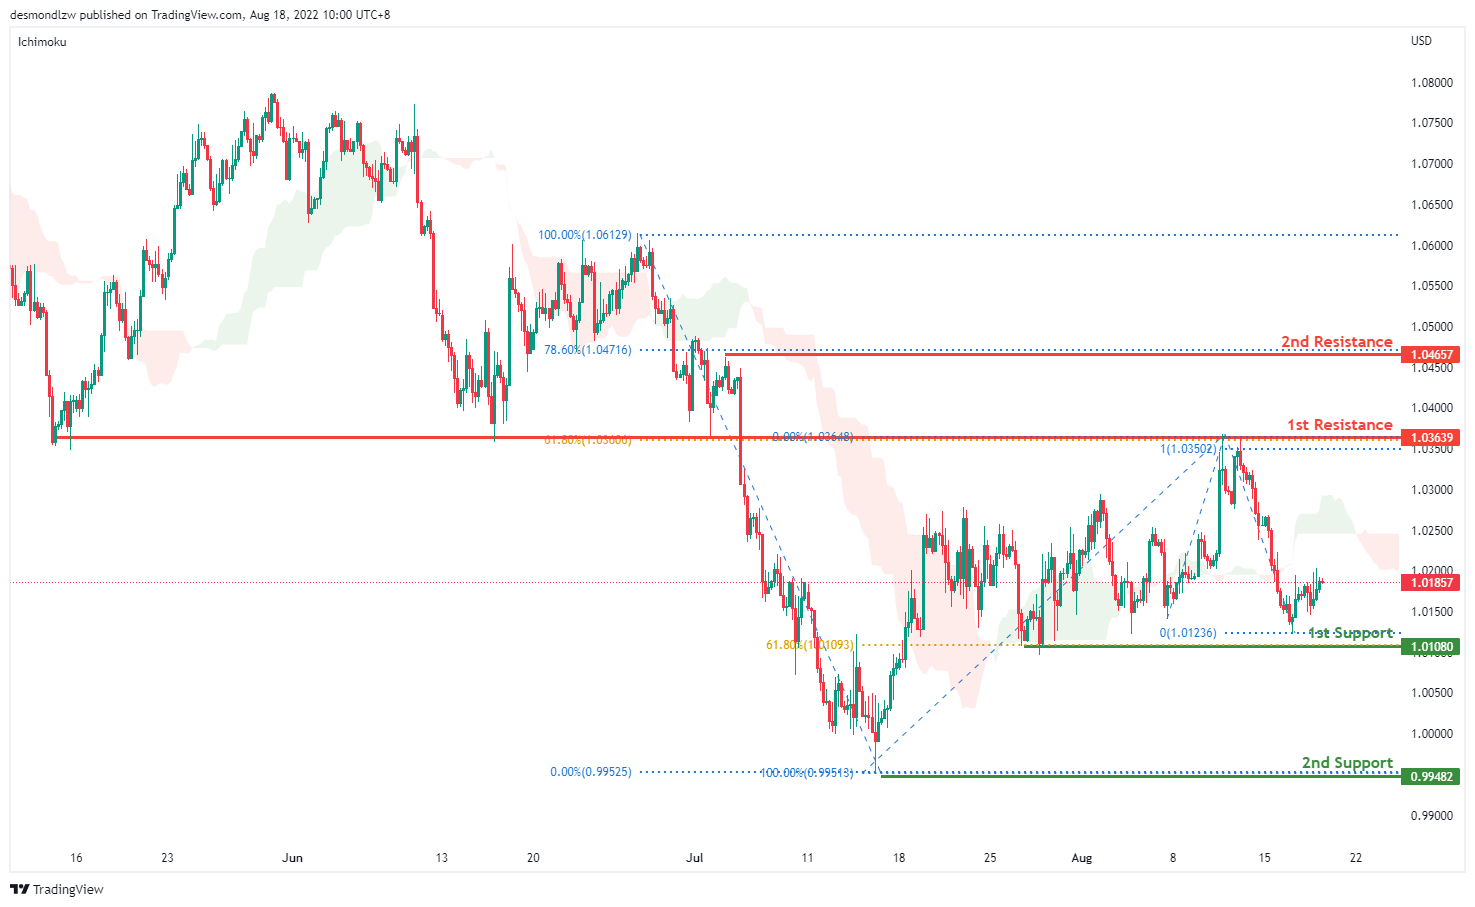
On the H4, prices have broken the ascending trend and are below the ichimoku indicator, we are bearish bias. Prices have ascended slightly but we’re looking for a pull back to test the first support at 1.0108 where the 61.8% Fibonacci retracement sits. If prices continue in the bearish momentum, it will test the second support at 0.9948. Alternatively price could go back to test the first resistance at 1.0363 where the 61.8% Fibonacci retracement sits and then the second resistance at 1.0465
Areas of consideration :
- H4 1st resistance at 1.0363
- H4 1st support at 1.0108
GBP/USD:
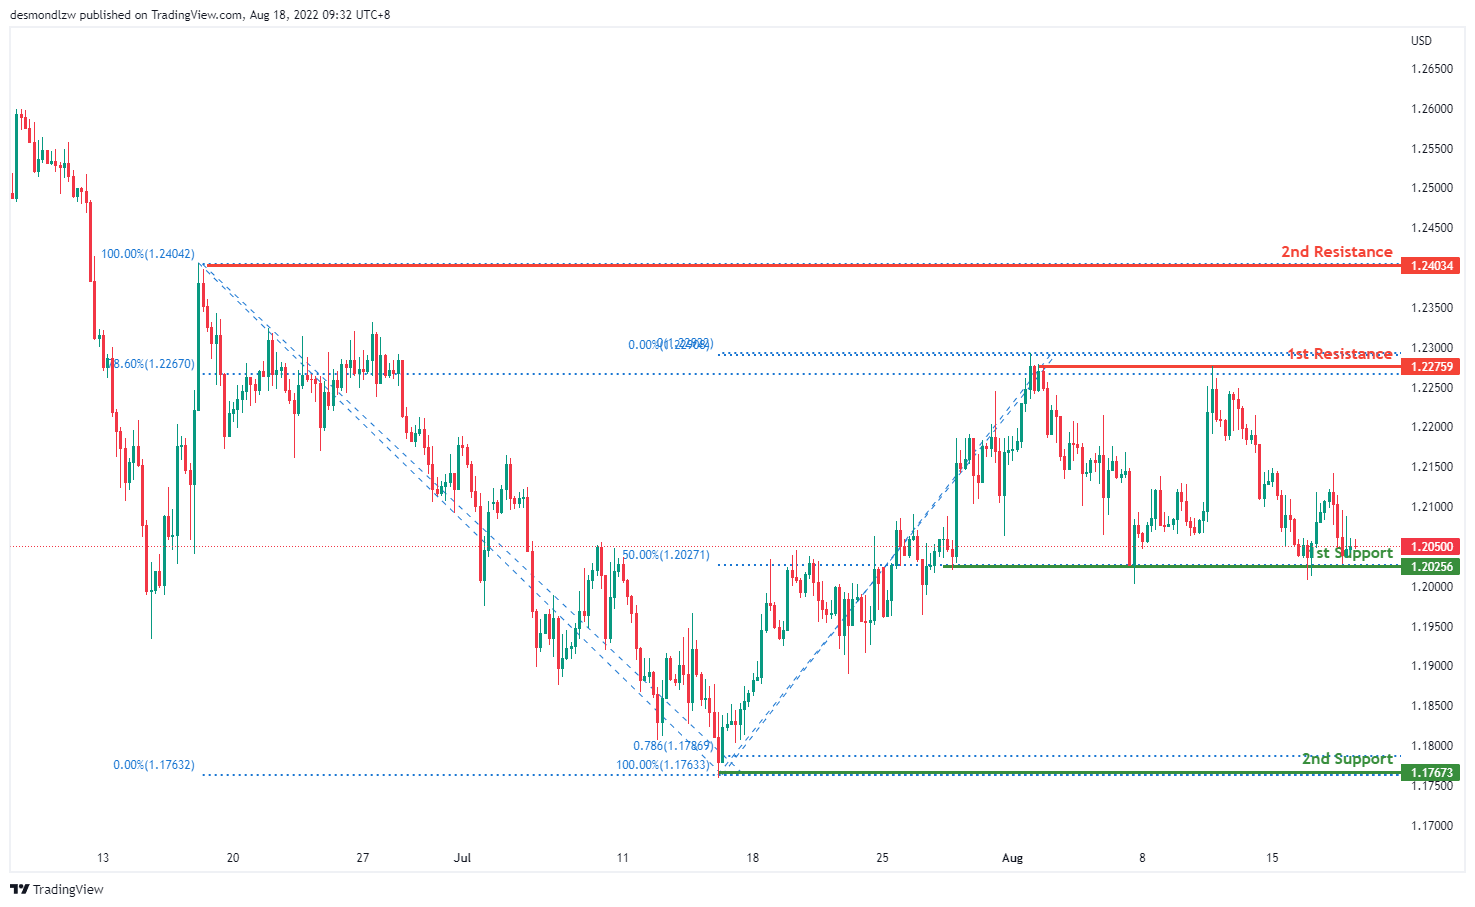
On the H4, prices seem to be in a bearish momentum. It is currently testing the 50% Fibonacci retracement and if the bearish momentum continues, it will pull prices to our first support 1.2025 where our swing low sits. If prices pull back further it will test the second support at 1.1767 where our 78.6% Fibonacci projection sits. Alternatively price could hit resistance at 1.2275 around the 78.6% projection and the first resistance at 1.2403 where the swing high sits
Areas of consideration:
- H4 1st resistance at 1.2275
- H4 1st support at 1.2025
USD/CHF:
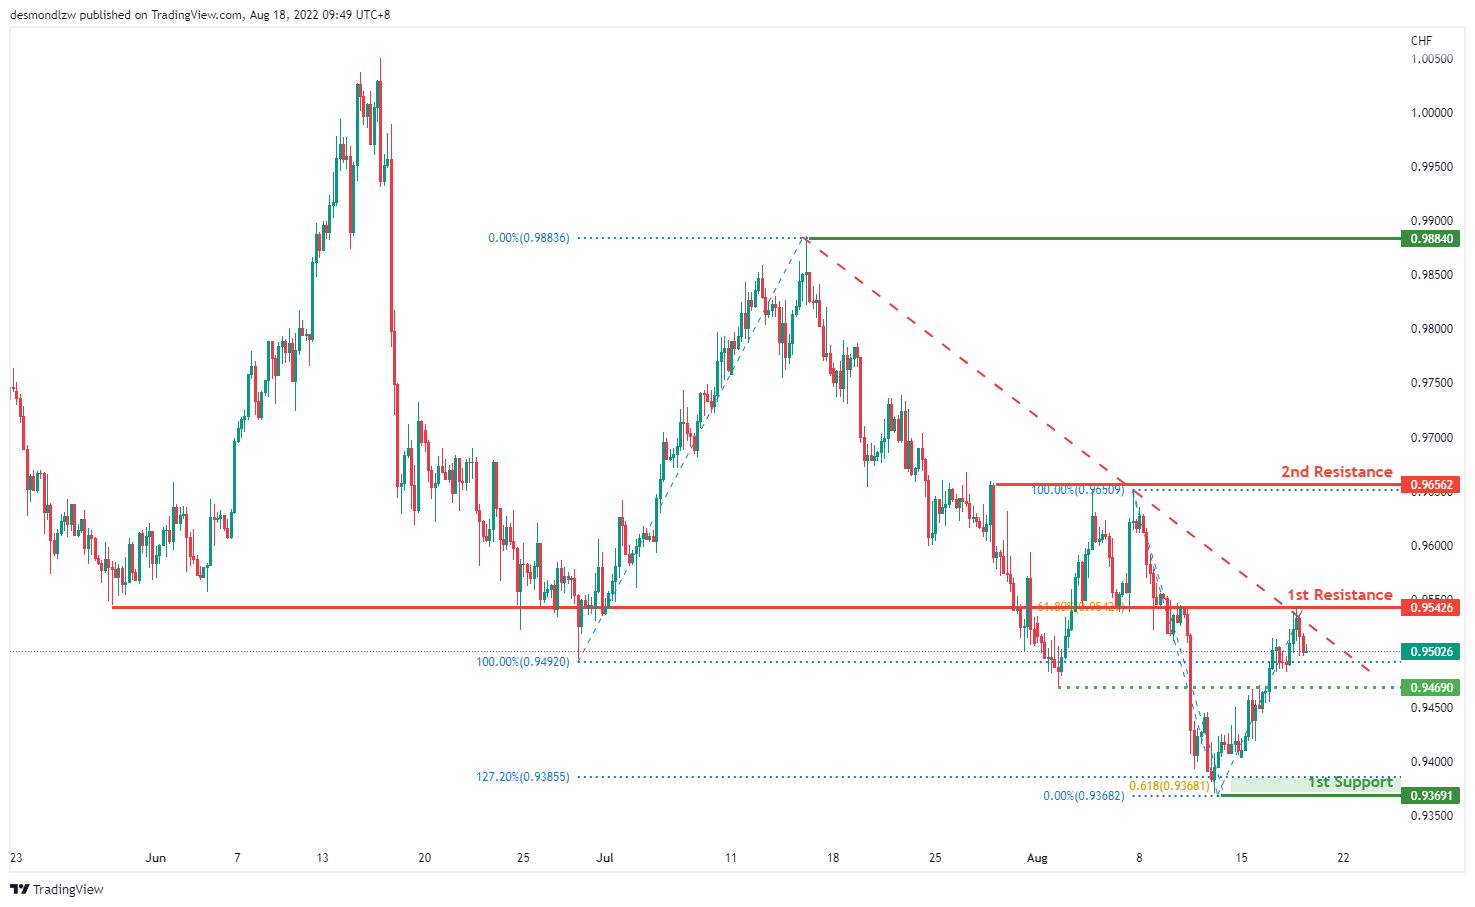
On the H4, with prices moving below the ichimoku cloud and along the descending trend, we are bearish bias that the price will continue with the bearish momentum. Price is now testing at the 61.8%% Fibonacci retracement and it may rise to test the first resistance at 0.9542 again. If bearish momentum continues, it should pull back to test at the intermediate support at 0.9468 where the previous swing low is then the first support at 0.9369 where the 61.8% projection and 127.2% extension sits
Areas of consideration
- H4 1st support at 0.9369
- H4 1st resistance at 0.9542
XAU/USD (GOLD):
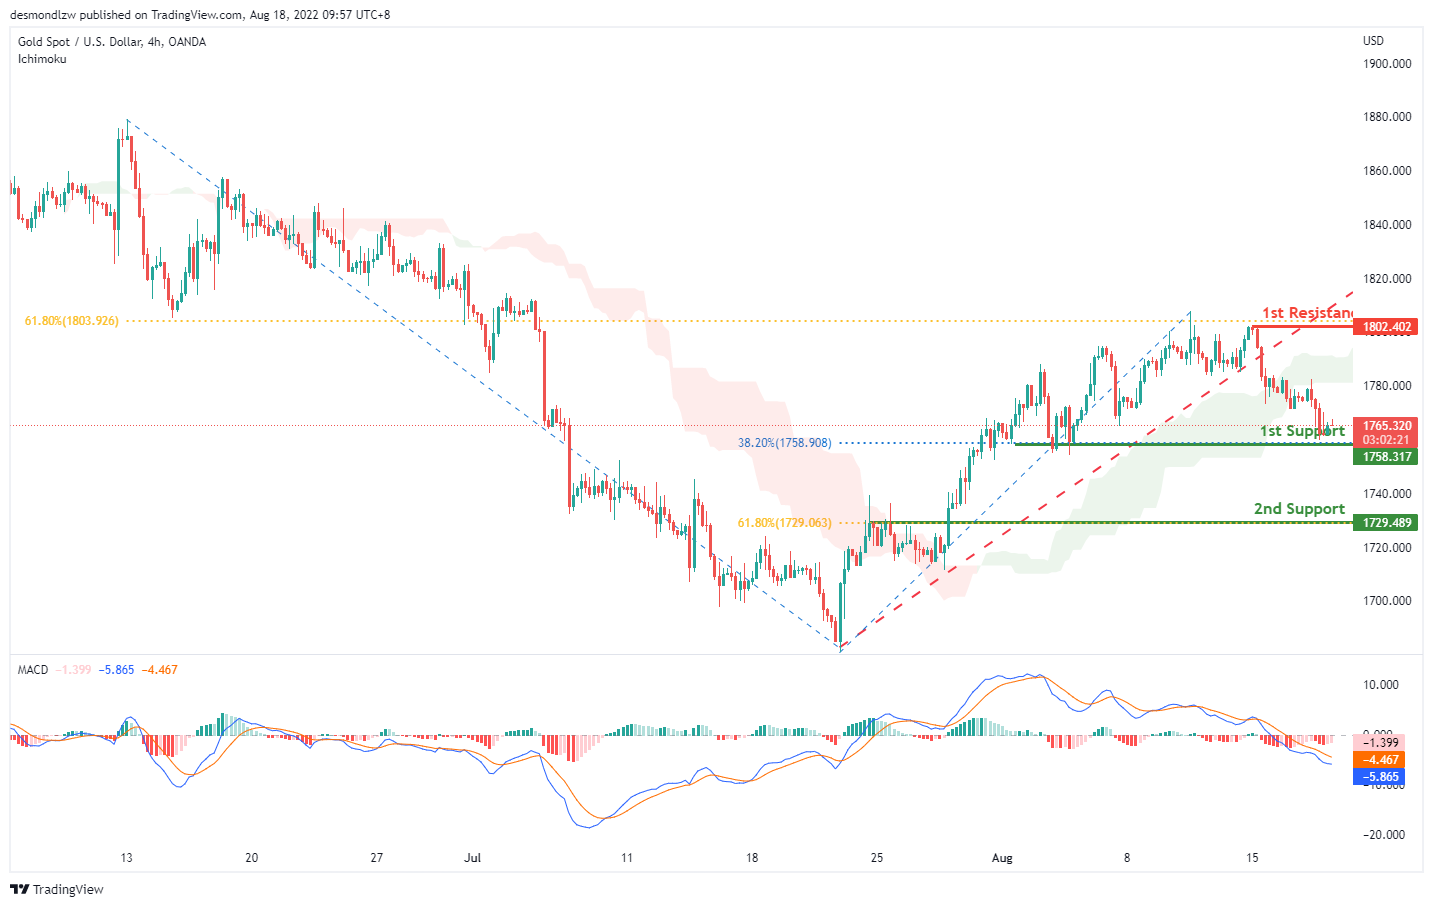
On the H4, with prices breaking the ascending trendline and MACD indicators are below zero, we have a bearish bias that the price may drop from the 1st support at 1758.317, which is in line with the overlap support to the 2nd support at 1729.489, which is in line with the pullback support and 61.8% fibonacci retracement. Alternatively, the price may rise to the 1st resistance at 1802.402, which is in line with the 61.8% fibonacci retracement and swing high.
Areas of consideration:
- H4 time frame, 1st support at 1758.317
- H4 time frame, 2nd support at 1729.489
AUD/USD:
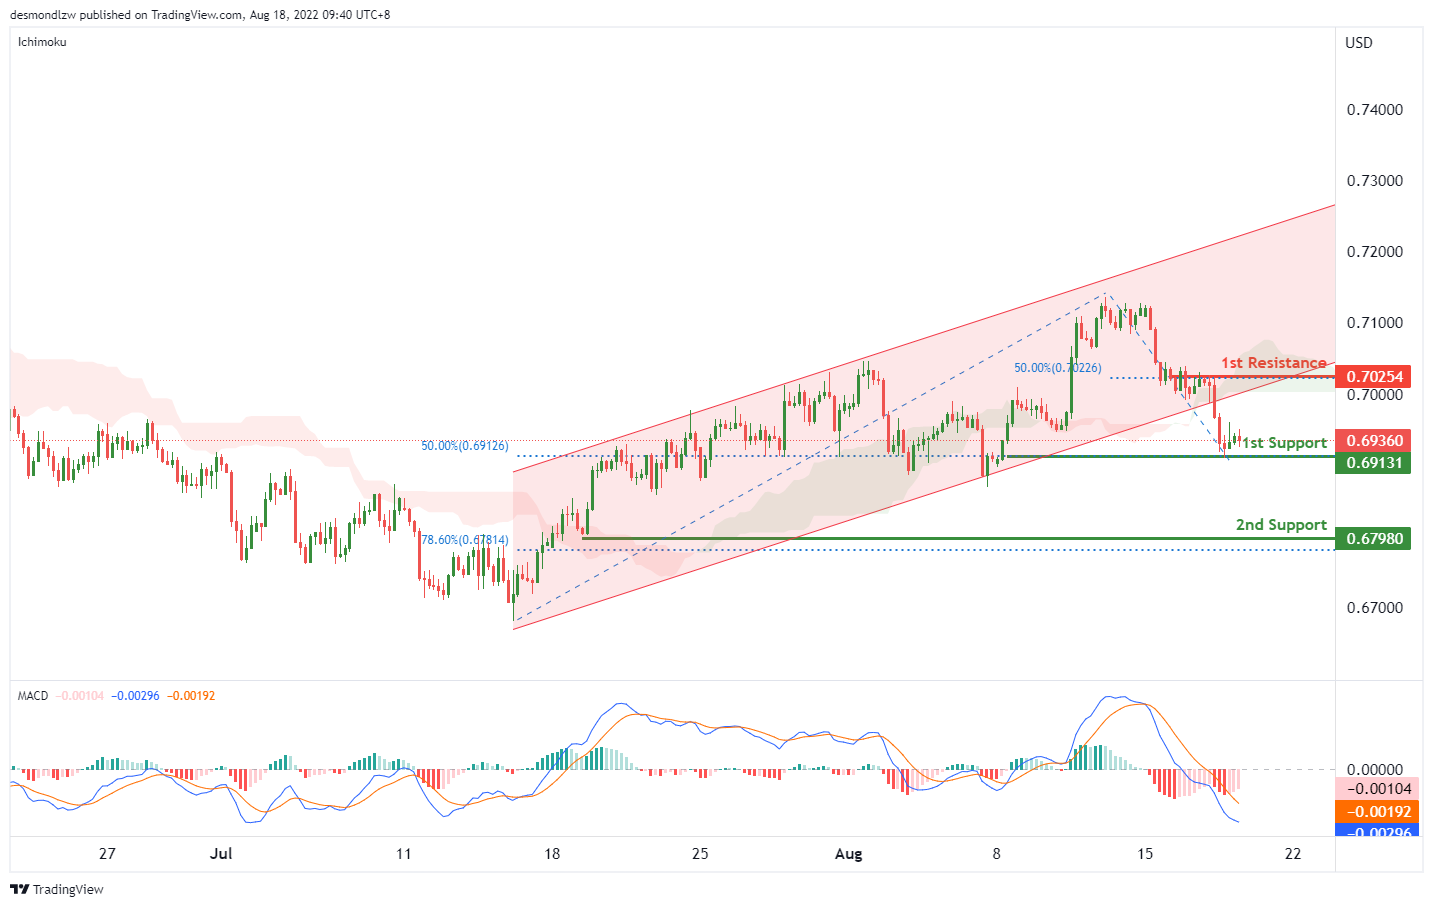
On the H4, with the MACD indicators are under zero, the price breaking the ascending channel and below the ichimoku cloud, we have a bearish bias that price may drop from the 1st support at 0.69131, where the 50% fibonacci retracement and pullback support are to the 2nd support at 0.67980, which is in line with the swing low and 78.6% fibonacci retracement. Alternatively, the price may rise to the 1st resistance at 0.70254 which is in line with 50% fibonacci retracement.
Areas of consideration
- H4 1st support at 0.69131
- H4 2nd support at 0.67980
NZD/USD:
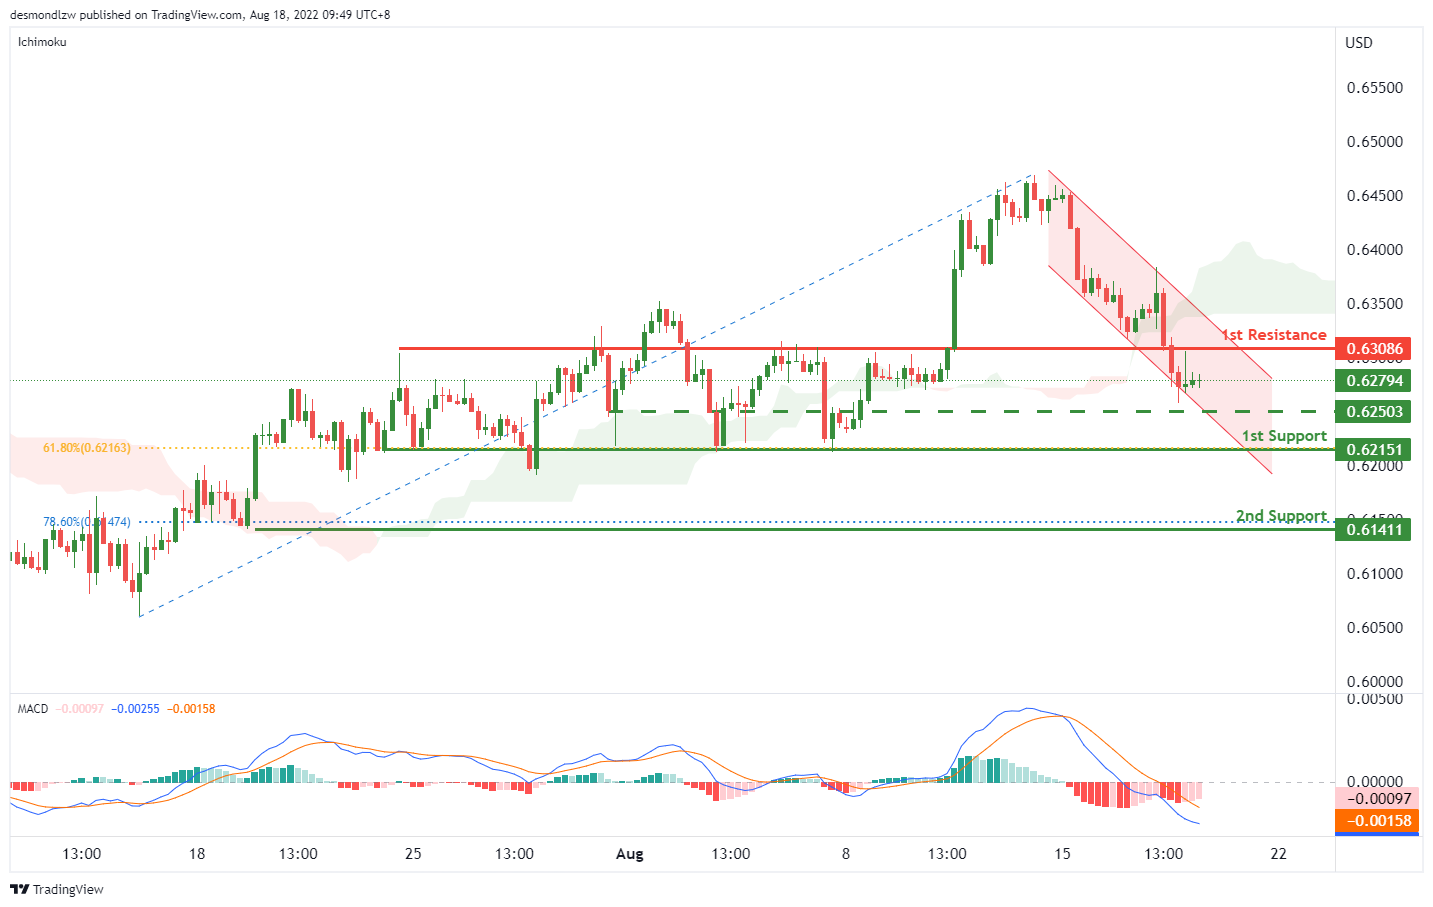
On the H4, with the price moving within the descending channel and below ichimoku cloud, we have a bearish bias that the price may drop to the 1st support at 0.62151, which is in line with the 61.8% fibonacci retracement and pervious swing lows, if the price continue dropping, the price may drop to the 2nd support at 0.61411, which is in line with the swing low and 78.6% fibonacci retracement. Alternatively, the price may rise to the 1st resistance at 0.63086, where the previous swing highs are.
Areas of consideration:
- H4 time frame, 1st support at 0.62151
- H4 time frame, 2nd support at 0.61411
USD/CAD:
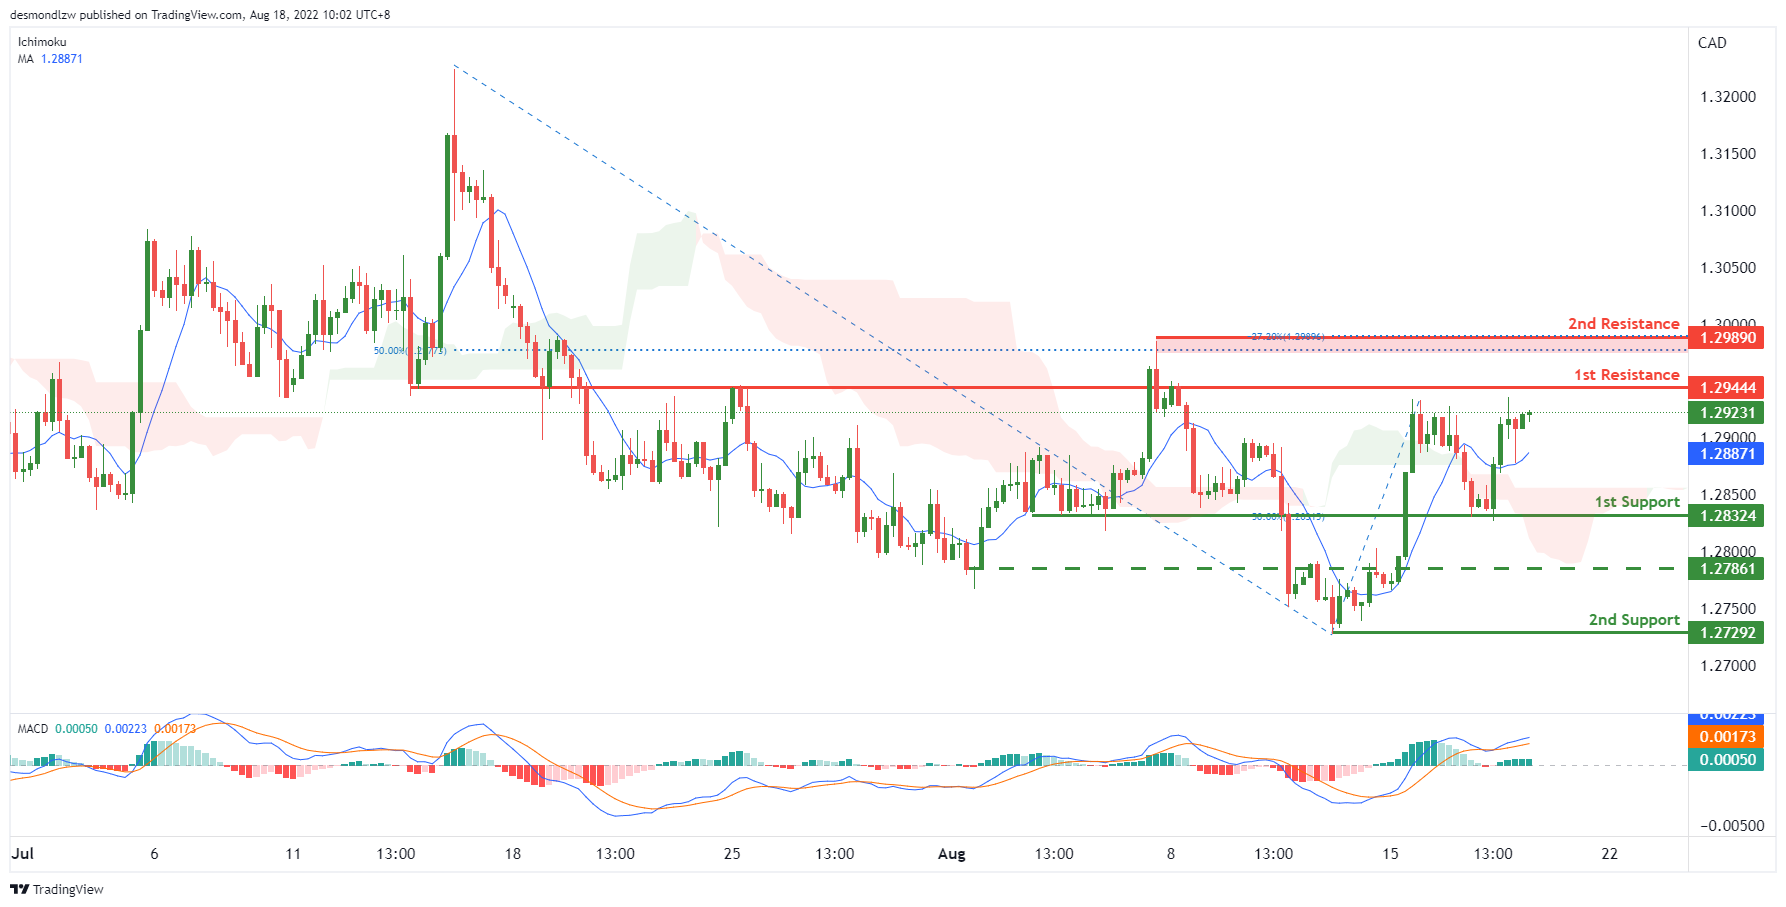
On the H4, with the MACD indicators above zero, the price is above the ichimoku cloud and MA, we have a bullish bias that the price may rise to the 1st resistance at 1.29444, which is the overlap resistance. If the price breaks the 1st resistance, it may rise to the 2nd resistance at 1.29890, where the swing high, -27.2% fibonacci expansion and 50% fibonacci retracement are. Alternatively, the piece may drop to the 1st support at 1.28324, where the swing low and 50% fibonacci retracement are. IF the price breaks the 1st support, we can expect the price drop down to the 2nd support at 1.27292, which is in line with the swing low. Take note the intermediate support at 1.27861, the price tested many times in this area.
Areas of consideration:
- H4 time frame, 1st resistance at 1.29444
- H4 time frame, 2nd resistance at 1.29890
OIL:
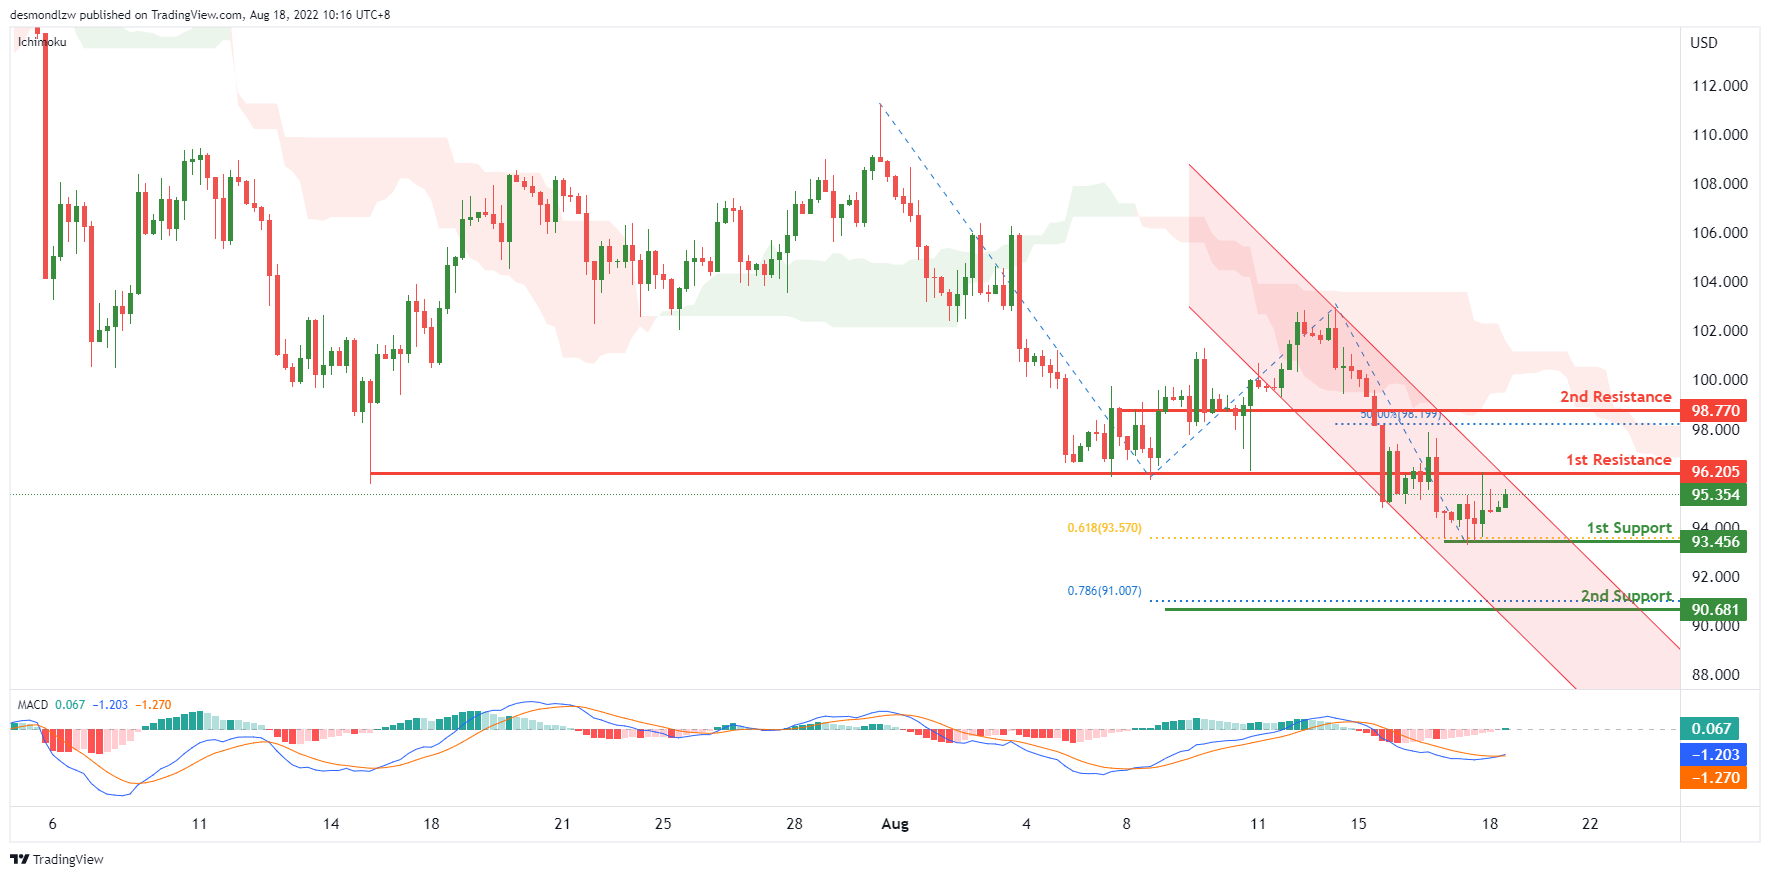
On the H4, with price moving within the descending channel, below ichimoku cloud and the MACD indicators are under zero, we have a bearish bias that the price may drop from our 1st support at 93.456, which is in line with the swing low and 61.8% fibonacci projection to the 2nd support at 90.681, which is in line with the 78.6% fibonacci projection. Otherwise, as the DIF is almost breaking the signal line, and the price is touching the upper boundary of the channel, if the price break the 1st resistance at 96.205, where the overlap resistance is , we can expect the price rise to the 2nd resistance at 98.770, where the 50% fibonacci retracement is.
Areas of consideration:
- H4 time frame, 1st support at 93.456
- H4 time frame, 2nd support at 90.681
Or
- H4 time frame, 1st resistance at 96.205
- H4 time frame, 2nd resistance at 98.770
Dow Jones Industrial Average:
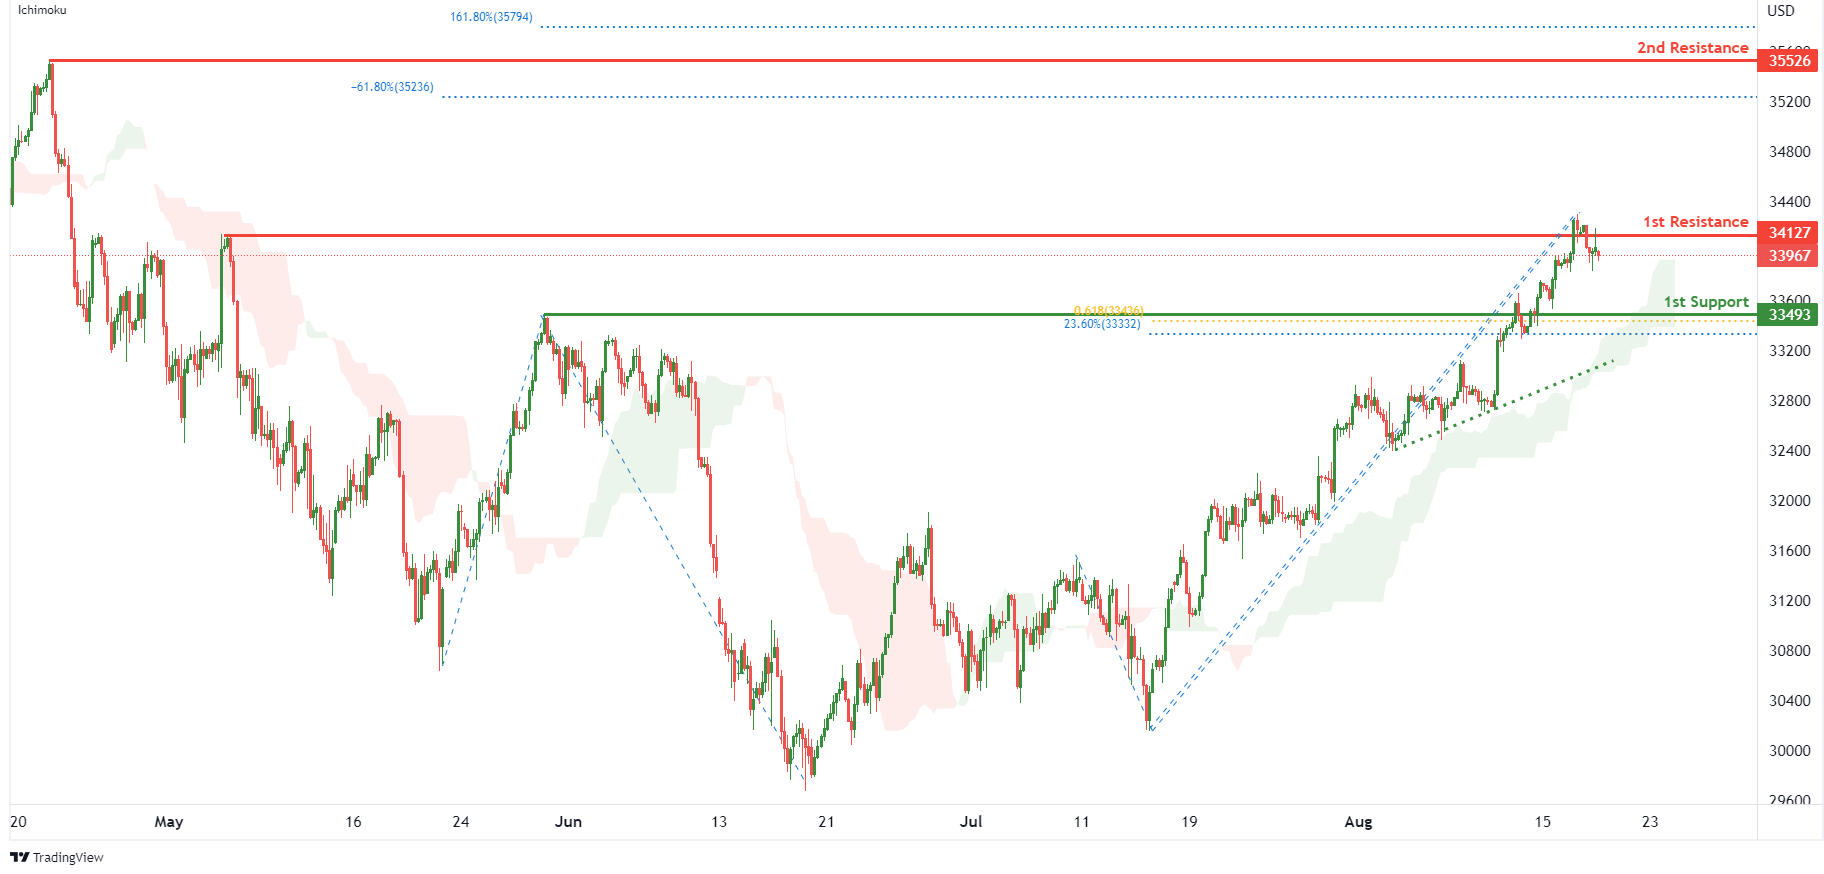
On the H4, with price moving above the ichimoku indicator and along an ascending trendline, we have a bullish bias that price will rise to 1st resistance at 34127 where the pullback resistance is. Once there is upside confirmation that price has broken 1st resistance structure, we would expect bullish momentum to carry price to 2nd resistance at 35526 where the swing high resistance, 161.8% fibonacci extension and -61.8% fibonacci expansion are. Alternatively, price could drop to 1st support at 33493 where the pullback support, 61.8% fibonacci projection and 23.6% fibonacci retracement are.
Areas of consideration:
- H4 time frame, 1st resistance of 34127
- H4 time frame, 1st support at 33493
DAX:
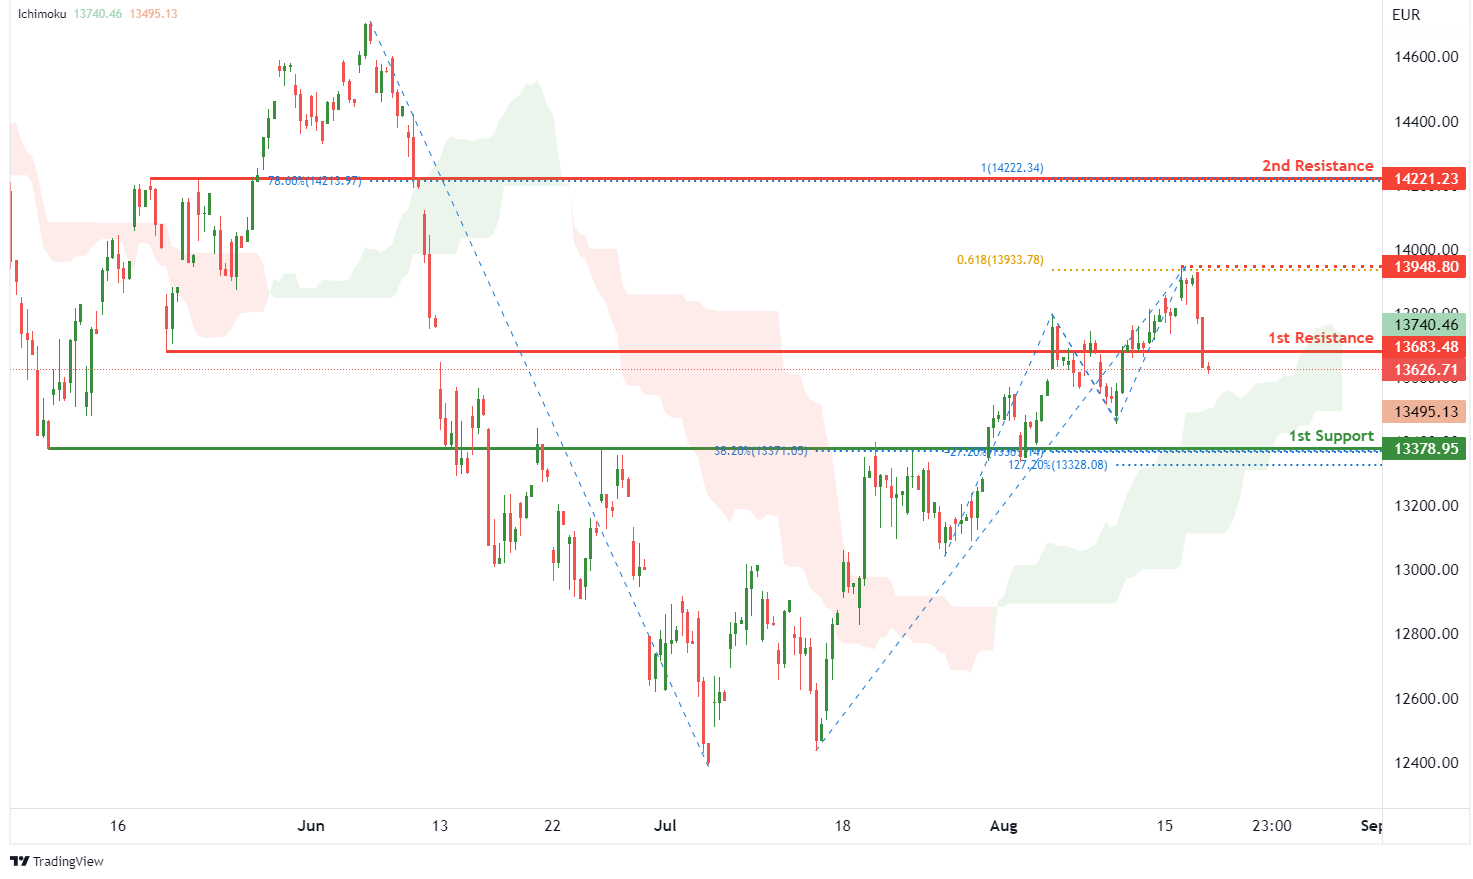
On the H4, with price moving above the ichimoku indicator, we have a bullish bias that price will rise to the 1st resistance at 13683.48 where the pullback resistance is. Once there is upside confirmation of price breaking the 1st resistance structure, we would expect price to rise to 2nd resistance at 14221.23 in line with 100% fibonacci projection and 78.6% fibonacci retracement. Take note of intermediate resistance at 13948.80 where the swing high resistance and 61.8% fibonacci projection are. Alternatively, price could drop to 1st support at 13378.95 where the overlap support, -27.2% fibonacci expansion, 127.2% fibonacci extension and 38.2% fibonacci retracement are
Areas of consideration:
- H4 time frame, 1st resistance of 13683.48
- H4 time frame, 1st support at 13378.95
ETHUSD:
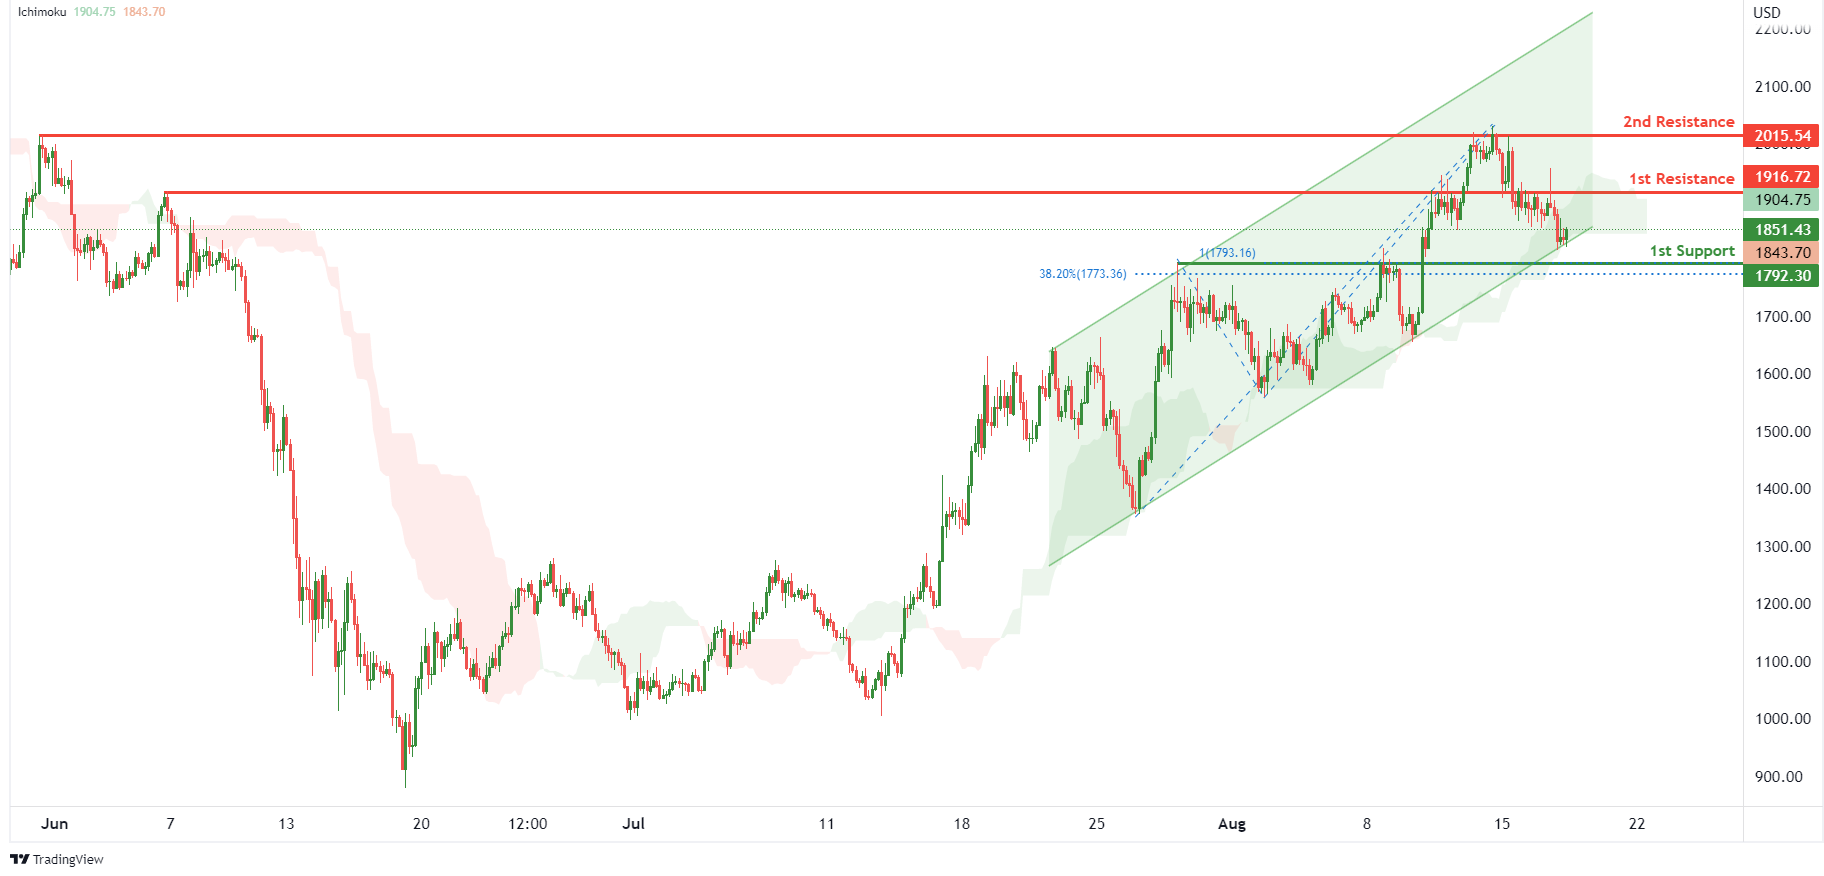
On the H4, with price moving within an ascending channel and bouncing off the ichimoku support, we have a bullish bias that price will rise to the 1st resistance at 1916.72 where the pullback resistance is. Once there is upside confirmation that price has broken 1st resistance structure, we would expect bullish momentum to carry price to 2nd resistance at 2015.54 where the swing high resistance is. Alternatively, price could drop to 1st support at 1792.30 where the overlap support, 38.2% fibonacci retracement and 100% fibonacci projection are.
Areas of consideration:
- H4 time frame, 1st resistance of 1916.72
- H4 time frame, 1st support at 1792.30
BTCUSD:
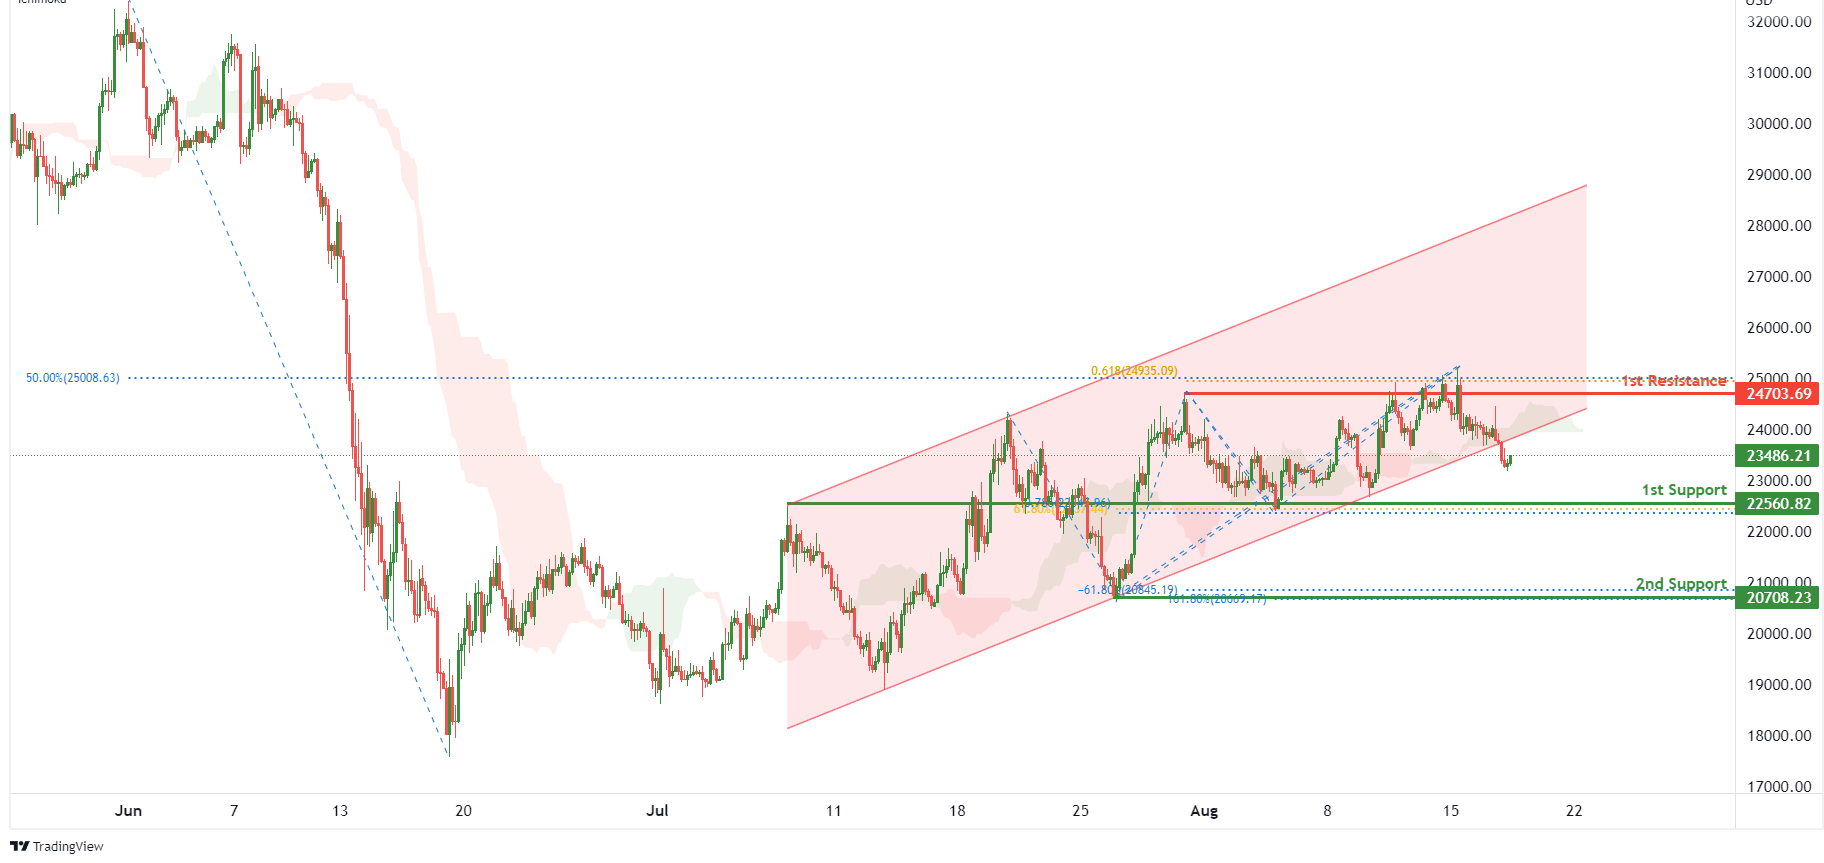
On the H4, with price breaking out of a bullish channel and moving below the ichimoku indicator, we have a bearish bias that price will drop to 1st support at 22560.82 where the pullback support, 61.8% fibonacci retracement and 78.6% fibonacci projection are. Once we have downside confirmation of price breaking 1st support structure,we would expect bearish momentum to carry price to 2nd support at 20708.23 where the -61.8% fibonacci expansion, 161.8% fibonacci extension and swing low support are. Alternatively, price could rise to 1st resistance at 24703.69 where the pullback resistance, 50% fibonacci retracement and 61.8% fibonacci projection are.
Areas of consideration:
- H4 time frame, 1st resistance of 24703.69
- H4 time frame, 1st support at 22560.82
S&P 500:
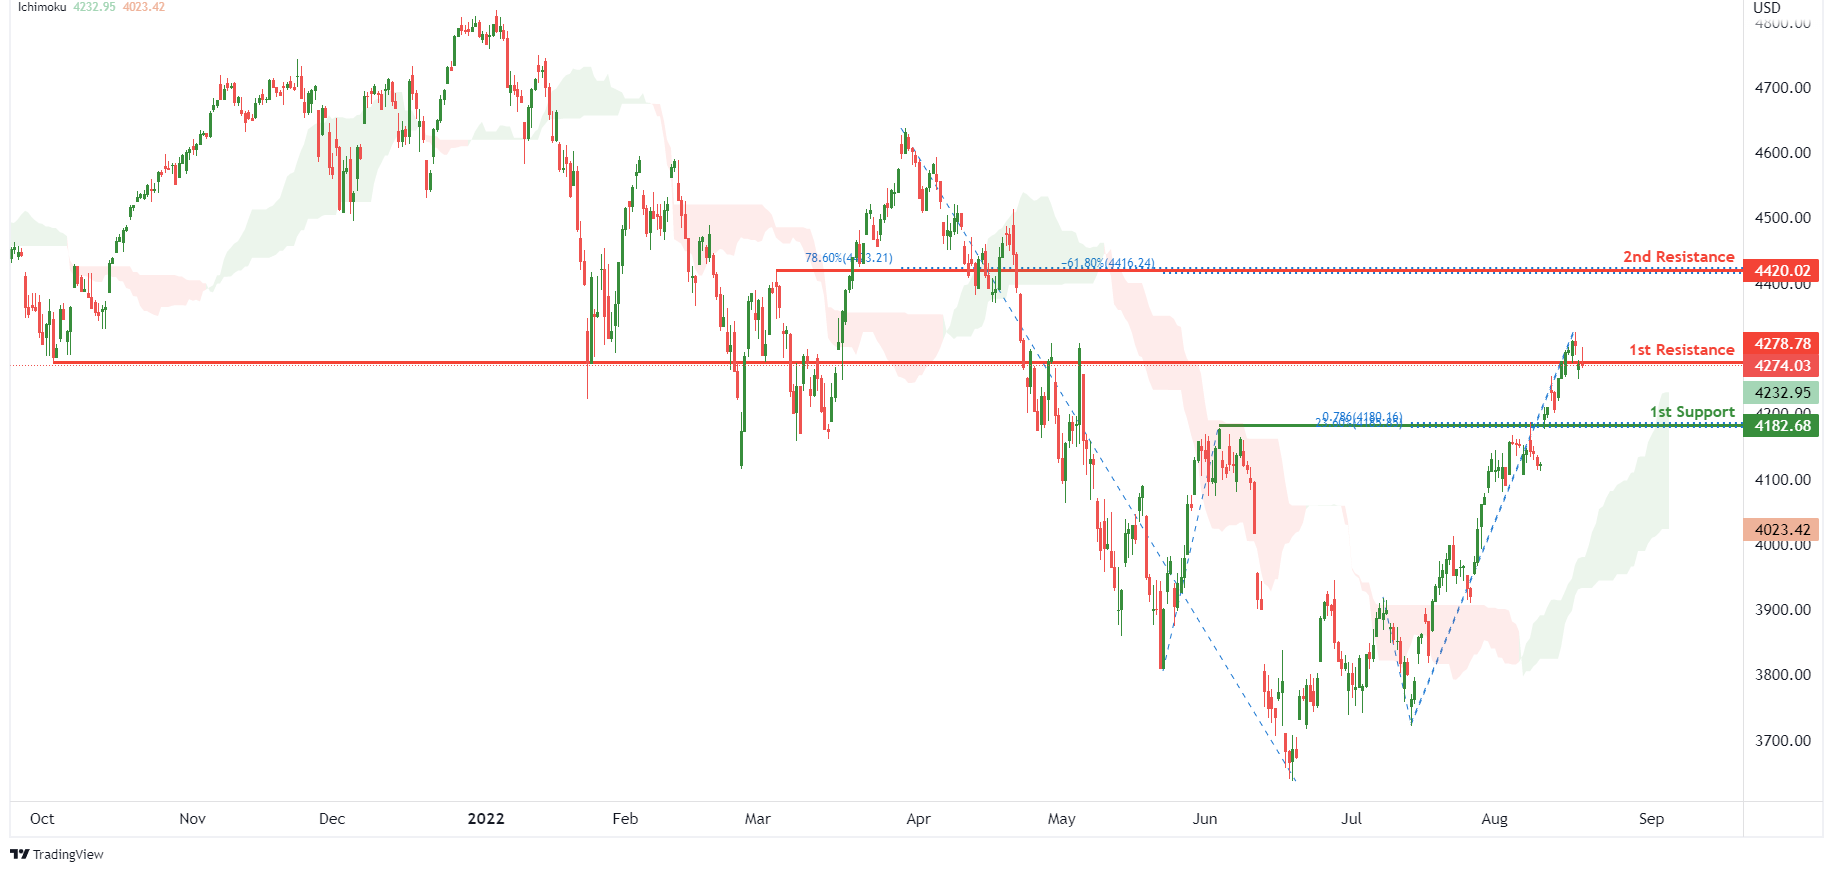
On the H4, with prices moving above the ichimoku indicator, we have a bullish bias that the price will rise to 1st resistance at 4278.78 where the overlap resistance is. Once there is upside confirmation that price has broken the 1st resistance structure, we would expect bullish momentum to carry price to 2nd resistance at 4420.02 where the pullback resistance, 78.6% fibonacci retracement and -61.8% fibonacci expansion are. Alternatively, price could drop to 1st support at 4182.68 where the pullback support, 78.6% fibonacci projection and 23.6% fibonacci retracement are.
Areas of consideration:
- H4 time frame, 1st resistance of 4278.78
- H4 time frame, 1st support at 4182.68
Crude Oil Price Drops To 6-Month Low, Upsides Limited
Key Highlights
- Crude oil price started a fresh decline from the $95.50 resistance.
- It is now facing hurdles near $89.50 and $90.00 on the 4-hours chart.
- Gold price corrected lower and traded below the $1,780 support.
- EUR/USD and GBP/USD remain at a risk of more losses.
Crude Oil Price Technical Analysis
After a minor recovery wave, crude oil price faced sellers near $95.50 against the US Dollar. The price started a fresh decline below the $92.50 support zone.
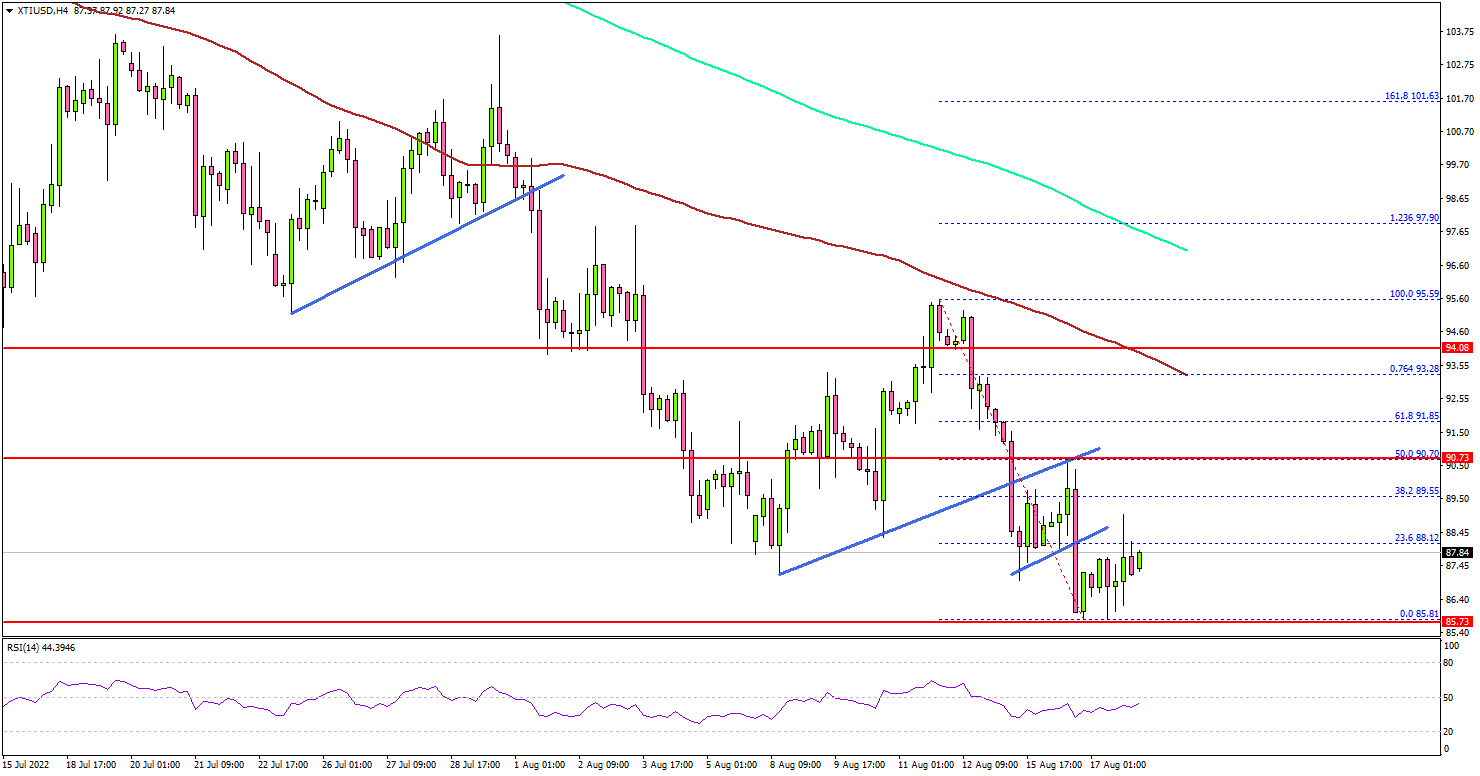
Looking at the 4-hours chart of XTI/USD, there was a break below the $92.00 and $90.00 levels. The price even settled below the $90 level, the 100 simple moving average (red, 4-hours) and the 200 simple moving average (green, 4-hours).
During the decline, the price traded below a couple of connecting trend lines at $89.50 and $88.10 on the same chart. The price traded as low as $85.81 and is currently consolidating losses.
On the upside, the price is facing resistance near the $89.50 and $90.00 levels. A clear move above the $90.00 resistance could set the pace for a larger increase towards $92.50. The next major resistance is near $95.50, above which the price could accelerate higher towards the $100 zone.
Conversely, the price might resume its decline below the $86.00 level. The next major support is near $85.50. The main support sits near $83.20, below which there is a risk of a move towards the $80.00 level. Any more losses might call for a test of the $78 zone.
Looking at the EUR/USD pair, the pair struggled to correct higher and there is a clear risk of a move below the 1.0100 support zone.
Economic Releases to Watch Today
- US Initial Jobless Claims - Forecast 265K, versus 262K previous.
- US Existing Home Sales for July 2022 (MoM) - Forecast -5.2%, versus -5.4% previous.
Fed Minutes Showed Continued Commitment to Bringing Inflation Back to Target
The minutes from the July 26-27, 2022 Federal Open Market Committee (FOMC) meeting showed that curtailing inflation remains of paramount importance to the Fed.
On the progression of the economy, the Committee members noted that "recent indicators of spending and production had softened. Nonetheless, job gains had been robust in recent months, and the unemployment rate had remained low. Inflation remained elevated, reflecting supply and demand imbalances related to the pandemic, higher food and energy prices, and broader price pressures."
The Committee also stated that "inflation remained unacceptably high and was well above the Committee’s longer run goal of 2 percent." Additionally, participants noted that increases in inflation were broad based and that they have seen little evidence that inflation has begun to abate.
Members of the Committee stated that "the war and related events were creating additional upward pressure on inflation and were weighing on global economic activity."
Committee members anticipated that "ongoing increases in the target range for the federal funds rate would be appropriate to achieve the Committee’s objectives." Nevertheless, the pace and extent of future policy tightening would depend on the prevailing macroeconomic backdrop.
For the first time FOMC members acknowledged that "the constantly changing nature of the economic environment and the existence of long and variable lags in monetary policy’s effect on the economy, there was also a risk that the Committee could tighten the stance of policy by more than necessary to restore price stability."
Key Implications
The minutes confirmed that re-establishing price stability remains the principal objective of the Fed. The uncertainty surrounding the Russia-Ukraine conflict will only add to the upside risk. Additionally, the labor market has continued to strengthen, with employment having surpassed pre-pandemic levels and the unemployment rate on par with its February 2020 level. The Fed also acknowledged that their task is highly uncertain, and there is a risk that it could tighten rates by "more than necessary".
Markets have been worried about exactly that risk. Recession fears have continued to mount, with some surveys showing that the probability of a recession within the next 12-months has increased to 50%. These fears have also been reflected in the spread between the U.S. 10-year and 2-year treasury yields, which remains in negative territory. We expect the Fed will continue to raise rates this year, before taking a pause to monitor the impacts of its actions on economic activity and inflation.
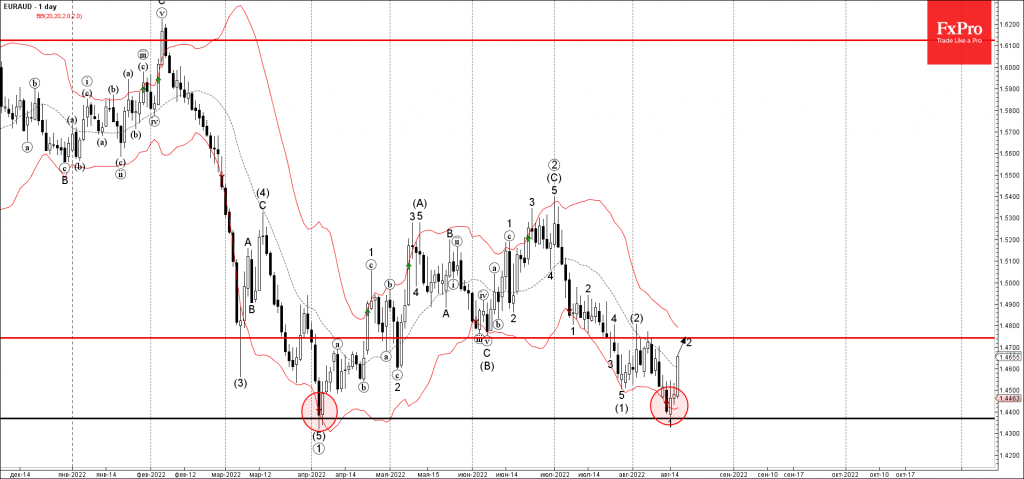
EURAUD Wave Analysis
- EURAUD reversed from support level 1.44
- Likely to rise to resistance level 1.4740
EURAUD currency pair recently reversed up sharply from the powerful support level 1.4400 (which previous stopped the sharp downtrend in April, as can be seen below).
The upward reversal from the support level 1.4400 started the active minor correction 2.
Given the strength of the nearby support level 1.4400, strong bullish euro sentiment, EURAUD can be expected to rise further toward the next resistance level 1.4740 (former monthly low from June, target for the end of wave 2).