Sample Category Title
EUR/GBP Daily Outlook
Daily Pivots: (S1) 0.8405; (P) 0.8428; (R1) 0.8467; More...
Intraday bias in EUR/GBP is turned neutral first with current recovery. On the upside, break of 0.8491 resistance will resume the rebound from 0.8338. That would also argue that choppy decline from 0.8720 has completed. Bias will be back to the upside for 0.8585 resistance. On the downside, below 0.8386 should resume the fall from 0.8720 through 0.8338.
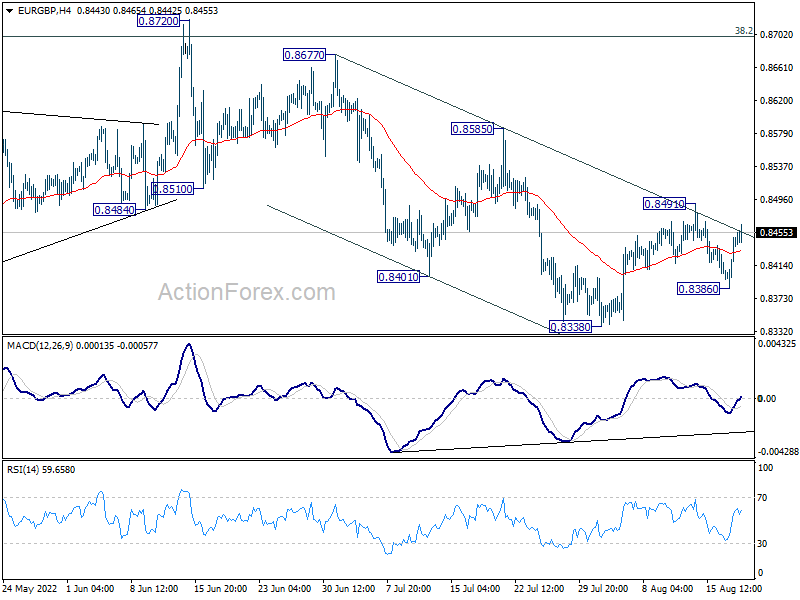
In the bigger picture, current development suggests rejection by 38.2% retracement of 0.9499 to 0.8201 at 0.8697. Medium term bearishness is maintained. Break of 0.8201 will resume larger down trend from 0.9499 (2020 high). Nevertheless, sustained break of 0.8697 will affirm the case that rise from 0.8201 is a medium term up trend itself.
EUR/AUD Daily Outlook
Daily Pivots: (S1) 1.4528; (P) 1.4617; (R1) 1.4764; More...
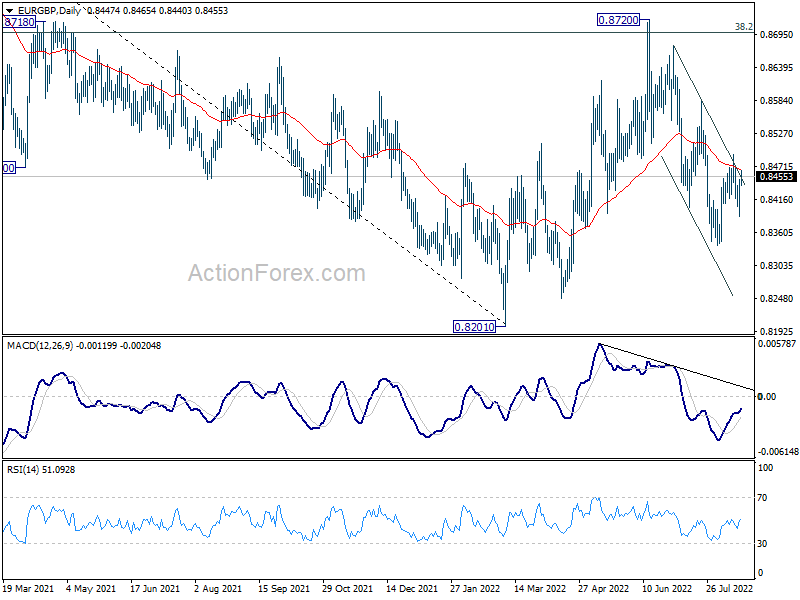
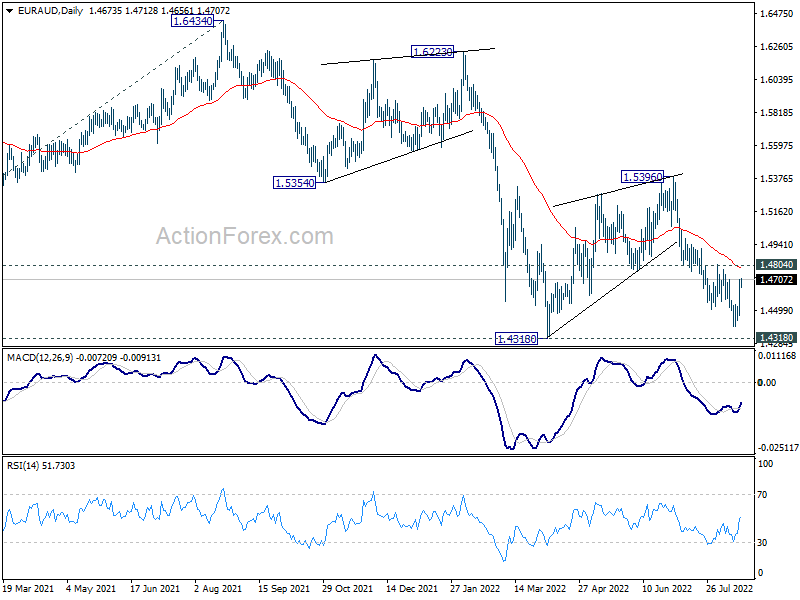
Intraday bias in EUR/AUD is neutral first. Another fall is in favor with 1.4804 resistance intact. Firm break of 1.4318 low will will resume larger down trend to medium term projection level at 1.3623. However, break of 1.4804 will delay the bearish case and turn bias to the upside for stronger rebound first.
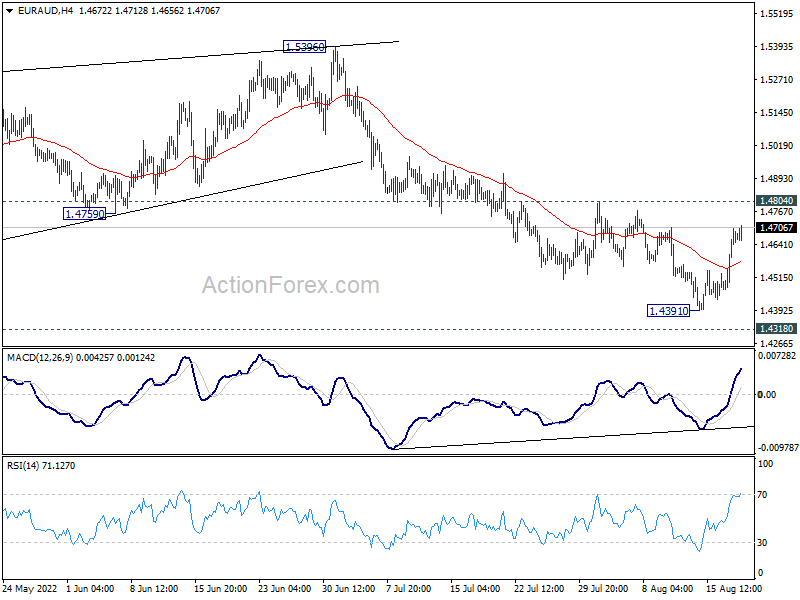
In the bigger picture, down trend from 1.9799 is still in progress. Break of 1.4318 low will target 61.8% projection of 1.9799 to 1.5250 from 1.6434 at 1.3623, which is close to 1.3624 long term support (2017 low). This will remain the favored case now as long as 1.5396 resistance holds.
EUR/CHF Daily Outlook
Daily Pivots: (S1) 0.9658; (P) 0.9679; (R1) 0.9707; More....
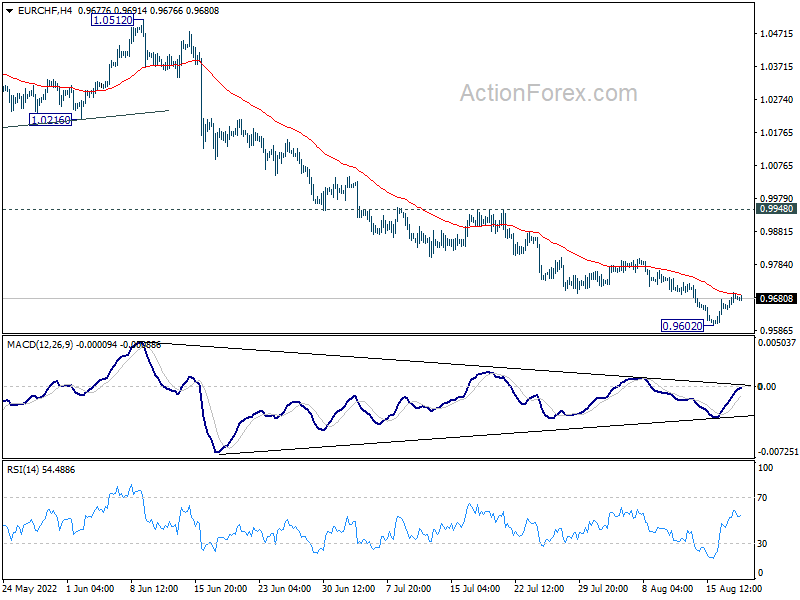
Intraday bias in EUR/CHF remains neutral for consolidation above 0.9602 temporary low. Upside of recovery should be limited well below 0.9948 resistance to bring another fall. Break of 0.9602 will resume larger down trend to 100% projection of 1.1149 to 0.9970 from 1.0513 at 0.9334.
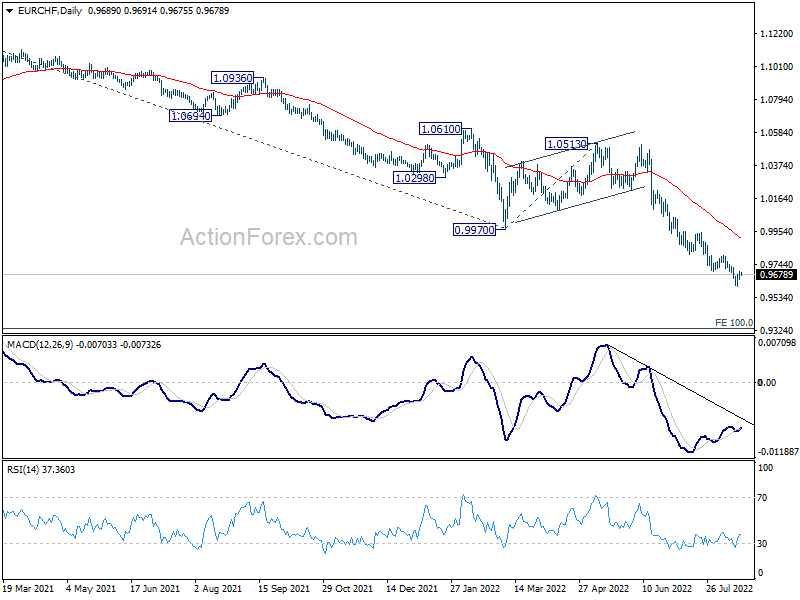
In the bigger picture, long term down trend from 1.2004 (2018 high) is still in progress. Next target is 138.2% projection of 1.2004 to 1.0505 to 1.1149 at 0.9033. On the upside, break of 0.9970 support turned resistance is needed to be the first sign of medium term bottoming. Otherwise, outlook will stay bearish in case of strong rebound.
EUR/USD Daily Outlook
Daily Pivots: (S1) 1.0149; (P) 1.0176; (R1) 1.0206; More...
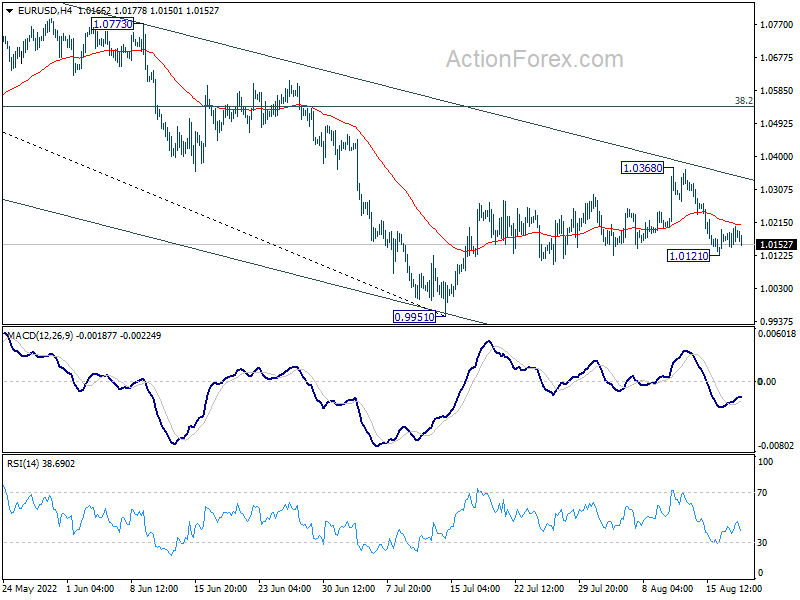
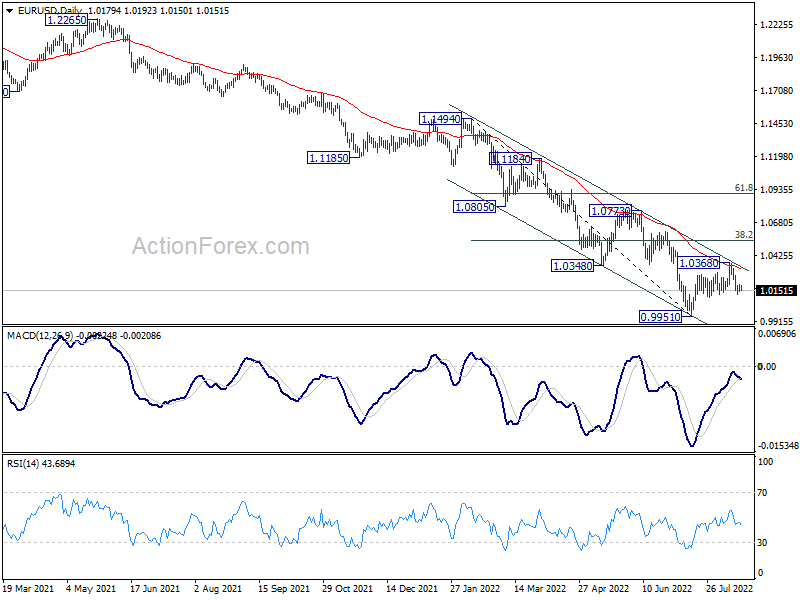
Intraday bias in EUR/USD is turned neutral first, but risk stays on the downside as long as 1.0368 resistance holds. Rebound from 0.9951 should have completed at 1.0368 after rejection by 55 day EMA, as well as falling channel resistance. Break of 1.0121 minor support will target a retest on 0.9951 low. Firm break there will resume larger down trend.
In the bigger picture, down trend from 1.6039 (2008 high) is still in progress. Next target is 100% projection of 1.3993 to 1.0339 from 1.2348 at 0.8694. In any case, outlook will stay bearish as long as 1.0773 resistance holds, in case of strong rebound.
GBP/USD Daily Outlook
Daily Pivots: (S1) 1.2008; (P) 1.2075; (R1) 1.2123; More...
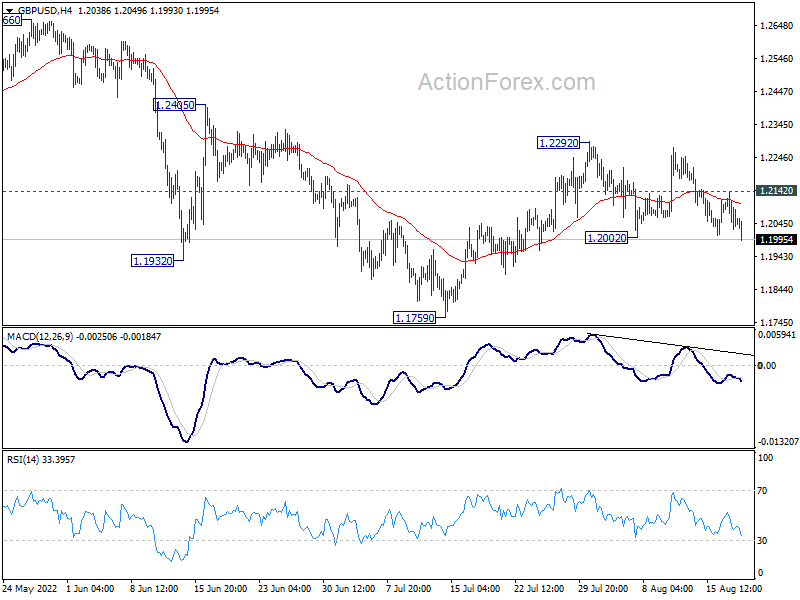
GBP/USD's break of 1.2002 support argues that rebound from 1.1759 has completed at 1.2292, after rejection by 55 day EMA. Intraday bias is back on the downside, and deeper fall should be seen to retest 1.1759 low. Break there will resume larger down trend. On the upside, above 1.2142 minor resistance will mix up the outlook and turn intraday bias neutral first.
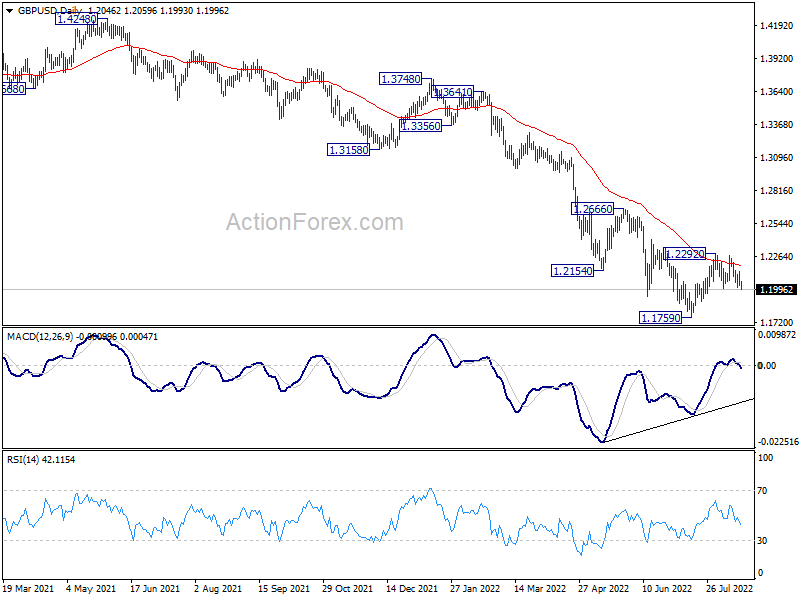
In the bigger picture, fall from 1.4248 (2018 high) could be a leg inside the pattern from 1.1409 (2020 low), or resuming the longer term down trend. Deeper decline is expected as long as 1.2666 resistance holds. Next target is 1.1409 low. However, firm break of 1.2666 will bring stronger rise back to 55 week EMA (now at 1.2897).
USD/CHF Daily Outlook
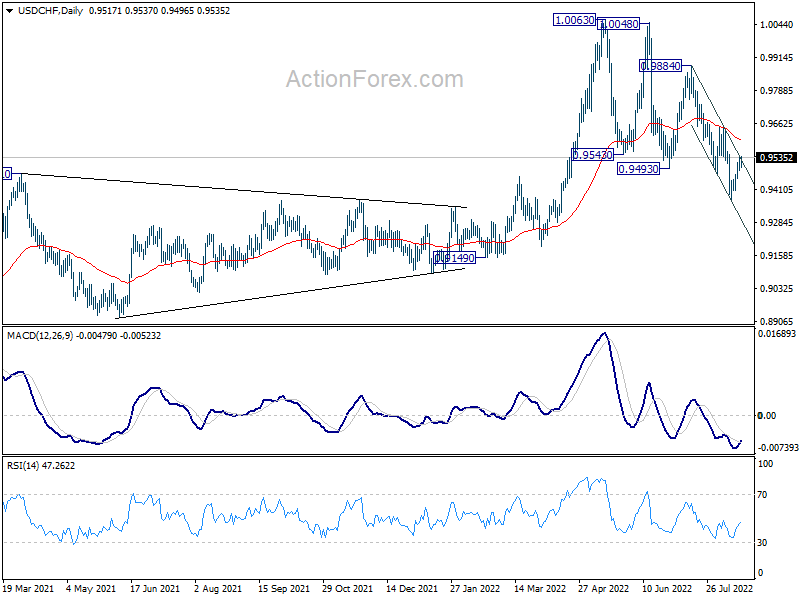
Daily Pivots: (S1) 0.9461; (P) 0.9488; (R1) 0.9522; More...
Intraday bias in USD/CHF remains neutral for the moment. Recovery from 0.9369 should be limited well below 0.9648 resistance to bring another fall. On the downside, break of 0.9369 will resume larger decline from 1.0063 towards 0.9149 support next. However, firm break of 0.9648 will turn bias back to the upside for 0.9884 resistance instead.
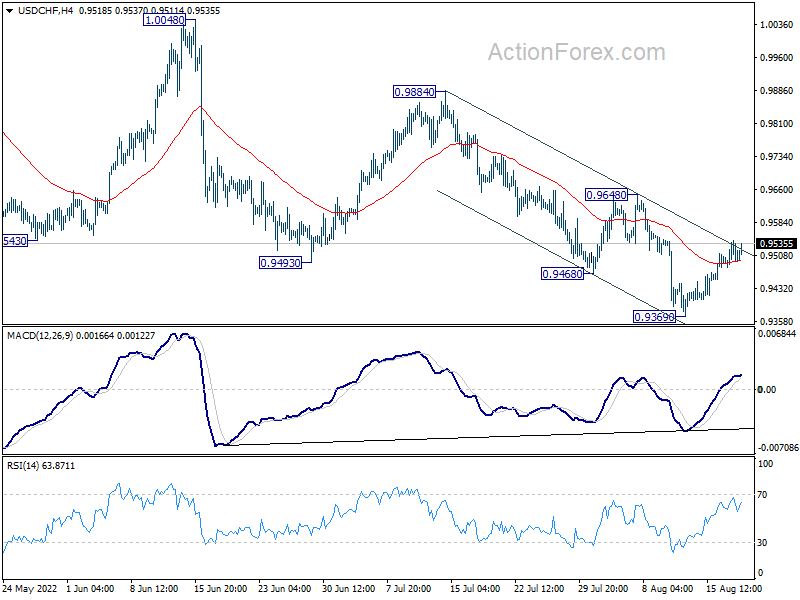
In the bigger picture, break of 0.9471 support turned resistance argues that medium term up trend from 0.8756 has completed with three waves up to 1.0063. Long term sideway pattern might have started another falling leg. Deeper decline would now be in favor as long as 0.9648 resistance holds, to 0.9149 structural support. Sustained break there could pave the way back to 0.8756.
USD/JPY Daily Outlook
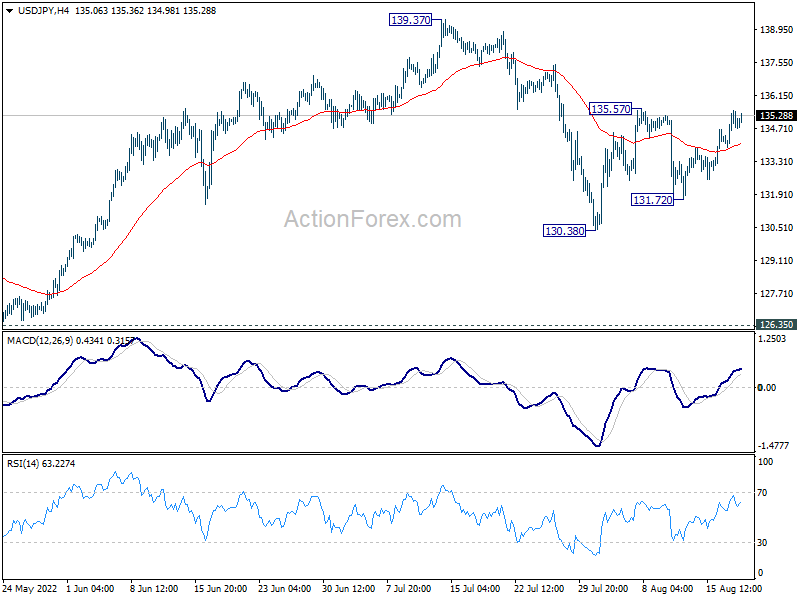
Daily Pivots: (S1) 134.15; (P) 134.83; (R1) 135.74; More...
Range trading continues in USD/JPY and intraday bias stays neutral first. Overall, corrective pattern from 139.37 will extend further. On the upside, above 135.57 will resume the rebound to retest 139.37 high. But a decisive break there is not expected this time. On the downside, below 131.72 will resume the fall from 139.37 through 130.38 support.
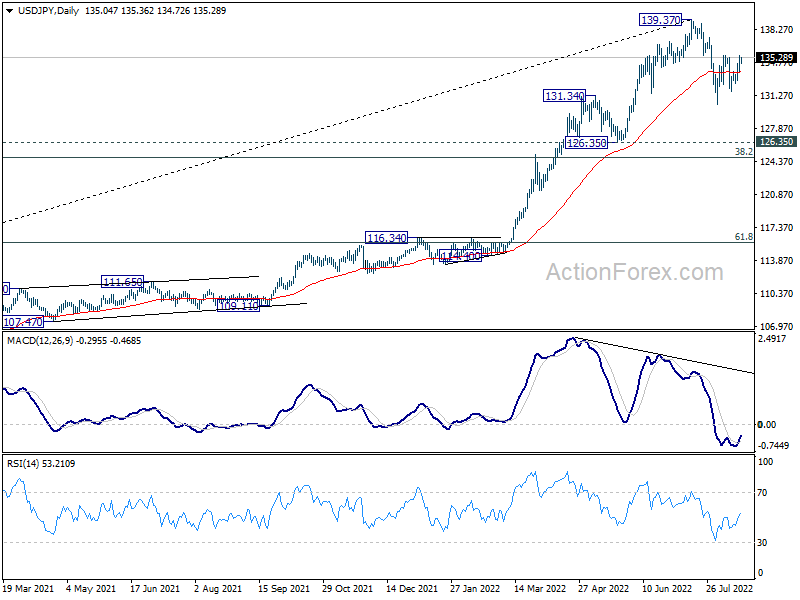
In the bigger picture, fall from 139.37 medium term top is seen as correcting whole up trend from 101.18 (2020 low). While deeper decline cannot be ruled out, outlook will stays bullish as long as 55 week EMA (now at 122.70) holds. Long term up trend is expected to resume through 139.37 at a later stage, after the correction finishes.
USD/CAD Daily Outlook
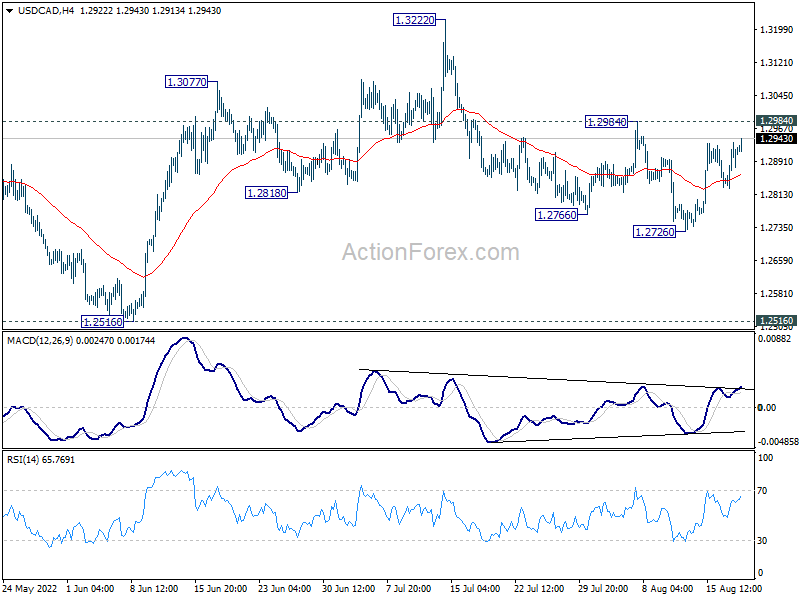
Daily Pivots: (S1) 1.2850; (P) 1.2893; (R1) 1.2959; More...
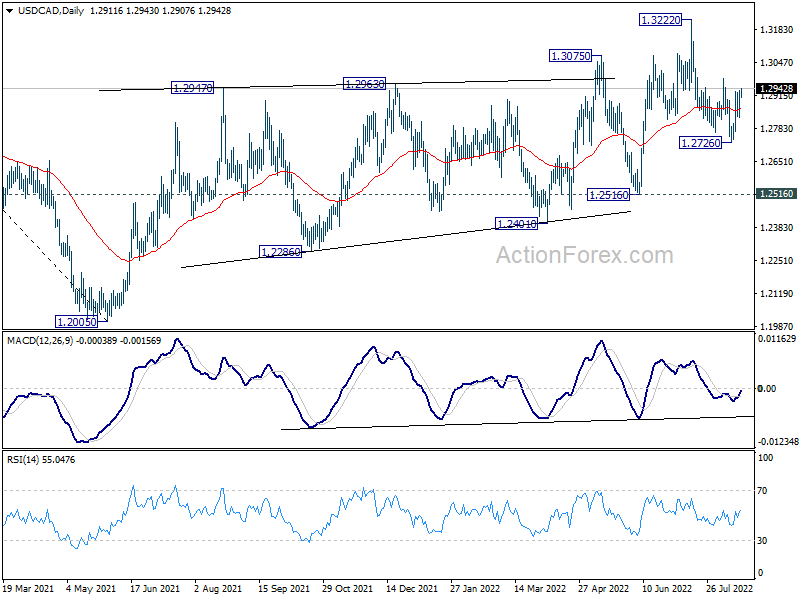
Intraday bias in USD/CAD stays neutral first. On the upside, firm break of 1.2984 resistance will argue that corrective fall from 1.3222 has completed with three waves down to 1.2726. Further rally would be seen back to retest 1.3222 high. On the downside, break of 1.2726 will resume the fall from 1.3222 to 1.2516 key support instead.
In the bigger picture, down trend from 1.4667 (2020 high) should have completed at 1.2005, after defending 1.2061 long term cluster support. Rise from there should target 61.8% retracement of 1.4667 to 1.2005 (2021 low) at 1.3650. This will remain the favored case now as long as 1.2516 support holds.
The Pendulum Between Inflation and Growth Fears Swung from One Extreme to the Other
Markets
Since the beginning of the year up until mid-June, investors turned a blind eye to growth risks, focusing solely on inflation developments and changing reaction functions of central banks (normalization/tightening). This resulted in an unseen core bond sell-off. Ever since even the SNB hiked its policy rate, attention turned to economic consequences of these price and monetary shocks. Especially with the European energy crisis adding a layer. Core bonds recovered, arguing that central banks would take this economic concerns into account during the inflation crusade.
The pendulum between inflation and growth fears swung from one extreme to the other. A chain of events this week triggered the start of a more neutral positioning. Better-than-expected earnings by US retailers – confirmed by July US retail sales – set things in motion. An hawkish signal from tightening-frontrunner RBNZ and especially the first double digit UK inflation outcome did the rest.
UK Gilts underperformed German Bunds and US Treasuries yesterday. UK yields rose by up to 25 bps at the front end of the curve yesterday, the 2-yr yield taking out the mid-June top. The German yield curve bear flattened with yields adding 6.2 bps (30-yr) to 15.4 bps (2-yr). The German 10-yr yield broke out of the downward corrective trend channel in place since Mid-June, suggesting more upside. Peripheral yield spreads showed weakness to the strong bond sell-off, widening by 7 bps for Greece and Italy.
Another victim from the selling was the stock market. They enjoyed a nice comeback over the past month and a half softer growth ironically beats the alternative of high inflation/extreme monetary tightening. Yesterday’s losses were up to 2% for Europe and up to 1.25% for the US. US yields rose by 2.4 bps (2-yr) to 9.9 bps (7-yr) with the belly of the curve underperforming the wings.
The front end performed better after dovish interpreted FOMC Minutes from the July meeting. The key sentence was that “Participants judged that, as the stance of monetary policy tightened further, it likely would become appropriate at some point to slow the pace of policy rate increases while assessing the effects of cumulative policy adjustments on economic activity and inflation”. We don’t want to read too much into this though as Minutes continue to flag the significant risk that the Fed might need to raise rates more than anticipated if inflation spreads more broadly than feared as well.
Action on main FX markets remained subdued in the volatile market environment. EUR/USD closed a tad higher at 1.018 (from 1.0171). EUR/GBP ended at 0.8448, up from 0.8408. Today’s eco calendar contains US Philly Fed Business Outlook and initial jobless claims. Markets recall the very weak Empire Manufacturing Survey earlier this week. It will be interesting to see whether a disappointing outcome will put the onus back on the growth fear. The Norwegian central bank meeting will be watched in a same vein as the New Zealand gathering earlier this week. An hawkish signal won’t go unnoticed.
News Headlines
July Australian labour market data disappointed. The Australian Bureau of Statistics reported the first fall in employment (-40.9k) since October 2021. Markets expected a 25k net job gain. Details were even worse as 86.9k full time jobs went bust whereas part time employment increased by 46k. The unemployment rate nevertheless fell from 3.5% to 3.4%, a 48-yr low, as the participation rate fell. Floods in New South Wales, winter school holidays and worker absences associated with Covid and other illnesses were at play. Head of labour statistics at ABS, Jarvis, pointed to an increasingly tight labour market, including high job vacancies and ongoing labour shortages. In July, there were fewer people unemployed (474k) than there were job vacancies (480k in May).The Aussie dollar barely reacted to the labour market, holding near sell-off lows around 0.6930 against the US dollar. AUD swap rates lose 4.8 bps (3-yr) to 2.2 bps (12-yr) with the belly of the curve outperforming the wings.
XAU/USD Tests Support
Gold consolidates as FOMC minutes hint at a slower pace of rate hikes. The price has met stiff pressure at the support-turned-resistance (1805), which lies at the origin of the July sell-off. A fall below 1785 prompted some buyers to close their positions. 1755 next to the daily MA cross is an important congestion area where bulls and bears would fight for control. A bearish breakout could trigger a liquidation towards 1720. 1788 is the immediate resistance and a rally back above 1805 would send the precious metal to 1840.