Sample Category Title
EURNZD Wave Analysis
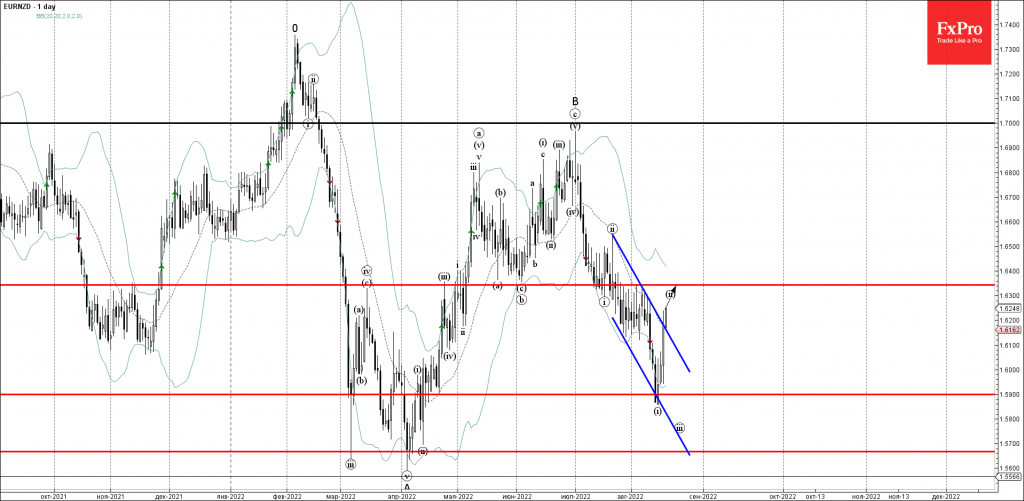
- EURNZD broke daily down channel
- Likely to rise to resistance level 1.6345
EURNZD recently broke the resistance trendline of the daily down channel, inside which the pair has been falling from July.
The breakout of this down channel accelerated the active short-term correction (ii) – which belongs to the sharp downward impulse wave C from June.
Given the bullish euro sentiment – EURNZD can be expected to rise further toward the next resistance level 1.6345 (target for the completion of the active short-term correction (ii)).
Silver Wave Analysis
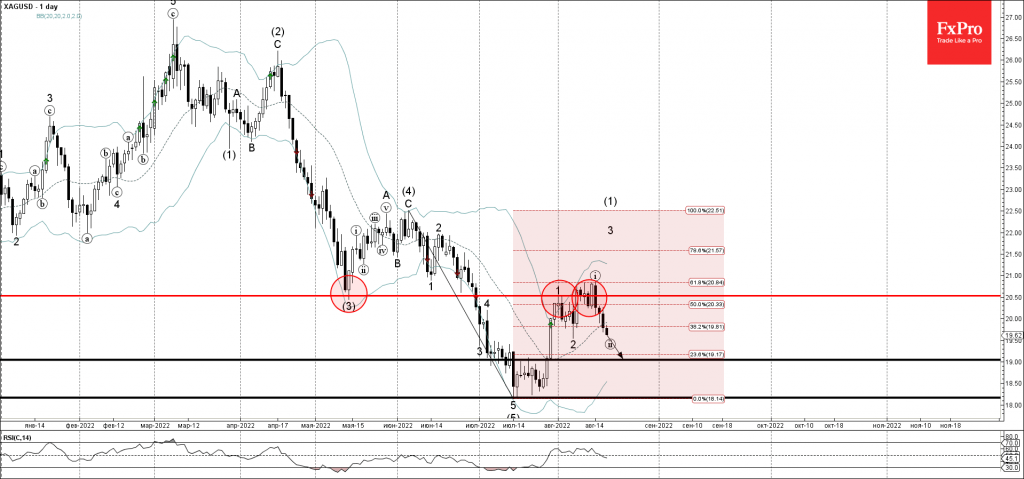
- Silver reversed from resistance level 20.50
- Likely to fall to support level 19.00
Silver recently reversed down from the key resistance level 20.50 (former monthly low from May), intersecting with the upper daily Bollinger Band and the 61.8% Fibonacci correction of the downward impulse from June.
The downward reversal from the resistance level 20.50 started the active short-term correction (ii).
Given the powerful daily downtrend, Silver can be expected to fall further toward the next support level 19.00.
NZDUSD Slides Below Bullish Channel but Remains Supported
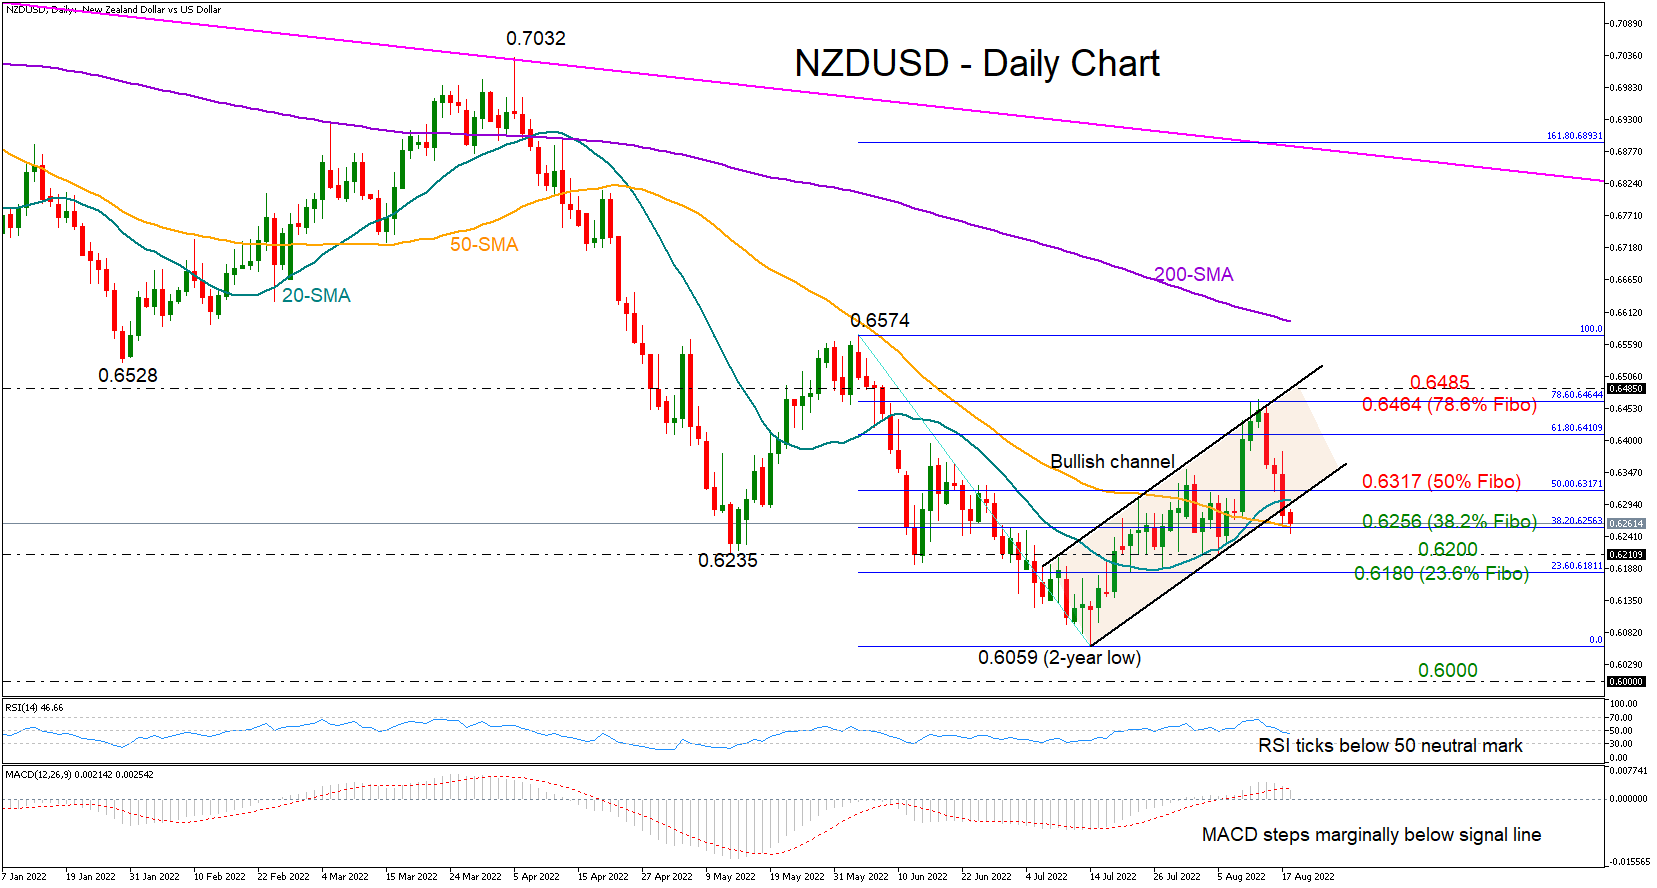
NZDUSD is in the fourth consecutive day of declines, set to confirm its exit from a short-term bullish channel at 0.6267.
While the momentum indicators suggest that the negative correction has just started, some confirmation is required since the RSI and the MACD have not significantly deviated below their neutral levels; the RSI is still close to its 50 neutral mark and the MACD marginally below its red signal line, reflecting a neutral-to-bearish short-term bias overall.
Moreover, the price itself is currently facing support around the 50-day simple moving average (SMA) and the 38.2% Fibonacci retracement of the 0.6574 – 0.6059 downfall at 0.6256. If that base holds, with the price immediately crawling back above the 50% Fibonacci of 0.6317, the bulls may again attempt to breach the 78.6% Fibonacci of 0.6464 and the channel’s upper boundary seen at 0.6485. Should they claim this zone, all attention will turn to June's peak of 0.6574. Note that the 200-day SMA is also converging to that number.
In the event the sell-off continues, the focus will initially turn to the 0.6200 – 0.6180 region. Another defeat at this point could aggressively press the pair towards the two-year low of 0.6059, while lower, the price may chart a new lower low at 0.6000.
Summarizing, despite the quick depreciation in NZDUSD, the pair might have another opportunity to improve its fortunes at 0.6256. Otherwise, the bearish wave could gain extra legs.
USDJPY Visits 40-Day SMA at 135.55; Bullish Bias
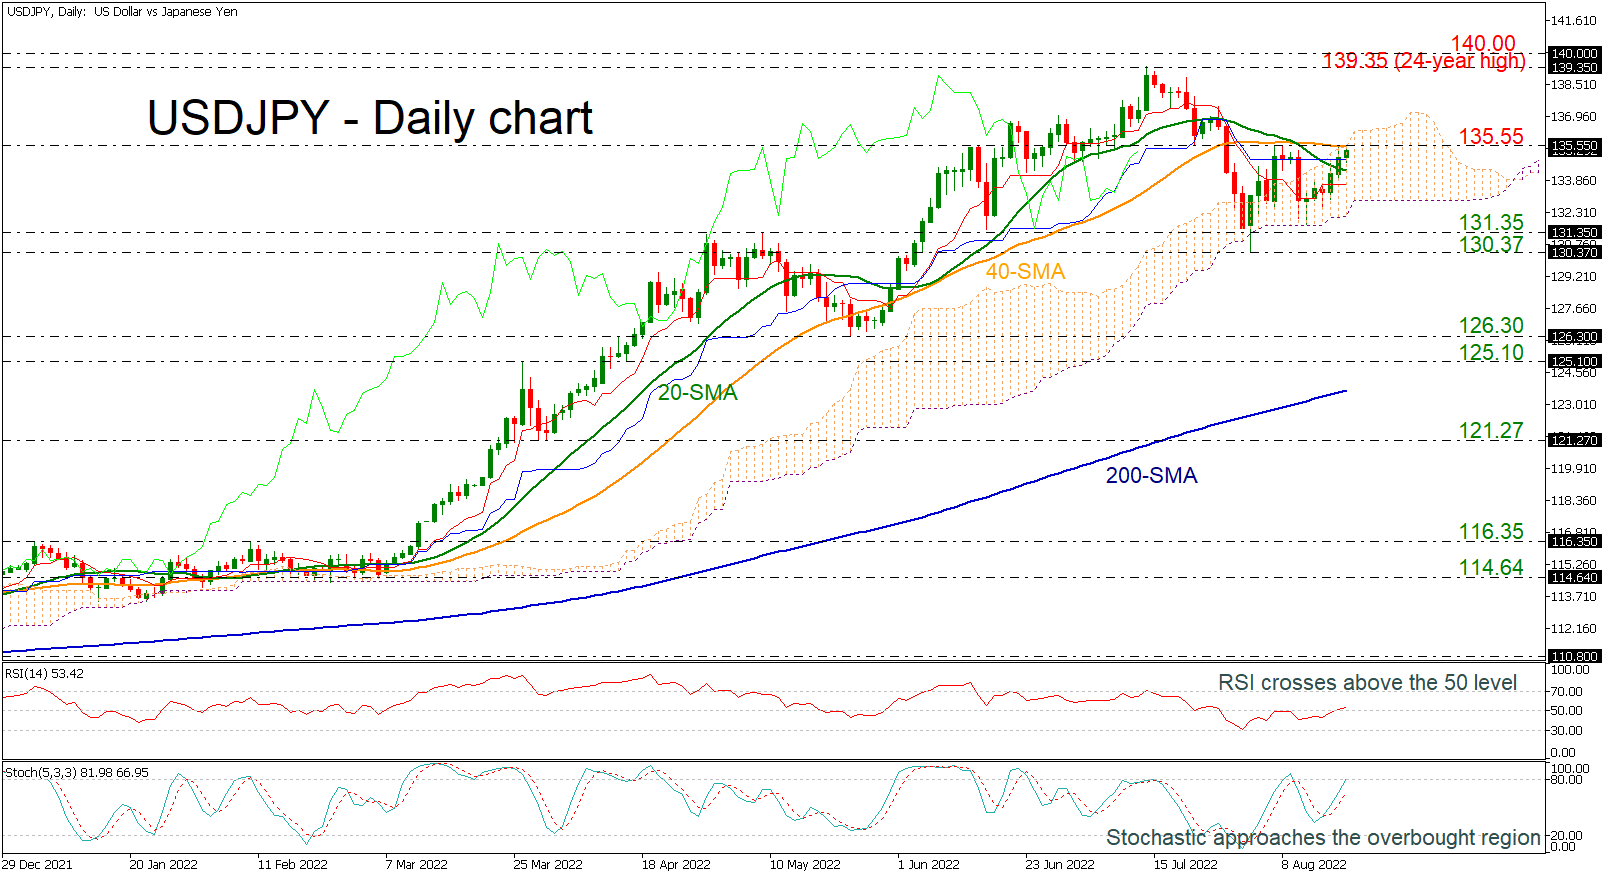
USDJPY is turning up, hitting the strong immediate resistance at 135.55, which overlaps with the 40-day simple moving average (SMA).
The pair remains inside the Ichimoku cloud, while the RSI is getting closer to the positive territory and the stochastic oscillator is moving up towards the 80 level after the bullish crossover between the %K and %D lines. Both suggest that the next move may be up instead of down in the near-term.
If the price closes decisively above the 135.55 resistance, the bulls could push up to the 24-year high of 139.35 before testing the psychological level of 140.00.
On the other hand, a drop could hit the support level of 131.35, which the market failed to break below since June. Even lower, the market could try to break through the 130.37 barrier again before falling to the 125.10–126.30 support zone.
Overall, USDJPY needs to climb above the 40-day SMA for a short-term bullish move to be confirmed, while a drop below 130.37 could generate a lower low and change the outlook to bearish.
BTCUSD Retraces after Hitting 2-Month High
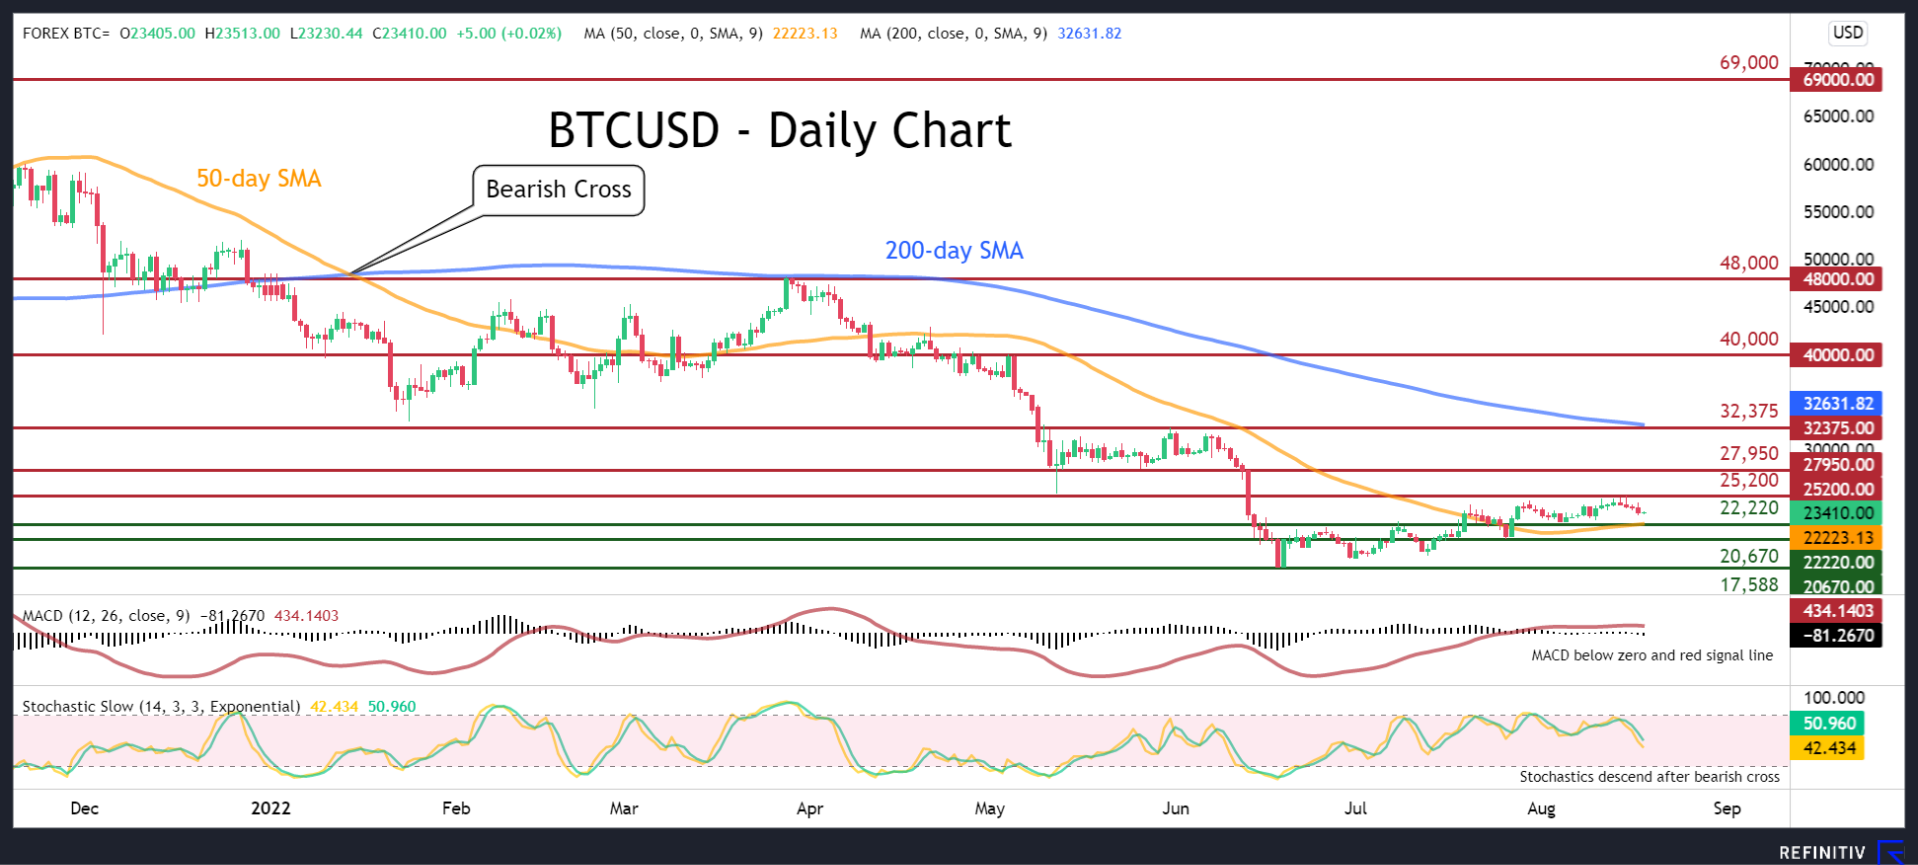
BTCUSD has been constantly gaining ground after its prolonged downtrend bottomed at the 2022 low of 17,588. However, in the last few daily sessions, the cryptocurrency has been experiencing a downside correction since its recent rebound failed to cross above the 25,200 region.
This loss of positive momentum is also reflected by the short-term indicators. Specifically, the MACD histogram has dived beneath both zero and its red signal line, while the stochastic oscillator is sloping downwards after posting a bearish cross.
Should the negative bias strengthen, initial support could be found at the 50-day simple moving average (SMA), currently at 22,220. Dropping beneath that zone, the bears could aim for the 20,670 barrier. A violation of the latter may pave the way for the 19-month low of 17,588.
On the flipside, bullish actions could propel the price higher to challenge the recent rejection point of 25,200. Conquering this barricade, further upside moves might stall at 27,950 before the May peak of 32,375 comes under examination. Even higher, the 40,000 psychological mark could prove to be a tough obstacle for the price to overcome.
In brief, Bitcoin’s latest recovery appears to be running out of steam, although it is still too early to call for a resumption of the broader downtrend. Therefore, a drop below the 50-day SMA could attract further selling interest, sending the price towards its recent lows.
GBP/USD: Bears Remain in Play on Fears that Aggressive BOE Would Negatively Impact Growth
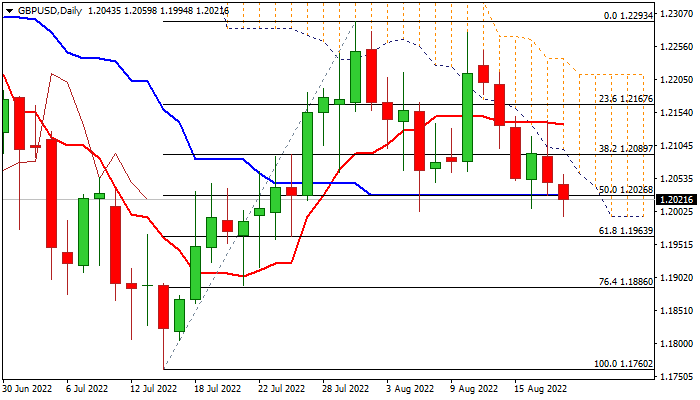
Cable maintains negative tone and attacks 1.20 support in early Thursday following short-lived recovery attempts.
Pound came under fresh pressure after higher than expected July inflation (10.1% vs 9.8% f/c; the highest since 1982) that suggests the BOE is likely to opt for another 0.5% rate hike to fight soaring prices. Continued strong policy tightening would negatively impact Britain’s economic growth that would prompt further selling of pound.
Daily technical studies show rising negative momentum and moving averages in bearish setup, with near-term action being pressured and capped by the base of falling and thickening daily Ichimoku cloud, although headwinds from key 1.20 support zone (Fibo 38.2% of 1.1760/1.2293/daily Kijun-sen at 1.2026 and psychological 1.20 support) persist and may keep the action in extended consolidation before bears resume.
Upticks should be capped by the cloud base (1.2097) to keep bears intact and offer better selling opportunities, while only sustained break above daily Tenkan-sen (1.2135) would put bears on hold.
Eventual clear break of 1.20 pivot would signal bearish continuation on completion of failure swing pattern on daily chart and expose targets at 1.1963 (Fibo 61.8%) and 1.1916/1.1890 (July 22/21 spike lows).
Res: 1.2059; 1.2097; 1.2135; 1.2167.
Sup: 1.2000; 1.1963; 1.1916; 1.1890.
AUD/USD: Is there Enough Gas in the Bears Tank to Reach the 0.645 Level?
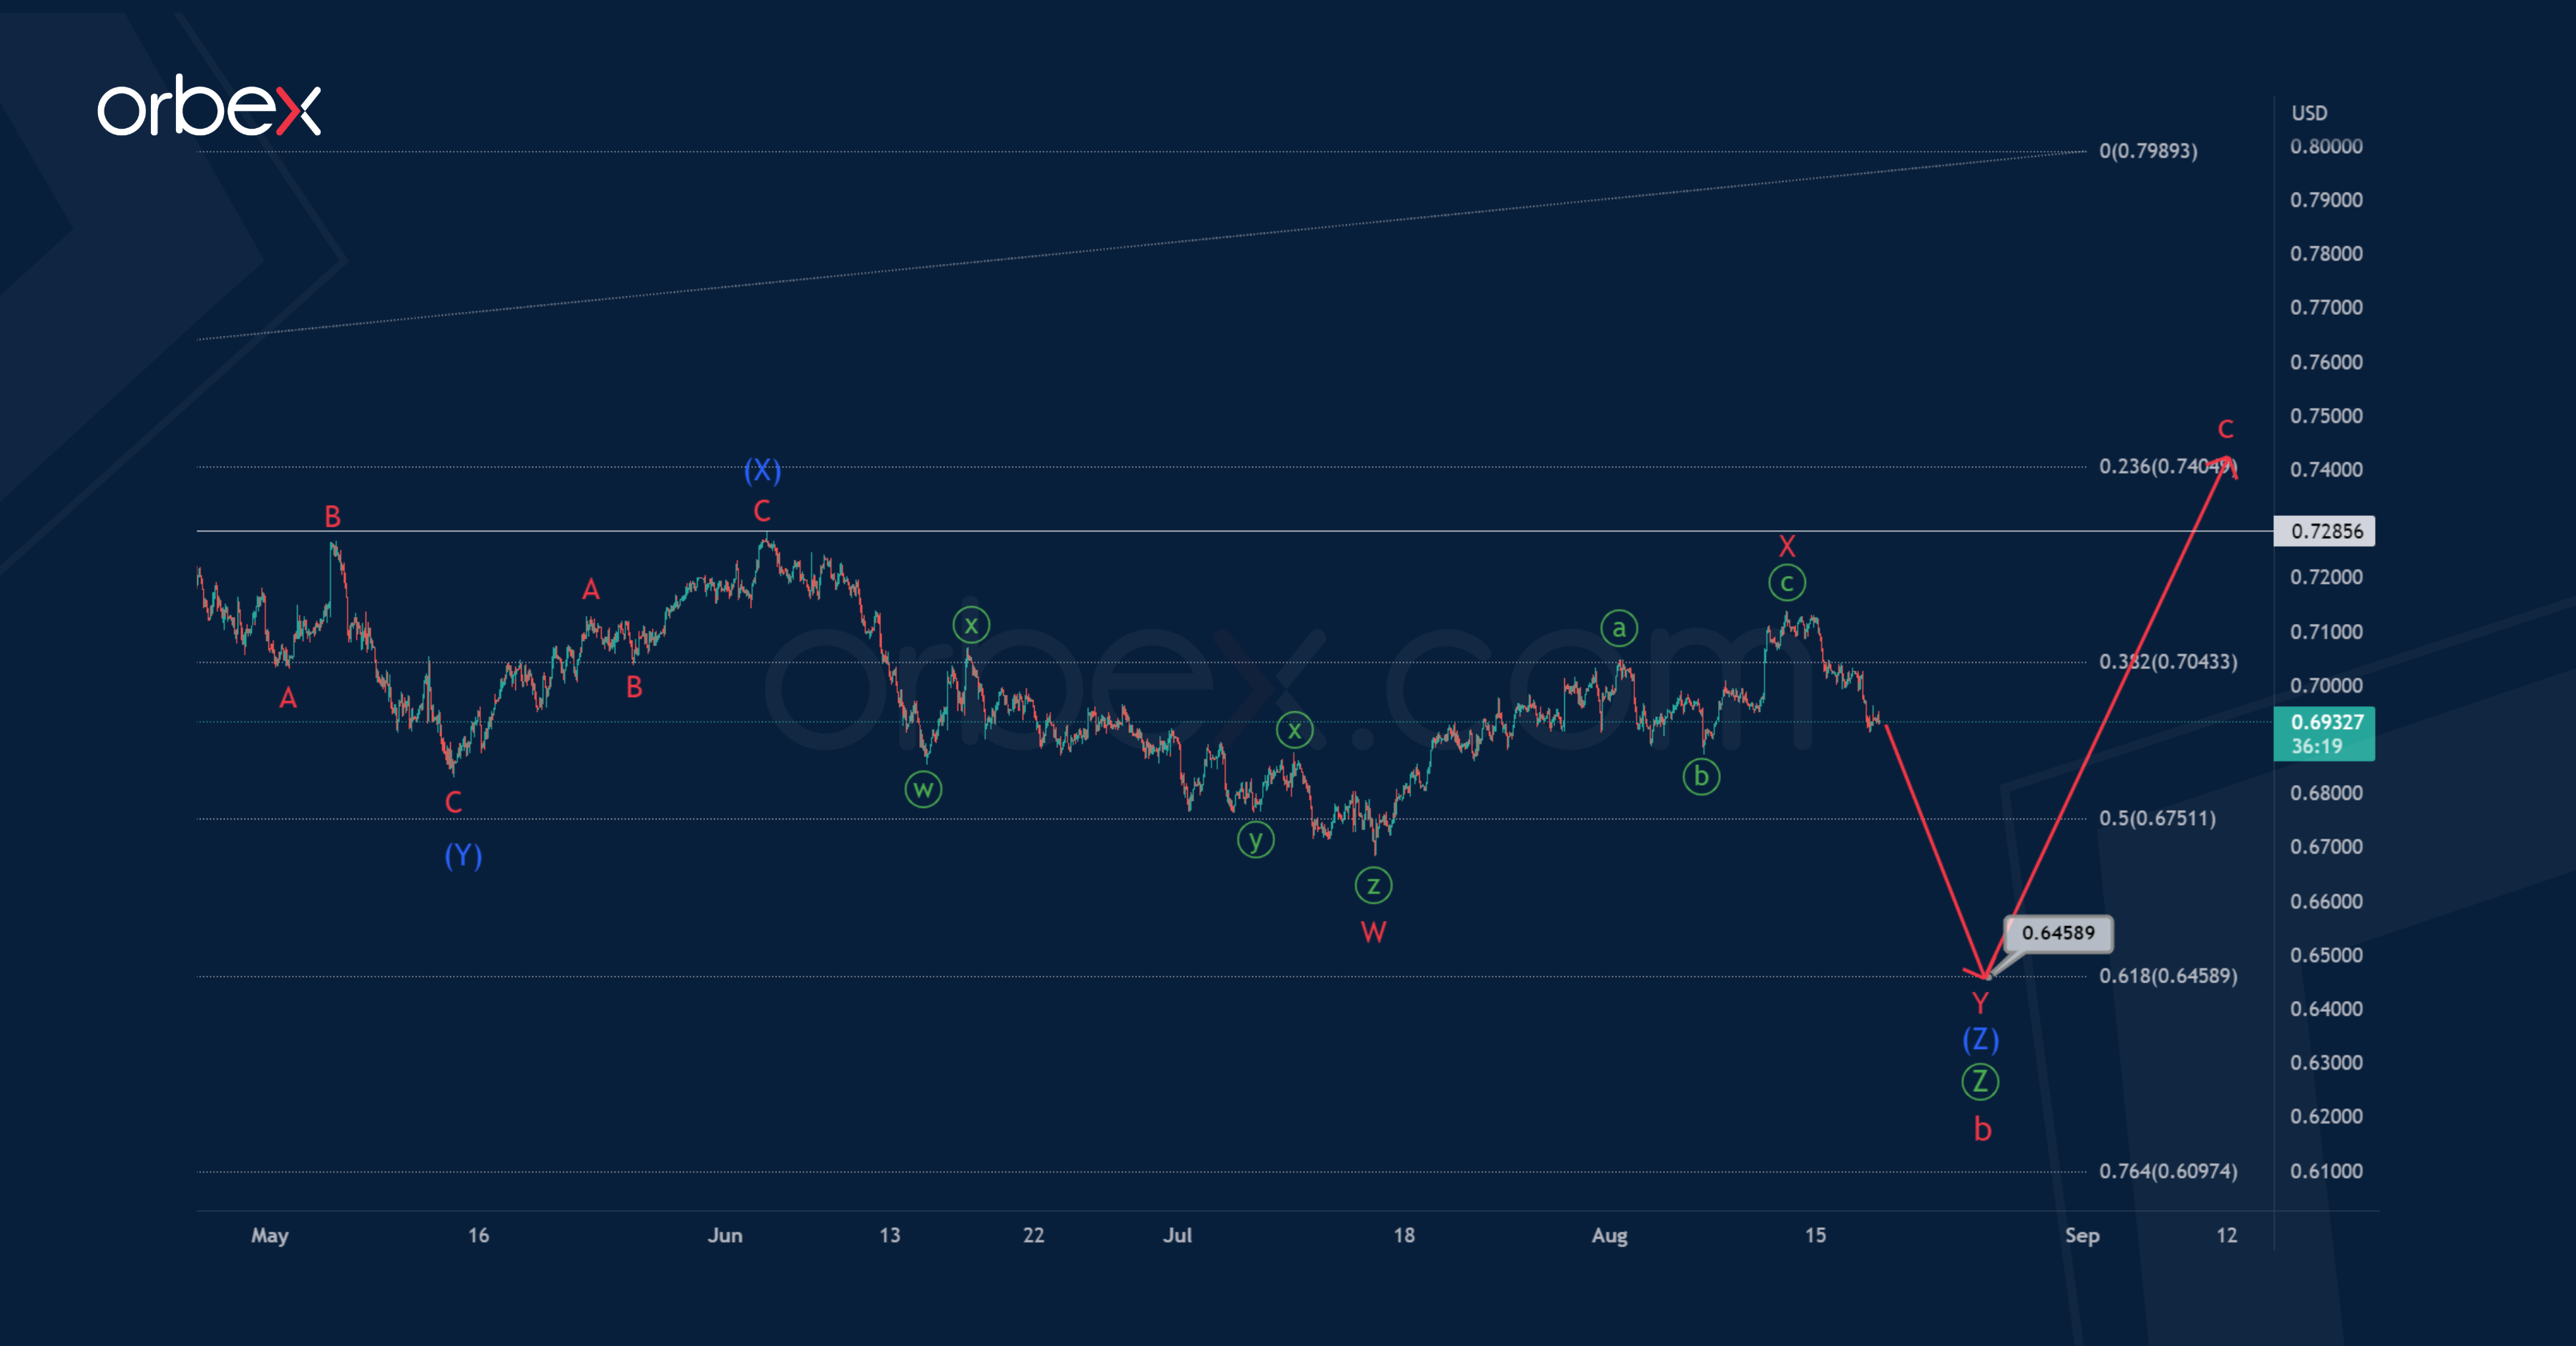
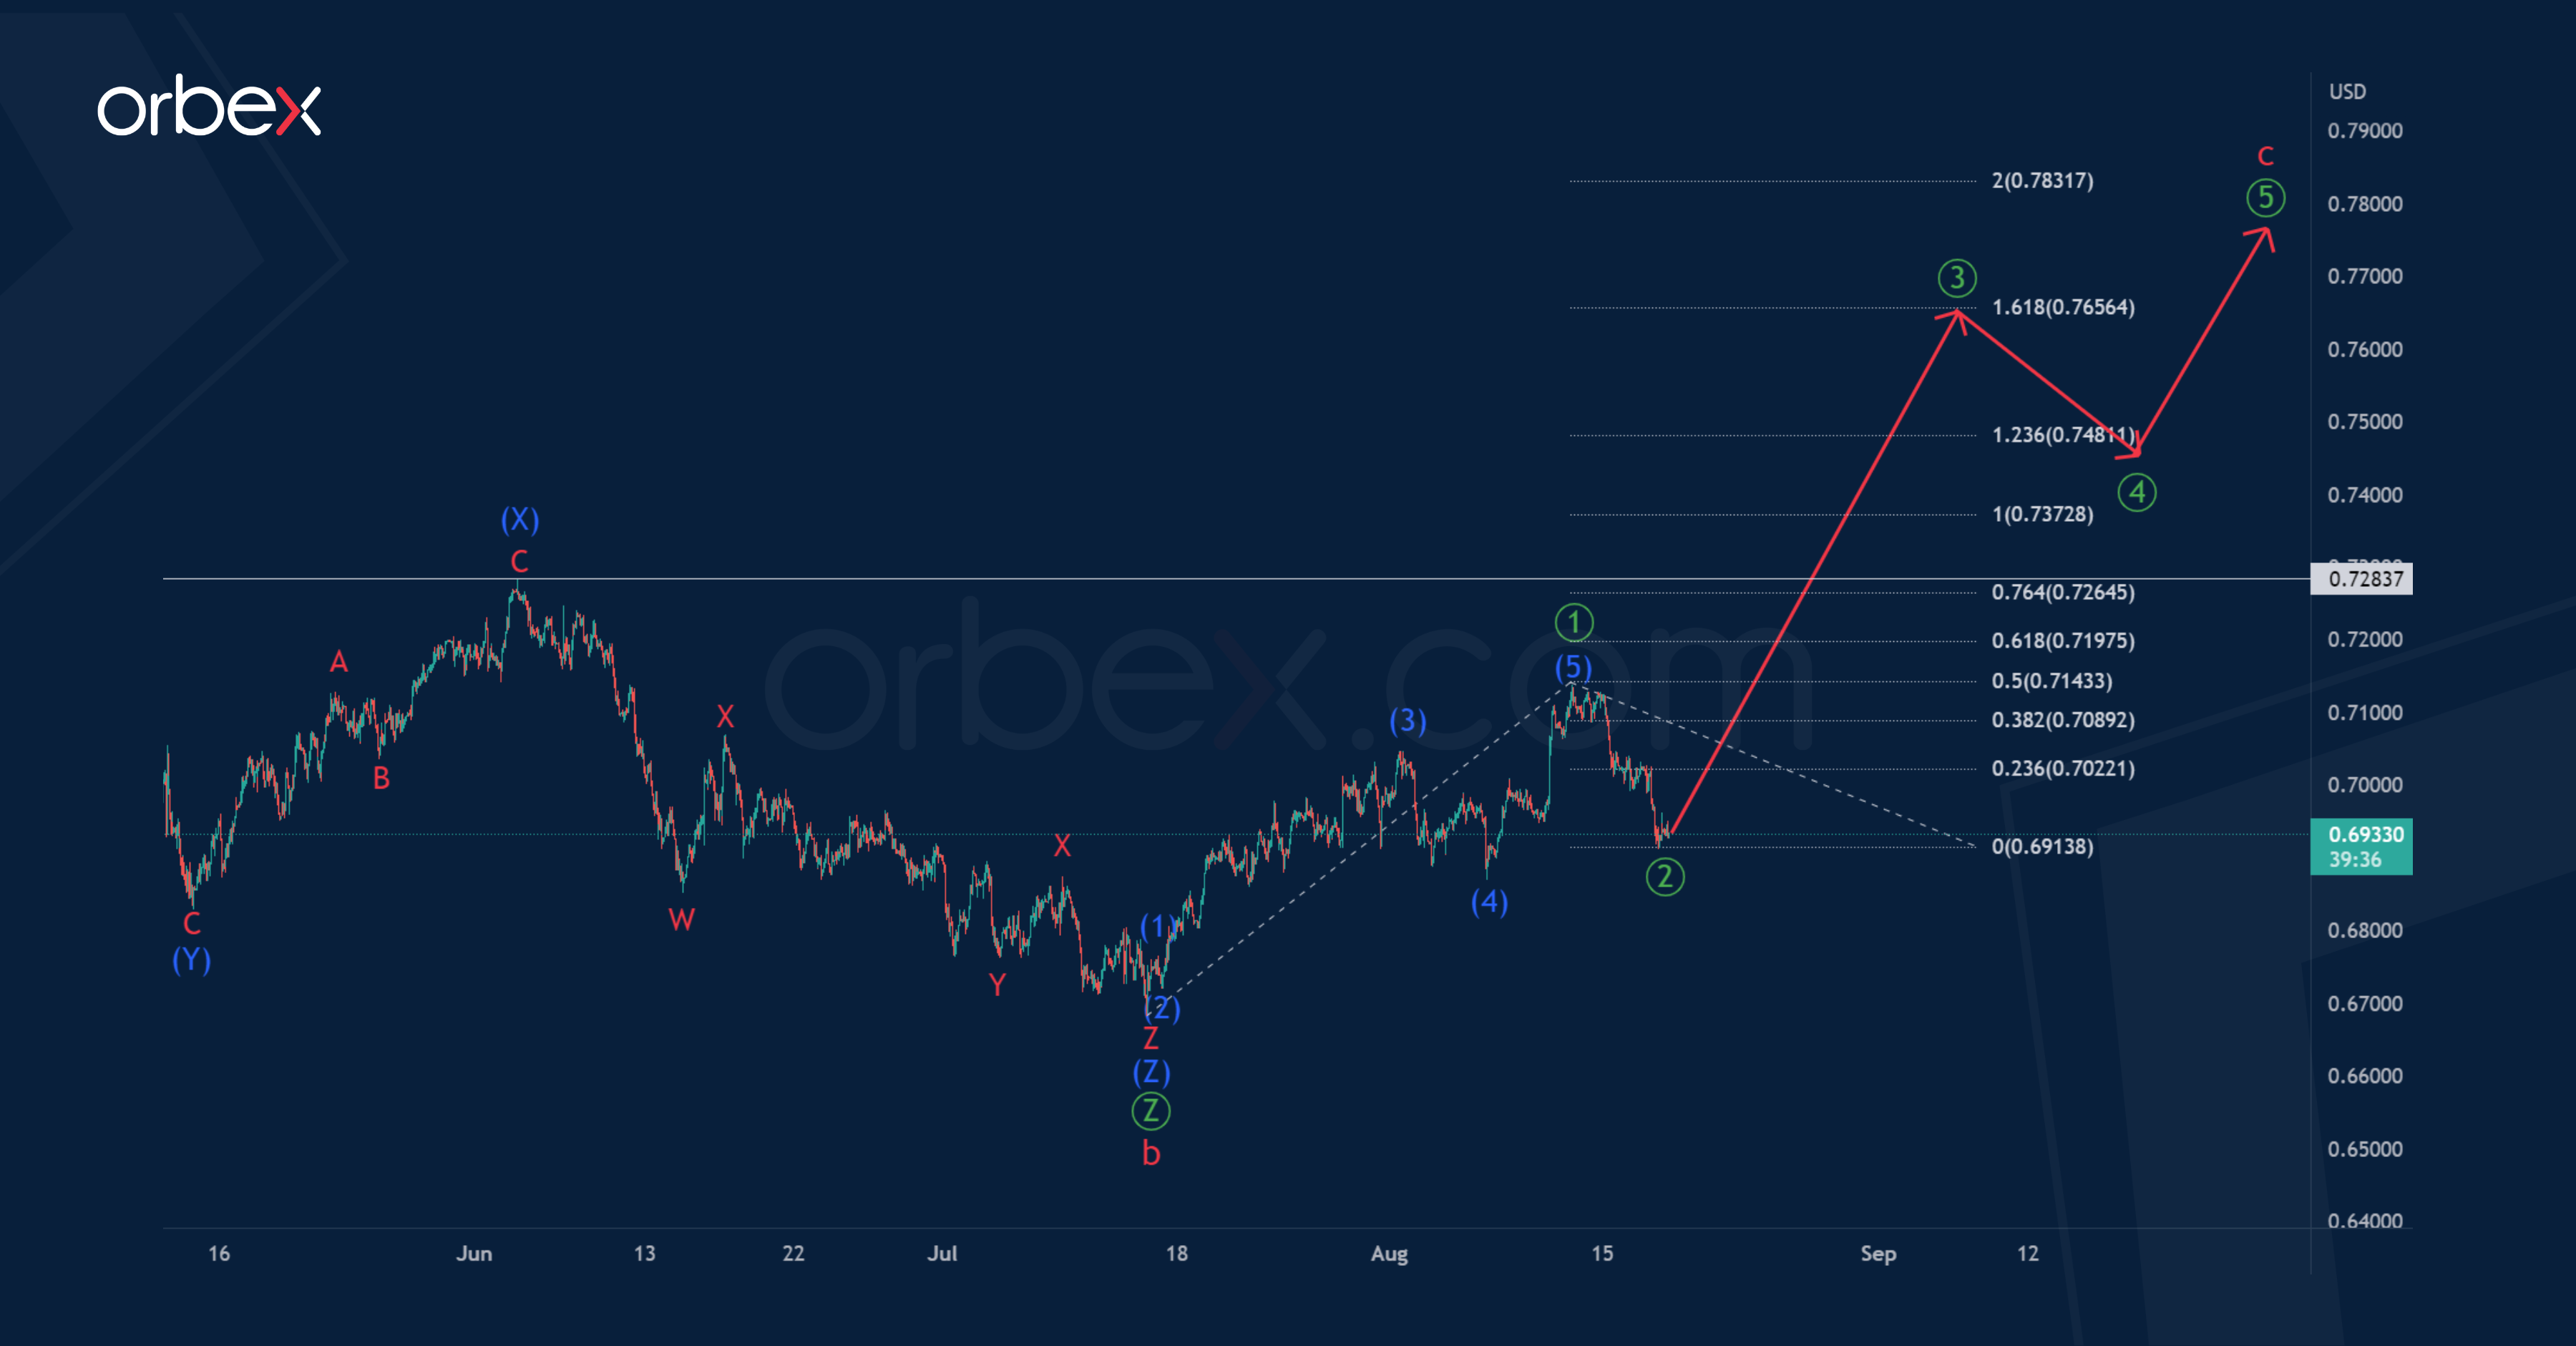
The current structure of the AUDUSD pair indicates that the market is forming a zigzag a- b-c, which currently includes a complex bearish correction b. Wave b consists of primary sub-waves.
The last section of the chart shows the structure of the final primary wave. It seems that it will be an intermediate triple zigzag (W)-(X)-(Y)-(X)-(Z), which is currently completed in 4/5 parts. To complete this pattern, the final actionary wave (Z) is needed, which seems to take the form of a minor double zigzag W-X-Y and may end near 0.645.
At that level, cycle correction b will be at 61.8% along the Fibonacci lines of cycle impulse wave a.
According to an alternative scenario, the bearish wave of the primary degree, which is part of the cycle correction b, may be fully completed.
Thus, in the last section of the chart, we can observe the formation of the initial part of the cycle wave c, which can take the form of an impulse ①-②-③-④-⑤. The structure of the potential impulse is schematically shown by trend lines.
It is assumed that the primary impulse ① and the correction ② to this impulse have already been built, so in the near future the currency pair may move in an upward direction, forming a primary third wave above the maximum of 0.728 in the direction of the price mark of 0.765.
At the level of 0.765, impulse wave ③ will be at 161.8% of wave ①.
Daily Technical Analysis
EUR/USD
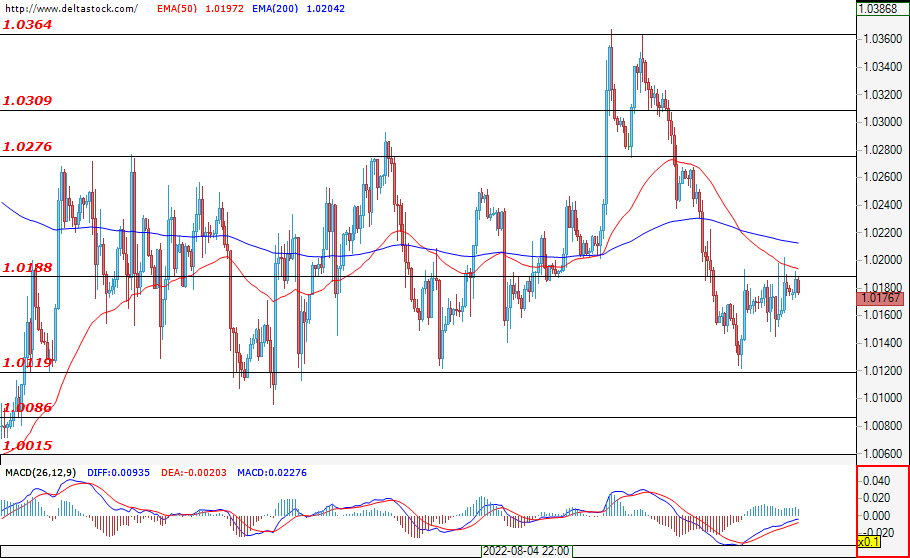
Today's trading session for the single European currency got off to a shaky start as the euro continued to trade just below the resistance at 1.0188. A successful breach of this level would be an opportunity for the bears to go forward with an attack on the local resistance at 1.0220, where a confirmed breach of this critical level would pave the way for the pair towards the next critical one lying at 1.0276. In case the resistance at 1.0188 withholds the bulls’ pressure, then we may expect a wave of sell-offs heading the price towards the support at 1.0120. This week started with low volatility, which may suggest that the pair may remain locked in the range of 1.0120 – 1.0180 before investors can enter the market and define the future path of the pair. Today, increased volatility can be expected around the release of the initial jobless claims data for the U.S. at 12:30 GMT. A worse-than-expected data may trigger an impulsive move and a test of the resistance at 1.0276. However, the most likely scenario for today's trading session is for the bulls to lead the pair towards the local resistance at 1.0220. On the other hand, the long-term negative sentiment for a new EUR/USD parity is still intact and any new highs here may be considered as a good opportunity to enter the market through short positions.
USD/JPY
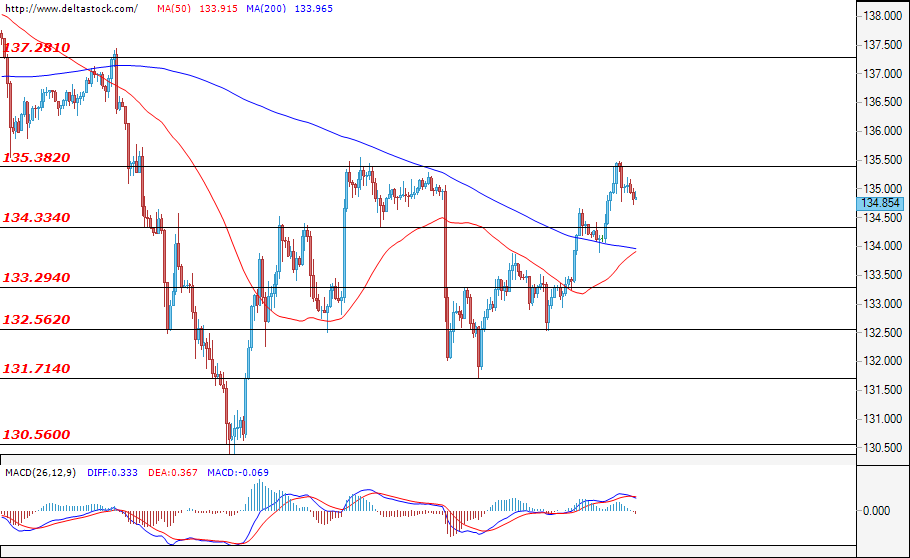
The critical resistance at 135.38 managed to resist the bulls’ attack and the pair is currently headed towards a test of the support at 134.33 – a retracement that may be considered as a corrective move – before the upward movement is to potentially resume its course. A breach of the resistance at 135.38 could definitely be considered as a confirmation of the positive sentiment and would most probably lead the pair towards the next zone at 137.28. However, a potential deepening of the sell-offs and a violation of the mentioned support may lock the pair in the range of 133.29 – 132.56.
GBP/USD
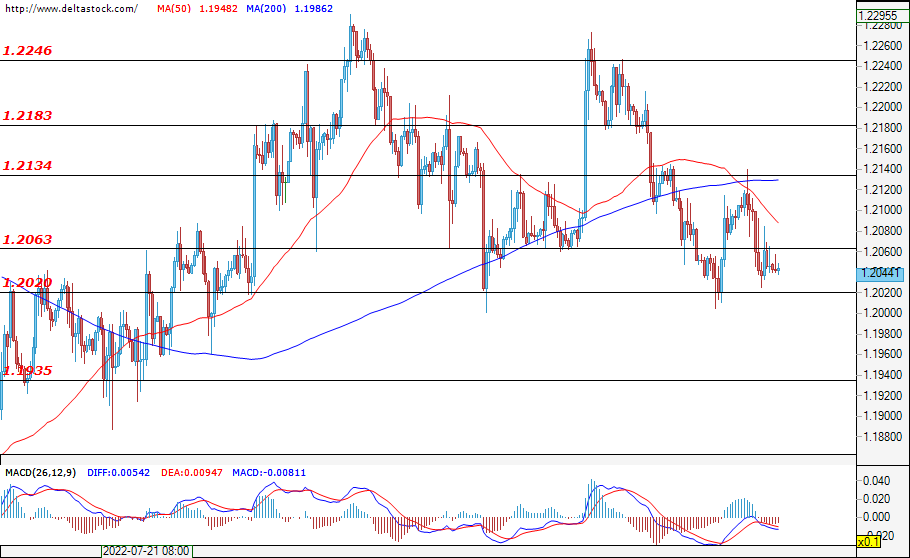
The support at 1.2020 appeared to be a strong obstacle for the bears to overcome. However, the forecast for today’s trading session is for a slight upward movement towards 1.2070, where the bears would most probably try to take control over the market and make another attempt to violate the mentioned support. A successful breach of this support level would easily head the pair toward the one at 1.1935, as the market sentiment remains strongly based on the appreciation of the greenback. On the other hand, if the bulls gain enough momentum to overcome the resistance at 1.2063, then their next target would be the resistance at 1.2134.
EUGERMANY40
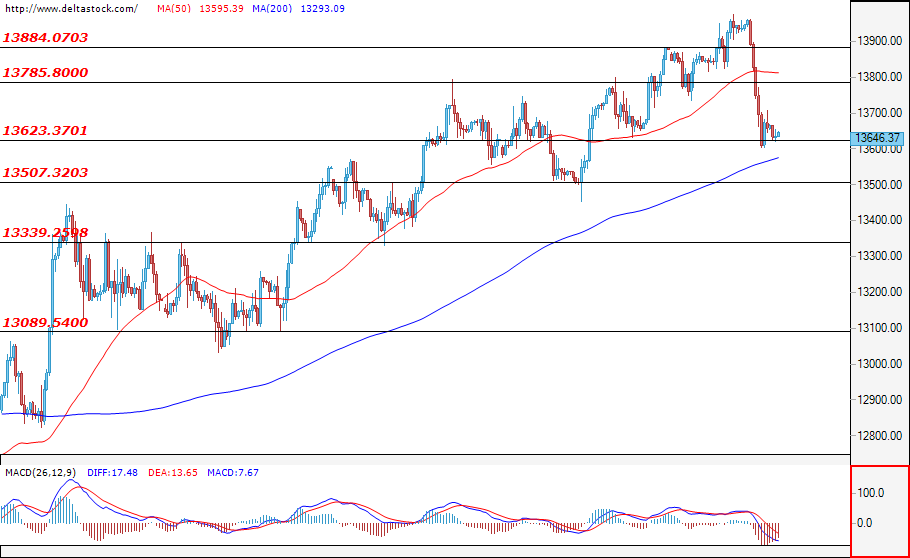
During yesterday’s trading session, the index underwent a massive sell-off, thus decreasing its value by approximately 2.5%, and at the time writing, the bears are trying to breach the support at 13623. A confirmation of the breach could continue the sell-off and easily head the bears for an attack on the psychological level at 13500. A violation of this zone could lead to new losses and could strengthen the negative expectations for the future path of the index. The first resistance for the bulls is now the level of 13785, followed by the upper zone at 13884. Keeping in mind the extreme drop from yesterday, however, a corrective movement towards the mentioned resistances is still quite likely.
US30
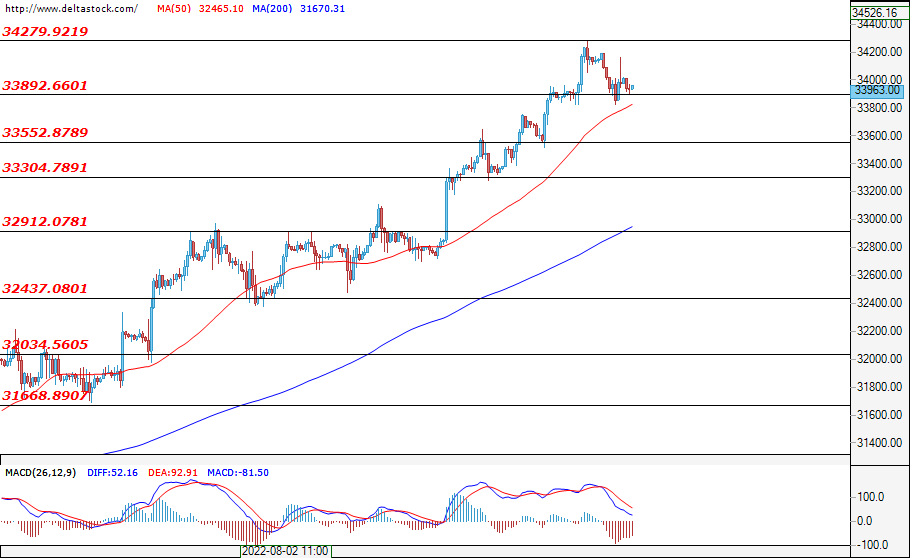
The US30 ended the session almost unchanged, holding its value just above the critical support at 33892. In case the bears manage to overcome this level, then it is highly likely to witness a rally towards the psychological level at 33500, and even lower towards around 33300. However, the mentioned support is quite strong, thus the forecast for today’s trading session is for the trading activity to remain above this level and for the price to consolidate in the range of 33892 – 34279.
GBP/JPY Daily Outlook
Daily Pivots: (S1) 162.14; (P) 162.86; (R1) 163.53; More...
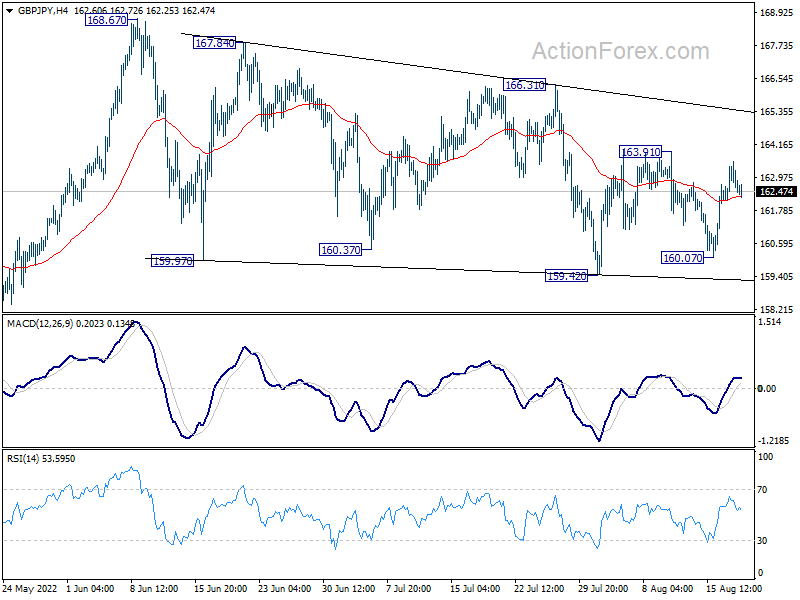
GBP/JPY is still staying in the corrective pattern from 168.67. Intraday bias is mildly on the upside for 163.91 resistance. Break there will target 166.31 resistance next. On the downside, below 160.07 will turn bias to the downside for 159.42 and below.
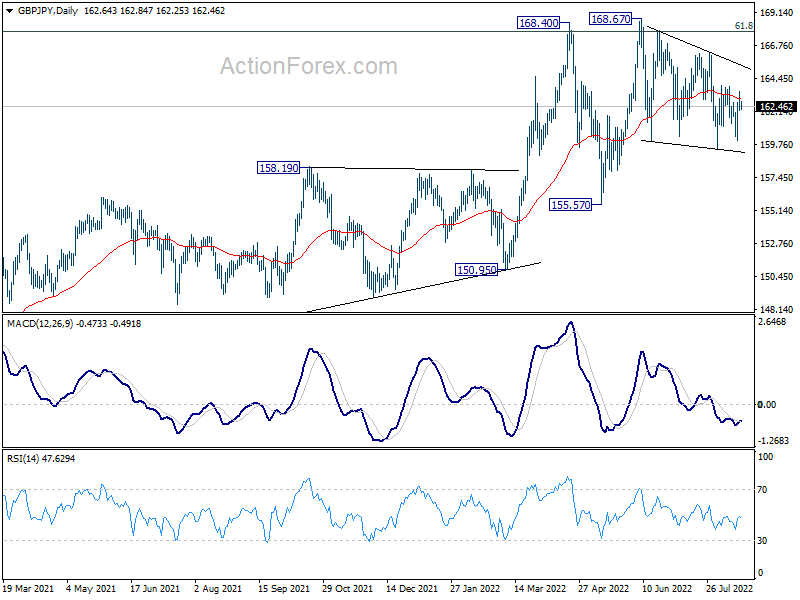
In the bigger picture, up trend from 123.94 (2020 low) is still in progress. Sustained break of 61.8% retracement of 195.86 (2015 high) to 122.75 (2016 low) at 167.93 will be a long term bullish signal, and could pave the way back to 195.86 high. This will remain the favored case as long as 155.57 support holds, even in case of deep pull back.
EUR/JPY Daily Outlook
Daily Pivots: (S1) 136.55; (P) 137.21; (R1) 138.16; More....
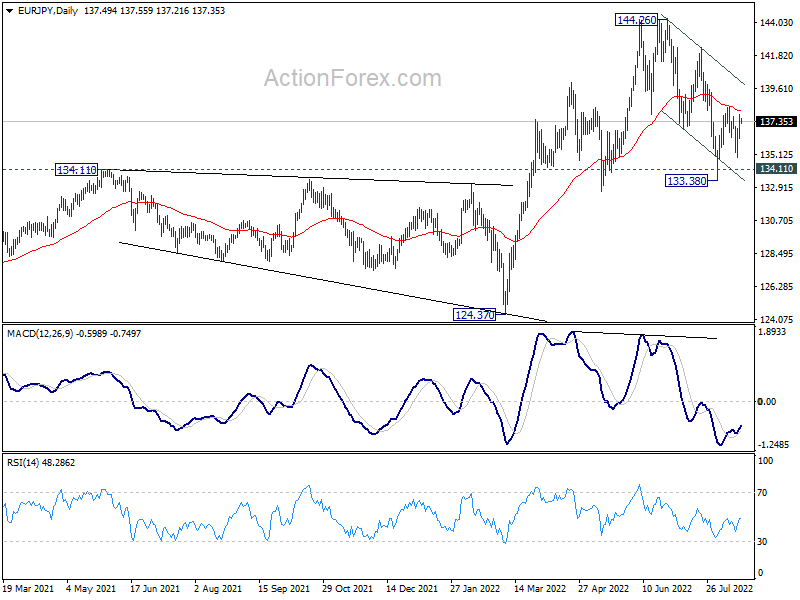
Intraday bias in EUR/JPY remains neutral for the moment. Overall, it's staying in the corrective pattern from 144.26. On the upside, above 138.38 will resume the rebound from 138.38. On the downside, below 134.93 will turn bias back to the downside for 133.38 support.
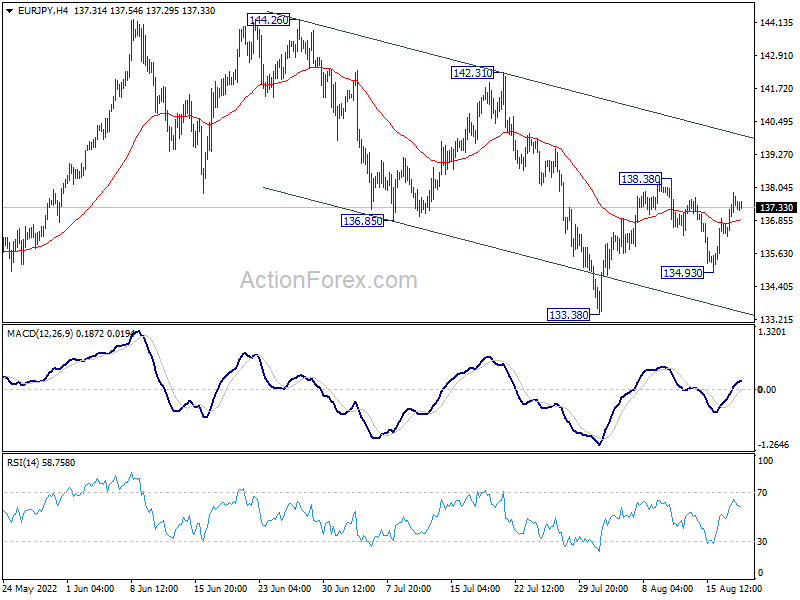
In the bigger picture, up trend from 114.42 (2020 low) is seen as the third leg of the pattern from 109.30 (2016 low). Further rally is in favor as long as 134.11 resistance turned support holds, even in case of deep pull back. Next target is 149.76 (2015 high). However, sustained break of 134.11 will be a sign of medium term bearish reversal and turn focus to 124.37 support for confirmation.