Sample Category Title
USD/JPY Regains Momentum, Eyes More Upsides
Key Highlights
- USD/JPY started a fresh increase above the 134.00 resistance.
- It cleared a major bearish trend line at 134.10 on the 4-hours chart.
- EUR/USD is struggling below the 1.0200 resistance zone.
- GBP/USD extended decline and spiked below the 1.2020 level.
USD/JPY Technical Analysis
The US Dollar formed a base above the 131.50 level and started a fresh increase against the Japanese Yen. USD/JPY broke the 133.20 and 133.50 resistance levels to move into a positive zone.
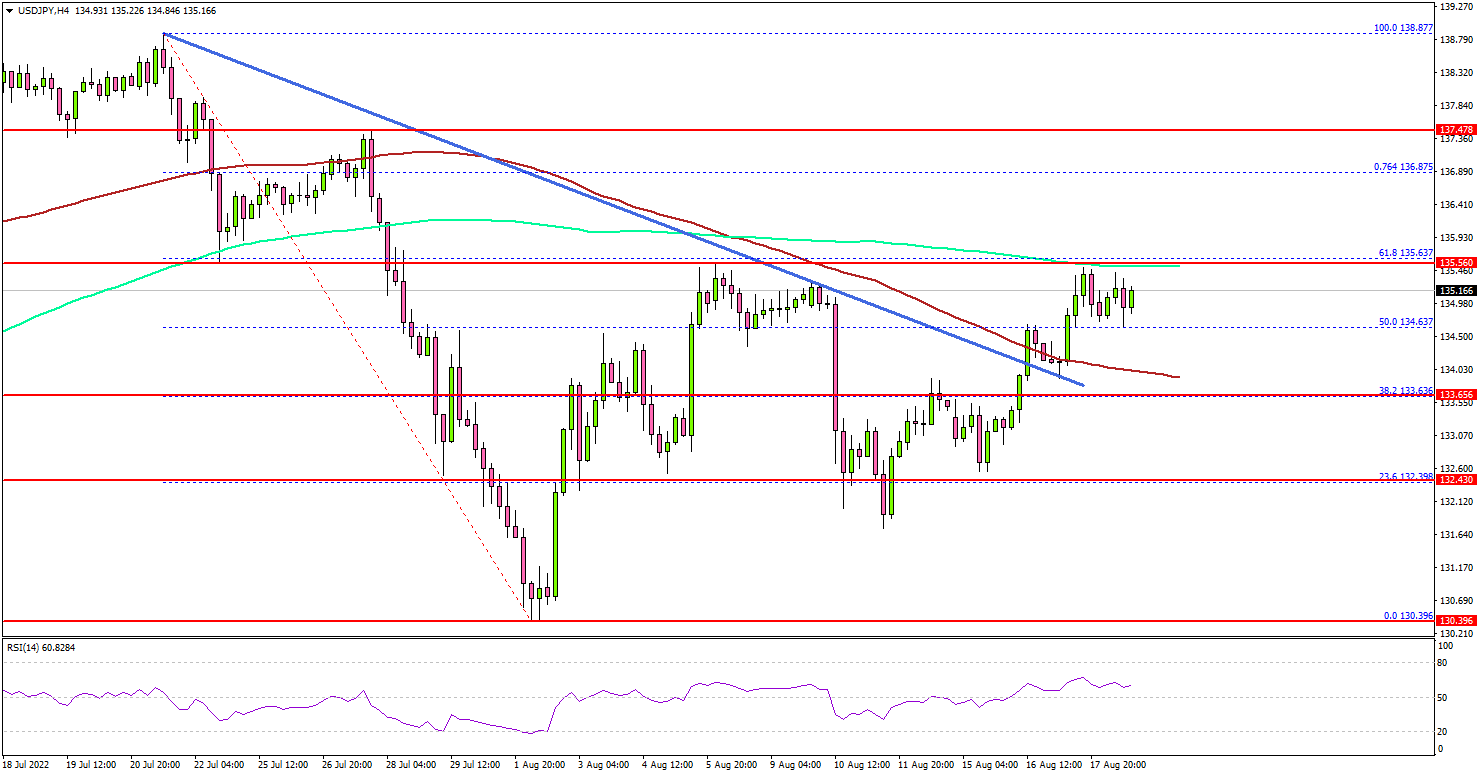
Looking at the 4-hours chart, the pair was able to settle above the 134.00 resistance and the 100 simple moving average (red, 4-hours). There was also a break above a major bearish trend line at 134.10.
The pair surpassed the 50% Fib retracement level of the downward move from the 138.87 swing high to 130.39 low. It is now showing positive signs above the 134.50 level. On the upside, the pair is facing resistance near the 135.65 level and the 200 simple moving average (green, 4-hours).
The next major resistance is near the 136.85 level. It is near the 76.4% Fib retracement level of the downward move from the 138.87 swing high to 130.39 low.
A clear move above the 136.85 resistance might send the pair higher towards the 138.00 level. The next major resistance is 138.80, above which the pair could accelerate higher. In the stated case, the pair could rise towards the 139.50 resistance zone in the near term.
On the downside, there is a decent support forming near 134.50 level. The main support is now forming near the 134.00 level. A downside break below the 134.00 support might push the pair in a negative zone.
Looking at EUR/USD, the pair remained in a bearish zone below the 1.0200 level and might extend losses in the near term.
Economic Releases
- UK Retail Sales for July 2022 (YoY) - Forecast -3.3%, versus -5.8% previous.
- UK Retail Sales for July 2022 (MoM) - Forecast -0.2%, versus -0.1% previous.
- Canadian Retail Sales for June 2022 (MoM) – Forecast +0.3%, versus +2.2% previous.
- Canadian Retail Sales ex Autos for June 2022 (MoM) – Forecast +0.9%, versus +1.9% previous.
Elliott Wave View: CADJPY Looking for 7 Swing
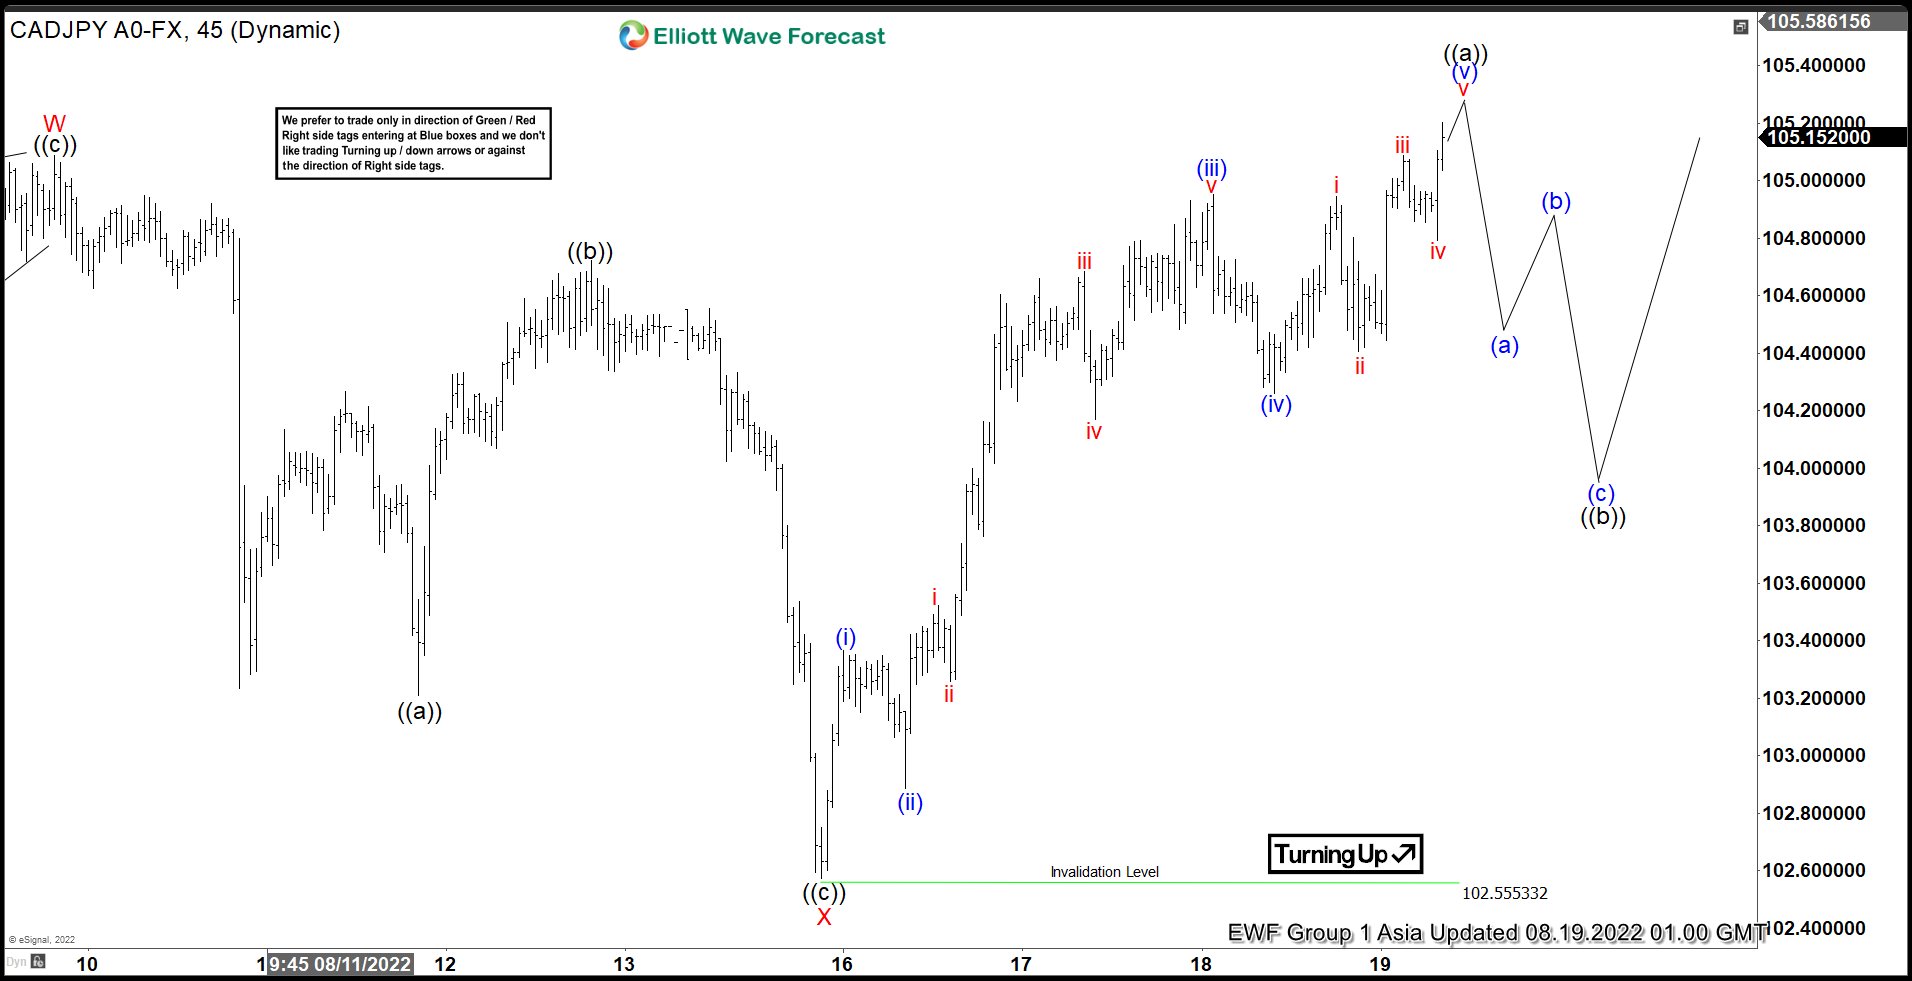
Short term view in CADJPY suggests rally from 8.2.2022 low is unfolding as a double three Elliott Wave structure. Up from 8.2.2022 low, wave ((a)) ended at 104.71 and dips in wave ((b)) ended at 102.93. Pair extended higher in wave ((c)) at 105.088 which completed wave W in higher degree. Pullback in wave X ended at 102.57 low as a zigzag structure. Down from wave W, wave ((a)) ended at 103.2, rally in wave ((b)) ended at 104.72, and final leg lower wave ((c)) ended at 102.57 which also completed wave X.
Wave Y is in progress higher with internal subdivision as a zigzag structure. Up from wave X, wave (i) ended at 103.36 and pullback in wave (ii) ended at 102.88. Pair then resumed higher in wave (iii) towards 104.95, and pullback in wave (iv) ended at 104.26. Near term, expect wave (v) to complete soon and this should also end wave ((a)) of the zigzag. Pair should then pullback in wave ((b)) to correct cycle from 8.15.2022 low in 3, 7, or 11 swing before the rally resumes. As far as pivot at 102.55 low stays intact, expect dips to find support in 3, 7, 11 swing for further upside.
CADJPY 45 Minutes Elliott Wave Chart
Eco Data 8/19/22
[php_everywhere instance="1"]
British Dips Below 1.20, Retail Sales Next
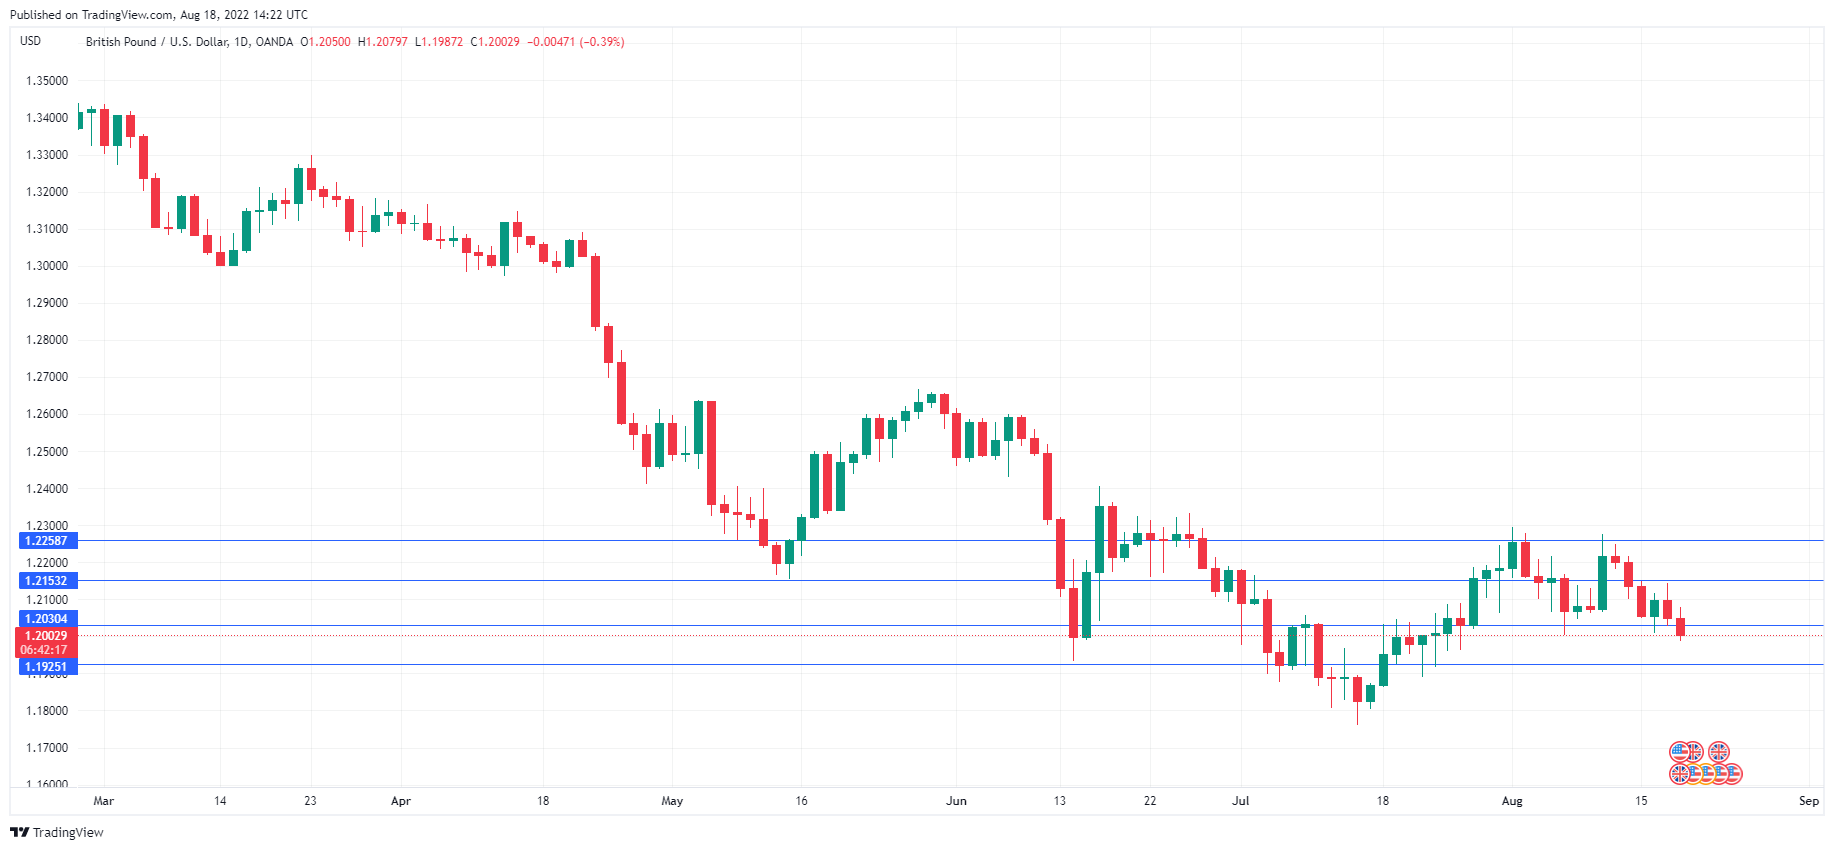
The British pound continues to lose ground and has fallen below the 1.20 line for the first time since July 26th. GBP/USD is trading at 1.1996 in the North American session, down 0.47%.
Pound eyes UK retail sales
It has been a busy economic calendar in the UK this week. Retail sales will wrap things up on Friday, with the markets bracing for more bad news from the consumer spending front. Retail Sales fell 5.8% YoY in June, and the forecast for July stands at -3.3%.
A continuing decline in consumer spending shouldn’t be a surprise, given the grim economic picture. Headline inflation rose to 10.1% YoY in July, up from 9.4% in June and above the forecast of 9.8%. The BoE has been raising interest rates in an effort to curb inflation, but don’t hold your breath. The central bank has warned that it doesn’t expect inflation to peak before it hits a staggering 13% in October. As well, real wages fell 3% in Q2, making it even harder for workers to keep up with the cost-of-living crisis, and the energy price cap will increase substantially in October. The British consumer is trying to ease the pain by cutting back on spending, but this will hurt the economy and could cause the economy to tip into a recession even faster.
The FOMC minutes on Wednesday didn’t contain anything unexpected. The minutes reiterated that monetary tightening would continue until inflation eased significantly. Meeting participants noted that the pace of rate hikes would ease once inflation cooled down. They also said that inflation is not showing signs of peaking. The markets do not appear to have absorbed this hawkish message, with the surprise drop in US inflation resulting in the markets expecting a U-turn in Fed policy. This has led to gains in the equity markets and a downward trend for the US dollar.
GBP/USD Technical
- GBP/USD is testing support at 1.2030. Below, there is support at 1.1925
- There is resistance at 1.2153 and 1.2258
EURGBP Stays Stuck Between Two Diagonal Trendlines
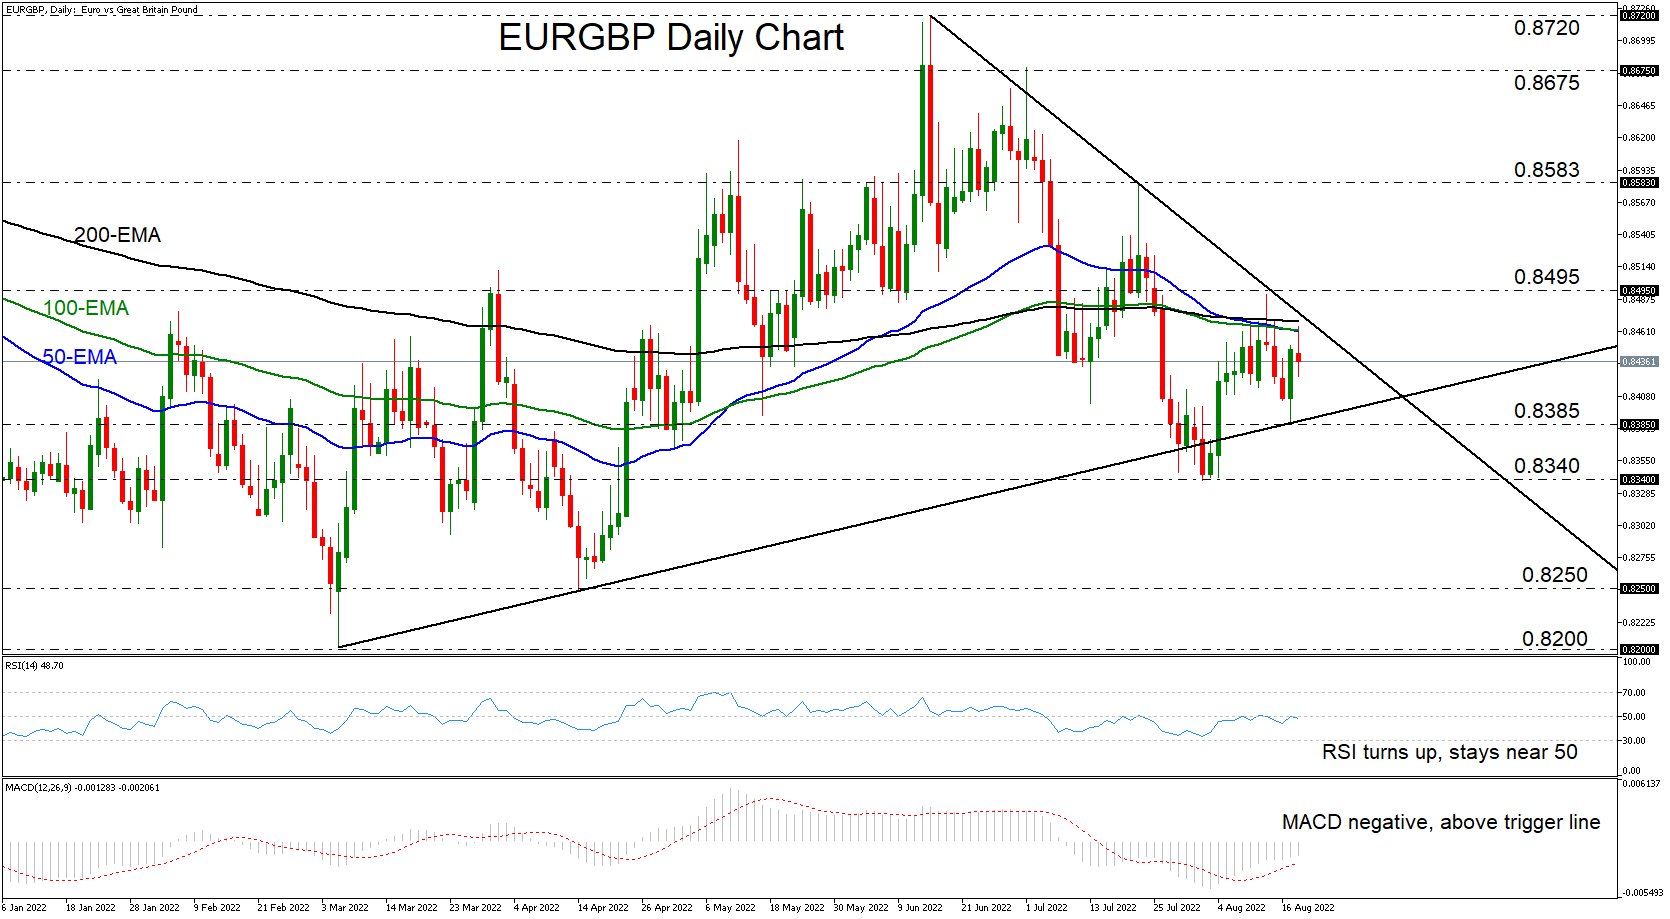
EURGBP traded higher yesterday, after hitting support at the crossroads of the 0.8385 level and the tentative upside line drawn from the low of low of March 7. Nonetheless, the advance remained limited near the conversion point of all the plotted exponential moving averages (EMAs), slightly below the downside line drawn from the high of June 15.
This likely keeps the near-term outlook neutral, a view also enhanced by the daily oscillators. The RSI rebounded somewhat, but it has now flattened near its 50 line, signaling a lack of directional momentum. The MACD, although negative, remains above its trigger line and is getting closer to zero, suggesting that the downside speed is now fading.
The bears may regain full control upon a dip below 0.8385, which could also confirm the break of the upside support line taken from the low of March 7. The next area to consider as a support may be at 0.8340, a zone which prevented the bears from drifting further south at the beginning of this month. However, if that obstacle is cleared this time around, a dive all the way down to the April 14 low at 0.8250 may be possible.
Alternatively, the move that could encourage more bulls to jump into the action may be a recovery above the high of August 12, at around 0.8495. This would confirm a forthcoming higher high on the daily chart and could set the stage for advances towards the peak of July 21, at 0.8583. Another break above 0.8583 could extend the advance towards the July 1 high, near 0.8675.
In short, EURGBP is stuck between two diagonal lines, and although the plotted moving averages are providing resistance, our oscillators detect a lack of, or little, directional momentum. This likely paints a neutral near-term picture for now.
Dollar Index: Bulls Remain in Play But Face Strong Headwinds
The dollar index remains at the front foot, underpinned by dominating factors, such as high inflation, rising interest rates and global growth concerns.
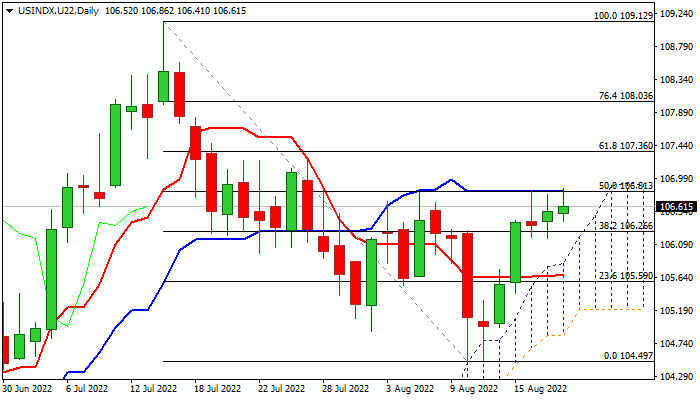
Bounce from Aug 10/11 double-bottom (104.50) retraced 50% of corrective 109.12/104.50 downleg, with bulls being supported by rising daily cloud, but started to lose traction in past three days after strong acceleration last Mon/Fri.
Rally faces strong headwinds from significant barrier at 106.81 (daily Kijun-sen / 50% retracement) and holding below here for the third consecutive day, though the sentiment remains positive and current congestion is seen as a consolidation ahead of fresh push higher, with positive stance seen while the price action stays above daily cloud top, also current range floor (106.20).
Strengthening positive momentum and daily moving averages turning to full bullish configuration, along with rising daily cloud underpinning the action, point to positive technical studies on daily chart and adding to supportive fundamentals.
Eventual break of 106.81 pivot would signal bullish continuation and expose next strong obstacle at 107.36 (Fibo 61.8%) break of which is needed to confirm higher base at 104.50 and an end of corrective phase from 109.12 (July 14 top).
Res: 106.81; 107.12; 107.36; 108.03.
Sup: 106.41; 106.20; 106.02; 105.68.
ECB Schnabel’s Comments a Very Strong Nod Towards a 50 bps Rate Hike at September Meeting
Markets:
An interview by ECB Schnabel grabs most headlines today. She told Reuters that concerns about the inflation outlook, which triggered a 50 bps rate hike in July, have not been alleviated. The move wasn’t enough to alter the outlook and even a recession on its own would not be enough to tame inflation pressures. Inflationary pressures won’t vanish quickly and tackling the risk of inflation expectations becoming de-anchored primes downside growth/recession risks. Schnabel’s comments are a very strong nod towards a new 50 bps rate hike at the September 8 policy meeting. Such move is discounted in money markets, but we think that markets are too dovish further down the line. They discount a deposit rate of around 1% by year-end, suggesting the ECB will slowdown its tightening to 25 bps moves in October and December. Our preferred scenario includes more 50 bps moves. The hawkish Schnabel comments come on the heels of this week’s core bond sell-off and didn’t trigger that much of reaction. German Bunds do underperform US Treasuries. German yield rise slightly across the curve whereas US yields lose 2 bps (30-yr) to 5 bps (2-yr).
US eco data can’t explain the difference. US jobless claims declined slightly, from 262k to 250k while the July Philly Fed business outlook parted ways with a horrible Empire manufacturing survey earlier this week. The Philly Fed gauge unexpectedly improved from -12.3 to 6.2. Details showed an increase in new orders and shipments as well as number of employees. Prices paid fell to the lowest level since December 2020 in the only similarity with NY survey. This likely reflects a decline in energy costs. The six-month forward outlook remains depressed compared with the current situation. FX markets remain stoic. EUR/USD still trades in the 1.01-1.02 area with EUR/GBP flipping sides around 0.8450. News Headlines:The Norwegian central bank raised its key policy rate as expected by 50 bps, from 1.25% to 1.75%. It’s the second consecutive move from this size since the Norges Bank switched strategies back in June: from gradualism to frontloading. And that’s exactly what the central bank will continue to do. Governor Wolden Bache indicates that the policy rate will most likely be raised further in September based on the current assessment of the outlook and the balance of risks. Economic activity is high with little spare capacity. Inflation has been considerably higher (CPI-ATE 4.5% Y/Y in July) and more broad-based than projected in June with a risk that it remains higher for longer and becomes entrenched in inflation expectations. A markedly higher policy rate is needed to ease pressures in the Norwegian economy and to bring inflation down to target even as there is a risk of sharper slowdown in (global) growth and a cooling down of the housing market. This suggests a faster rise in the policy rate so that the central bank doesn’t need to tighten policy even sharper later on. Norwegian money markets discount a policy cycle peak of 3.75% early next year. The Norwegian krone gained some ground after the decision with EUR/NOK sliding from 9.90 towards 9.83. The NOK swap curve turns even more inverse today with front-end yields rising around 5 bps. The Turkish central bank cut its policy rate unexpectedly from 14% to 13% in a context of 80% Y/Y inflation (24-yr high) and an extremely weak currency. Turkish president Erdogan is an outspoken follower of his own unorthodox theory that monetary policy easing tackles inflation. He finally found a TCMB-governor willing to walk the talk. The official statement nevertheless points to the economic side of story. Leading indicators for the third quarter point to some loss of momentum in economic activity. The MPC deems it important that financial conditions remain supportive to preserve growth momentum in industrial production and the positive trend in employment in a period of increasing uncertainties regarding global growth as well as escalating geopolitical risk. Therefore, it cut the policy rate by 100 bps, but judges this one-off cut as appropriate given the outlook. The Turkish lira pays the price with EUR/TRY approaching the YTD high at 18.50.
EUR/USD Mid-Day Outlook
Daily Pivots: (S1) 1.0149; (P) 1.0176; (R1) 1.0206; More...
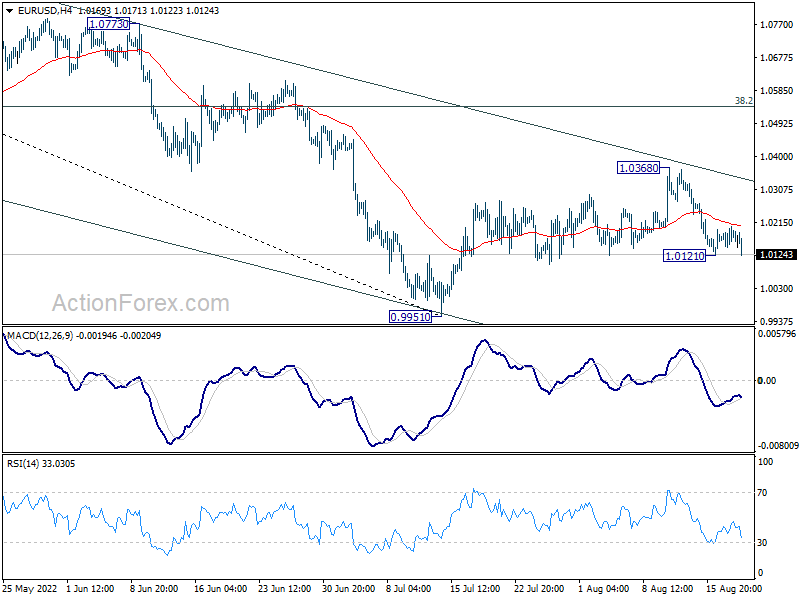
Intraday bias in EUR/USD stays neutral first, and risk stays on the downside as long as 1.0368 resistance holds. Rebound from 0.9951 should have completed at 1.0368 after rejection by 55 day EMA, as well as falling channel resistance. Break of 1.0121 minor support will target a retest on 0.9951 low. Firm break there will resume larger down trend.
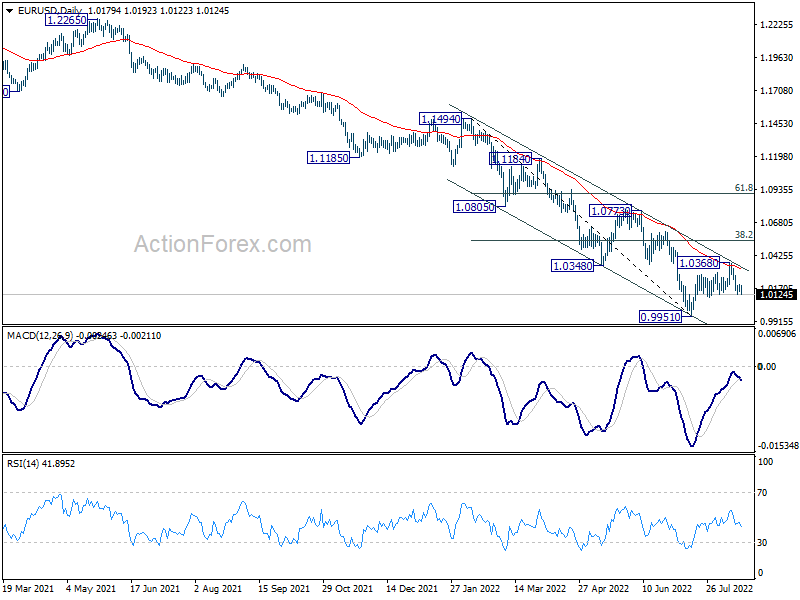
In the bigger picture, down trend from 1.6039 (2008 high) is still in progress. Next target is 100% projection of 1.3993 to 1.0339 from 1.2348 at 0.8694. In any case, outlook will stay bearish as long as 1.0773 resistance holds, in case of strong rebound.
GBP/USD Mid-Day Outlook
Daily Pivots: (S1) 1.2008; (P) 1.2075; (R1) 1.2123; More...
Intraday bias in GBP/USD remains mildly on the downside at this point. Rebound from 1.1759 could have completed at 1.2292, after rejection by 55 day EMA. Deeper fall should be seen to retest 1.1759 low. Break there will resume larger down trend. On the upside, above 1.2142 minor resistance will mix up the outlook and turn intraday bias neutral first.
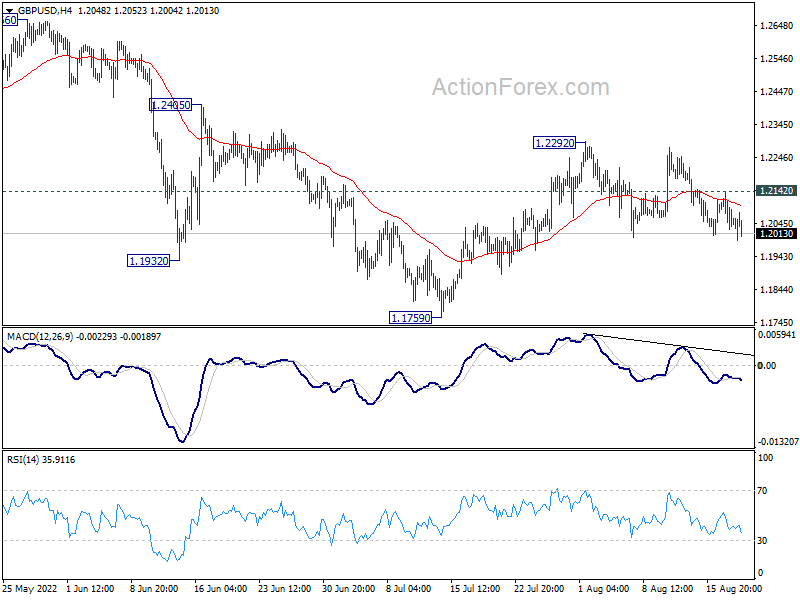
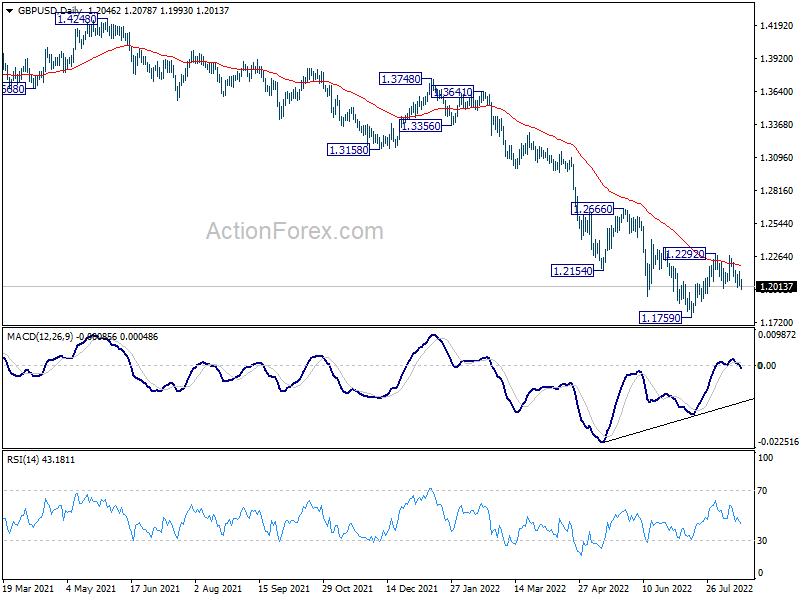
In the bigger picture, fall from 1.4248 (2018 high) could be a leg inside the pattern from 1.1409 (2020 low), or resuming the longer term down trend. Deeper decline is expected as long as 1.2666 resistance holds. Next target is 1.1409 low. However, firm break of 1.2666 will bring stronger rise back to 55 week EMA (now at 1.2897).
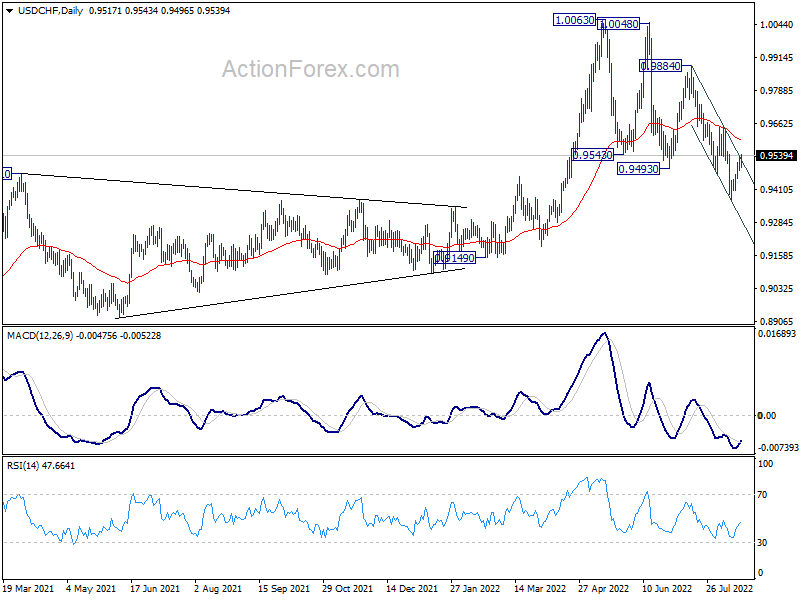
USD/CHF Mid-Day Outlook
Daily Pivots: (S1) 0.9461; (P) 0.9488; (R1) 0.9522; More...
No change in USD/CHF's outlook and intraday bias stays neutral first. Recovery from 0.9369 should be limited well below 0.9648 resistance to bring another fall. On the downside, break of 0.9369 will resume larger decline from 1.0063 towards 0.9149 support next. However, firm break of 0.9648 will turn bias back to the upside for 0.9884 resistance instead.
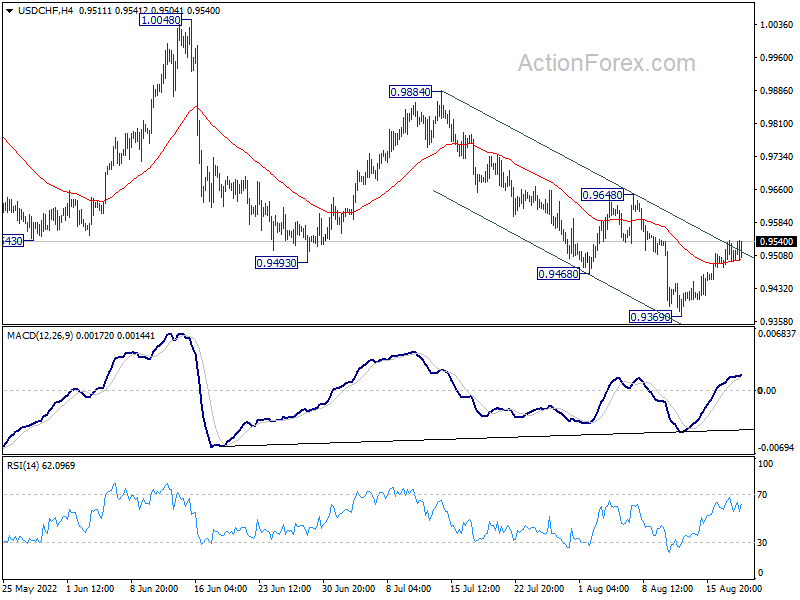
In the bigger picture, break of 0.9471 support turned resistance argues that medium term up trend from 0.8756 has completed with three waves up to 1.0063. Long term sideway pattern might have started another falling leg. Deeper decline would now be in favor as long as 0.9648 resistance holds, to 0.9149 structural support. Sustained break there could pave the way back to 0.8756.