Sample Category Title
What to Expect from FOMC Meeting on July 27th
On Wednesday, 27th of July, at 18:00 GMT, the Fed will release its monetary policy decision, including the interest rate and the QE programme. The news is expected to cause a surge of volatility in the USD and across the markets.
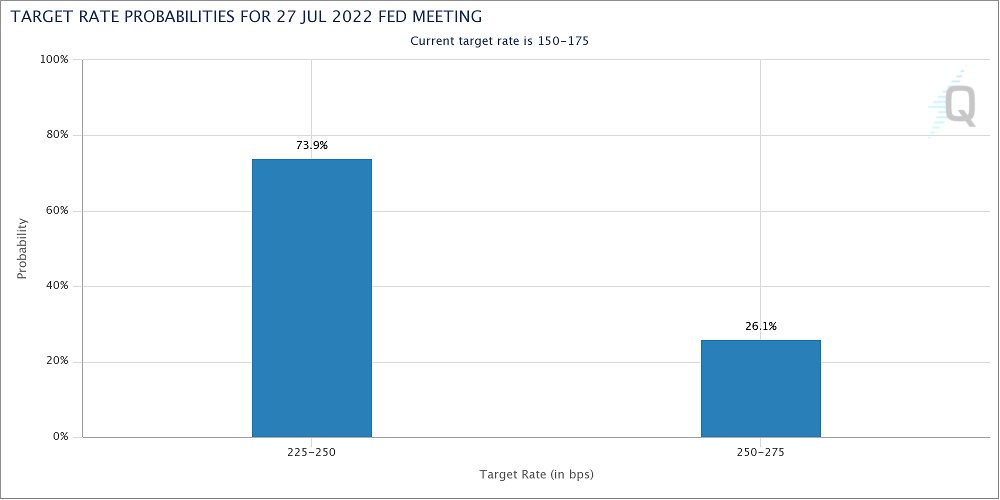
Analysts expect the FOMC to raise the rate by 75 basis points to 2.5%. This is an extraordinarily sharp and rare hike for the Fed. Moreover, interest rate futures price a 26% chance of a 100 bp hike. In addition to policy changes, market participants will also pay attention to sentiment regarding the economic outlook and the next Fed moves.
Signals that the Fed is now to slow the pace of policy tightening indicate concern about the rate of economic growth and less about inflation which could put pressure on the dollar and increase appetite for risks.
On the contrary, tolerance for slower economic growth and a determination to continue fighting inflation could breathe new life into the dollar rally and trigger a sell-off in risk-sensitive instruments.
AUDNZD Wave Analysis
- AUDNZD broke resistance level 1.1100
- Likely to rise to resistance level 1.1165
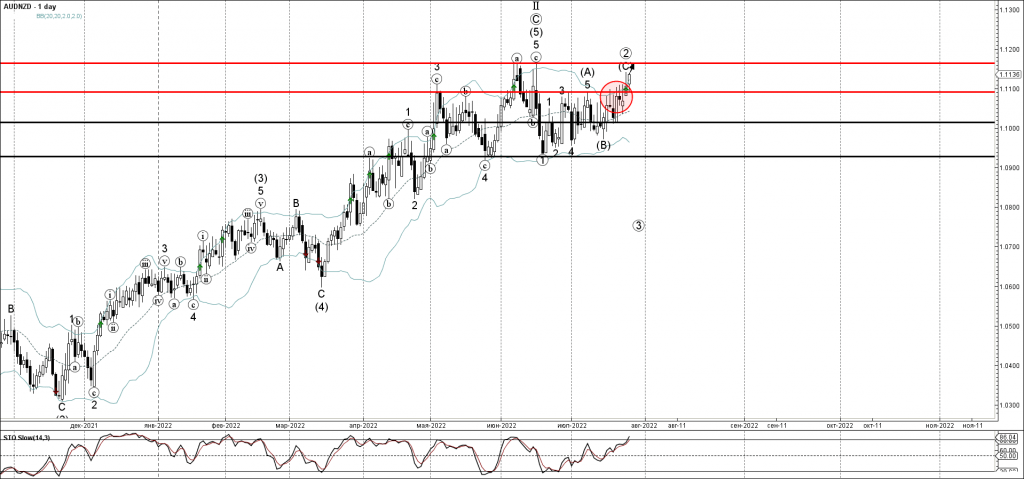
AUDNZD recently broke the key resistance level 1.1100 (which has been steadily reversing the pair from the end of June).
The breakout of the resistance level 1.1100 continues the active intermediate impulse wave (C) from the middle of July.
Given the clear daily uptrend, AUDNZD can be expected to rise further toward the next round resistance level 1.1165 (previous double top from the start of June).
Silver Wave Analysis
- Silver reversed from support level 18.30
- Likely to rise to resistance level 18.90
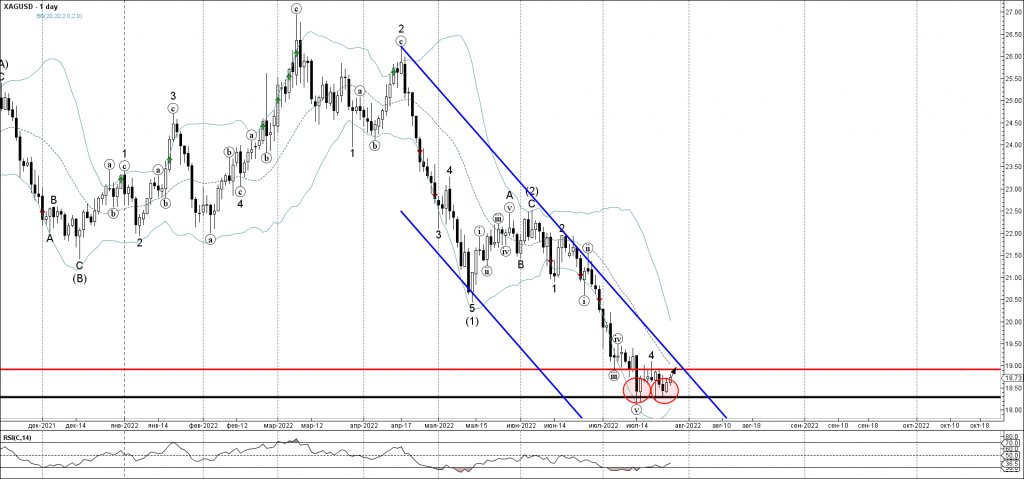
Silver earlier reversed up from the pivotal support level 18.30 (which has been steadily reversing the price from the end of June).
The upward reversal from the support level 18.30 created the daily Bullish Engulfing – which stopped the earlier minor impulse wave 5.
Silver can be expected to rise further toward the next resistance level 18.90 (top of the earlier minor correction 4 and also the low of wave (iii) from the start of July).
USD/JPY Pair Moved into a Positive Zone Above $136.20
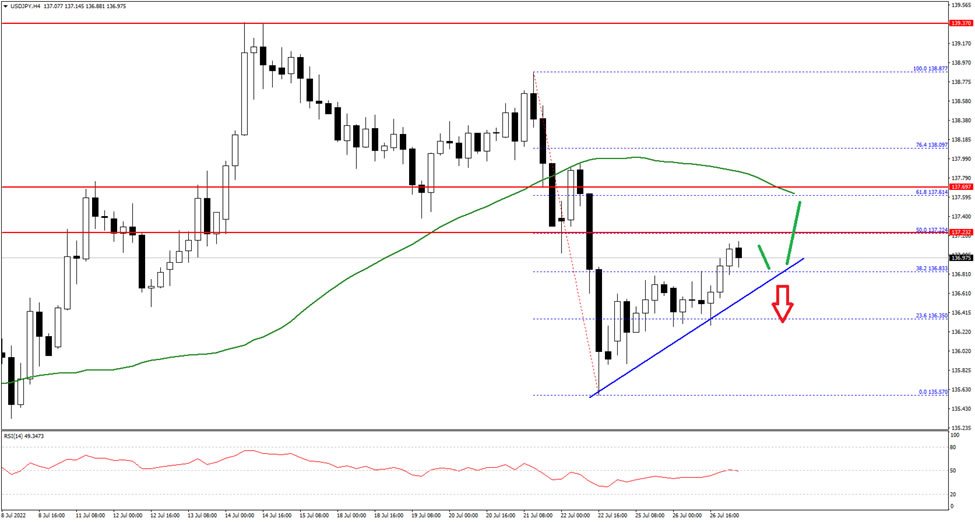
The US Dollar started a fresh increase after it tested the 135.60 zone against the Japanese Yen. The USD/JPY pair traded above the 136.20 level to move into a positive zone.
The pair even moved above the 137.00 level, but it is still well below the 50 hourly simple moving average. It is now consolidating near the 137.00 level, with an immediate resistance at 137.25 on FXOpen.
The first major resistance is near the 137.50 zone and the 50 hourly simple moving average. A clear break above the 137.50 resistance could push the price towards 138.00. The next major resistance is near the 138.80 level.
On the downside, an initial support is near the 136.80 zone and a trend line on the hourly chart. The next major support sits near the 136.20 level, below which there is a risk of more downsides towards the 135.60 level.
NZDUSD Range Bound after Rbound Stalls at 50-SMA
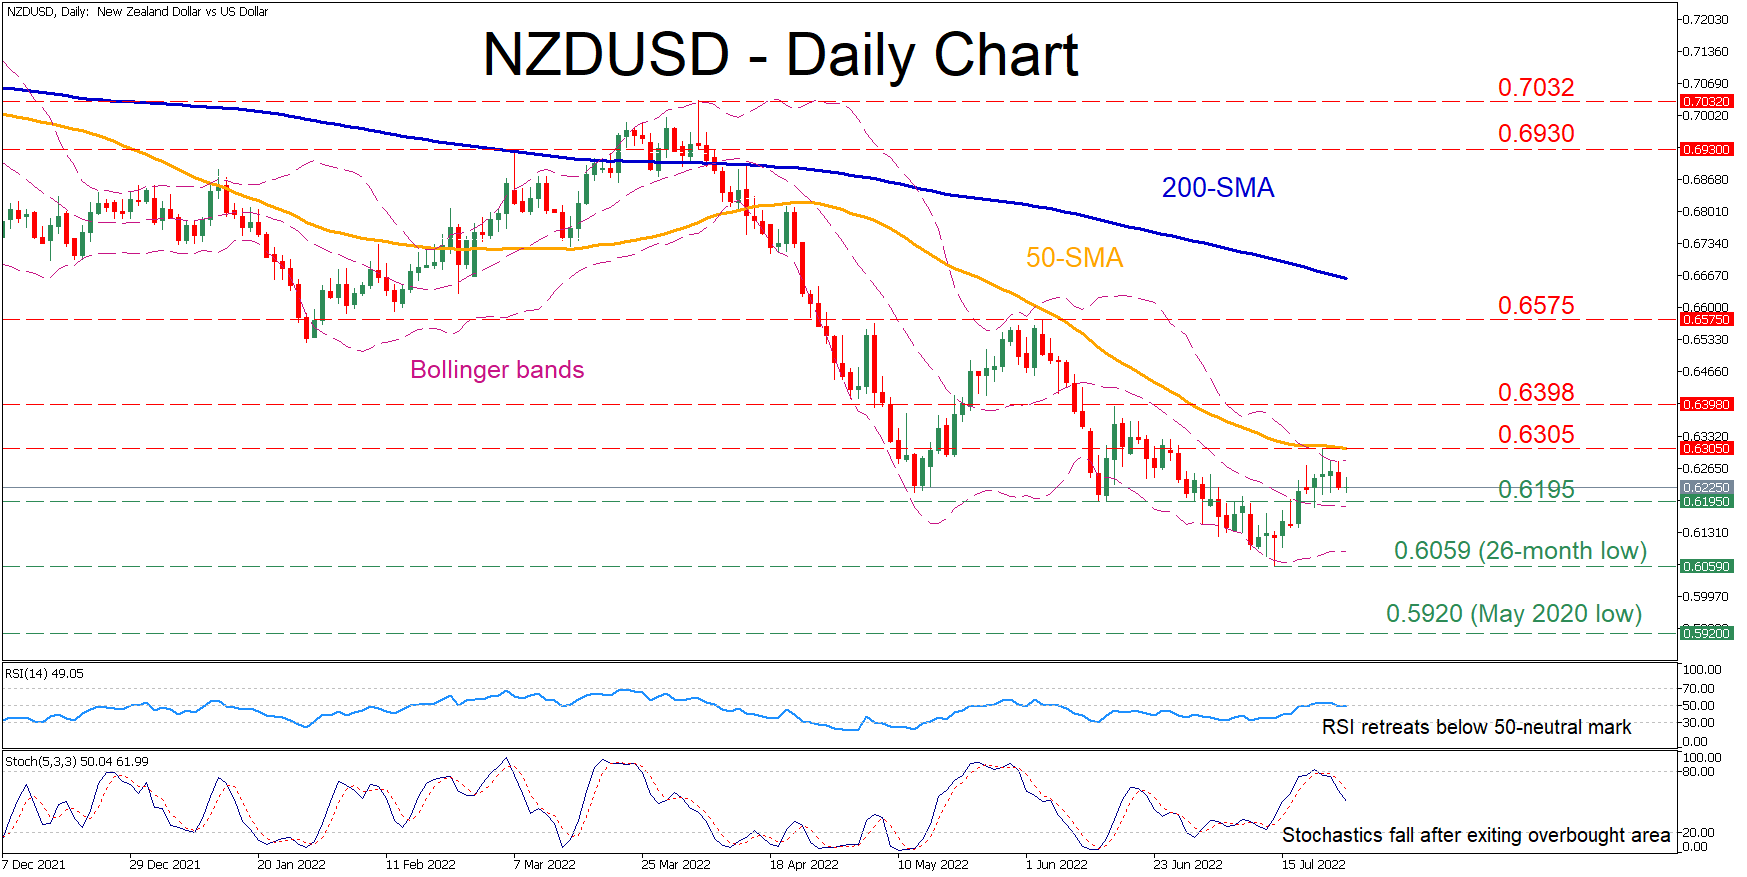
NZDUSD has been in a extended downtrend since March when it peaked at the 0.7032 region. Although the price has managed to regain some lost ground after its downfall ceased at the 26-month low of 0.6069, it is currently being held down by the congested region that includes its 50-day simple moving average (SMA) and the upper Bollinger band.
The short-term oscillators suggest that the positive momentum is waning. Specifically, the RSI has crossed below its 50-neutral threshold, while the stochastic oscillator is descending after being rejected at the 80-overbought area.
To the downside, bearish actions could send the price to test the June support of 0.6195. Further downside pressure may then open the door for the 26-month low of 0.6059. A violation of the latter could send the price to form fresh multi-year lows, where the May 2020 low of 0.5920 could be the next support region.
On the flipside, if buying interest intensifies, the recent peak of 0.6305, which overlaps with the 50-day SMA, could act as immediate resistance. Piercing through this region, the bulls could challenge 0.6398 before the spotlight turns to the June high of 0.6575. Higher, 0.6930 might prove to be a tough barrier for the price to overcome.
Overall, even though NZDUSD’s short-term picture has been improving, its recovery seems to be running out of steam. Therefore, a clear break above its 50-day SMA is needed to signal the resumption of the pair’s latest rebound.
Sell-off in Gold a Bit Underwhelming
Gold is holding steady ahead of the FOMC rate decision. Such a lull is often the prologue to a good move. Gold has been moving in a broad sideways loop of $1680-$2070 after solid gains for almost two years.
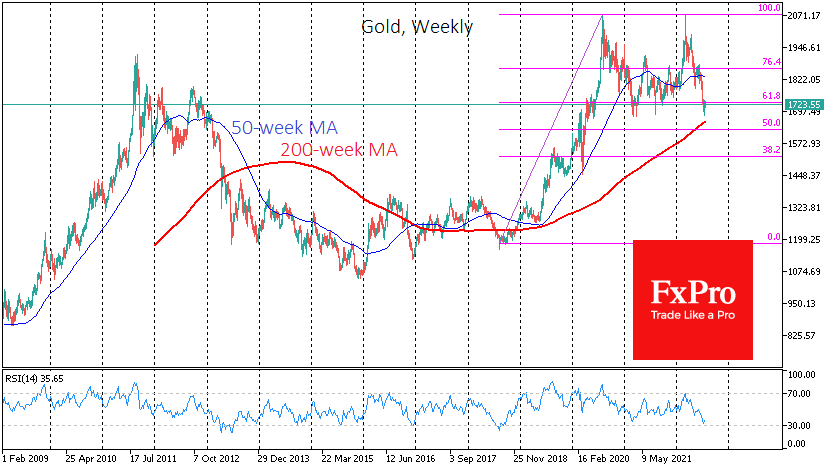
At the current levels near $1720, gold is consolidating near the 61.8% Fibonacci level of the two-year trend from August 2018 to August 2020. Last week, the price briefly dipped below $1680, touching the lower end of a two-year consolidation range. However, the sell-off did not continue, and the price quickly returned to levels above $1700.
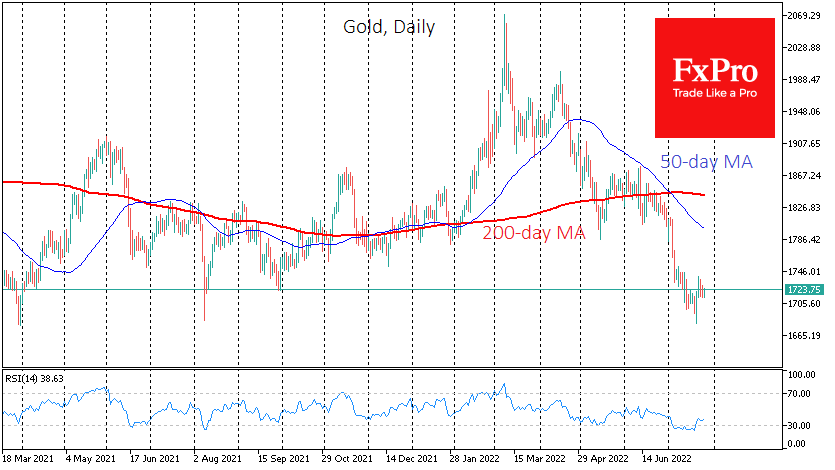
On the technical analysis side, gold did not enter the oversold area on the weekly RSI charts. In the previous ten years, moving from the overbought or oversold area to the “normal territory” between 30-70 was the formal start of the massive countertrend move, or it marked the end of it.
We also expected that the sellers of gold would push its price to the 200-week moving average line, following Bitcoin’s example. That line is now near $1655, and last week’s sell-off only stopped at $20 from there, though the price has not been shy about crossing that line over the previous six years.
The technically uncompleted sell-off in gold, combined with the recent lull – rebalancing – causes us to prepare for another wave of sell-off in gold on today’s FOMC decision or on the release of the preliminary Q2 GDP estimates later in the week.
At the same time, we cannot overlook several factors supporting buyers. Gold is holding up relatively well in the face of unprecedented monetary policy tightening and a slowing global economy. Ten years ago, in similar macro circumstances, the price gave up around 70% of the previous rally.
It is often the case that August-September lays the foundations for a new long-term trend in gold. And this time, it could be the return of a bull market. Today’s FOMC decision may mark the peak of the hawks, and other monetary policy decisions will be less aggressive.
Also, do not be overly fearful of today’s Fed 75–100-point hike. In 2015, the first rate hike since the global financial crisis marked the low point for gold in that cycle.
On balance, we have a significant concentration of factors around gold. A sharp dip under 1650 and subsequent sustained pressure in the coming days could be the first sign that the bears have not tired, and it may make sense to talk about a decline in gold lasting up to several years after that. Increased buying in a near oversold asset could signal that the two-year sideways slide is over and that gold will shine again, renewing record highs as early as next year.
XAU/USD: Gold Looks for Fresh Direction Signals from Fed
Spot gold is holding within a tight range ahead of week’s key event – Fed rate decision that is expected to influence metal’s near-term outlook.
The US Federal Reserve is widely expected to raise interest rates by 0.75% for the second time, following June’s 75 basis points hike, in attempts to put raging inflation under control, but also trying to avoid triggering a recession.
Gold price would hold ground or slide on 0.75% hike, as higher interest rates make the dollar more attractive, however investors focus on Fed Chair Powell’s comments in the press conference following the rate decision, to get more clues about the central bank’s steps in the near future.
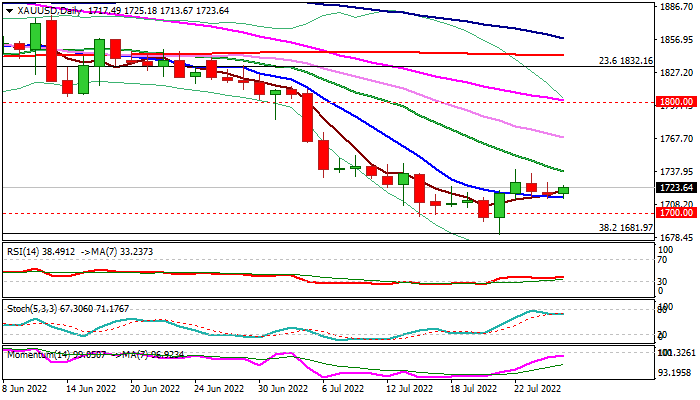
This will be crucial for metal’s short term direction, as hawkish signals would inflate dollar and increase pressure on gold that would result in renewed attempt through psychological $1700 support and retest of key Fibo support at $1681 (38.2% retracement of larger $1046/$2074 uptrend) cracked on July 21.
On the other side, Fed turned its focus fully on inflation and any signs that inflation is peaking, would soften the central bank’s tone about the future actions that would turn overall stance dovish and offer fresh support to the bullion.
Initial support lays at $1710 (daily Tenkan-sen) followed by pivots at $1700 (psychological) and $1681 (Fibo), clear break of which would risk drop towards $1600 (psychological) and $1560/44 (50% of $1046/$2074 / monthly cloud top).
On the other side, acceleration through pivotal barriers at $1756 (Fibo 38.2% of $1879/$1680) and $1764 (daily Kijun-sen) would sideline downside risk and shift near-term focus to the upside.
Res: 1739; 1756; 1764; 1786.
Sup: 1710; 1700; 1681; 1658.
GBP/JPY Daily Outlook
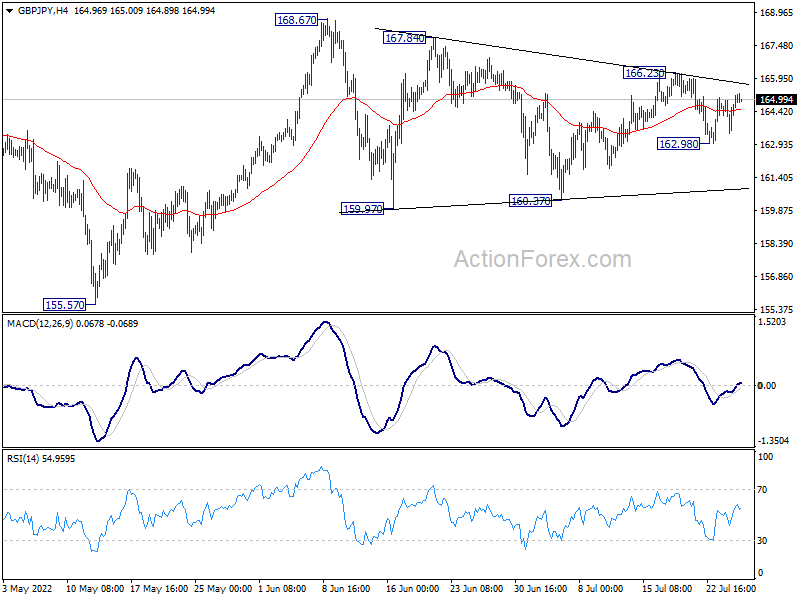
Daily Pivots: (S1) 163.82; (P) 164.40; (R1) 165.31; More...
Intraday bias in GBP/JPY remains neutral first. Corrective pattern from 168.67 could still extend further. Below 162.98 minor support will target 160.37. Nevertheless, break of 166.23 will bring retest of 168.67 high instead. And, larger up trend might be ready to resume in this case.
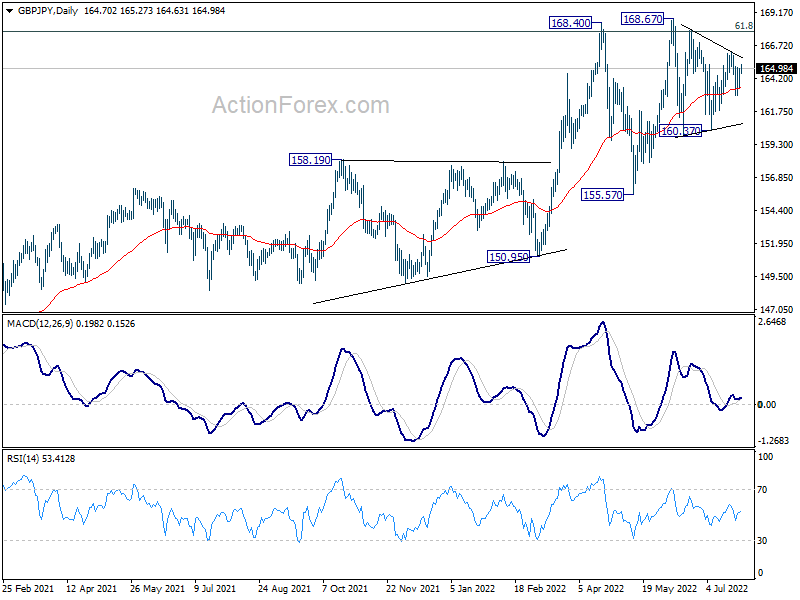
In the bigger picture, up trend from 123.94 (2020 low) is still in progress. Sustained break of 61.8% retracement of 195.86 (2015 high) to 122.75 (2016 low) at 167.93 will be a long term bullish signal, and could pave the way back to 195.86 high. This will now remain the favored case as long as 155.57 support holds, even in case of deep pull back.
EUR/JPY Daily Outlook
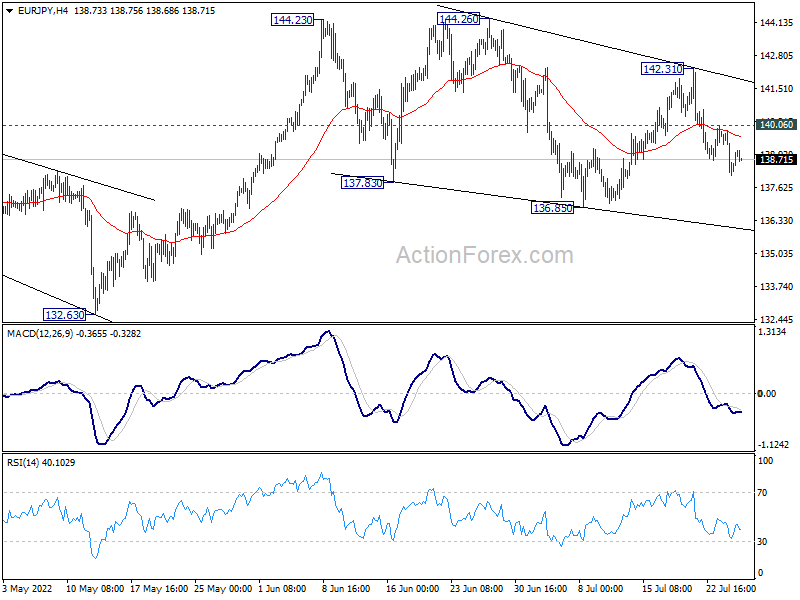
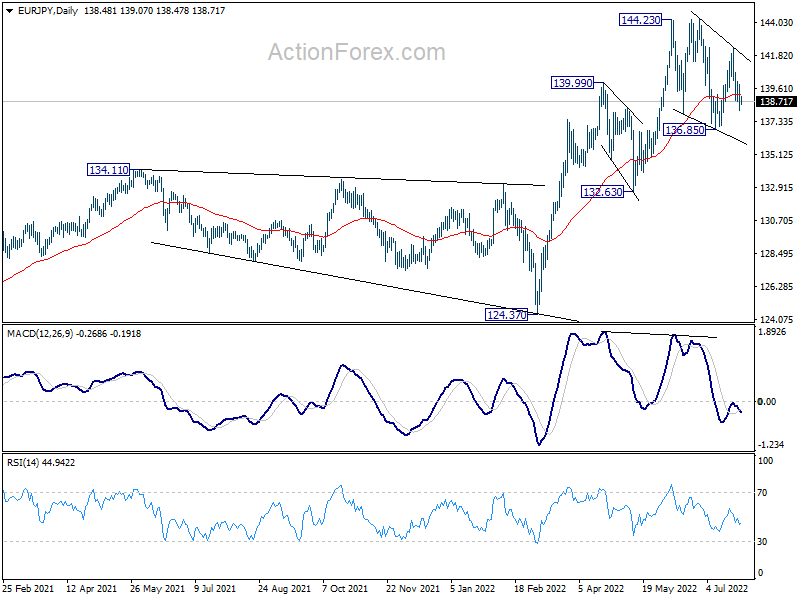
Daily Pivots: (S1) 137.85; (P) 138.84; (R1) 139.55; More....
Intraday bias in EUR/JPY remains mildly on the downside for the moment. Fall from 142.31 is seen as a falling leg inside the corrective pattern from 144.23. Deeper decline would be seen to 136.85 support. On the upside, above 140.06 minor resistance will turn bias back to the upside for 142.31 resistance instead.
In the bigger picture, up trend from 114.42 (2020 low) is seen as the third leg of the pattern from 109.30 (2016 low). Further rally is in favor as long as 134.11 resistance turned support holds, even in case of deep pull back. Next target is 149.76 (2015 high). However, sustained break of 134.11 will be a sign of medium term bearish reversal and turn focus to 124.37 support for confirmation.
EUR/GBP Daily Outlook
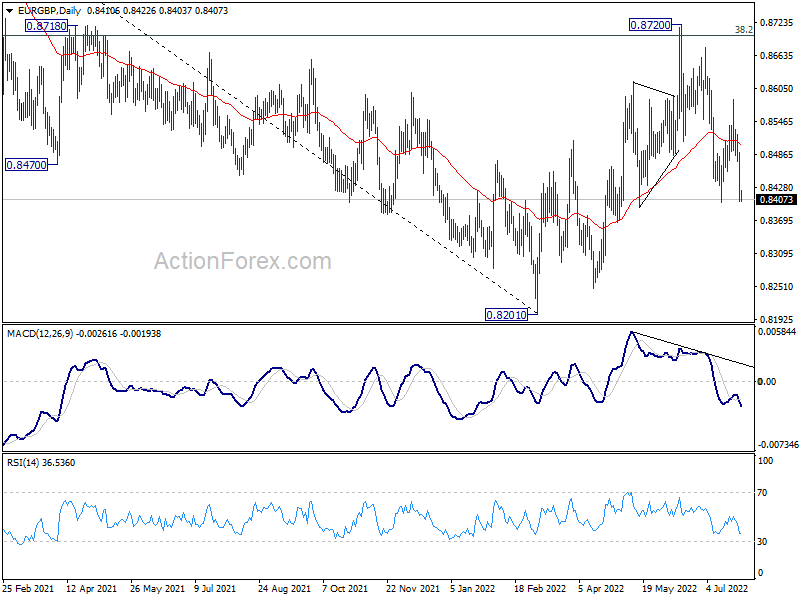
Daily Pivots: (S1) 0.8379; (P) 0.8436; (R1) 0.8466; More...
Intraday bias in EUR/GBP stays on the downside. Break of 0.8401 support will resume the whole decline from 0.8720. This will also affirm the case of rejection by 0.8697 fibonacci level. Deeper fall would be seen back to retest 0.8201 low. On the upside, above 0.8474 minor resistance will turn intraday bias neutral first.
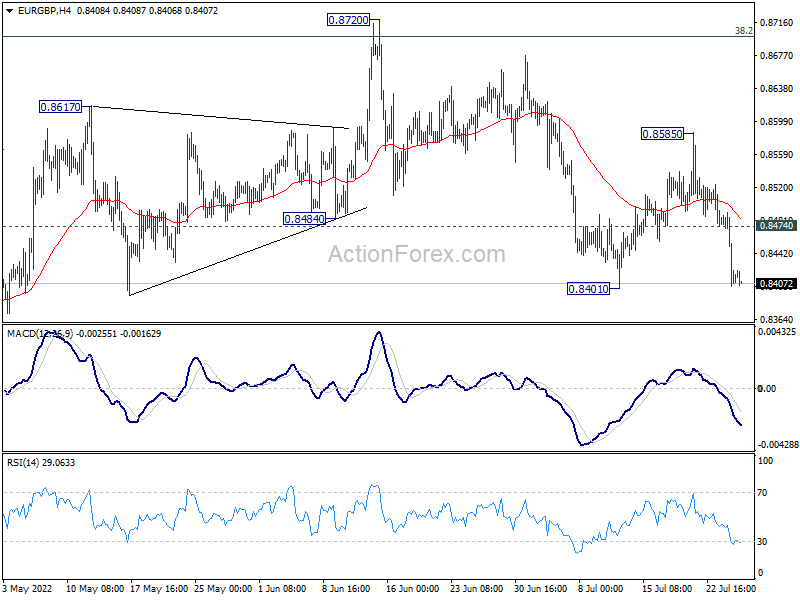
In the bigger picture, attention remains on 38.2% retracement of 0.9499 to 0.8201 at 0.8697. Sustained break there will affirm the case that rise from 0.8201 is a medium term up trend itself. Further rally would then be seen to 61.8% retracement at 0.9003. However, rejection by 0.8697 will confirm medium term bearishness for another fall through 0.8201.