Sample Category Title
EUR/AUD Daily Outlook
Daily Pivots: (S1) 1.4522; (P) 1.4620; (R1) 1.4683; More...
Intraday bias in EUR/AUD stays on the downside at this point. Fall from 1.5396 should target a test on 1.4318 low next. Decisive break there will resume larger down trend. On the upside, above 1.4803 minor resistance will turn intraday bias neutral, and bring consolidations first, before staging another decline.
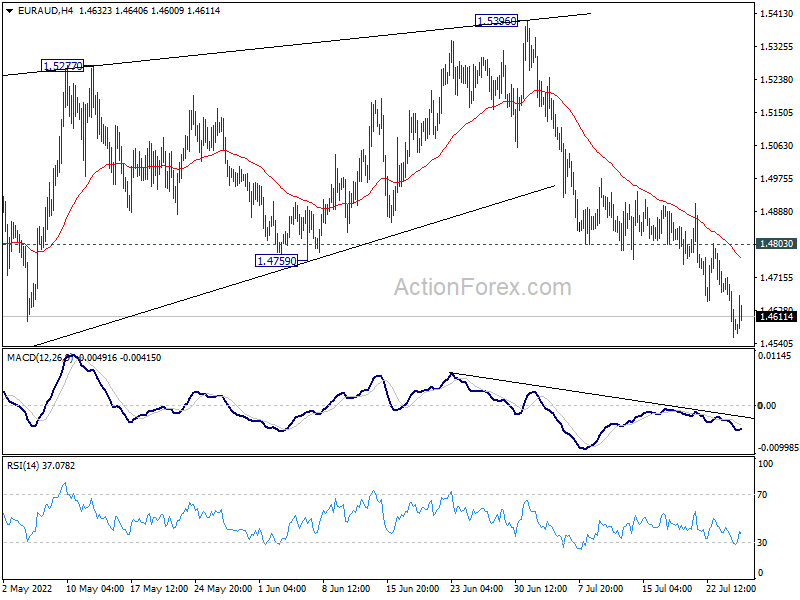
In the bigger picture, rejection by 1.5354 support turned resistance, as well as 55 week EMA (now at 1.5378), maintain medium term bearishness. That is, larger down trend from 1.9799 is not completed yet. Break of 1.4318 low will target 61.8% projection of 1.9799 to 1.5250 from 1.6434 at 1.3623, which is close to 1.3624 long term support (2017 low). This will remain the favored case now as long as 1.5396 resistance holds.
EUR/CHF Daily Outlook
Daily Pivots: (S1) 0.9699; (P) 0.9783; (R1) 0.9826; More....
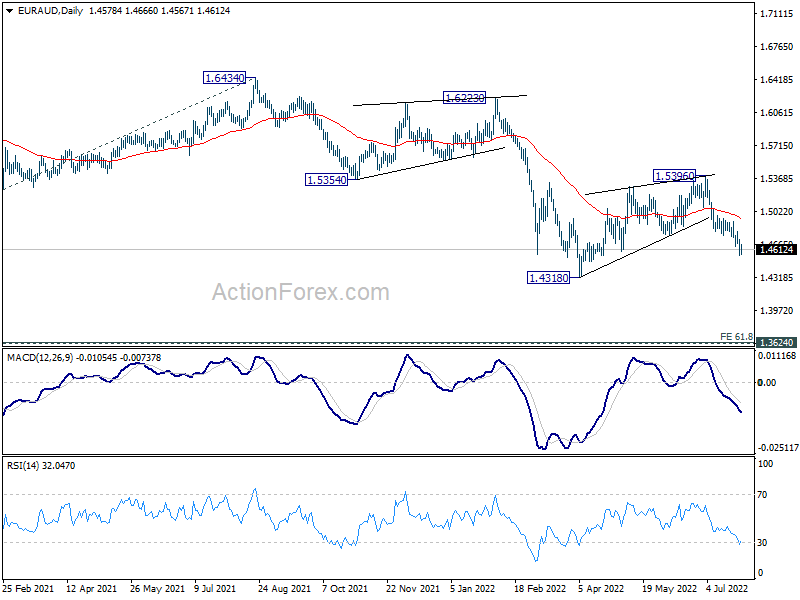
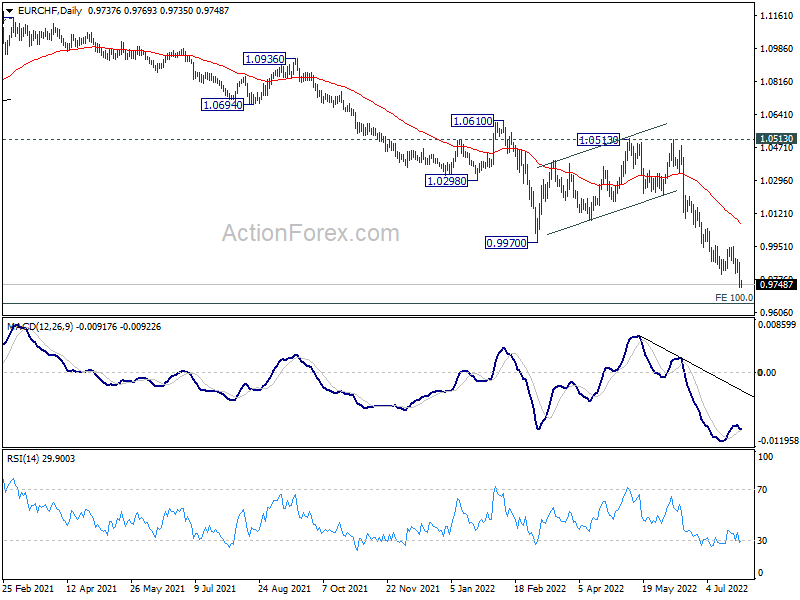
Intraday bias in EUR/CHF is back on the downside as down trend resumes. Next target is 0.9650 long term projection level. On the upside, break of 0.9948 minor resistance is needed to indicate short term bottoming. Otherwise, outlook will remain bearish in case of recovery.
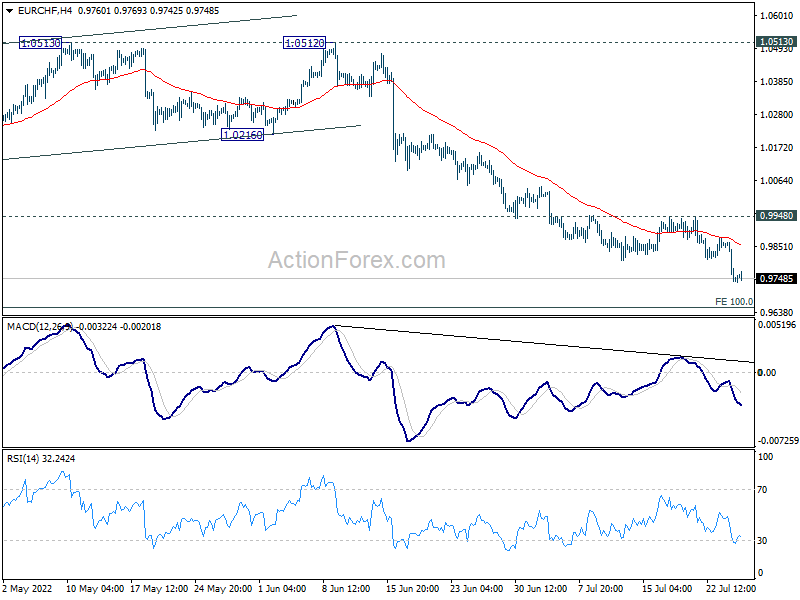
In the bigger picture,long term down trend from 1.2004 (2018 high) is expected to target 100% projection of 1.2004 to 1.0505 to 1.1149 at 0.9650. On the upside, break of 1.0513 resistance is needed to indicate medium term bottoming. Otherwise, outlook will stay bearish in case of strong rebound.
EUR/USD Daily Outlook
Daily Pivots: (S1) 1.0067; (P) 1.0159; (R1) 1.0209; More...
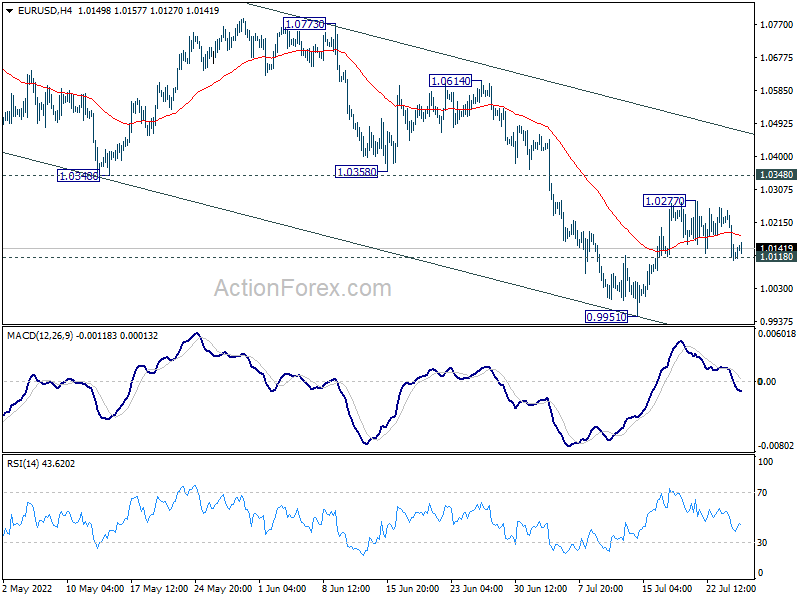
EUR/USD is staying range above 1.0118 minor support and intraday bias stays neutral first. On the downside, firm break of 1.0118 will suggest that rebound from 0.9951 has completed. Bias will be back on the downside for retesting 0.9951 low. On the upside, above 1.0277 will resume the rebound to 1.0348 support turned resistance.
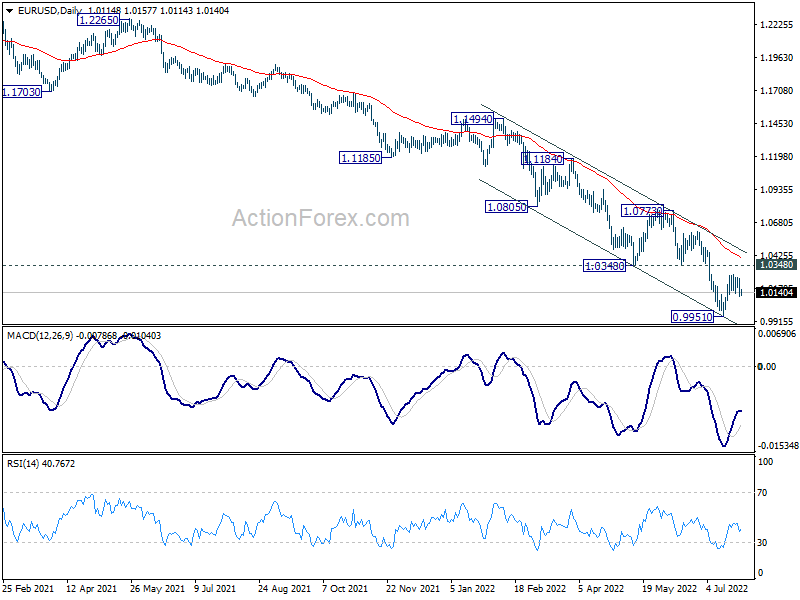
In the bigger picture, down trend from 1.6039 (2008 high) is still in progress. Next target is 100% projection of 1.3993 to 1.0339 from 1.2348 at 0.8694. In any case, outlook will stay bearish as long as 1.0773 resistance holds, in case of strong rebound.
GBP/USD Daily Outlook
Daily Pivots: (S1) 1.1965; (P) 1.2027; (R1) 1.2091; More...
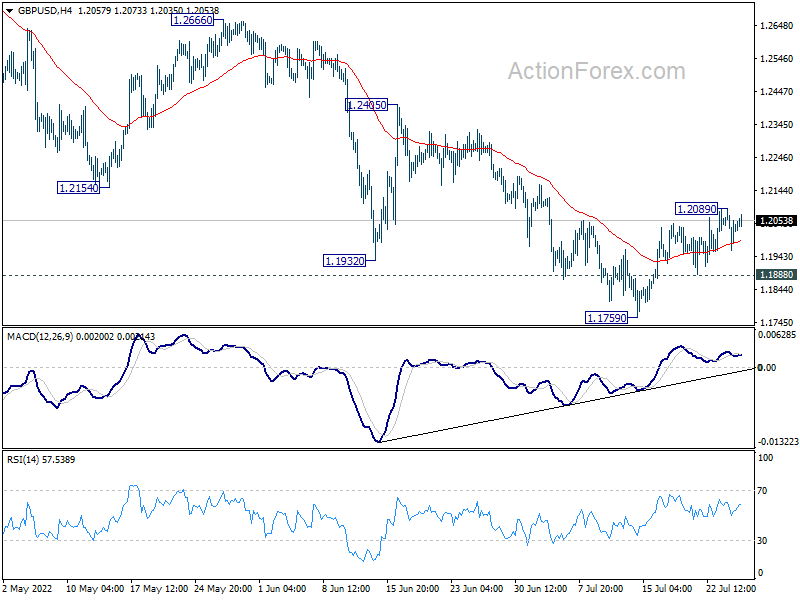
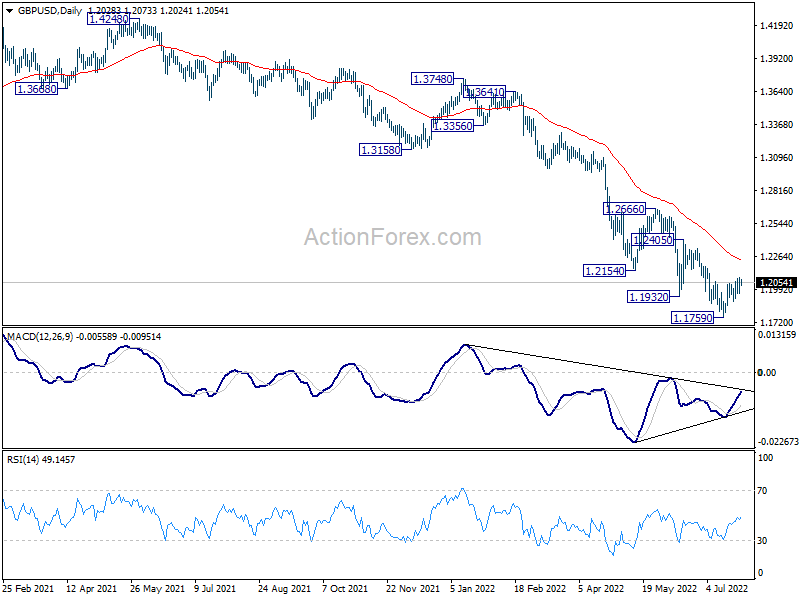
Intraday bias in GBP/USD stays neutral for the moment, but further rise is mildly in favor with 1.1888 minor support intact. Above 1.2089 will target 55 day EMA (now at 1.2236). Sustained trading above there will pave the way to 1.2405 resistance and above. On the downside, below 1.1888 minor support will bring retest of 1.1759 low instead.
In the bigger picture, fall from 1.4248 (2018 high) could be a leg inside the pattern from 1.1409 (2020 low), or resuming the longer term down trend. Deeper decline is expected as long as 1.2666 resistance holds. Next target is 1.1409 low. However, firm break of 1.2666 will bring stronger rise back to 55 week EMA (now at 1.2986).
USD/CHF Daily Outlook
Daily Pivots: (S1) 0.9609; (P) 0.9638; (R1) 0.9661; More...
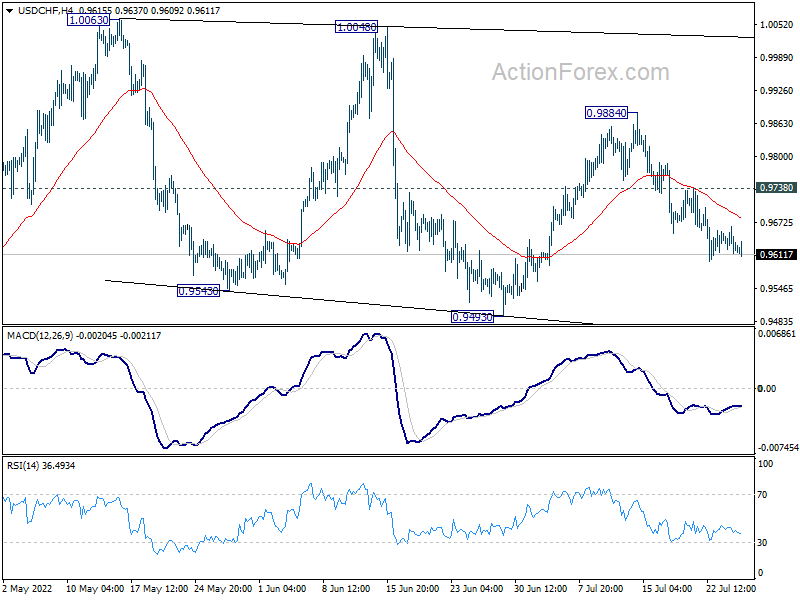
Intraday bias in USD/CHF stays mildly on the downside with 0.9738 minor resistance intact. Fall from 0.9884 is seen as a falling leg of the consolidation from 1.0063. Deeper decline would be seen to 0.9493 support. On the upside, though, above 0.9738 minor resistance will turn bias back to the upside for 0.9884 resistance.
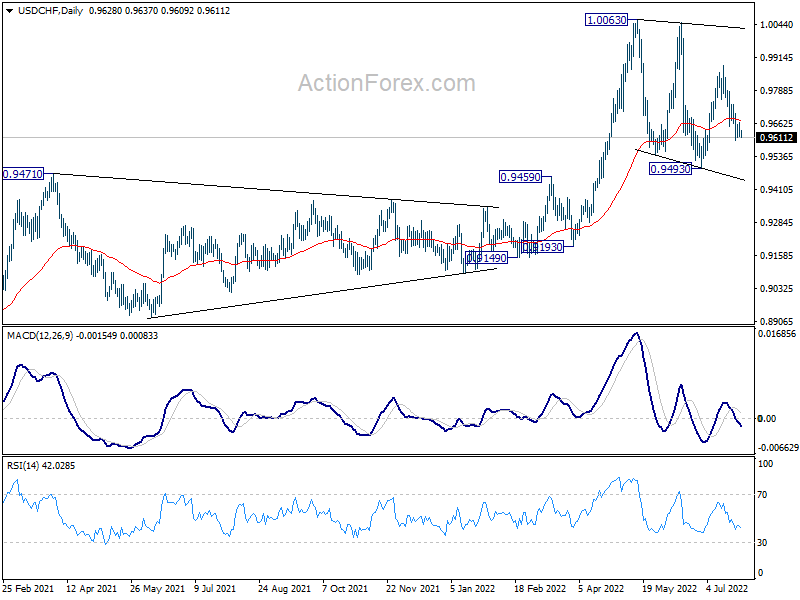
In the bigger picture, medium term up trend from 0.8756 (2021 low) is still in progress. On resumption, next target is 1.0342 (2016 high). Sustained break there will resume long term up trend from 0.7065 (2011 low). This will remain the favored case as long as 0.9471 resistance turned support holds.
USD/JPY Daily Outlook
Daily Pivots: (S1) 136.48; (P) 136.73; (R1) 137.17; More...
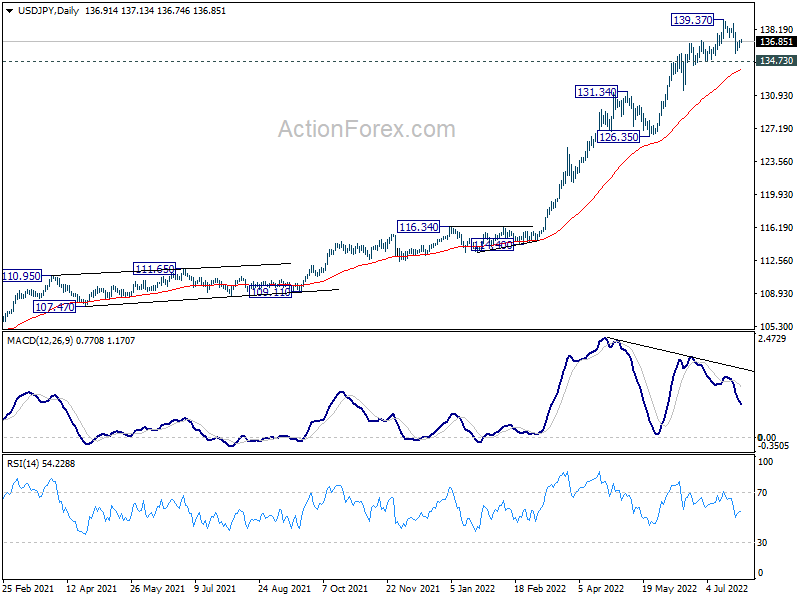
Range trading continues in USD/JPY and intraday bias remains neutral at this point. On the downside, firm break of 134.73 will confirm short term topping, on bearish divergence condition in 4 hour and daily MACD. Deeper fall would be seen through 55 day EMA to 126.35/131.34 support zone. On the upside, break of 139.37 will resume larger up trend.
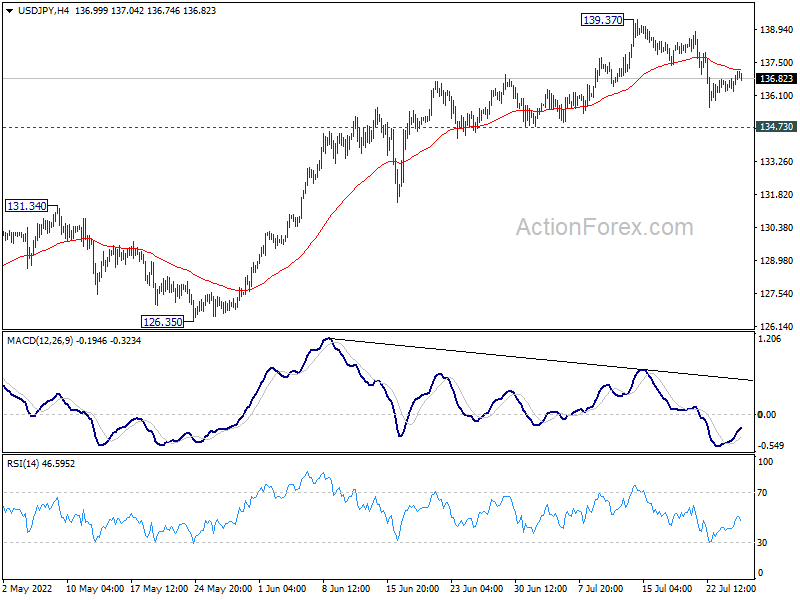
In the bigger picture, current rally is seen as part of the long term up trend from 75.56 (2011 low). Next target is 100% projection of 75.56 (2011 low) to 125.85 (2015 high) from 98.97 at 149.26, which is close to 147.68 (1998 high). This will remain the favored case as long as 126.35 support holds.
AUD/USD Daily Report
Daily Pivots: (S1) 0.6912; (P) 0.6948; (R1) 0.6973; More...
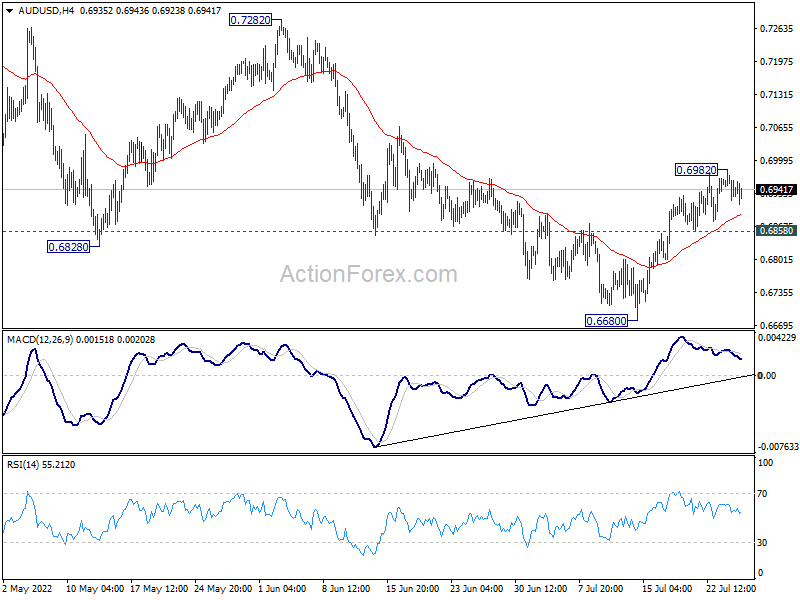
Intraday bias in AUD/USD is turned neutral again with current retreat. On the upside, break of 0.6982, and sustained trading above 55 day EMA (now at 0.6965) will pave the way to 0.7282 resistance next. On the downside, however, break of 0.6858 minor support will argue that the rebound from 0.6680 is over. Intraday bias will then be back on the downside for retesting 0.6680 low.
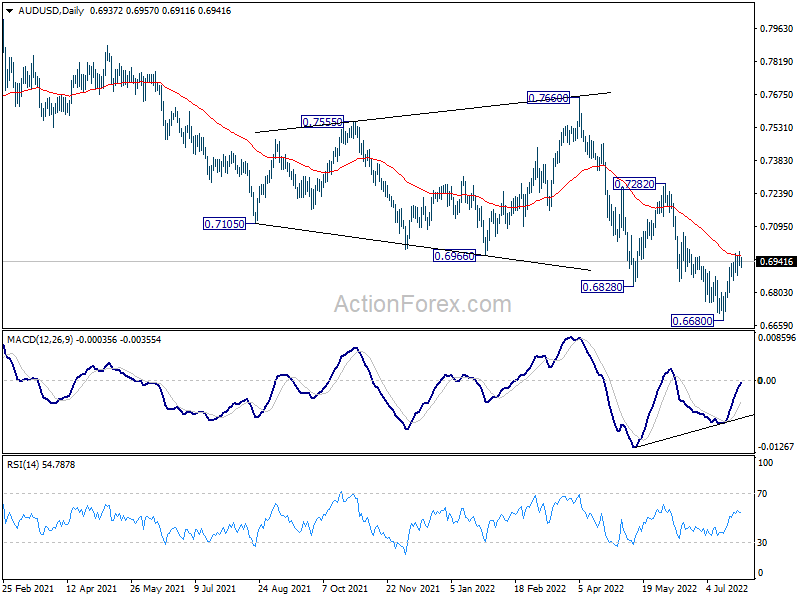
In the bigger picture, price actions from 0.8006 (2021 high) could still be a corrective pattern to rise from 0.5506 (2020 low). But current downside acceleration, as seen in weekly MACD), is raising the chance that it's a bearish impulsive move. In either case, outlook will remain bearish as long as 0.7282 resistance holds. Next target is 61.8% retracement of 0.5506 to 0.8006 at 0.6461.
Renminbi ($USDCNH) Started A Correction Phase As Expected
In the last years, the renminbi made a pause in his attempt to get stronger against USD dollar. On February 2014, renminbi found support at 6.0153 and from there it made a perfect zig – zag correction structure to equal legs at 7.1964 in June 2020. After that, the USDCNH continue with the downtrend.
Renminbi December 2021 Weekly Chart
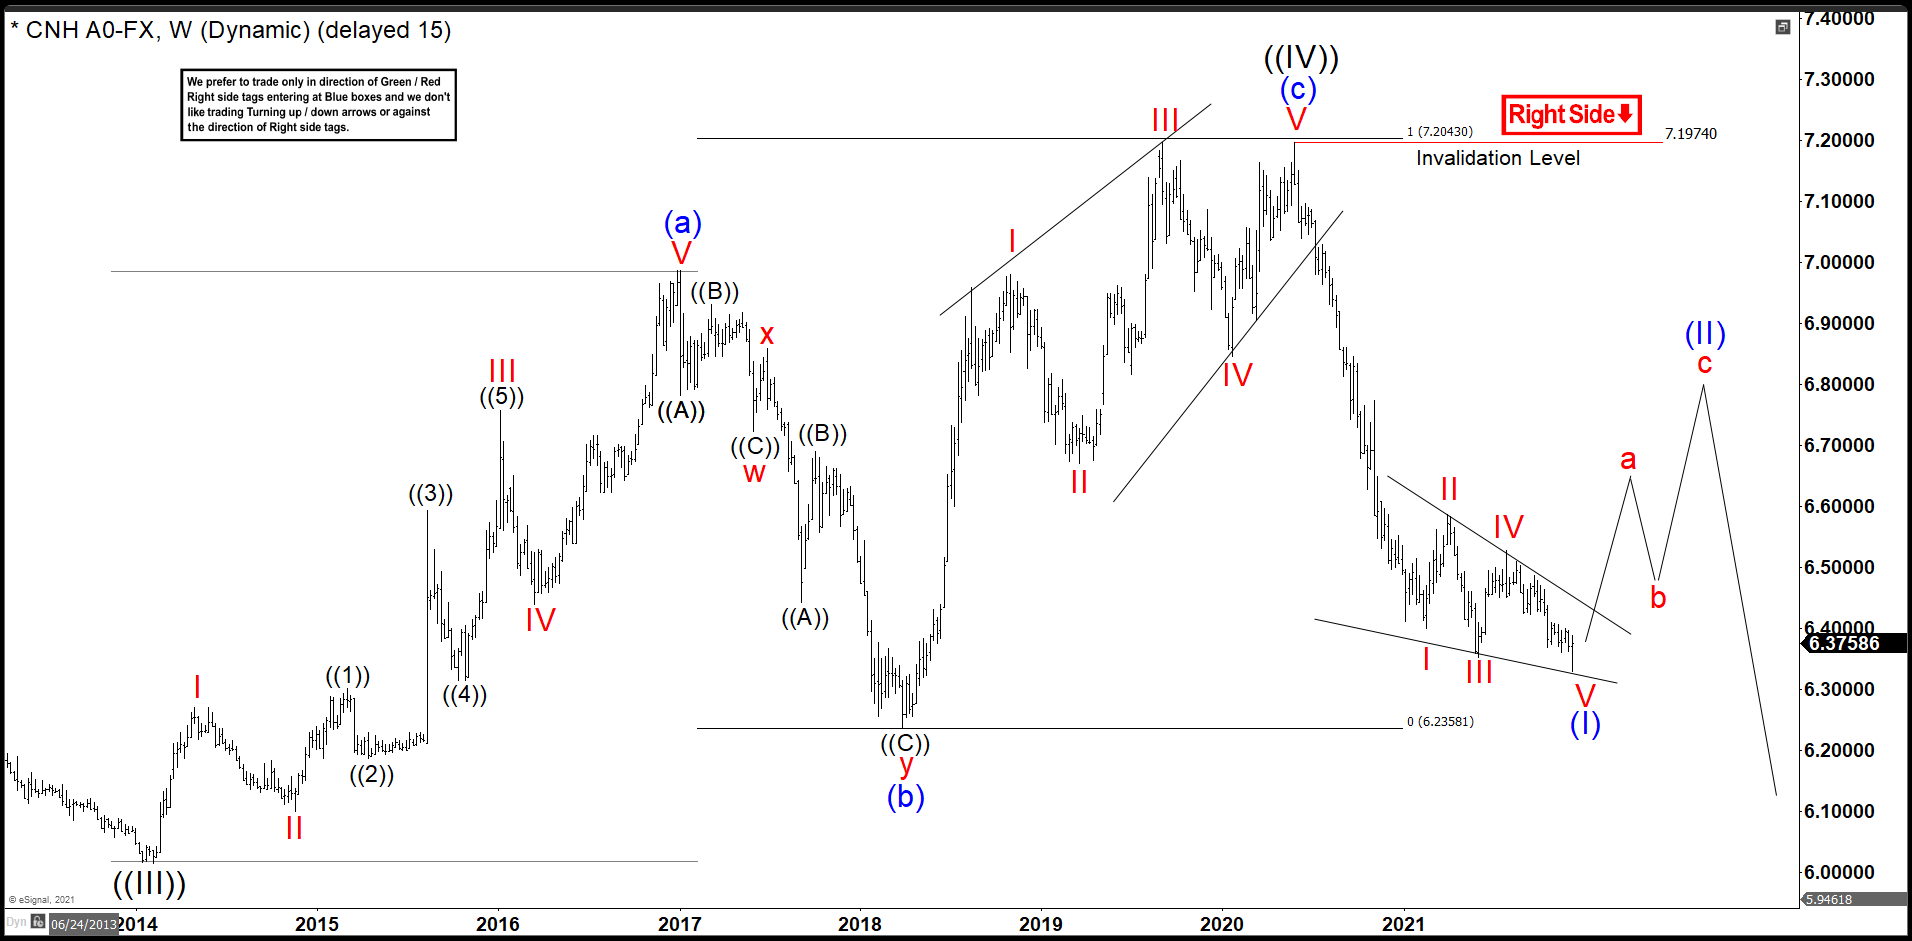
The wave (a) began at 6.0153 and moved high in a 5 waves structure almost hit 7.00 dollars ending at 6.9854. After this 5 waves impulse, we have a huge drop to 6.2359 developing a double correction structure to end wave (b). The volatility did not leave things like that an enormous rally took place in the beginning of wave (c). This movement developed again 5 waves higher, but in this occasion as an ending diagonal structure. Wave (c) finished at 7.1974 reaching the equal leg extension, using Fibonacci tool, taking wave (a) from wave (b) to get wave (c) at 100% Fibonacci extension.
This zig zag structure took place as wave ((IV)), it is telling us that the renminbi should appreciate against the USD in long term. In June 2020, the pair dropped again possibly doing a leading diagonal, that was the pattern we drew in the chart. If that structure played out we should see a bounce before continue with downtrend. (If you want to learn more about Elliott Wave Theory, please follow these links: Elliott Wave Education and Elliott Wave Theory).
Renminbi July 2022 Weekly Chart
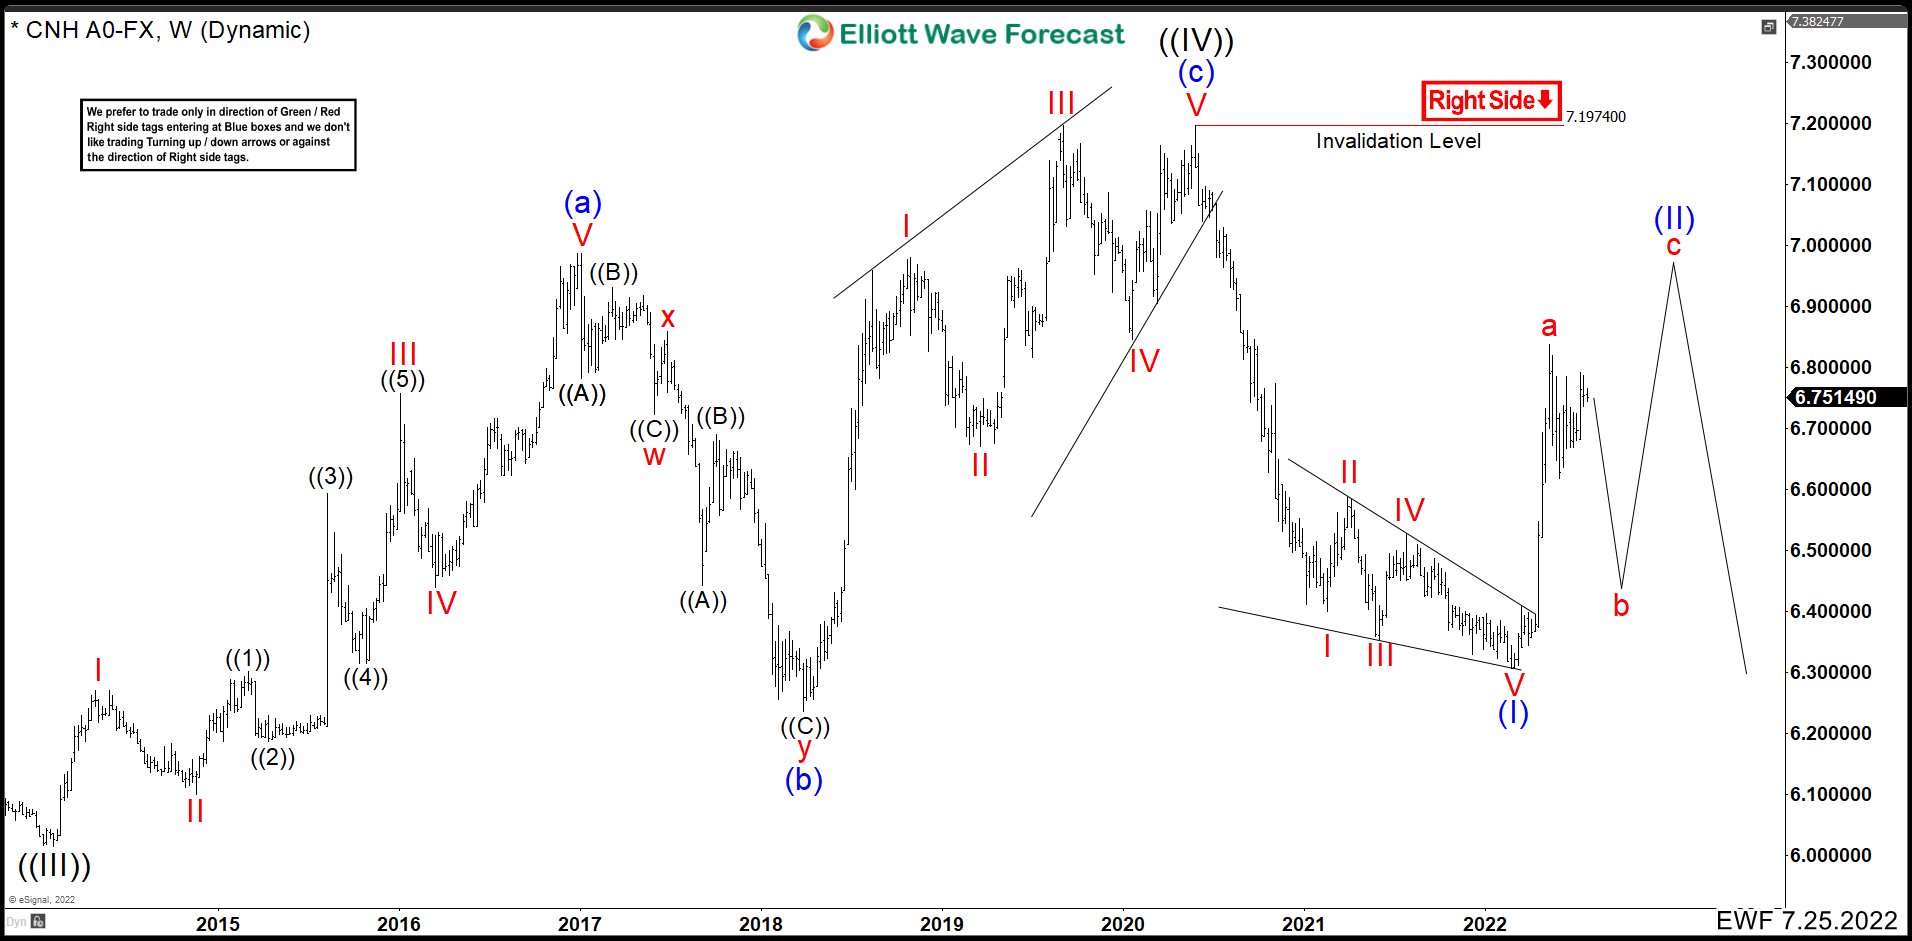
Renminbi July 2022 Weekly ChartAfter six months, we could see that the leading diagonal played out bouncing hard from 6.3052 where we called wave (I) ended. This move higher looks like an impulse and we labeled as wave a ended at 6.8387. We need at least 3 swings to complete a corrective pattern as wave (II); therefore, we are calling a drop to complete a wave b and then higher again above 6.8387 to end wave c fo (II) and turning lower again.
Only a break lower of 6.3052 level will confirm that wave (II) is completed and the bearish trend will continue. For long term traders the USDCNH, certainly, must break 6.0153 in sometime.
Bitcoin Settles at $21K ahead of FOMC
Bitcoin is clinging to the $21,000, having changed little in the past 24 hours, while Ethereum is adding 1.7% overnight to $1450. Prices of the top altcoins range from -0.6% (Cardano) to +4.2% (BNB).
The total capitalisation of the crypto market, according to CoinMarketCap, rose 0.85% to $978bn overnight.
Bitcoin came under increased pressure on Tuesday, but the sell-off stalled during the New York trading session as it was supported by buying on declines below $21K.
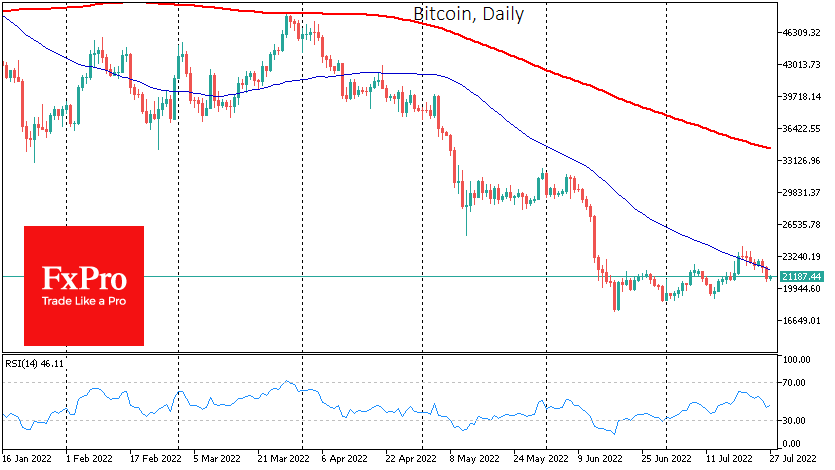
Markets await the US Federal Reserve’s rate decision to be announced on Wednesday and are set to see the Fed’s another 75 points hike, but futures are pricing a 20% chance of a 100-points hike. Some speculators are rushing to bet that we will see a relaxation rally when the most pessimistic expectations do not come true.
According to CoinShares, capital inflows into crypto funds last week amounted to $30M, of which $19M for BTC. At the same time, investments in funds, which allow opening shorts on bitcoin, dropped sharply (to $0.6M). The previous week’s total capital inflows sharply revised from $12M to $343M.
The number of ransomware attacks fell by 23% amid the decline in the crypto market, SonicWall noted.
The US Commodity Futures Trading Commission (CFTC) will create a new Office of Technology Innovation to regulate the cryptocurrency industry.
According to Bloomberg, the US Securities and Exchange Commission is conducting a full-scale investigation into token listings on Coinbase that could be treated as securities.
USDJPY Moves with Weak Momentum Around 20-day SMA
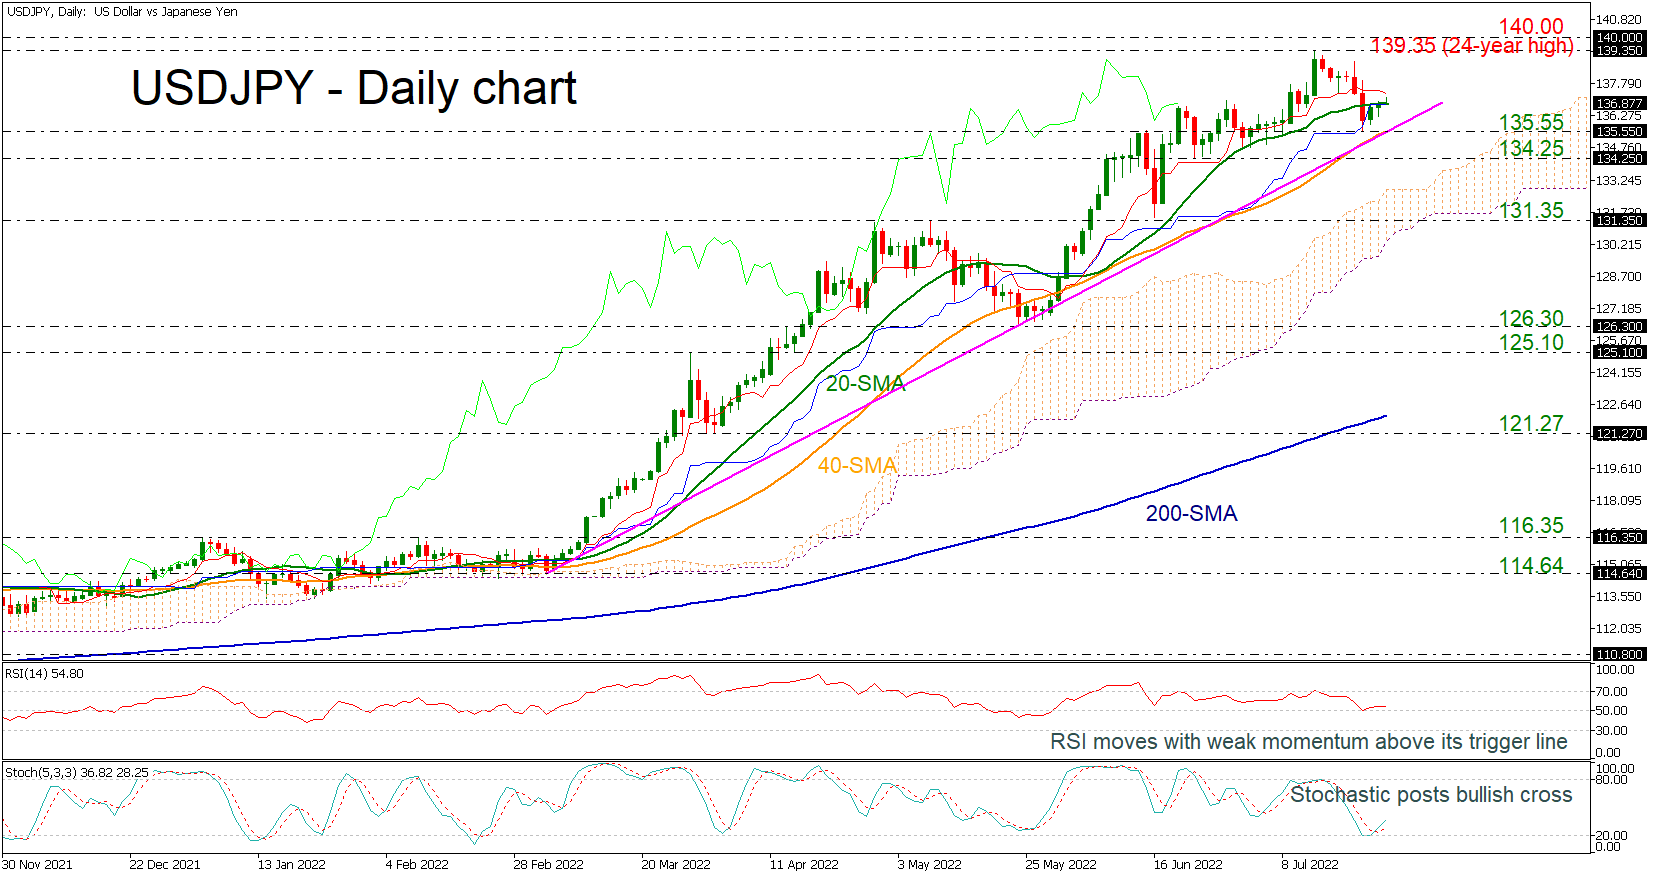
USDJPY found support at the 135.55 barrier, which holds near the medium-term ascending trend line but is still moving with weak momentum around the 20-day simple moving average (SMA).
Trend signals remain daunting as the price continues to trade near the Ichimoku lines, which proved to be a tough resistance area to overcome over the last couple of months. As regards the market momentum, some optimism seems to be building over an upside move as the RSI has paused its downtrend around the 50 level and the Stochastics have created a bullish crossover within its %K and %D lines.
In the event the bulls hold control, the 24-year high of 139.35 will come first into view. A violation at this point may see another challenging battle around the 140.00 psychological level. If buyers claim that zone this time, the 146.83 resistance, taken from the peak in June 1998, could immediately add some downside pressure.
Should the bears take the upper hand, driving the price below the uptrend line and the 135.55-134.25 support zone, the spotlight will shift to the 131.35 barrier, where any step lower will put the pair in a bearish mode in the medium-term picture. The long-term outlook will also face a deterioration if the decline extends below 125.10-126.30.
In brief, although USDJPY continues to face weak trend signals, the odds for an upturn seem to be growing, with the confirmation expected to come above the 24-year high.