Sample Category Title
EUR/AUD Daily Outlook
Daily Pivots: (S1) 1.4783; (P) 1.4844; (R1) 1.4882; More...
Intraday bias in EUR/AUD remains neutral and outlook is unchanged. Further decline is in favor with 1.5043 resistance intact. On the downside, decisive break of 1.4759 support should confirm that corrective rise from 1.4318 has completed at 1.5396 after rejection by 1.5354 support turned resistance. Deeper fall should then be seen back to retest 1.4318 low. On the upside, however, break of 1.5043 will bring stronger rebound back towards 1.5396.
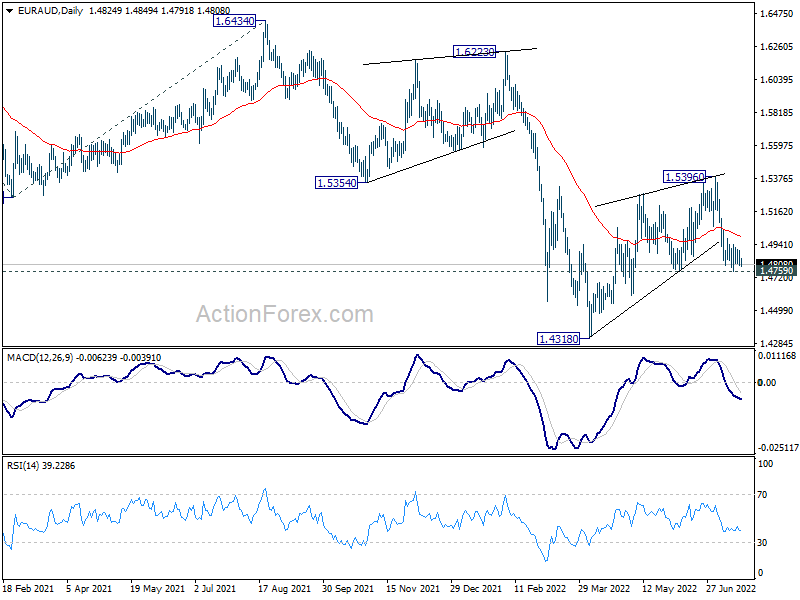
In the bigger picture, rejection by 1.5354 support turned resistance, as well as 55 week EMA (now at 1.5378), maintain medium term bearishness. That is, larger down trend from 1.9799 is not completed yet. Break of 1.4318 low will target 61.8% projection of 1.9799 to 1.5250 from 1.6434 at 1.3623, which is close to 1.3624 long term support (2017 low). This will remain the favored case now as long as 1.5396 resistance holds.
EUR/CHF Daily Outlook
Daily Pivots: (S1) 0.9889; (P) 0.9918; (R1) 0.9937; More....
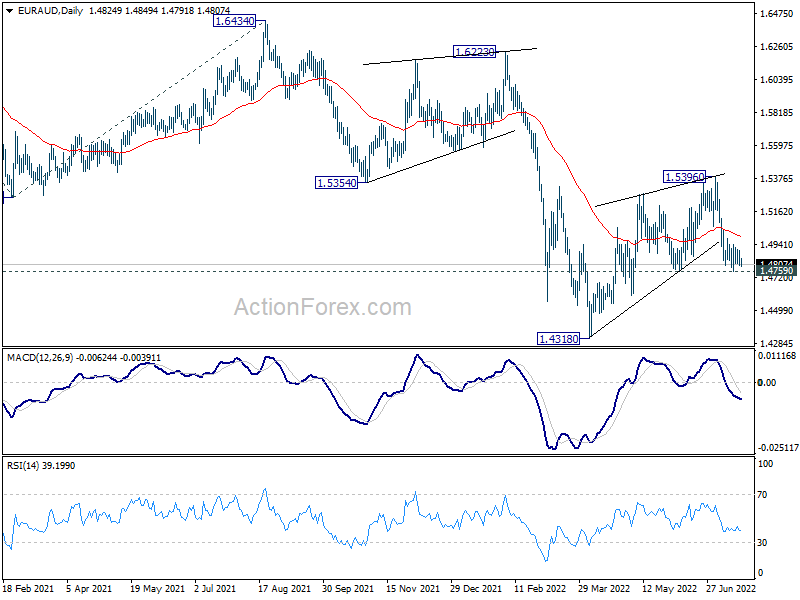
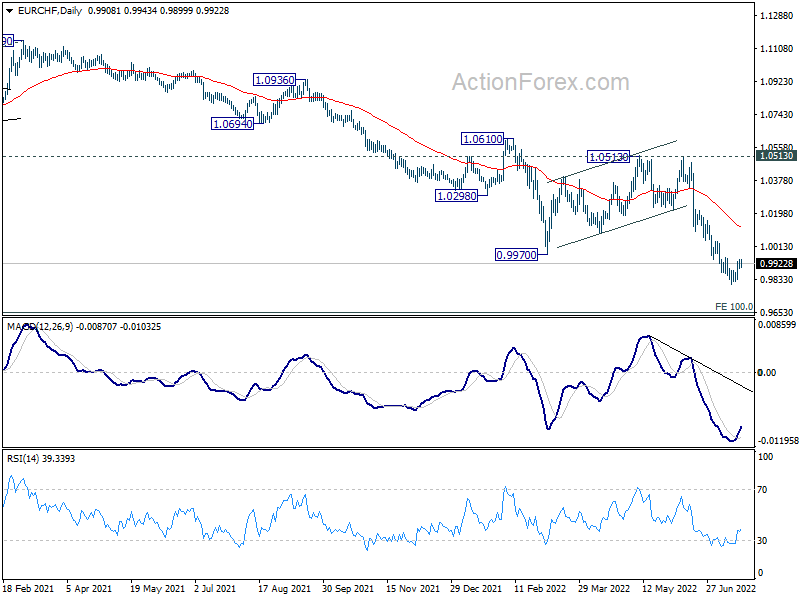
Intraday bias in EUR/CHF remains neutral and outlook is unchanged. On the upside, break of 0.9953 minor resistance will suggests short term bottoming at 0.9804, on bullish convergence condition in 4 hour MACD. Intraday bias will be back on the upside for 55 day EMA (now at 1.0125). on the downside, break of 0.9804 will resume larger down trend to 0.9650 long term projection level.
In the bigger picture,long term down trend from 1.2004 (2018 high) is expected to target 100% projection of 1.2004 to 1.0505 to 1.1149 at 0.9650. On the upside, break of 1.0513 resistance is needed to indicate medium term bottoming. Otherwise, outlook will stay bearish in case of strong rebound.
EUR/USD Daily Outlook
Daily Pivots: (S1) 1.0142; (P) 1.0205; (R1) 1.0291; More...
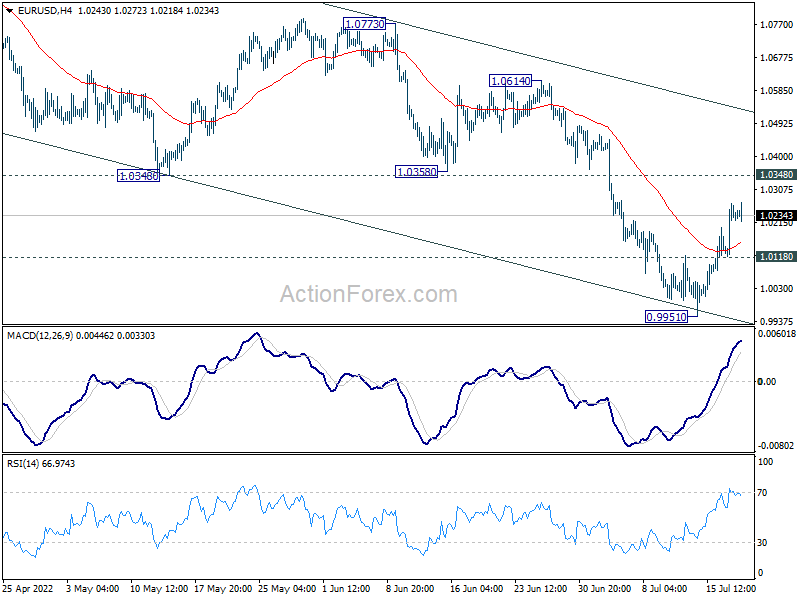
Intraday bias in EUR/USD remains mildly on the upside. Rebound from 0.9951 short term bottom is in progress for 1.0348 support turned resistance. Break there will target channel resistance at 1.0514. On the downside, below 1.0118 minor support will bring retest of 0.9951 low instead.
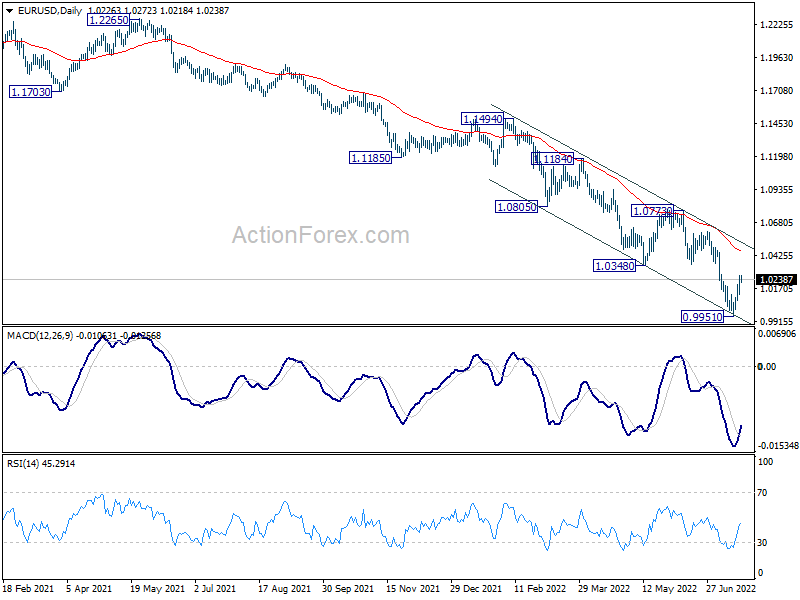
In the bigger picture, down trend from 1.6039 (2008 high) is still in progress. Next target is 100% projection of 1.3993 to 1.0339 from 1.2348 at 0.8694. In any case, outlook will stay bearish as long as 1.0773 resistance holds, in case of rebound.
GBP/USD Daily Outlook
Daily Pivots: (S1) 1.1933; (P) 1.1989; (R1) 1.2053; More...
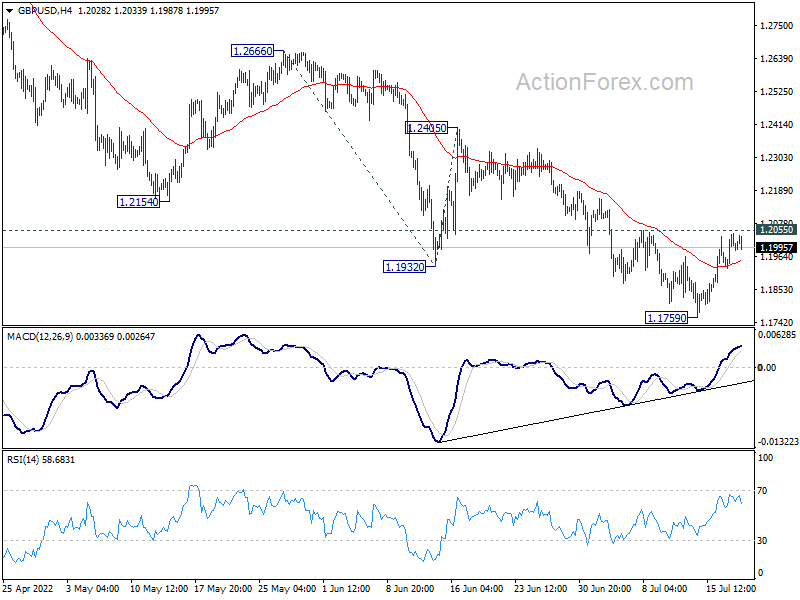
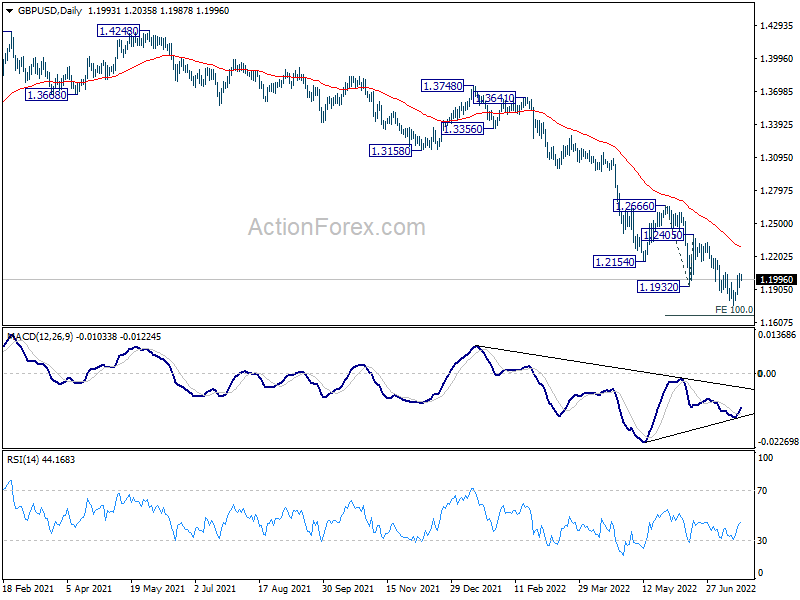
Intraday bias in GBP/USD remains neutral for the moment. Focus remains on 1.2055 minor resistance. Firm break there will confirm short term bottoming at 1.1759. Bias will be turned back to the upside for 1.2405 resistance next. On the downside, below 1.1759 will resume larger down trend to 100% projection of 1.2666 to 1.1932 from 1.2405 at 1.1671.
In the bigger picture, fall from 1.4248 (2018 high) could be a leg inside the pattern from 1.1409 (2020 low), or resuming the longer term down trend. Deeper decline is expected as long as 1.2666 resistance holds. Next target is 1.1409 low. However, firm break of 1.2666 will bring stronger rise back to 55 week EMA (now at 1.3065).
USD/CHF Daily Outlook
Daily Pivots: (S1) 0.9740; (P) 0.9765; (R1) 0.9799; More...
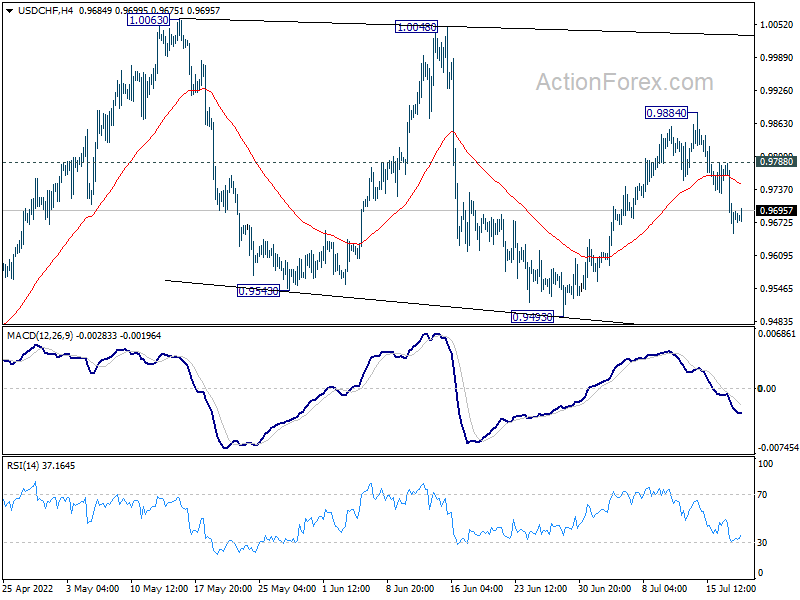
Intraday bias in USD/CHF remains on the downside and outlook is unchanged. Fall from 0.9884 is seen as a falling leg of the consolidation from 1.0063. Sustained trading below 55 day EMA (now at 0.9681) will target 0.9493 support again. On the upside, above 0.9788 minor resistance will turn bias back to the upside for 0.9884 resistance.
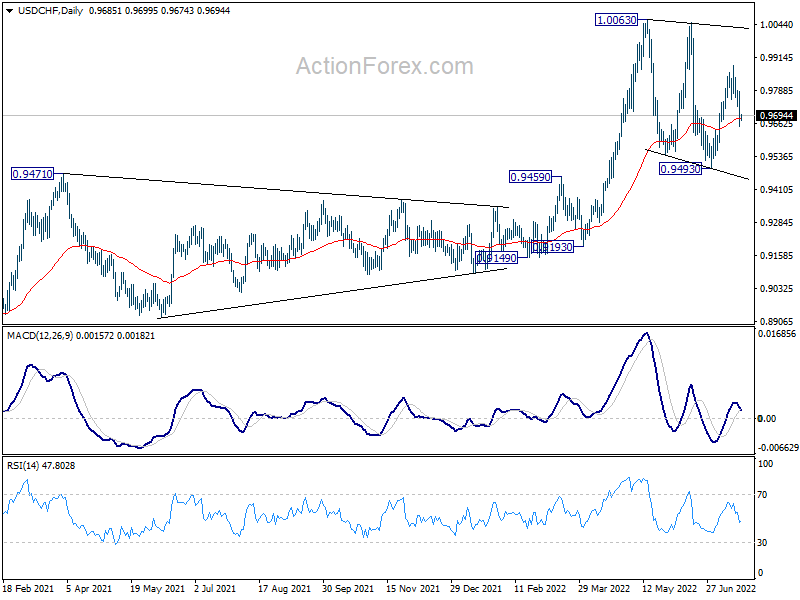
In the bigger picture, medium term up trend from 0.8756 (2021 low) is still in progress. Next target is 1.0342 (2016 high). Sustained break there will resume long term up trend from 0.7065 (2011 low). This will remain the favored case as long as 0.9471 resistance turned support holds.
USD/JPY Daily Outlook
Daily Pivots: (S1) 137.59; (P) 137.99; (R1) 138.61; More...
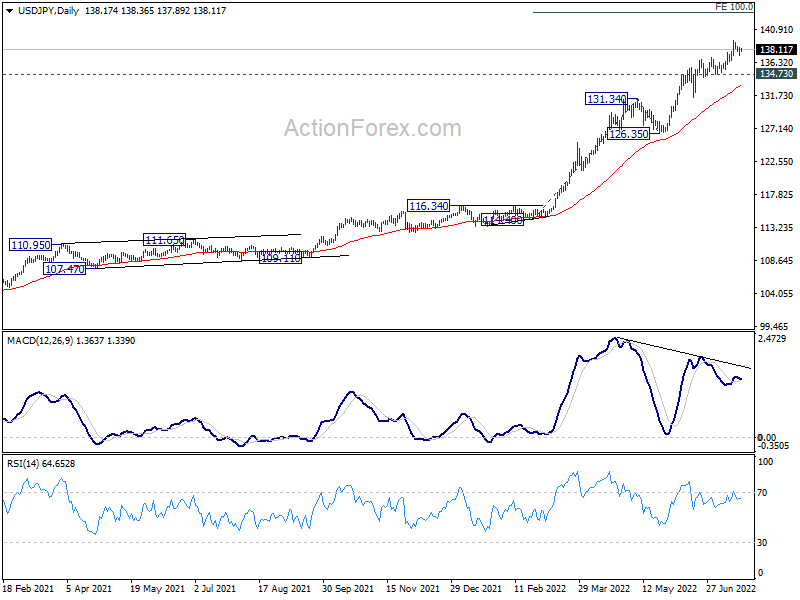
Intraday bias in USD/JPY stays neutral at this point. Consolidation form 139.37 is still in progress. Downside of retreat should be contained by 134.73 support. On the upside, break of 139.37 will resume larger up trend to 100% projection of 114.40 to 131.34 from 126.35 at 143.29.
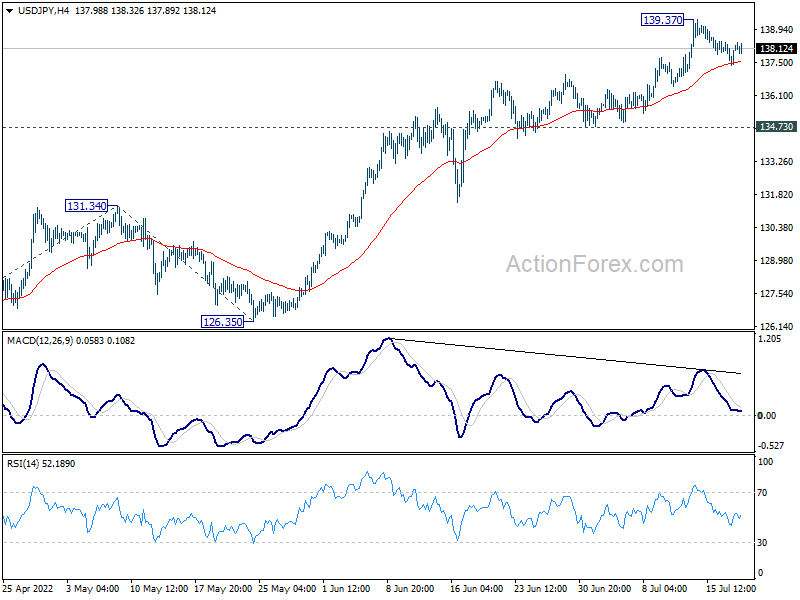
In the bigger picture, current rally is seen as part of the long term up trend from 75.56 (2011 low). Next target is 100% projection of 75.56 (2011 low) to 125.85 (2015 high) from 98.97 at 149.26, which is close to 147.68 (1998 high). This will remain the favored case as long as 126.35 support holds.
USD/CAD Daily Outlook
Daily Pivots: (S1) 1.2829; (P) 1.2910; (R1) 1.2951; More...
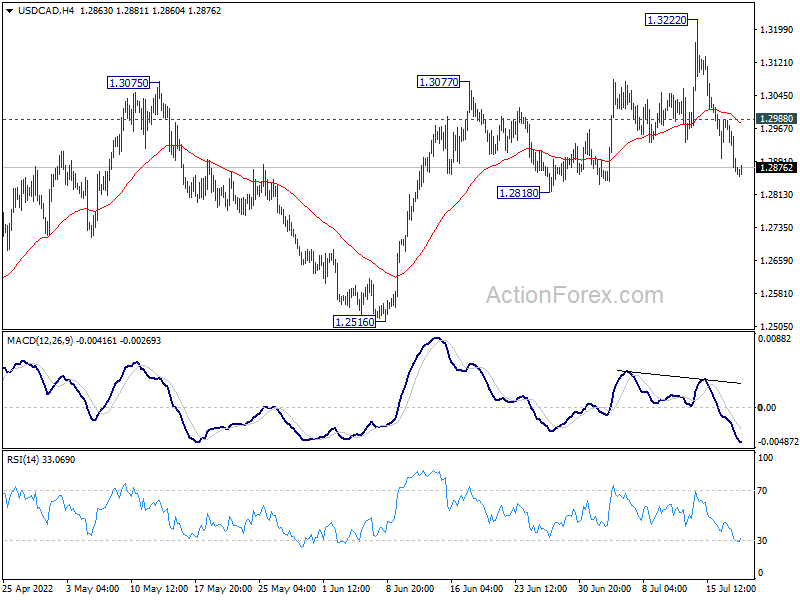
USD/CAD's fall from 1.3222 is still in progress and intraday bias stays on the downside. Deeper decline would be seen to 1.2818 support. Firm break there will bring deeper fall back to 1.2516 key support. On the upside, above 1.2988 minor resistance will turn bias back to the upside for retesting 1.3222 instead.
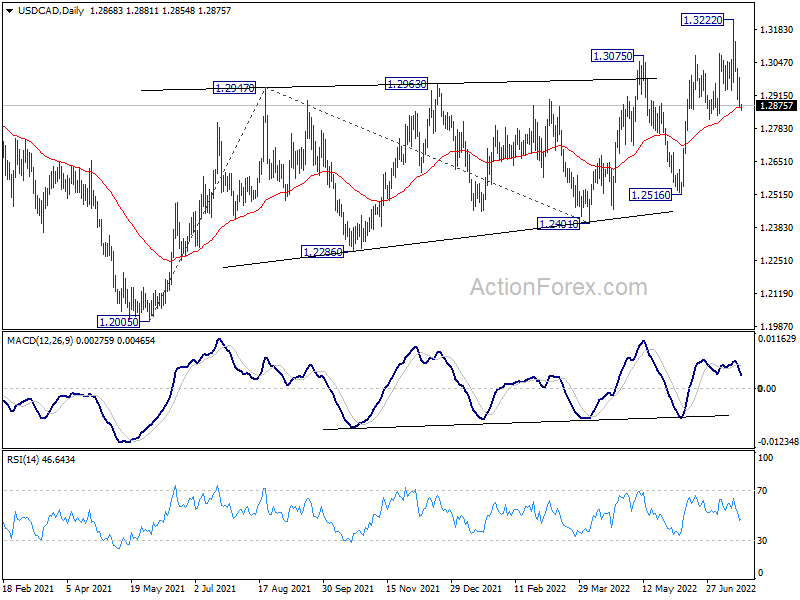
In the bigger picture, down trend from 1.4667 (2020 high) should have completed at 1.2005, after defending 1.2061 long term cluster support. Rise from there should target 61.8% retracement of 1.4667 to 1.2005 (2021 low) at 1.3650. This will remain the favored case now as long as 1.2516 support holds.
Crypto’s Full Swing Recovery
Bitcoin jumped 8.5% to $23,300 on Tuesday, showing a 20.8% gain over the last seven days. Ethereum is trading around $1570 on Wednesday morning, adding 3.4% in 24 hours and an impressive 49% for the week. The top altcoins are also rising nicely, adding between 3.9% (Polygon) and 11% (Cardano) for the day.
Total crypto market capitalisation, according to CoinMarketCap, rose 4.7% overnight to $1067bn.
Bitcoin on Tuesday posted its highest gains in a month on the back of a rebound in US stock indices and a weaker dollar. BTC has tested the highs since June 13 near $23,700, and on Wednesday, it is trying to consolidate above its 50-day moving average.
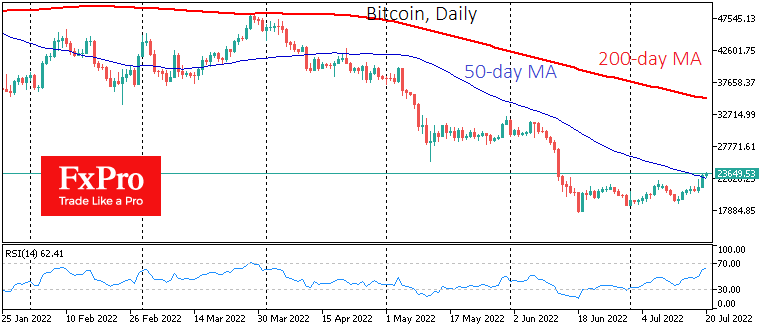 The dynamics near that line often acted as a reliable medium-term trend indicator. Only a strong buy above this level can serve as a firm reversal indicator in the next few days. If the upside momentum stalls, as it did in February and March this year, we should be prepared for a sharp increase in selling.
BTCUSD also exceeded the 200-week average during the last growth wave but fixing above this level at the end of the week should be considered a reliable signal.
The cryptocurrency Fear & Greed Index climbed to 31 by Wednesday after more than two months in “extreme fear” territory.
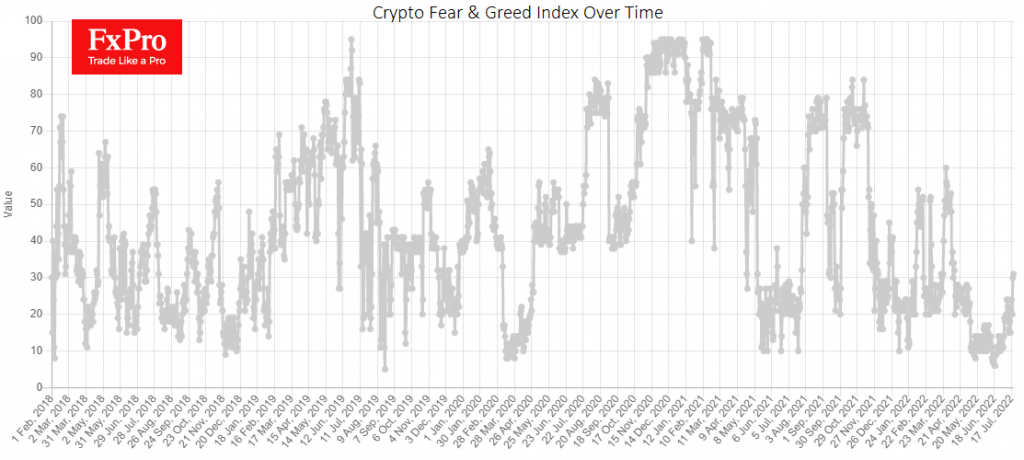
After waves of capitulation in May-June 2022, bitcoin quotes have been below the realised price for a month now. Other signals of a potential bottom forming have also emerged, Glassnode notes.
CryptoQuant, the research firm, has warned investors that further sales of BTC miners in a falling market could return pressure on prices.
USDJPY Moves Slightly Up After Bullish Doji Candle
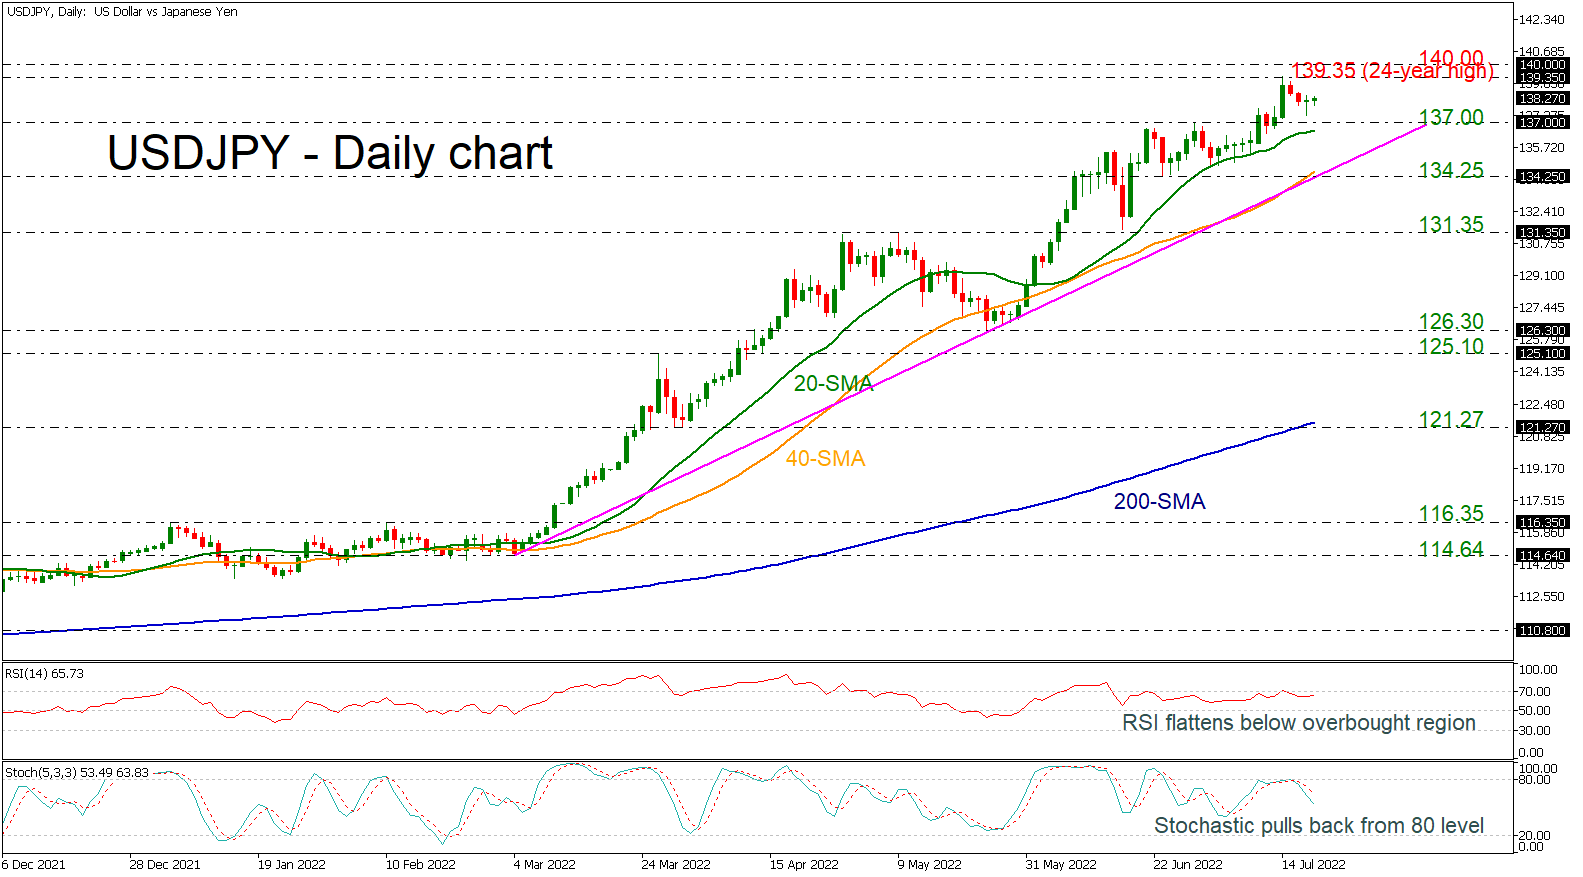
USDJPY posted a bullish doji candle yesterday and maybe is a sign for further bullish actions after two consecutive red days. However, the technical indicators are endorsing an opposite scenario. The RSI is flattening near its overbought territory, while the stochastic pulled back from the 80 level and created a bearish crossover within its %K and %D lines.
If the market corrects higher, the bullish action may pause initially near the 24-year high of 139.35 ahead of the 140.00 psychological mark. A rally above the latter would probably stage fresh buying interest, with the price moving next to the 146.83, registered in June 1998.
On the other hand, violating the 137.00 round number could see losses extending towards the medium-term ascending trend line around 135.50. Even lower, the bears could stall near the 40-day simple moving average (SMA) at 134.25.
In the medium-term picture, USDJPY would resume an upside trend above the 24-year high, while a dive below 134.25 would bring the bearish outlook into play. It is also worth noting that the 40-day SMA keeps distancing itself above the 200-day SMA, raising optimism for a bull market.
NZDUSD in a Recovery Mood; 50-SMA Next in Focus
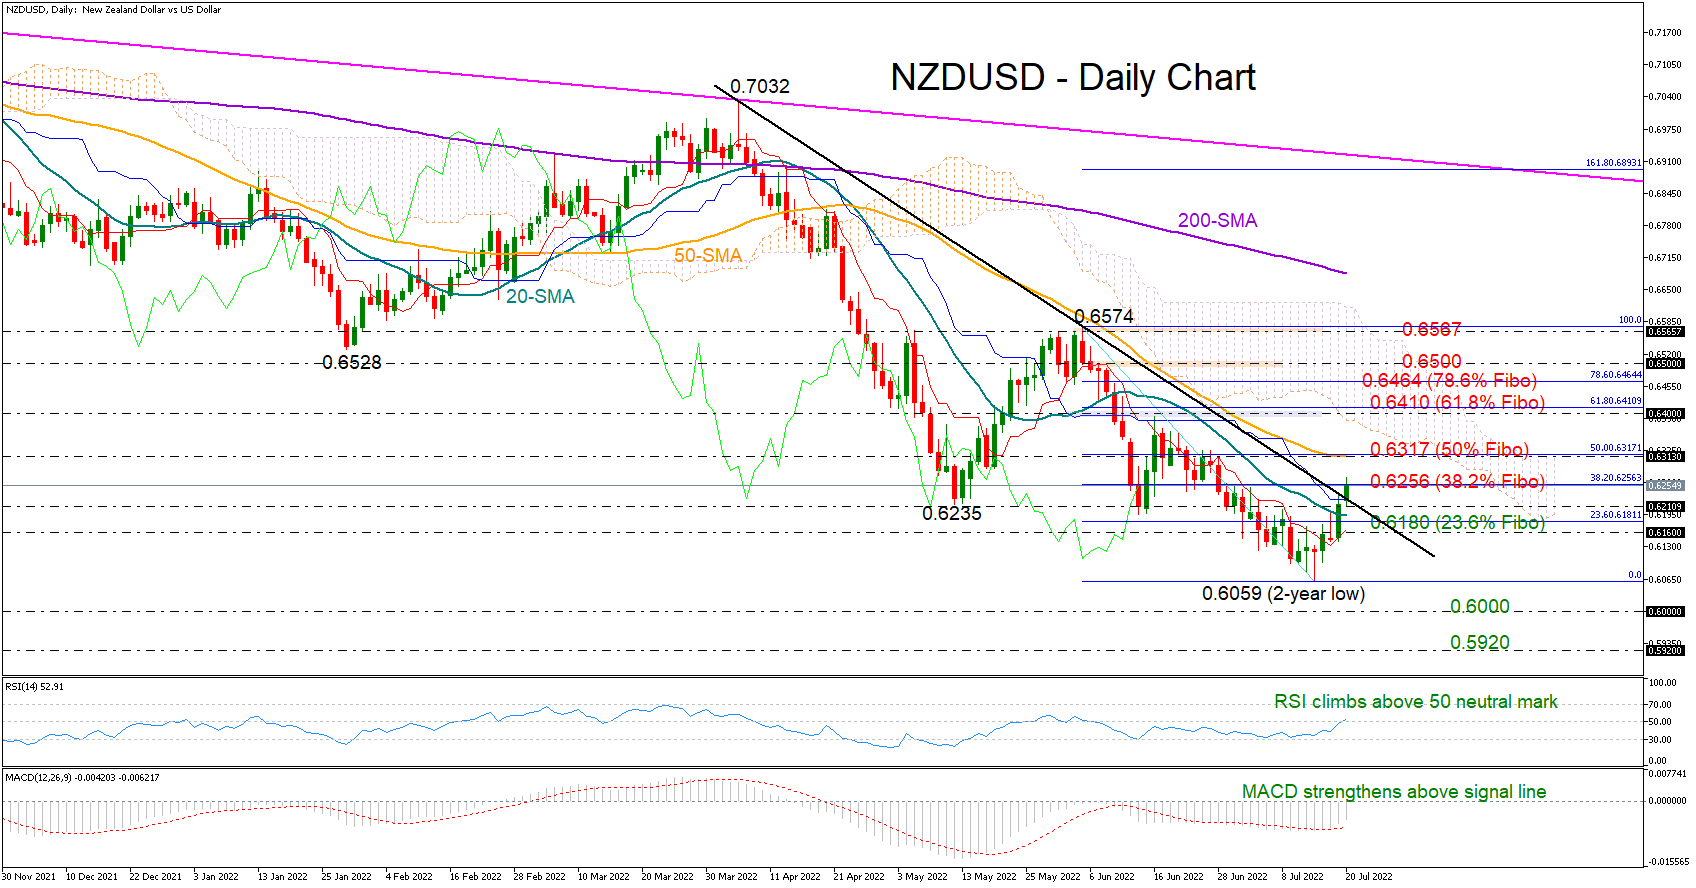
NZDUSD saw its fortune improving in the short-term picture following the clear close above the 20-day simple moving average (SMA) on Tuesday, with the focus now being on the 0.6256 resistance.
Encouragingly, the price has gained extra impetus today to climb above the descending trendline drawn from the 0.7032 peak. The technical oscillators are also mirroring increasing buying appetite as the RSI is strengthening its positive momentum above its 50 neutral mark and the MACD is distancing itself above its red signal line.
If buyers preserve strength above the descending trendline and the 0.6256 bar, which is the 38.2% Fibonacci retracement of the latest downleg, the next obstacle could pop up around the 50-day simple moving average (SMA) and the 50% Fibonacci of 0.6317. Further up, the recovery may pick up steam towards the 0.6400 round level and the 61.8% Fibonacci, while a sustained move past the 78.6% Fibonacci of 0.6564 and the 0.6500 mark could put the downward trajectory at risk near June’s top of 0.6567.
On the downside, a quick reference for support could be the 20-day SMA and the 23.6% Fibonacci of 0.6181, where the constraining red Tenkan-sen line is also converging. If that area cannot buffer selling tendencies, all eyes will turn to the two-year low of 0.6059. Even lower, the price may test the 0.6000 psychological number ahead of the key 0.5916 floor from April- May 2020.
In brief, NZDUSD is expected to extend its recovery in the short-term if the 0.6256 resistance gives way. The next obstacle could pop up around the 50-day SMA at 0.6317.