Sample Category Title
Daily Technical Analysis
EUR/USD
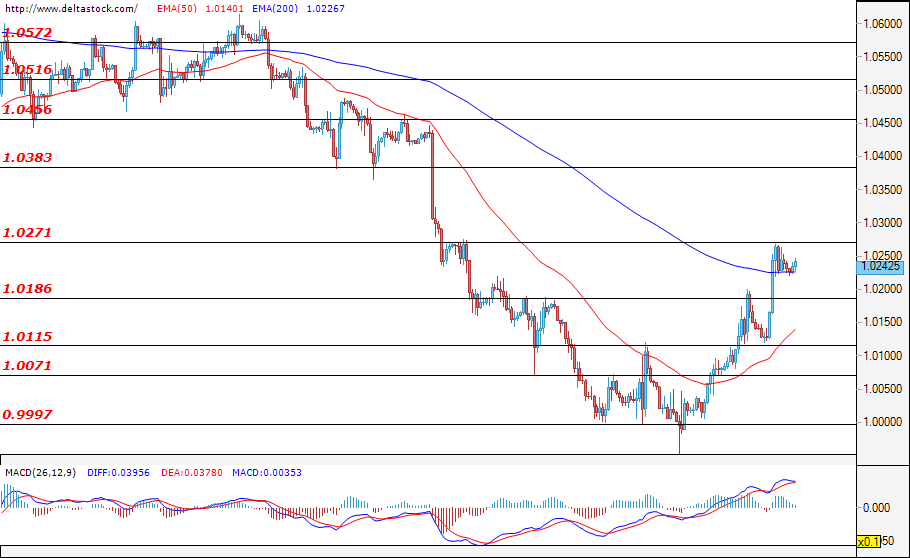
The resistance level at 1.0270 is still holding the bulls at bay and the pair is consolidating just below this zone. A confirmed breach of the mentioned key resistance would pave the way for the pair towards the next key resistance zone at 1.0383. However, a development of a short-term consolidation in the range of 1.0180 – 1.0270 is a highly possible scenario, before the bulls could attempt to take control and lead the pair above the resistance at 1.0270. On the other hand, if the bears prevail and manage to violate the support at 1.0186, then the pair would most probably head towards a test of the support at 1.0115. During today's trading session, the most important economic news that would be of interest to the market participants, will be the U.S. existing home sales data (14:00 GMT).
USD/JPY
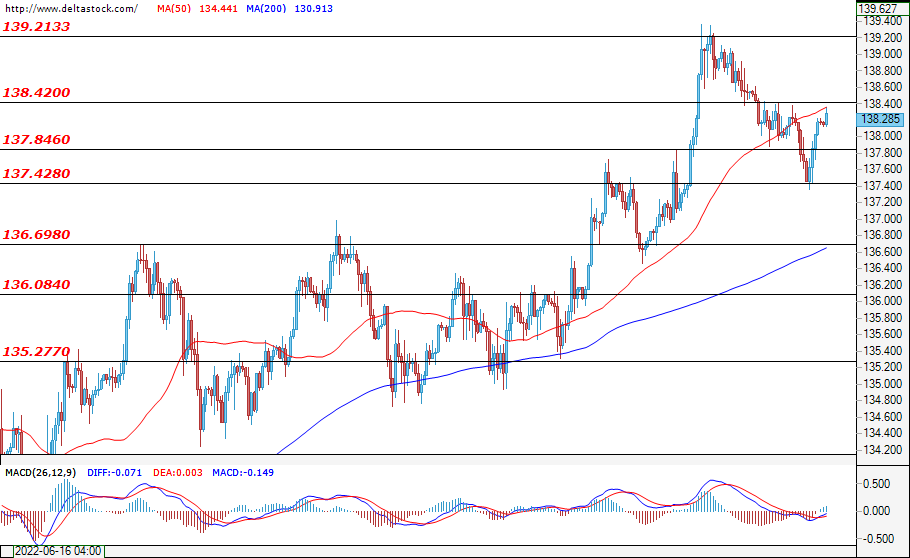
During yesterday’s trading session, the pair made a slight upward movement that was limited at the resistance at 138.42 and the expectations for today’s trading session are for a downward movement and a test of the support at 137.40, where a successful breach would give the sellers an opportunity to target the next significant support zone at 136.70. However, if the bulls prevail, then we may instead expect an upward movement towards the high at 139.21.
GBP/USD
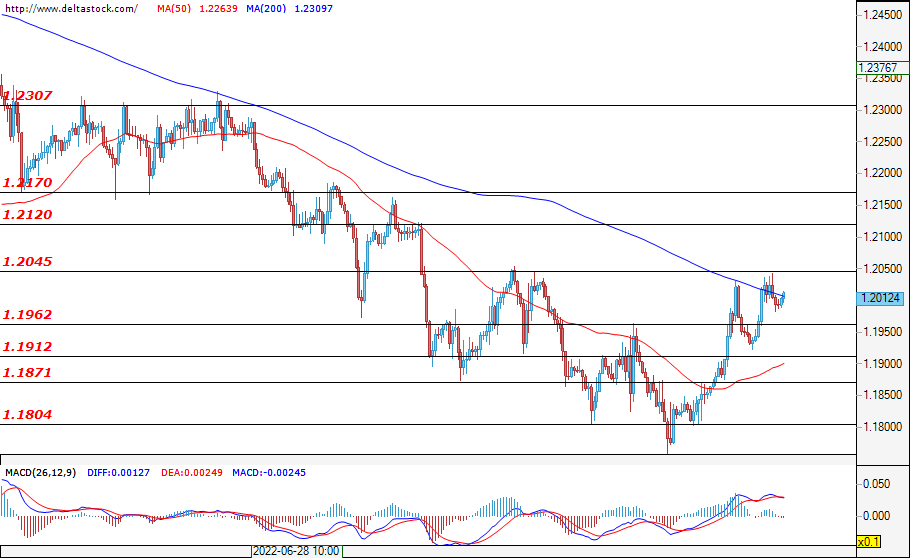
The bulls are facing difficulties in overcoming the resistance at 1.2045 and the pair is hovering just below this level. If the bulls manage to violate the mentioned resistance, then the most probable scenario is for the GBP/USD to head towards a test of the critical resistance at 1.2120. However, before the market is able to find a clear direction, the pair could remain locked in the range of 1.1962 – 1.2045. If the bears manage to take control over the market, then we may witness a deeper price correction towards the support at 1.1912.
EUGERMANY40
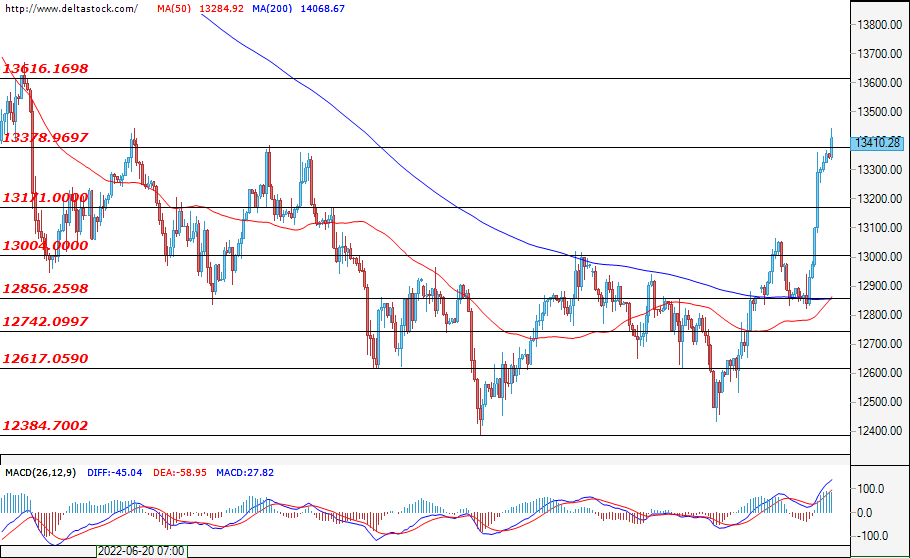
During yesterday’s trading session, the German index increased its value with approximately 4.5%, reaching the resistance level of 13378, and at the time of writing this analysis, the buyers are striving to confirm the breach of this level. The rally was fueled by hopes that Russia will restore gas exports via its Nord Stream. Even with the positive market sentiments, however, we may be in for a slight correction towards the support at 13171, before a possible continuation of the rally is to develop. If the sell-offs deepen and the support level at 13171 is violated, then the next target for the sellers would be the psychological level at 13000.
US30
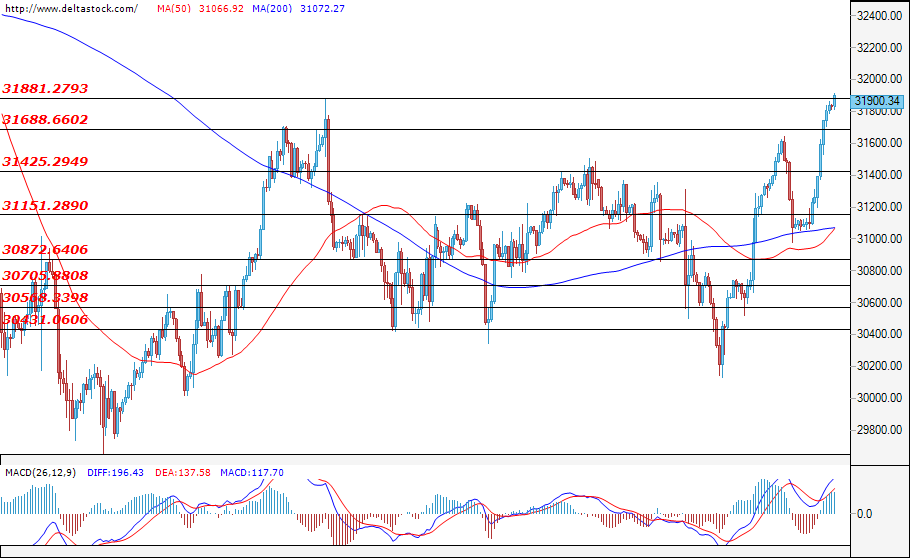
The index appreciated significantly and the buyers are testing the resistance level at 31880, where a confirmed breach would be considered as a signal that the bulls are still in control of the market, in which case an increase in the price towards the psychological level at 32000 is highly possible. However, if the bears manage to hold the price below the resistance zone at 31881, then a correction towards the key support at 31425 could be considered as an alternative scenario for today’s trading session.
UK Inflation Hits 9.4%, Netflix Beats, Twitter Scores and Tesla Reports
Expectations for Netflix had gone so bad that the company could surprise with 970’000 less subscriptions last quarter. The smaller drop in subscriptions combined with higher fees increased the profit by 7% compared to the same time last year, despite near $340 mio the company lost due to a stronger US dollar. The share price jumped 8% in the afterhours trading, on top of 5% added during the session.
And most technology stocks had a good day yesterday. Nasdaq jumped 3%, while the S&P500 had its best day since three weeks, with a 2.76% gain. The motivation behind yesterday’s equity rally was rather obscure. A softer US dollar certainly helped boosting optimism about the earnings season.
Yet, the predictability and the visibility remain low, and any rebound could be considered as a bear market rebound, until we have proof that gains could be sustainable. Earnings will show how resilient the US company earnings are to the tightening Fed, and the soaring dollar. Any bad news could rapidly hammer the positive mood.
Tesla reports
Today, Tesla will release its latest quarterly earnings after the bell. Analysts expect around 2.5% revenue drop in the second quarter as a result of the factory shutdown in Shanghai due to the strict Chinese rules to achieve a zero Covid policy. The net adjusted income, and profit may have dropped up to 10%. Tesla will likely maintain its yearly delivery growth target, but that would imply acceleration of deliveries in the second half.
Next! Twitter marked the first goal in the lawsuit against Elon Musk, as a Delaware judged allowed the company to accelerate the procedure. The trial is now set to take place as early as October, while Elon Musk’s legal team was considering a timeline like 3-4 years.
October is sure too early for Elon Musk, but arguments that waiting too much would harm Twitter’s business, and would delay important operational and investment decisions are more convincing than the need for 4 years to dig into Twitter accounts to find out how many of them are fake.
Twitter shares are back to $40 on hope that Elon Musk could be forced to buy Twitter for $54 a share.
UK inflation hits 9.4%
Energy and commodities rallied yesterday, as well. American crude extended gains past the $103 level, while copper futures jumped 2%.
Firmer oil and commodity prices sent the FTSE 1% higher yesterday, but the prospects for FTSE for the second half are much weakened due to the recession fears that could hurt demand and hit the energy and mining companies’ earnings.
Then, there is a higher political uncertainty in the UK following Johnson’s resignation.
And, the macroeconomic environment is not ideal. The UK revealed that inflation advanced to 9.4% in June, from 9.1% printed a month earlier and 9.3% penciled in by analysts. This means that the Bank of England’s (BoE) tightening efforts don’t do much to tame inflation and that it must further tighten the monetary conditions.
Cable bounced back above the 1.20 mark on the back of a softer US dollar. As it is the case for the EURUSD, Cable could extend gains against the US dollar, if the dollar loses some of its strength, of course. At the current levels, the dollar is expected to correct to the downside, but the dollar bulls are waiting in ambush before the upcoming Fed decision.
The Stranger Things Put
The bear market rally looks well and truly back on track this week, thanks to one of the stranger things I have seen in 2022, Netflix losing only one million subscribers in Q2 instead of 2 million and forecasting an additional one million subscriber additions in Q3. Minus one plus one equals um, zero, the last time I looked. But it is not for me the second guess the bullish herd mentality of the equity market, especially as they continue to grapple with the reality that 20-years of central bank monetary puts have come to an end.
The Netflix results were apparently backstopped by Stranger Things 3 being released. I’ll not argue with that as I love Stranger Things and remember the 80’s and all the music very well. Mrs Halley is less enamoured with season 3, complaining about the slow pace and the convoluted plot threads. That’s what makes a market I suppose. I have a feeling that omicrons' rampage across the world, has left many subscribers working or isolating from home, delaying the pressing of the cancel subscription button.
Either way, with the street hungry for good news to feed the buy-the-dip appetite, Wall Street has a huge day, which saw investors piling back into big tech as well, lifting the Nasdaq by over 3.0%. I heard more peak inflation noise being bandied around, with Reuters reporting that Nord Stream 1 natural gas flows from Russia to Germany would resume this week as scheduled. Additionally, hopes were raised around negotiations to ease Russia's seaborne blockade of Ukrainian food exports.
Peak inflation is as good a reason to pile into equities and other risk sentiment asset classes as any I suppose. I personally believe we could be near peak inflation, but any hopes that it is suddenly going to fall quickly are naïve, far more likely is that it stays elevated for quite some time to come. The other issue I have from the above paragraph is having to use the words “hope” and “Russia.” I’m not sure how many times investors have to be slapped around the face on this point.
To emphasise this, lets circle back to the Reuters natural gas story. It did mention that its sources said the flows, when they resume this week, will not return previous levels, and by this, I mean its 160 million cubic metre-per-day capacity. Vladimir Putin, on his return from fellow economic powerhouse, Iran, is already setting the scene for reduced flows resuming, blaming faulty pumping units again according to Reuters. They also reported that Mr Putin said in Iran that “not all issues had been resolved yet” vis-à-vis Black Sea grain exports.
So, Joe Biden left Saudi Arabia empty-handed on commitments by the Saudis to pump more oil, and Vladimir Putin is saying Nord Stream 1 gas flows will remain low and that Black Sea grain shipments have “issues” to overcome. And markets are pricing in peak inflation with a precipitous drop in H2 2022. I do admire the optimism. In large directional macro moves of the type we have seen in equities and currency markets the past few months; it is not unusual to see quite aggressive short-term reversals of those trends. I am yet to be convinced that we are seeing anything more than a bear market rally at the moment. Europe’s day of reckoning may come earlier when Nord Stream 1 is due to be switched on tomorrow. For the rest of world, that may come at next weeks FOMC policy meeting.
Over in China, the mortgage payment strike by disgruntled apartment buyers is grabbing the headlines. The government is seemingly moving to push the funding gap to beleaguered developers onto local governments and state policy banks, meaning the fallout so far has been limited on equity markets. Perhaps more concerning is new Covid-19 cases reached 1,012 in China yesterday, according to official data. A flesh wound anywhere else, but in China’s covid-zero world, a cause for concern around potential new lockdowns. Readers should monitor developments here closely. Covid-zero means covid-zero in China, not lock down Shanghai and Beijing once and done. Mainland equities have only rallied modestly today, and your answer probably lies there. In other news China left its one and five-year Loan Prime Rates unchanged, but this was completely expected.
There is no other data of note due out in Asia today, the Reserve Bank of Australia Governor Lowe spoke earlier today. Mr Lowe said he expected CPI to keep heading higher, and that employment was past its theoretical maximum, and that interest rates would have to keep going up. Mostly, t was of no surprise to markets now, and the Australian Dollar and local equities are ignoring it to hitch their reins to the US peak-inflation, we can trust Russia, less-worse earnings, sentiment rally overnight, like everyone else.
This afternoon, German PPI is expected to rise to an eye-watering 33.90% YoY for June, as hints of a 0.50% rate hike by the ECB tomorrow gave the Euro a boost overnight. The United Kingdom releases inflation for June, expected to climb to 9.30% YoY, with Core Inflation at 5.80%, PPI rising to 23.20% and Retail Prices rising 11.80%. With UK employment data yesterday surprisingly strong, some serious pressure is going to fall on the Bank of England now to accelerate rate hikes least material Sterling weakness return.
US Housing Starts for June edged slightly lower overnight, and tonight we receive Existing Home Sales, which are expected to fall slightly to 5.38 million. In this environment, a bigger fall as rate hikes bite, is likely to be interpreted as peak inflation/ less Fed rate hikes equals buy equites and sell US Dollars. Counterintuitive I know, but I don’t make the story up, I just report it and try to make sense of it.
Asian equities follow Wall Street higher
Asian equity markets are enjoying a very positive session today, content to coattail the impressive rally by Wall Street overnight. Overnight, US stocks booked impressive gains after Netflix had less worse results than expected, and peak inflation hopes abounded on expectations of resumed Black Sea grain exports and Russian gas exports to Europe. All-in all, it looked like Wall Street was looking for any excuse to continue the bear-market rally, and they got it.
Overnight, the S&P 500 jumped an impressive 2.73% higher, while the Nasdaq rallied by 3.09% as the Netflix results inspired investors to pile back into big tech en masse. Not to be outdone, the Dow Jones also booked a health 2.39% gain. In Asia, the party continues for US futures. S&P 500 futures are 0.53% higher, Nasdaq futures are rallied by 0.72%, and Dow futures have added 0.41%.
In Asia, Japan’s Nikkei 225 has jumped 2.40% higher, with South Korea’s Kospi climbing by 1.05%, and Taipei is also 1.05% higher. The rally is less impressive in Mainland China thanks to rising covid-19 cases. The Shanghai Composite is 0.67% higher, the CSI 300 has added just 0.38%, but Hong Kong’s Hang Seng has rallied 1.80% higher.
In regional markets, Singapore is 1.33% higher, with Kuala Lumper gaining 0.55%. Jakarta has rallied by 1.80%. Manila and Bangkok have added 0.40%. Australian markets are having a strong day on the back of the US equity rally. The ASX 200 is 1.50% higher, while the All Ordinaries has rallied by 1.65%.
European markets booked another outsized session of gains overnight, following Wall Street and hitching their wagon on hopes that Putin would return Nord Stream 1 flows to normal from tomorrow. I admire their optimism, but Mr Putin appeared to pour cold water on that this morning, and I suspect it will eventually pour cold water on European equity markets dalliance with the world of fantasy today.
US Dollar correction continues
With risk sentiment soaring in US equity markets overnight, the US Dollar bull market correction continued unabated, with losses versus the DM and EM space overnight. The dollar index closed 0.68% lower at 106.68 overnight, easing another 0.15% to 106.53 in Asia. but traded in a very choppy 115 point range between 106.90 and 108.05. The index traced out a double bottom at 106.40 overnight, and this marks initial support. Failure allows a test of 105.85 and then 105.00. Above, resistance is at 107.60, the overnight high, and then 108.70. A neutral relative strength index allows the US Dollar correction to continue for some time yet.
EUR/USD rallied through 1.0200 yesterday, finishing 0.80% higher at 1.0225. Asia is has edged higher to 1.0245. The technical picture still suggests only a sustained break above 1.0360 would suggest a longer-term low is in place. EUR/USD has support at 1.0120 and 1.0000. The single currency faces serious event risk in the latter half of the week, firstly from the ECB policy decision, and secondly, from Russian natural gas flows which are due to resume after pipeline maintenance.
USD/JPY is holding steady at 138.00, where it remains in Asia. 139.40 is initial resistance, followed by 140.00. Support is at 137.40 and 136.00. The former was tested again overnight, and failure now signals a much deeper correction lower.
AUD/USD and NZD/USD rallied strongly overnight, breaking higher out of their falling wedge formations, implying more gains are likely in the near term. Having broken higher through 0.6850, AUD/USD is trading at 0.6920 today and the technical picture suggest a move through 0.7000 is likely. Similarly, the rise through 0.6150 by NZD/USD suggests that further gains above 0.6300 are possible.
Oil prices explode higher
Brent crude and WTI prices continued higher overnight as sentiment in markets swung to peak inflation once again, and concerns persisted around the resumption of Russian gas supplies. Brent crude rose 1.50% to $107.25 overnight, before edging lower to $106.40 in Asia. WTI rose by 1.50% to 103.35 a barrel overnight, moving 0.70% lower to $102.65 a barrel in Asia.
Brent crude has nearby resistance at $107.25, followed by $108.00 a barrel. Support is at $103.65 and $99.50. WTI has support at $99.35 and $96.00 a barrel, with resistance nearby at $104.00 and $105.00 a barrel.
Gold’s remains unimpressive
Gold has another unimpressive session overnight, failing ahead of $1720.00 intraday, but closing almost unchanged at $1711.00 an ounce, before edging lower to $1709.00 in Asia.
Gold’s inability to hold onto even modest rallies in prices, even as the US Dollar falls and US bonds trade sideways, is a major concern. Risk remains heavily skewed towards the downside.
Gold has initial support at $1700.00, followed by the more important $1675.00 an ounce zone. A sustained failure of $1675.00 will signal a much deeper move lower targeting the $1450.00 to $1500.00 an ounce regions in the weeks ahead. Gold has resistance nearby at $1725.00, and then $1745.00.
Technical Outlook and Review
DXY:
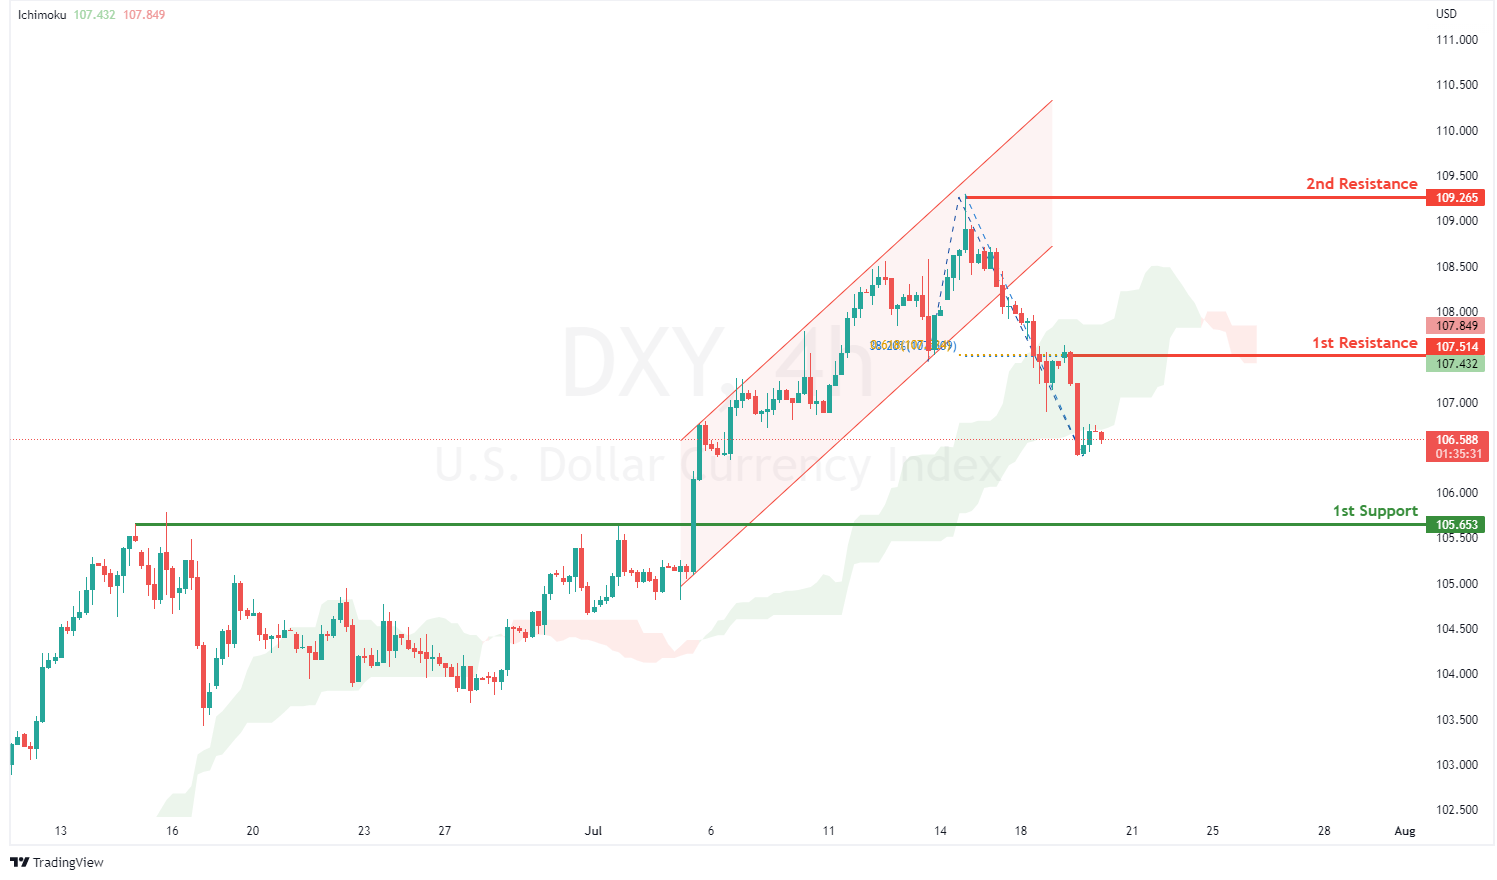
On the H4, with prices having broken out of the ascending channel and reversing off the ichimoku indicator, we have a bearish bias that prices will rise and drop from the 1st resistance at 107.514 where the 61.8% fibonacci projection and 38.2% fibonacci retracement are to the 1st support at 105.653 where the pullback support is. Alternatively, prices could break 1st resistance and rise to 2nd resistance at 109.265 in line with swing high resistance.
Areas of consideration:
- H4 time frame, 1st resistance at 107.514
- H4 time frame, 1st support at 105.653
XAU/USD (GOLD):
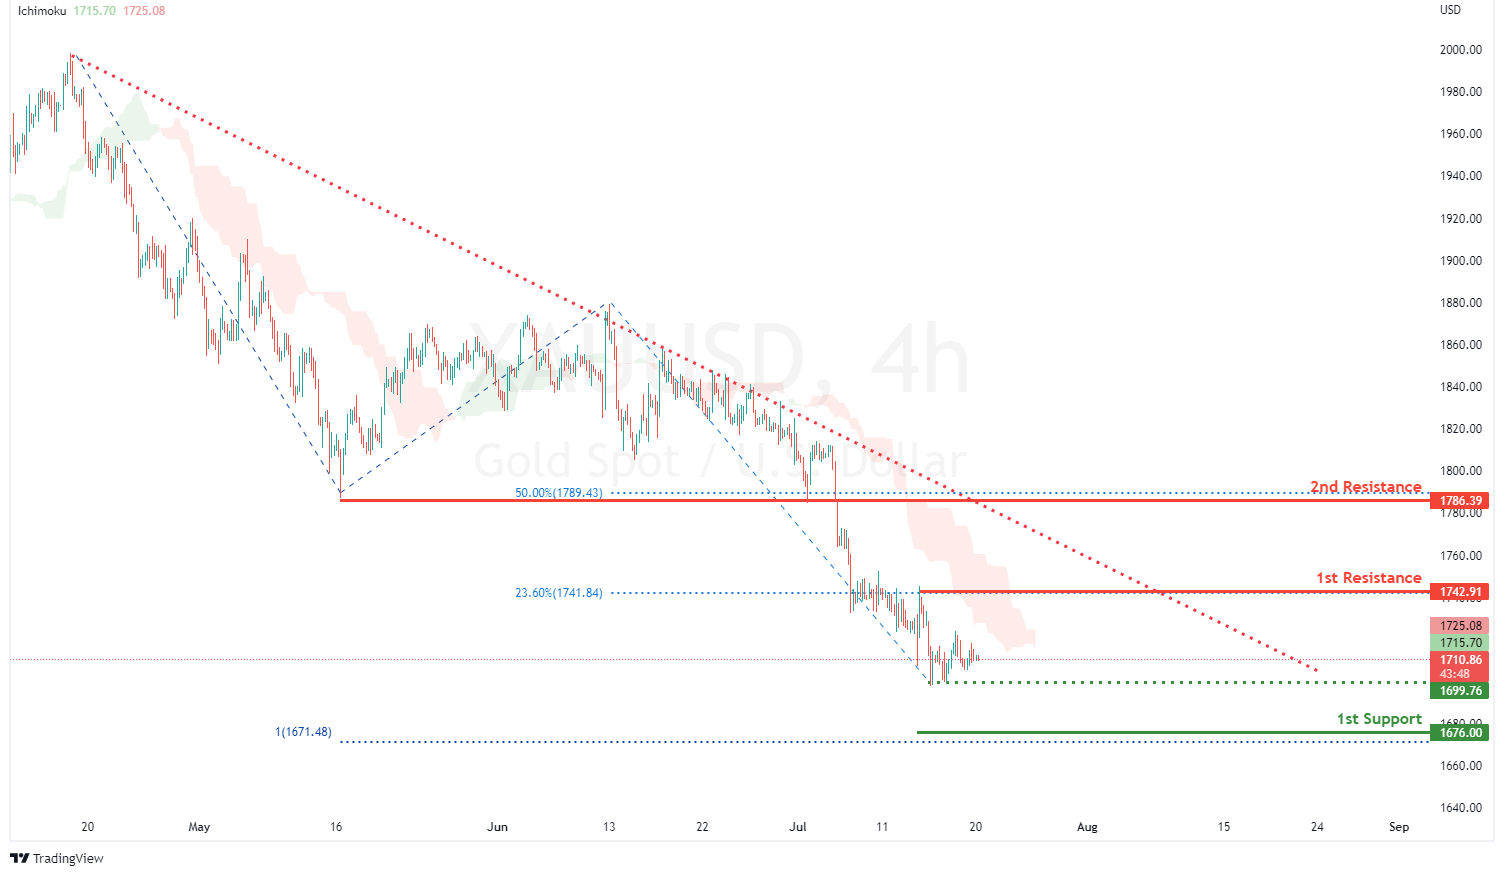
On the H4, with price moving below the ichimoku cloud and in a descending trendline, we have a bearish bias that price will rise and drop from the 1st resistance at 1742.91 where the swing high resistance and 23.6% fibonacci retracement are to the 1st support at 1676.00 in line with the 100% fibonacci projection and swing low support on the daily timeframe. Take note of intermediate support at 1699.76 where the swing low support is. Alternatively, price could break 1st resistance on the upside and we would expect bullish momentum to carry prices to 2nd resistance at 1786.39 where the pullback resistance and 50% fibonacci retracement are.
Areas of consideration:
- H4 time frame, 1st Resistance at 1742.91
- H4 time frame, 1st Support at 1676.00
GBP/USD:
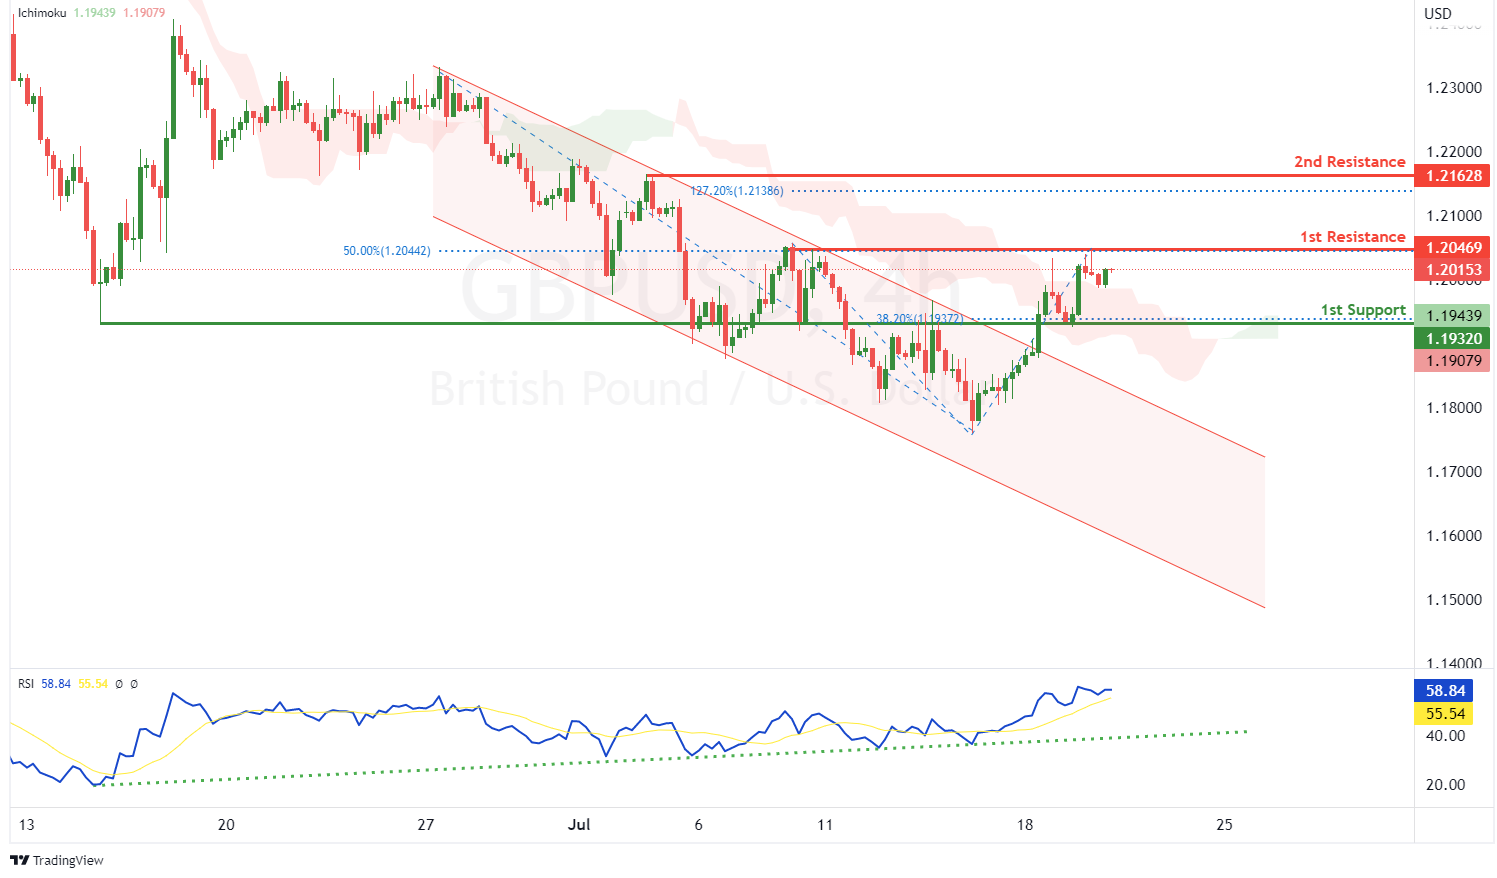
On the H4, with prices bouncing off the ichimoku indicator, RSI moving in an ascending trendline and price has broken out of the descending channel, we have a bullish bias that price will rise to the 1st resistance at 1.20469 where the 50% fibonacci retracement and swing high resistance are. Once there is upside confirmation that price has broken the 1st resistance, we would expect bullish momentum to carry prices to 2nd resistance at 1.21628 where the swing high resistance and 127.2% fibonacci extension are. Alternatively, price could drop to the 1st support at 1.19320 where the pullback support and 38.2% fibonacci retracement are.
Areas of consideration:
- H4 1st resistance at 1.20469
- H4 1st support at 1.19320
USD/CHF:
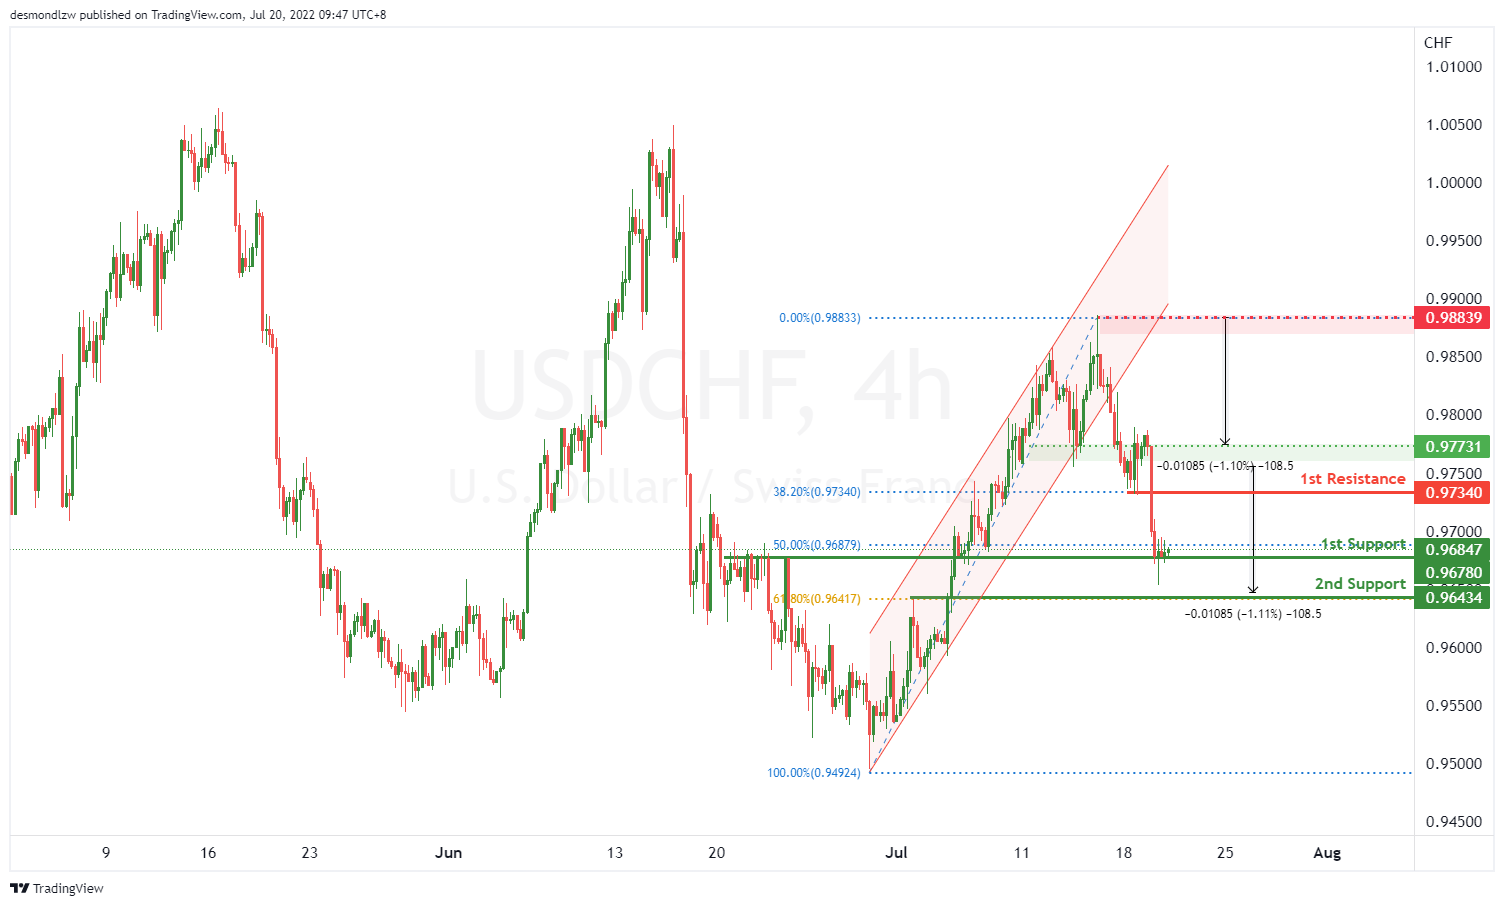
On the H4, with price breaking the bullish channel, we have a bearish bias that price might drop from our 1st support at 0.96845 where the 50% fibonacci retracement is to our 2nd support at 0.96434 in line with the 61.8% fibonacci retracement. Alternatively, price may not break 1st support and head for 1st resistance at 0.97340 where the 38.2% fibonacci retracement is. Take note that as the price is showing a “double top” pattern, the price may drop approximately the same height as the double top formation from the neckline.
Areas of consideration
- 1st support level at 0.96845
- 2nd support level at 0.96434
EUR/USD :
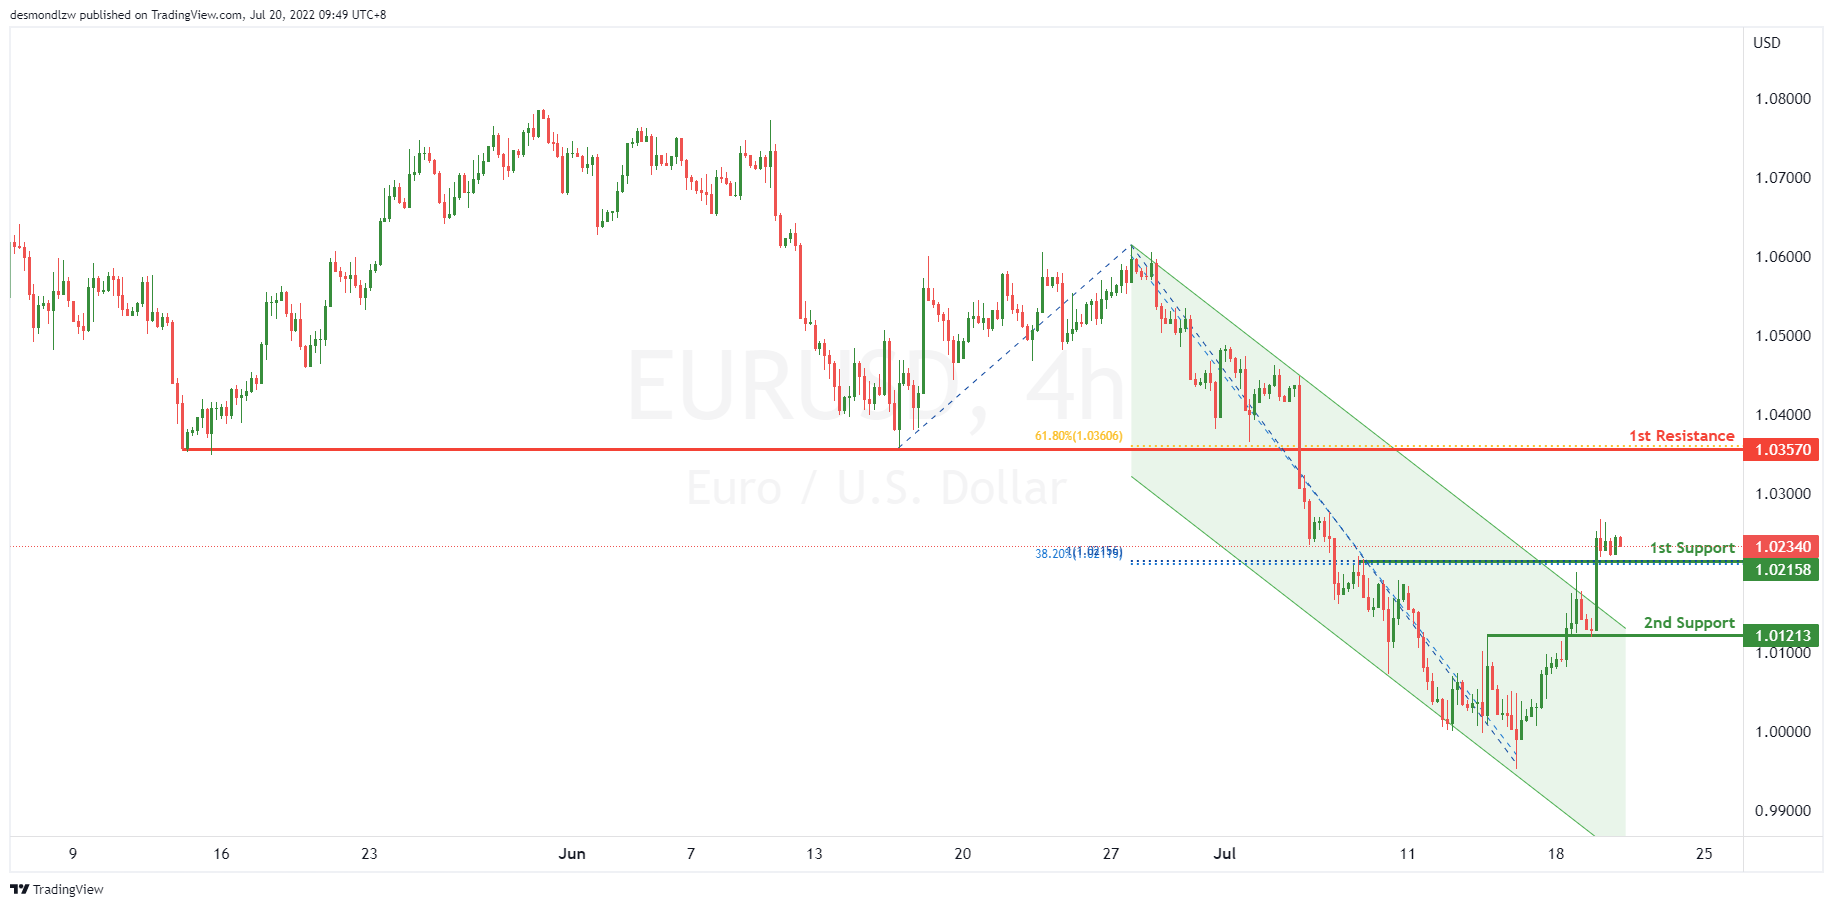
On the H4, with price recently breaking out of the descending trend channel, we have a bullish bias that price will continue to rise from the 1st support at 1.02158 in line with the 38.2% fibonacci retracement and 100% fibonacci projection to the 1st resistance at 1.03570 at the pullback resistance in line with the 61.8% fibonacci retracement. Alternatively, price may reverse off the 1st support and drop to the 2nd support at 1.01213 at the pullback support.
Areas of consideration :
- H4 1st resistance at 1.03570
- H4 1st support at 1.02158
USD/JPY:
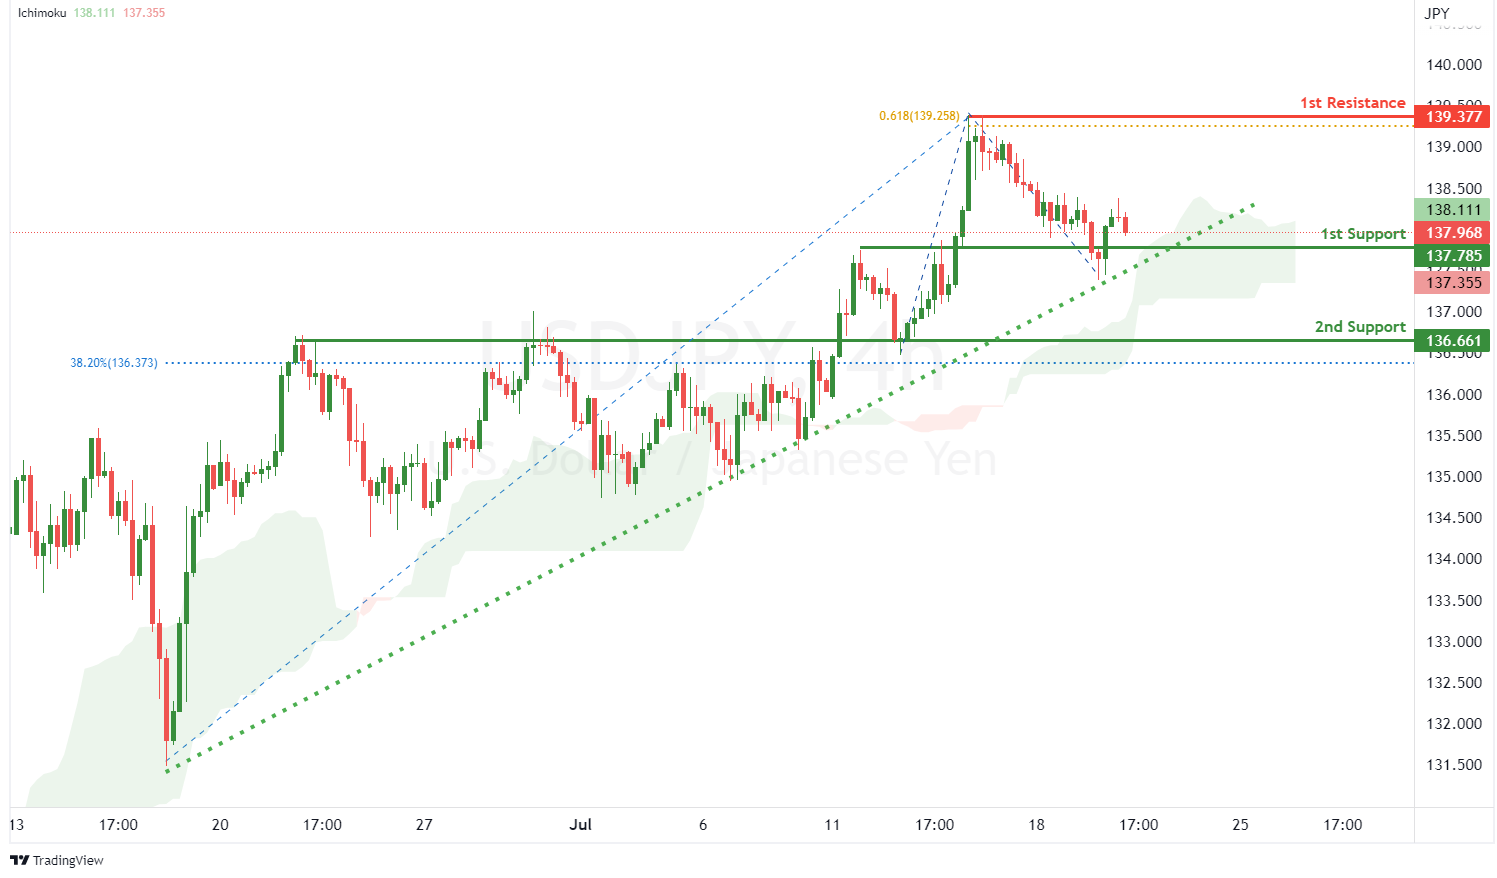
On the H4, with price moving above the ichimoku indicator and along the ascending trendline, we have a bullish bias that price will rise to our 1st resistance at 137.785 where the 61.8% fibonacci projection and swing high resistance are from our 1st support at 137.785 in line with pullback support. Alternatively, prices could break 1st support structure and drop to 2nd support at 136.661 where the overlap support and 38.2% fibonacci retracement are.
Areas of consideration:
- H4 time frame, 1st resistance at 139.377
- H4 time frame, 1st support at 137.785
AUD/USD:
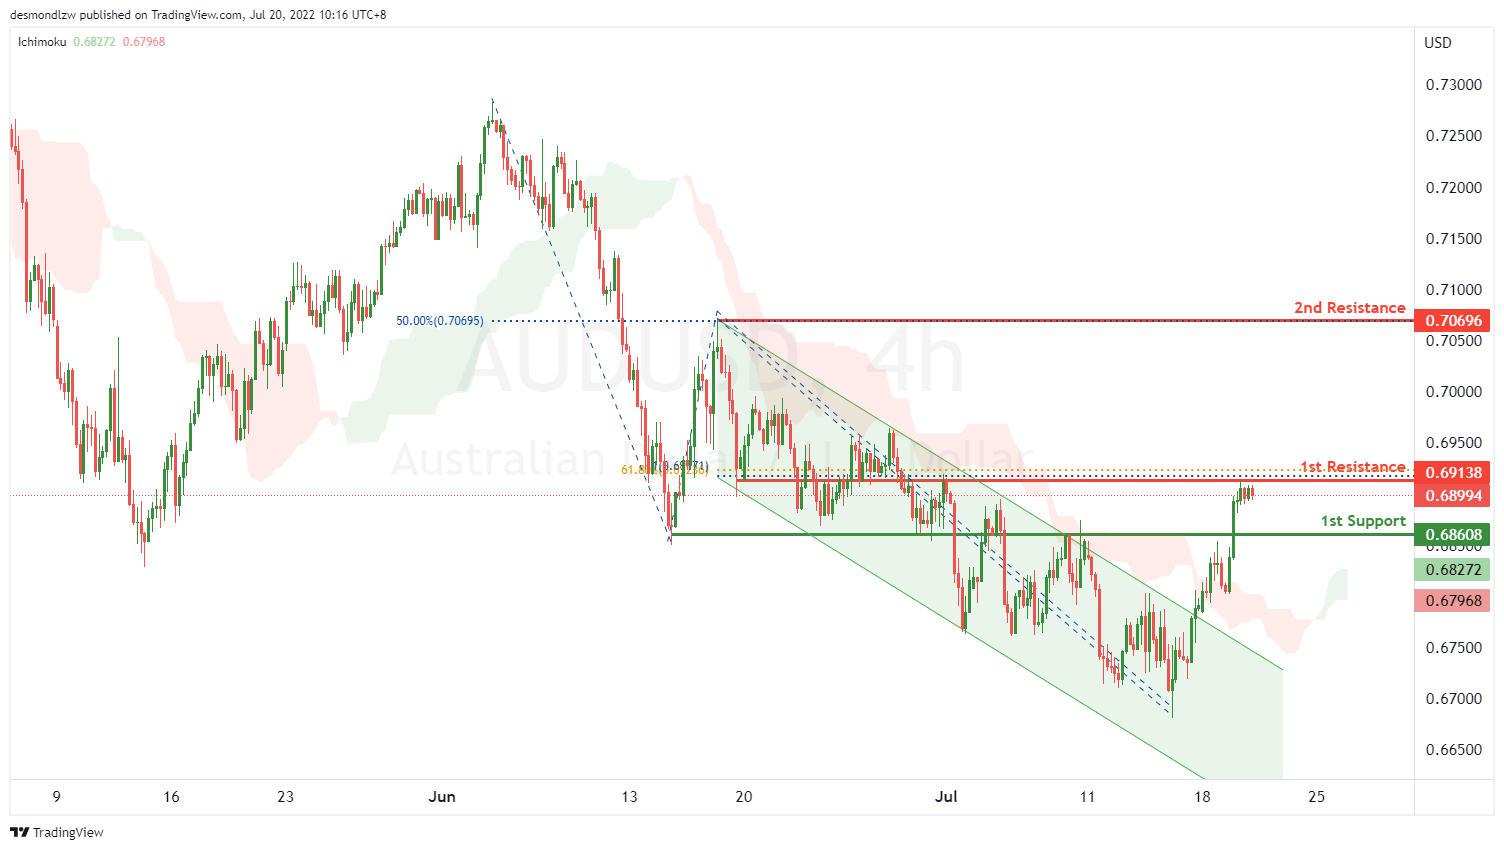
On the H4, with price recently breaking the descending trend channel and moving above the ichimoku cloud, we have a bullish bias that price will continue to rise. If price breaks the resistance at the 1st resistance at 0.69138 at the overlap resistance in line with the 61.8% fibonacci retracement and 100% fibonacci projection, we will have upside confirmation that price will rise to the 2nd resistance at 0.70696 at the swing high in line with the 50% fibonacci retracement. Alternatively, price may reverse off the 1st resistance and drop to the 1st support at 0.68608 at the pullback swing low.
Areas of consideration
- H4 1st resistance at 0.69138
- H4 1st support at 0.68608
NZD/USD:
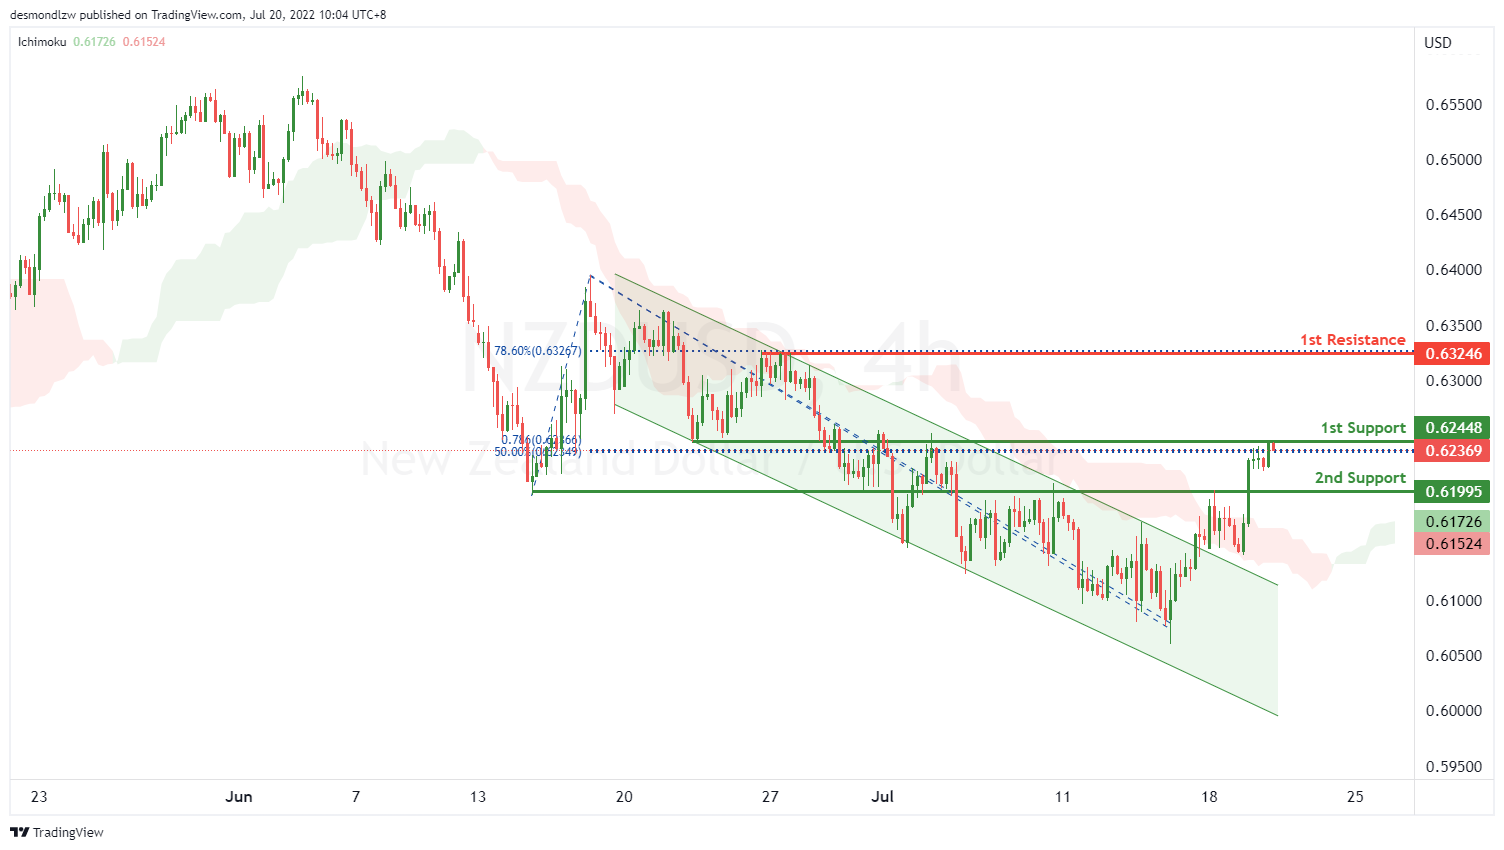
On the H4, with price recently breaking out of the descending trend channel and price moving above the ichimoku cloud, we have a bullish bias that price will continue to rise from the 1st support at 0.62448 at the overlap support in line with the 50% fibonacci retracement and 78.6% fibonacci projection to the 1st resistance at 0.63246 at the swing high in line with the 78.6% fibonacci retracement. Alternatively, price may reverse off the 1st support and drop to the 2nd support at 0.61995 at the overlap swing low.
Areas of consideration:
- H4 time frame, 1st support at 0.60809
- H4 time frame, 1st resistance at 0.61424
USD/CAD:
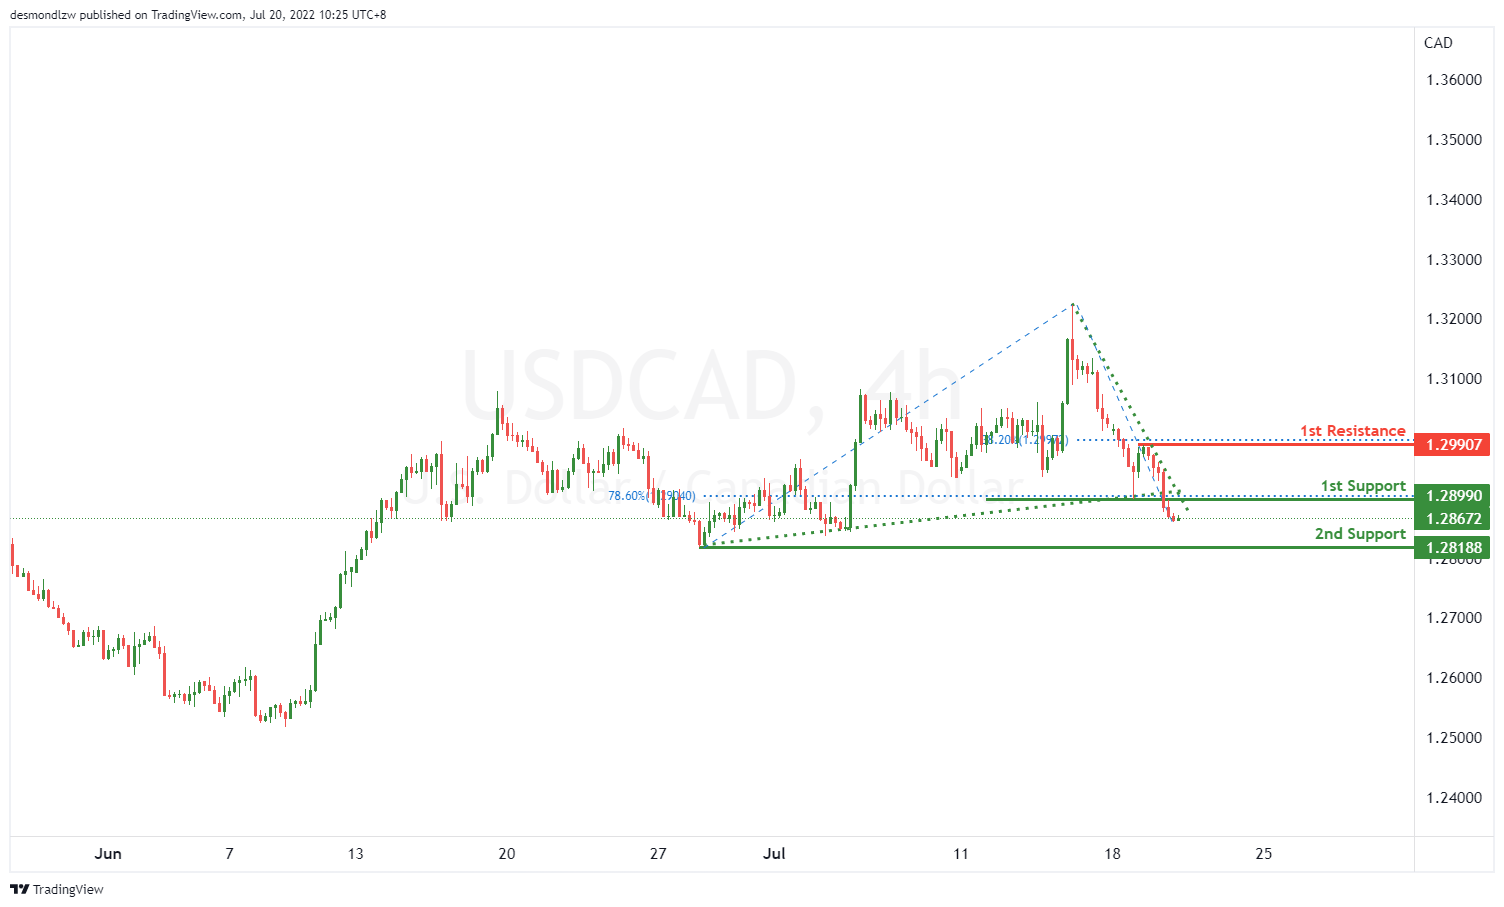
On the H4, with price breaking the ascending trendline and moving with a descending line, we have a bearish bias that price will rise from our 1st support at 1.28990 where the 78.6% fibonacci retracement to our 2nd support at 1.28188 where the swing low support is.Alternatively, price may break the support structure at the 1st support and rise to the 1st resistance at 1.29907 where the 38.2% fibonacci retracement is.
Areas of consideration:
- H4 time frame, 2nd support at 1.28188
- H4 time frame, 1st support at 1.28990
OIL:
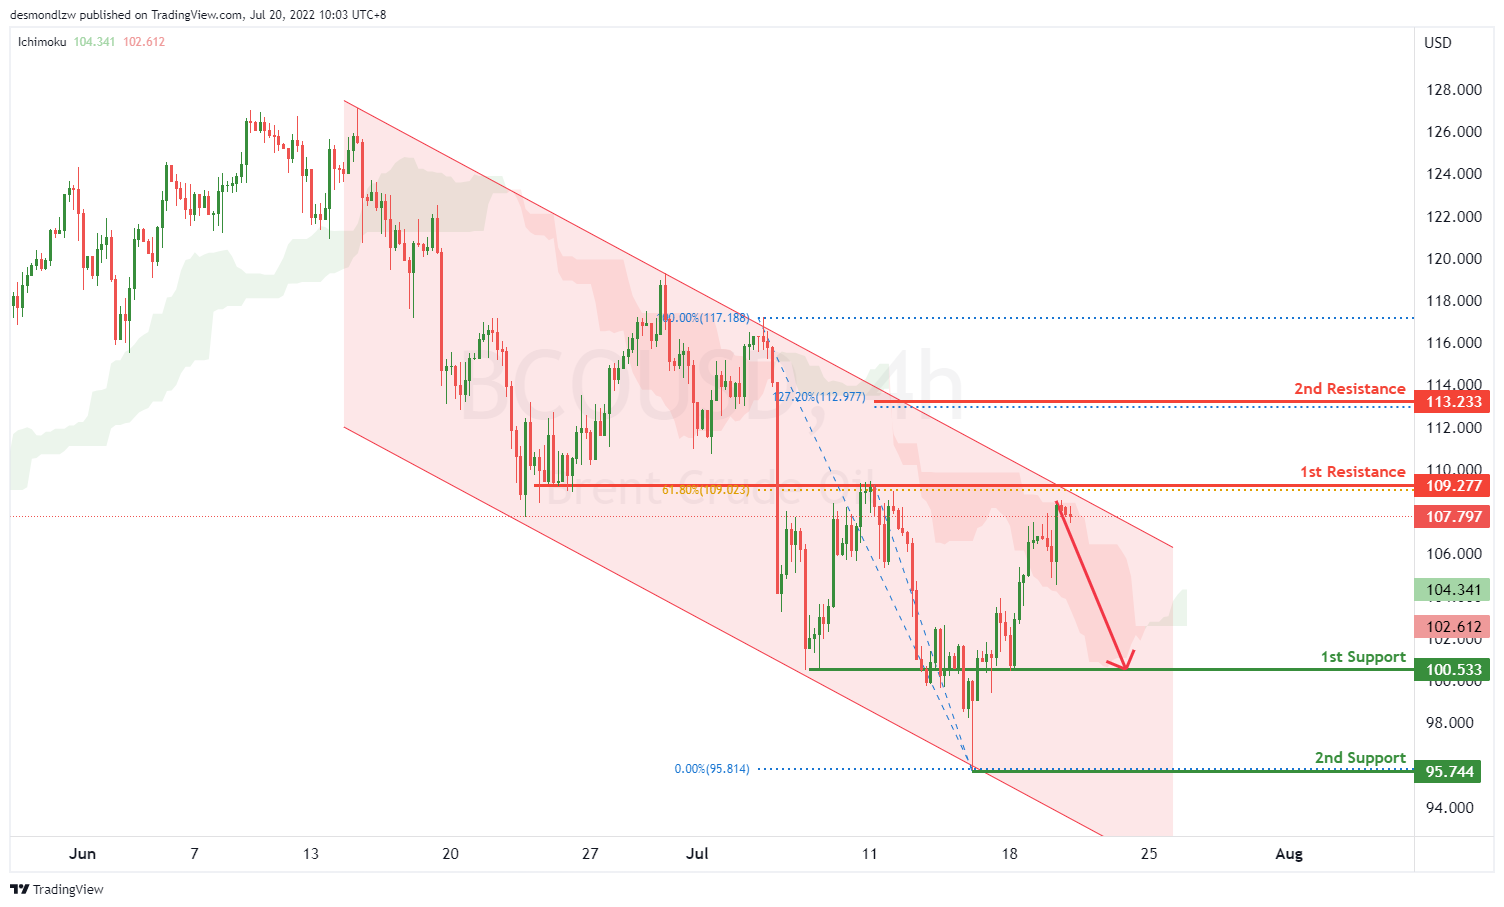
On the H4, with price moving along the descending channel and testing the overlap resistance, we have a bearish bias that price will drop to our 1st support at 100.533. Once there is downside confirmation of price breaking 1st support, we would expect bearish momentum to carry price to 2nd support at 95.744 where the swing low support is. Alternatively, price may rise to 1st resistance at 109.277 in line with 61.8% fibonacci fibonacci retracement. Should price break 1st resistance, we would have a bullish bias that price would rise to 2nd resistance at 113.233 where the 127.2% fibonacci retracement is.
Areas of consideration:
- H4 time frame, 1st resistance of 109.277
- H4 time frame, 1st support of 100.533
Dow Jones Industrial Average:
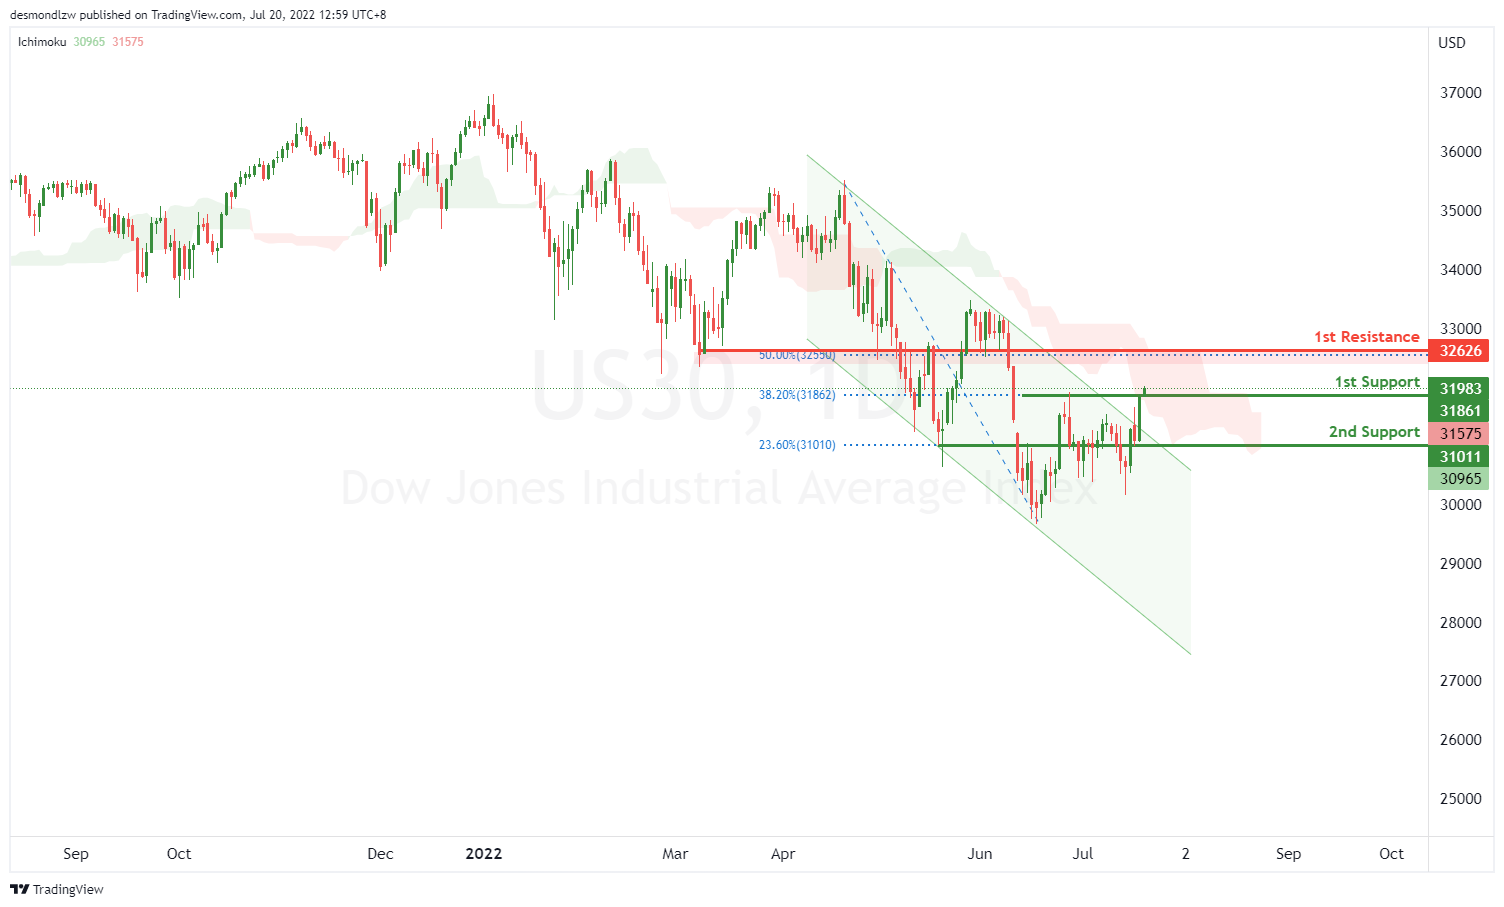
On the H4, with price moving in a bearish channel, crossing the ichimoku cloud, having a bullish break, we have a bullish bias that price might rise from our 1st support at 31999 , which is in line with the pullback resistance and 38.2% fibonacci retracement to our 1st resistance at 32677, which is in line with 50% fibonacci retracement. Alternatively, price may reverse off the 1st support and drop to the 2nd support at 31011, which is in line with the 23.6% fibonacci retracement.
Areas of consideration:
- H4 time frame, 1st support of 31986
- H4 time frame, 1st resistance at 32626
Gold Sticky Around $1,700 Level
Turbulence persists in the global economic scene and investors scramble to assess the future prospects of the bullion, as the rising tide of contagious inflation, recession fears and geopolitical risks continue to lash relentlessly onto the markets. In this report we aim to shed light on the events of the recent past and upcoming events that are of crucial importance for the future development of the precious, as well as a technical analysis of assessing its potential short-to-medium horizon.
Even though, XAU/USD fell to the $1,700 per ounce during last week, a level once seen before in August 2021, it held steady above the 11-month low level, attempting to consolidate. The plunge of the precious to the prementioned level above, could partly be explained by the speculative news, circulated around the prospect of 100 basis points rate hike from the Fed. Market expectations therefore, nudged the dollar to new highs and weighted down on the bullion. Even though, we await the official decision, which takes place on July 26th, the market rushed nonetheless and priced in Fed’s potential monetary policy change. Atlanta’s Federal Reserve President Bostic during an interview last week, warned cautiousness and stated that “moving too dramatically will undermine a lot of the things working well”, favoring the decision of 75 basis points rate hike, rather the 100. Bostic’s main concern is that, hiking too aggressively in an attempt to cool off inflation, could potentially tip the economy into a recession. Contradicting Bostic’s view was Fed’s Governor Waller who stands by the FOMC’s 75-basis points decision for July but was, according to a Bloomberg interview, open to a 100-basis points rate hike, if the data justifies such action. This comes after the unprecedented surge of inflation, with the YoY CPI rate figure reaching the 9.1% level, marking four-decade highs. We should note also that FOMC’s Brainard is scheduled to speak later today, 19th of July, and could hint where she leans. Should Brainard’s comments be hawkish, then we might see the greenback getting a boost and in consequence suppress gold’s price.
Noteworthy, is that also the negative correlation of gold with the greenback has broken, as the dollar dropped during the past three sessions against a number of its counterparties, while the precious remained rather stable, which leaves us with the question, what other factors may influence gold’s stability.
However, the underperformance of stock markets and bonds, in tandem with geopolitical uncertainty and fears of a recession, might reignite demand for the bullion, serving as hedge for investors. The time for the yellow metal may come, when the rampant inflation gets tamed and markets transition towards a stagflationary cycle, reestablishing its status as a safe haven.
As the key fundamental drivers of gold’s price appear to be relatively unchanged in recent weeks, our assessment of the short-term development of gold points towards sideways price action, unless a material change of those drivers takes place.
Technical Analysis
XAUUSD H4
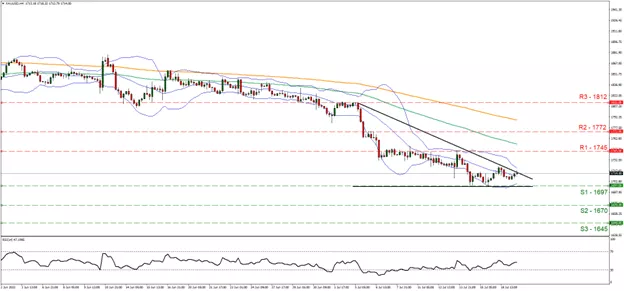
Looking at XAUUSD 4H chart we can observe its downward sloping trend initiated on the 5th of July
Looking at XAUUSD 4H chart we can observe its downward sloping trend initiated on the 5th of July, where it broke below the $1800 mark plunging lower, finding support on multiple occasions at the $1695 (S1) support level, an area once visited before in April 2021. Having said that, we maintain a sideways outlook bias for short-term horizon as gold experienced prolonged devaluation and a correction is due, in our assessment. Supporting our case, the RSI indicator below our 4-hour chart, which currently hovers near the 50 level. Also, worth pointing out, is the price action taking place on the midline of the tightening bands, which showcase a decrease in volatility. Should the bulls reign over, we might see a definitive break of the descending trendline, followed by the break of the $1745 resistance (R1) line and a move close to the $1772 (R2) resistance barrier. Should the bears take over however, we would require seeing a break below the $1695 support (S1) line and a definitive move towards the $1670 support (S2) level.
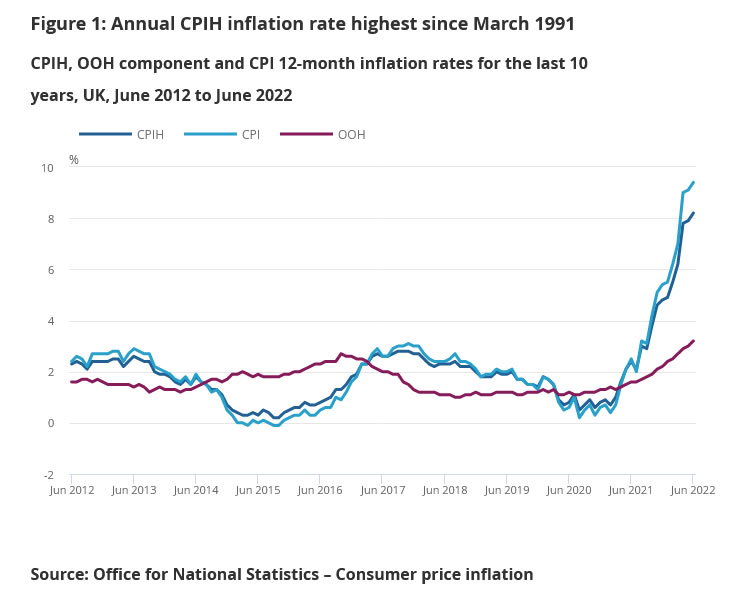
UK CPI rose to 9.4% yoy in Jun, goods up 12.7% yoy, services up 5.2% yoy
UK CPI accelerated from 9.1% yoy to 9.4% yoy in June, above expectation of 9.3% yoy. That's also the highest level since the series began in January 1991. Indicative model estimates that it's the highest since 1982, when it was 11%.
The CPI all goods index rose by 12.7% yoy, accelerated from 12.4%. CPI all services rose 5.2% yoy, accelerated from 4.9%. CPI core (excluding energy, food, alcohol, and tobacco) slowed from 5.9% yoy to 5.8% yoy, below expectation of 6.0% yoy.
Also published from the UK, PPI input was at 1.8% mom, 24.0% yoy, versus expectation of 0.9% mom, 23.5% yoy. CPI output was at 1.4% mom, 16.5% yoy, versus expectation of 2.0% mom, 16.8% yoy. CPI output core was at 0.8% mom, 15.2% yoy, versus expectation of 2.0% mom, 15.5% yoy.
AUD/USD Daily Report
Daily Pivots: (S1) 0.6830; (P) 0.6872; (R1) 0.6940; More...
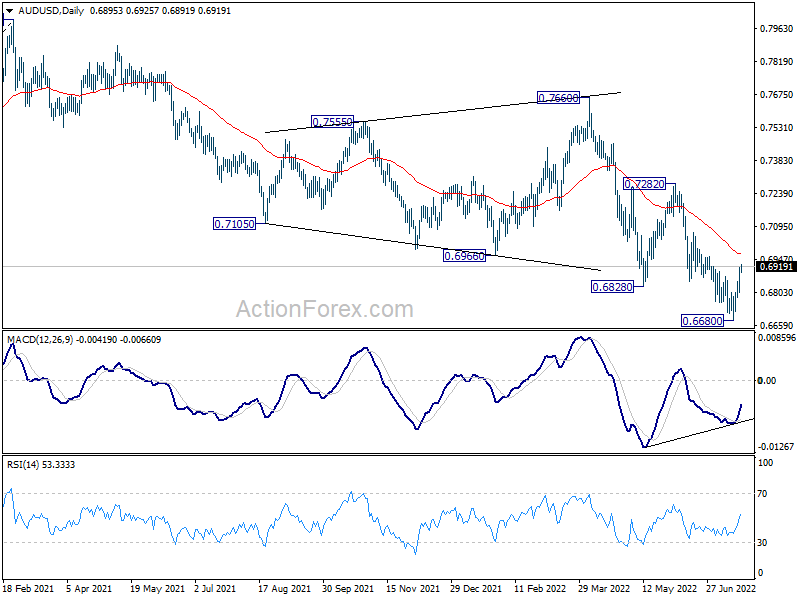
Intraday bias in AUD/USD remains on the upside, as rebound from 0.6680 short term bottom is in progress. Next target is 55 day EMA (now at 0.6973). Sustained break there will target 0.7282 structural resistance next. On the downside, however, below 0.6801 minor support will turn bias back to the downside for retesting 0.6680 low instead.
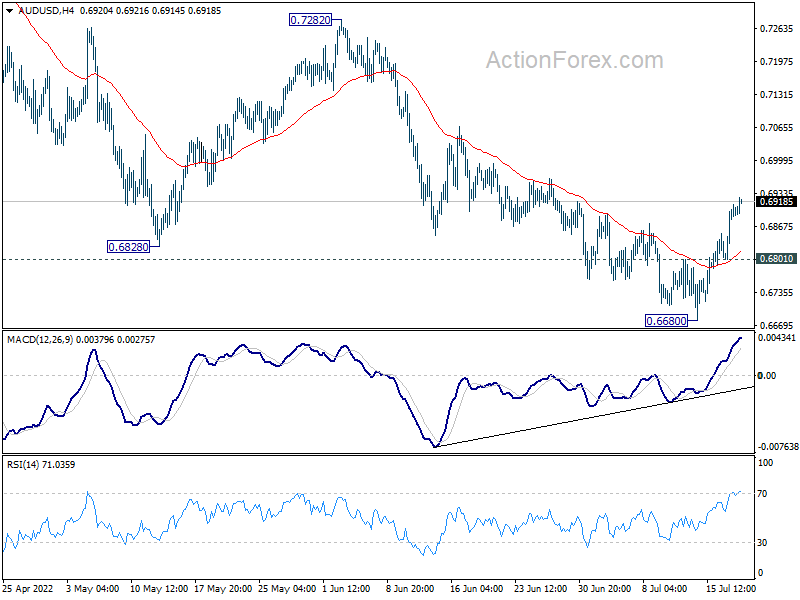
In the bigger picture, price actions from 0.8006 could still be a corrective pattern to rise from 0.5506 (2020 low). But current downside acceleration is raising the chance that it's a bearish impulsive move. In either case, outlook will remain bearish as long as 0.7282 resistance holds. Next target is 61.8% retracement of 0.5506 to 0.8006 at 0.6461.
Kiwi and Aussie Jump on Improving Sentiment, Dollar Correction Continues
New Zealand and Australian Dollar trade broadly higher on the back on improving market sentiment. Asia indexes are tracking US stocks higher. On the other hand, Dollar continues to extend its near term correction, in particular against commodity currencies. Yen is also under some pressure. Meanwhile, European majors are mixed for now, waiting for UK inflation data today and ECB rate decision tomorrow.
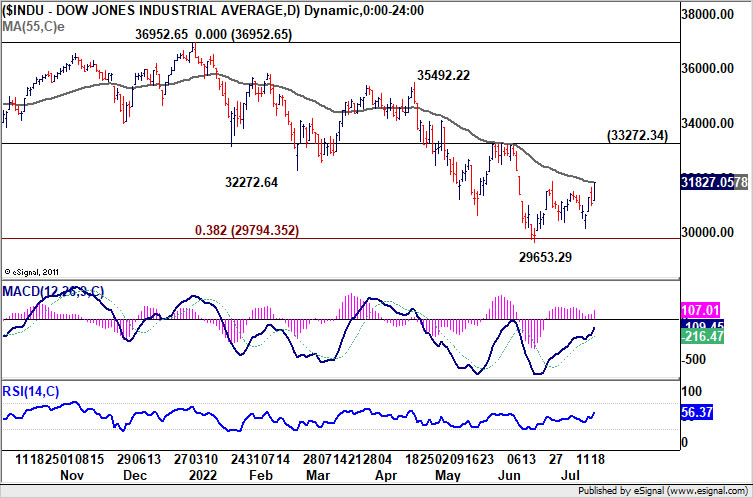
Technically, DOW's strong close overnight suggests that rebound from 29653.29 is ready to resume. Sustained trading above 55 day EMA (now at 31837.57) will add to the case that correction from 36952.65 is over. Further rise would then be seen back to 33272.34 resistance first, and break there will open up more rally back to 35392.22/36952.65 resistance zone. Such development could happen rather quickly. And, if happens, would add more fuel to the selloff in Dollar and Yen.
In Asia, at the time of writing, Nikkei is up 2.55%. Hong Kong HSI is up 1.57%. China Shanghai SSE is up 0.75%. Singapore Strait Times is up 1.18%. Japan 10-year JGB yield is up 0.0048 at 0.247. Overnight, DOW rose 2.43%. S&P 500 rose 2.76%. NASDAQ rose 3.11%. 10-year yield rose 0.059 to 3.019.
RBA Lowe: Further increase in rates required over the month ahead
RBA Governor Philip Lowe said in a speech that the robust post-COVID recovery is "now behind us" given that inflation is high and labor market is very tight. RBA thus have withdrawn some emergency insurance and raised cash rate by 125bps over the past three meetings to 1.35%.
RBA "expects that further increase will be required over the months ahead", to "help establish a more sustainable balance between demand and supply in the Australian economy.
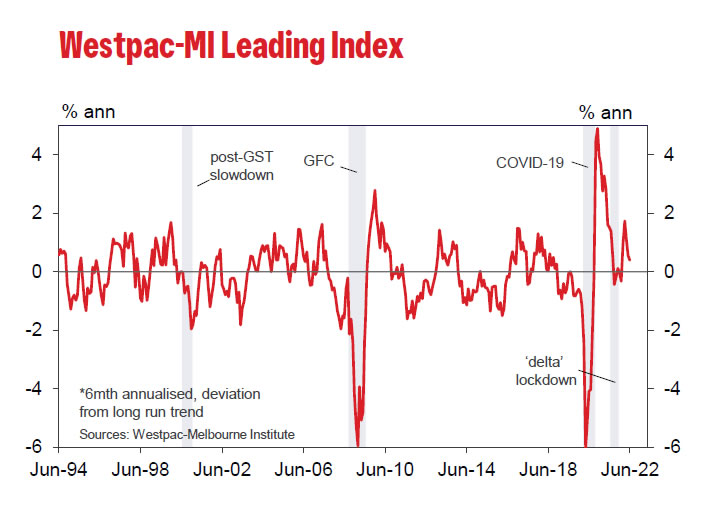
Australia Westpac leading index dropped to 0.40%, economic slowdown ahead
Australia Westpac leading index dropped from 0.56% to 0.40% in June, indicating economic slowdown later in the year, but momentum is still above trend in the near term.
Westpac currently expects growth to slow from 4% in 2022 to 2% in 2023, but that is highly dependent on the profile of RBA's tightening cycle.
Westpac expects RBA to opt for a fourth successive rate hike on August 2, and a third success time by 50bps. The current cycle is the first time cash rate has been lifted by 50bps or higher since 1990.
NZD/JPY ready for upside breakout, AUD/JPY to follow
Kiwi and Aussie are both trading broadly higher today, with help from improving market sentiment. Asian stocks are trading higher, following the strong rebound in US indexes overnight. Technically, speaking, NZD/JPY looks ready for an upside breakout, while AUD/JPY could follow soon.
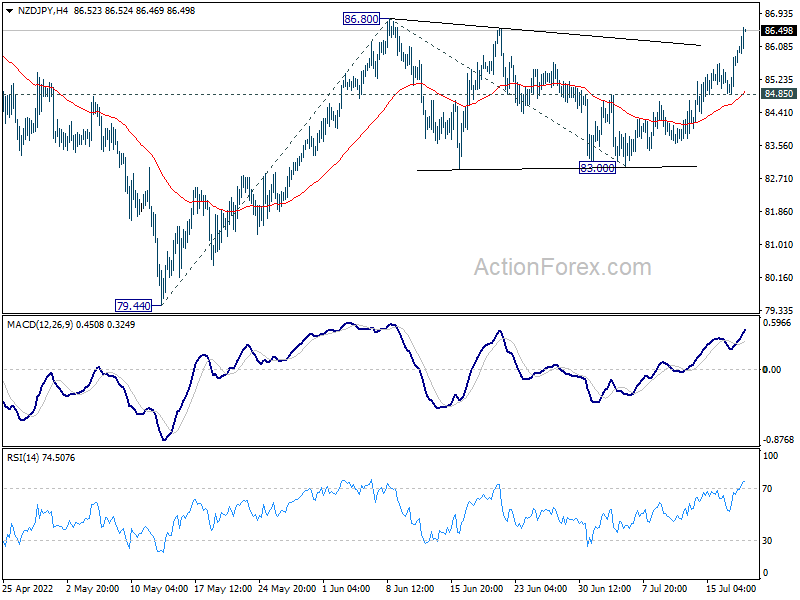
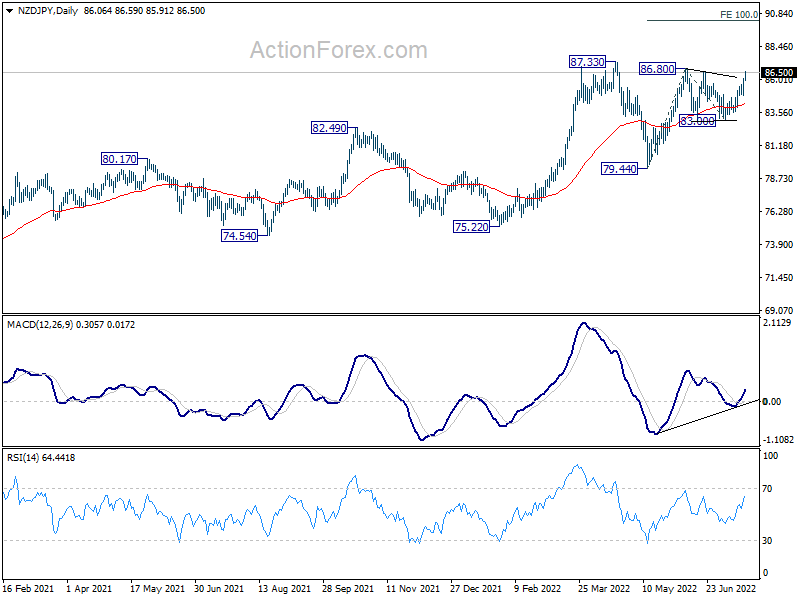
NZD/JPY's consolidation pattern from 86.80 should have completed 83.30, after struggling around 55 day EMA. Break of 86.80 resistance should send the cross through 87.33 high to resume larger up trend. Next target will be 100% projection of 79.44 to 86.80 from 83.00 at 90.36. But break of 84.85 will dampen this view and bring more corrective trading first.
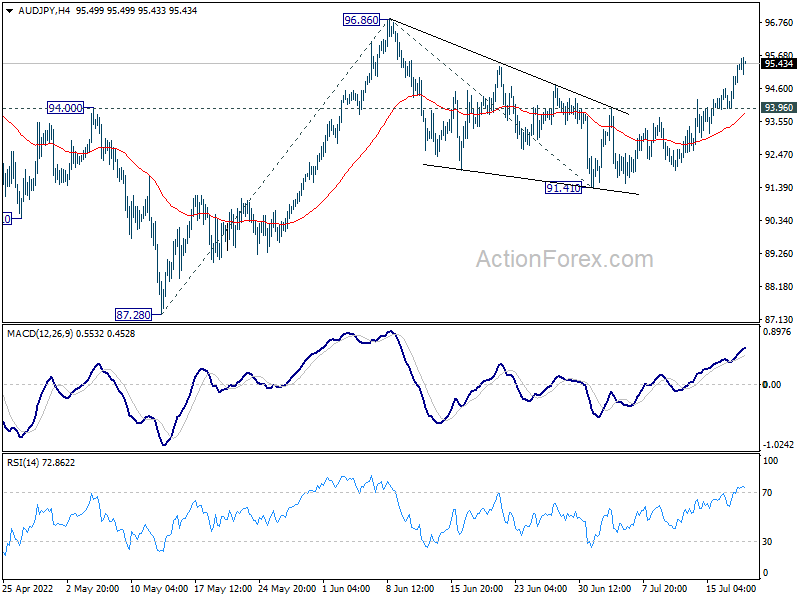
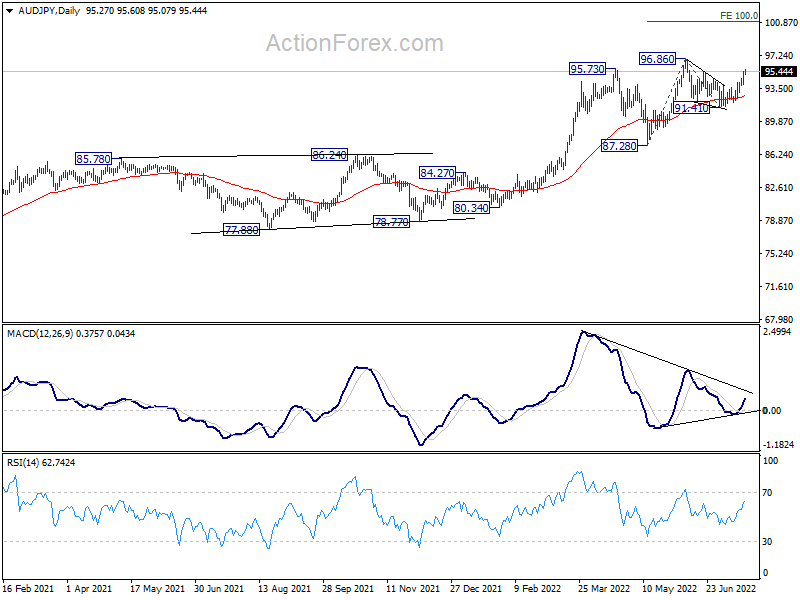
AUD/JPY is lagging behind for now. But it's also possible that corrective pattern from 96.86 is complete at 91.41. Further rise is in favor as long as 93.96 minor support holds. Break of 96.86 will confirm up trend resumption. Next target is 100% projection of 87.28 to 96.86 from 91.41 at 100.99.
Looking ahead
Inflation data are the main focuses for today. UK will publish CPI, RPI and PPI. Germany will release PPI. Eurozone will also release current account.
Later in the day, Canada CPI will take center stage, while IPPI and RMPI will be featured. US will release existing home sales.
AUD/USD Daily Report
Daily Pivots: (S1) 0.6830; (P) 0.6872; (R1) 0.6940; More...
Intraday bias in AUD/USD remains on the upside, as rebound from 0.6680 short term bottom is in progress. Next target is 55 day EMA (now at 0.6973). Sustained break there will target 0.7282 structural resistance next. On the downside, however, below 0.6801 minor support will turn bias back to the downside for retesting 0.6680 low instead.
In the bigger picture, price actions from 0.8006 could still be a corrective pattern to rise from 0.5506 (2020 low). But current downside acceleration is raising the chance that it's a bearish impulsive move. In either case, outlook will remain bearish as long as 0.7282 resistance holds. Next target is 61.8% retracement of 0.5506 to 0.8006 at 0.6461.
Economic Indicators Update
| GMT | Ccy | Events | Actual | Forecast | Previous | Revised |
|---|---|---|---|---|---|---|
| 00:30 | AUD | Westpac Leading Index M/M Jun | -0.20% | -0.06% | ||
| 06:00 | EUR | Germany PPI M/M Jun | 1.00% | 1.60% | ||
| 06:00 | EUR | Germany PPI Y/Y Jun | 35.50% | 33.60% | ||
| 06:00 | GBP | CPI M/M Jun | 0.70% | 0.70% | ||
| 06:00 | GBP | CPI Y/Y Jun | 9.30% | 9.10% | ||
| 06:00 | GBP | Core CPI Y/Y Jun | 6.00% | 5.90% | ||
| 06:00 | GBP | RPI M/M Jun | 1.50% | 0.70% | ||
| 06:00 | GBP | RPI Y/Y Jun | 12.80% | 11.70% | ||
| 06:00 | GBP | PPI Input M/M Jun | 0.90% | 2.10% | ||
| 06:00 | GBP | PPI Input Y/Y Jun | 23.50% | 22.10% | ||
| 06:00 | GBP | PPI Output M/M Jun | 2.00% | 1.60% | ||
| 06:00 | GBP | PPI Output Y/Y Jun | 16.80% | 15.70% | ||
| 06:00 | GBP | PPI Core Output M/M Jun | 2.00% | 1.50% | ||
| 06:00 | GBP | PPI Core Output Y/Y Jun | 15.50% | 14.80% | ||
| 08:00 | EUR | Eurozone Current Account (EUR) May | -5.8B | |||
| 12:30 | CAD | Industrial Product Price M/M Jun | 2.60% | 1.70% | ||
| 12:30 | CAD | Raw Material Price Index Jun | 0.00% | 2.50% | ||
| 12:30 | CAD | CPI M/M Jun | 1.10% | 1.40% | ||
| 12:30 | CAD | CPI Y/Y Jun | 8.80% | 7.70% | ||
| 12:30 | CAD | CPI Common Y/Y Jun | 4.20% | 3.90% | ||
| 12:30 | CAD | CPI Median Y/Y Jun | 5.10% | 4.90% | ||
| 12:30 | CAD | CPI Trimmed Y/Y Jun | 5.60% | 5.40% | ||
| 14:00 | USD | Existing Home Sales Jun | 5.40M | 5.41M | ||
| 14:00 | EUR | Eurozone Consumer Confidence Jul P | -25 | -23.6 | ||
| 14:30 | USD | Crude Oil Inventories | 2.1M | 3.3M |
NZD/JPY ready for upside breakout, AUD/JPY to follow
Kiwi and Aussie are both trading broadly higher today, with help from improving market sentiment. Asian stocks are trading higher, following the strong rebound in US indexes overnight. Technically, speaking, NZD/JPY looks ready for an upside breakout, while AUD/JPY could follow soon.
NZD/JPY's consolidation pattern from 86.80 should have completed 83.30, after struggling around 55 day EMA. Break of 86.80 resistance should send the cross through 87.33 high to resume larger up trend. Next target will be 100% projection of 79.44 to 86.80 from 83.00 at 90.36. But break of 84.85 will dampen this view and bring more corrective trading first.
AUD/JPY is lagging behind for now. But it's also possible that corrective pattern from 96.86 is complete at 91.41. Further rise is in favor as long as 93.96 minor support holds. Break of 96.86 will confirm up trend resumption. Next target is 100% projection of 87.28 to 96.86 from 91.41 at 100.99.
Australia Westpac leading index dropped to 0.40%, economic slowdown ahead
Australia Westpac leading index dropped from 0.56% to 0.40% in June, indicating economic slowdown later in the year, but momentum is still above trend in the near term.
Westpac currently expects growth to slow from 4% in 2022 to 2% in 2023, but that is highly dependent on the profile of RBA's tightening cycle.
Westpac expects RBA to opt for a fourth successive rate hike on August 2, and a third success time by 50bps. The current cycle is the first time cash rate has been lifted by 50bps or higher since 1990.