Sample Category Title
Canadian Inflation Moves Higher in June
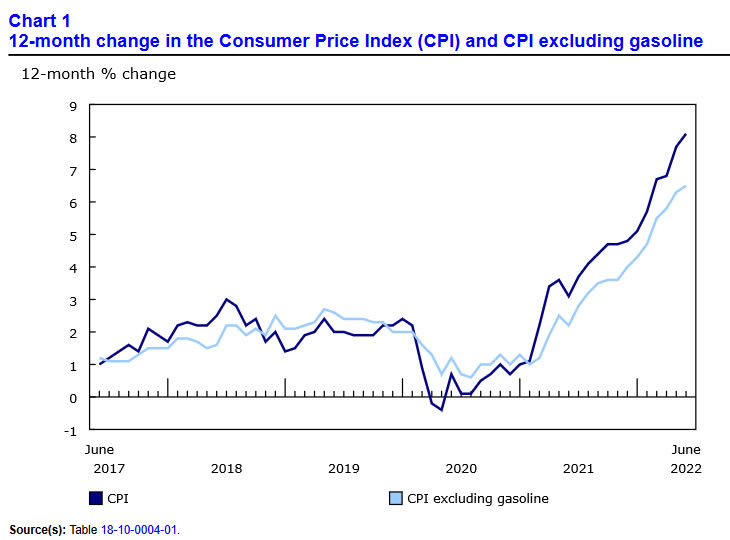
Consumer price inflation increased to 8.1% year-on-year (y/y) in June, up from 7.7% in May.
Gas prices were a main driver, with prices rising 6.2% month-on-month (m/m). Statistics Canada noted that "gas prices largely followed crude oil prices, which peaked in the first week of June with higher global demand amid the easing of COVID-19 public health restrictions in China."
Car prices also contributed to the increase, rising 1.5% m/m, "as prices for new vehicles (+1.6%) and used vehicles (+1.3%) increased. Month over month, prices for new vehicles rose at a faster pace than the 0.1% increase in May, due, in part, to the higher availability of new model-year vehicles."
Shelter saw a deceleration in price growth, up 4.5% m/m annualized (down from 8.5% last month). Lower commissions from real estate transactions and homeowners' replacement cost contributed to this.
Seasonally adjusted, month-on-month prices were up 0.6% following a 1.1% gain in May. Excluding food and energy, the index was up 0.35%, slowing from 0.64% in May.
All three of the Bank of Canada's core inflation metrics held steady in June. CPI-trim rose 0.1 percentage points (pps) to 5.5%, CPI-common by 0.1 pps to 4.6%, and CPI-median was flat at 4.9%.
Key Implications
High inflation continues to be the biggest risk to the economic outlook. Though the rise in the yearly rate of inflation is going to grab headlines, there was a meaningful deceleration in the monthly numbers, with most categories showing less monthly price pressure. Looking forward, we hope to see a continued deceleration in the monthly numbers, as gas prices are set to be a significant downward force in the July print. Even still, this should keep the year-on-year numbers uncomfortably elevated through 2022.
The Bank of Canada (BoC) is set to continue hiking its policy rate at an aggressive clip when it meets again in September. Markets are expecting upwards of 75 basis points from the BoC at its next meeting and see the policy rate ending the year between 3.5% and 3.75%. This has the Canada 10-year maintaining its support around 3% and CAD holding in at 77 U.S. cents.
Canada CPI accelerated ot 8.1% yoy, 7 of 9 major components up 3% or more
Canada CPI accelerated from 7.7% yoy to 8.1% yoy in June, missing expectation of 8.8% yoy. Excluding gasoline, CPI accelerated from 6.3% yoy to 6.5% yoy. That's still the highest level since January 1983. Statistics Canada said the acceleration was mainly due to higher prices for gasoline, however, price increases remained broad-based with seven of eight major components rising by 3% or more.
CPI common rose from 4.5% yoy to 4.6% yoy, above expectation of 4.2% yoy. CPI median was unchanged at 4.9% yoy, below expectation of 5.1% yoy. CPI trimmed was unchanged at 5.5% yoy, below expectation of 5.6% yoy.
Gold Missed the Latest Rally, But Prepares for a Notable Reversal
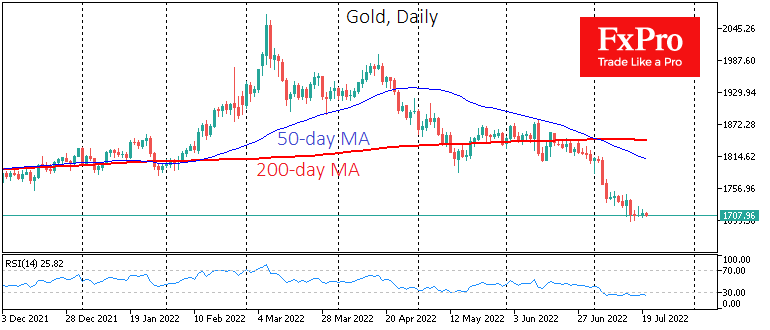
Gold is mostly missing the latest party of financial markets, where risk appetite has increased. The value of the troy ounce has changed little since last Friday, mostly hovering in a narrow range of $1702-1716, near the lows since April 2021.
On the technical analysis side, gold is oversold on the daily charts, as RSI has been below the 30 mark for the past two weeks. This disposition creates an impressive potential for a bounce, following the example of the stock and cryptocurrency markets, as we have seen in recent days.
Interestingly, gold investors seem to have forgotten about the long-term correlations and are in no hurry to ramp up their precious metal purchases. For investors in such circumstances, it is crucial to understand where the more reliable signals are now: is gold’s apathy justified or the optimism of stock and cryptocurrency buyers?
A correction of more than 17% from historical highs makes gold an attractive investment at current levels. However, short-term speculators maintain a wait-and-see attitude.
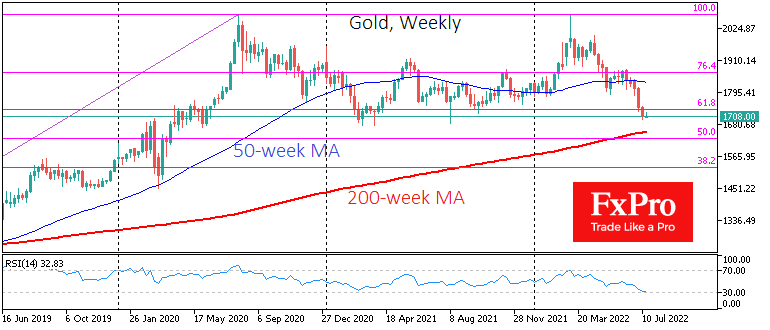
Gold needs to undergo a final capitulation for an apparent reversal to the upside. That could be a touch of the 200-week moving average, which now passes through $1652 and almost coincides with the local retracement lows set in early 2021.
The logic behind the gold sellers is now quite clear: Central banks are sharply tightening monetary policy, rising bond yields, and taking control of long-term inflationary expectations. However, it is also worth remembering that gold’s bearish cycle after the global financial crisis ended on the day that the Fed raised rates for the first time in that cycle.
In the current environment, signals from leading central bankers regarding measures and interest rate levels they believe are sufficient to control inflation could kick-start a rise in gold.
Signs next week that the Fed is already thinking about where it stops in its current rate hike cycle could loosen the bears’ grip on gold and stop the flow from it into bonds.
After all, central bankers must realise that because of the huge debt burden and chronic fiscal deficits, the economy is now prepared to endure much lower rates than it did in the early 1980s. And that forms a very bullish environment for precious metals. It should not be forgotten that emerging market central banks are now probably placing more emphasis on gold reserves than on dollars and euros.
All the above means that gold investors are not yet in a hurry to win back the market ripples but are preparing for a notable and sustained upward reversal, which could start in the next two months.
USD/JPY: Hammer Candle Suggest that Correction Might be Over
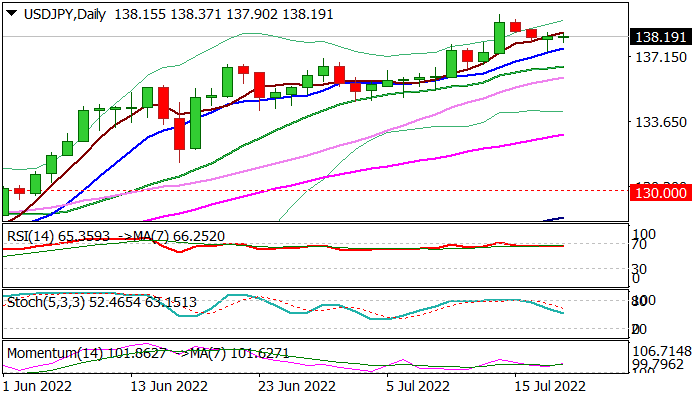
The USDJPY is gaining traction on Wednesday as Tuesday’s hammer candle, left after rising daily Tenkan-sen (137.36) contained dips, signaling that pullback from new 24-year high (139.39) might be over.
Fresh bullish momentum on daily chart adds to overall positive technical studies and support the action, which looks for renewed attempt at recent top at 139.39 and extension towards targets at 139.92/140.00 (Sep 1998 high/psychological).
Near-term bias is expected to remain firmly with bulls while the action holds above daily Tenkan-sen, as traders await Fed policy meeting next week and expect dollar to receive fresh boost from rate hike.
Res: 138.38; 138.57; 139.12; 139.92.
Sup: 137.90; 137.36; 136.41; 135.98.
Pound Yawns as Inflation Climbs
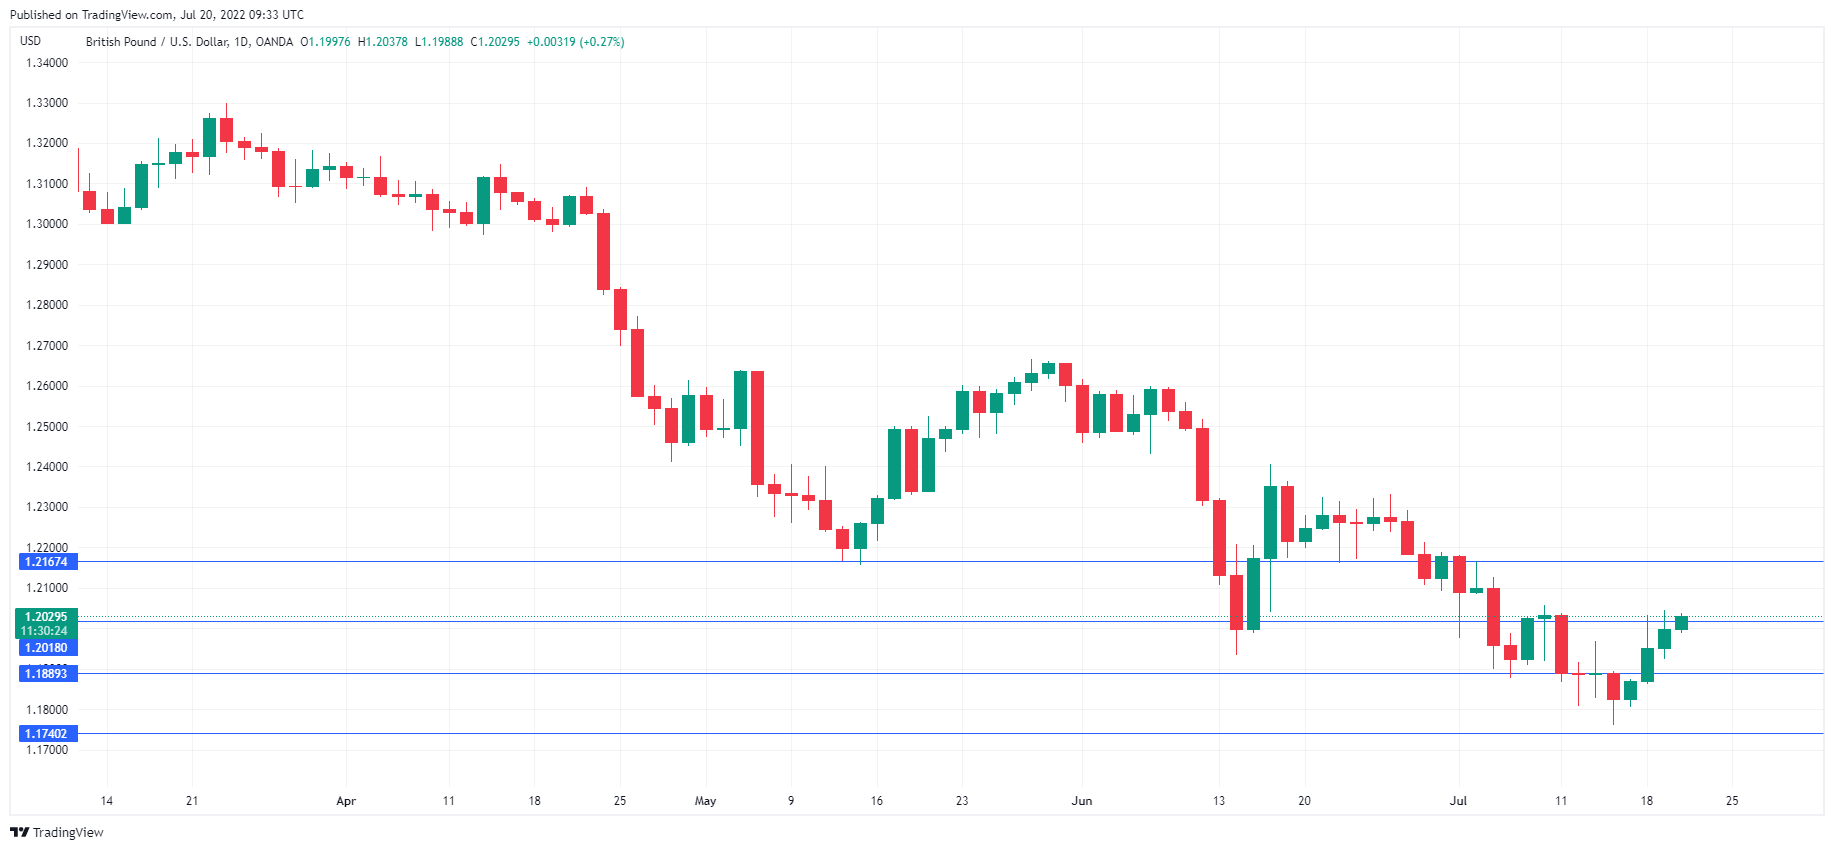
The British pound is almost unchanged today, as GBP/USD trades at the 1.2000 line.
UK inflation hits new 40-year high
UK inflation rose in June to its highest level since 1982, as the cost-of-living crisis has moved from bad to worse. Headline CPI hit 9.4% YoY, up from 9.1% in May and a notch above the consensus forecast of 9.3%. Core CPI dipped from 5.9% to 5.8%, matching the forecast.
The UK employment report yesterday was stronger than expected, and together with the sizzling inflation numbers, there is strong pressure on the BoE to accelerate rate hikes. A strong labor market means that the economy should be able to withstand higher rate increases – the BoE has been ultra-cautious, raising rates a mere 0.25% five consecutive times. Clearly, that extent of rate tightening won’t be enough to make a dent in inflation, which is approaching 10%. BoE Governor Bailey hinted in a speech yesterday that a 0.50% salvo was on the table at the August meeting.
The BoE has essentially thrown in the towel in the fight against inflation, hoping that the elusive inflation peak will appear sometime later this year. The Bank expects inflation to hit 11% before easing lower. Wage growth declined sharply in the three months to May to 6.2%, down from 6.8%. With inflation rising and wage growth falling, consumers are getting hammered and the risk of a recession is high. Still, as far as the BoE is concerned, inflation remains enemy number one, and a recession is a price the central bank is willing to pay in order to reel in runaway inflation. The BoE has weathered a lot of criticism over its handling of inflation, and a 0.50% increase at the August meeting would help restore some credibility and show that the Bank is determined to stamp out inflation.
GBP/USD Technical
- GBP/USD continues to test resistance at 1.2018. Above, there is resistance at 1.2167
- There is support at 1.1889 and 1.1740
GBP/USD Pair is Now Consolidating Gains from $1.2045
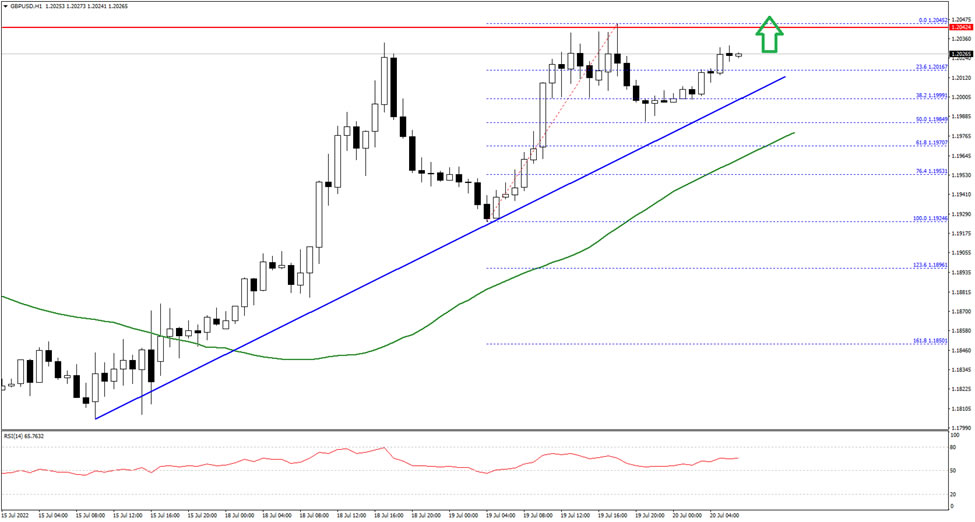
The British Pound started a decent recovery wave from the 1.1820 zone against the US Dollar. The GBP/USD pair climbed above the 1.1950 resistance to move into a positive zone.
The pair even climbed above the 1.2000 barrier and the 50 hourly simple moving average. A high was formed near 1.2045 and the pair is now consolidating gains. An immediate resistance is near the 1.2040 level.
The first major resistance sits near the 1.2050 zone. If there is a clear upside break above the 1.2050 resistance, the pair could rise steadily towards the 1.2120 level in the near term.
On the downside, an initial support is near the 1.2010 level and a connecting bullish trend line on the hourly chart. The main support is forming near 1.1980 on FXOpen. A break below the 1.1980 support could even push the pair below the 1.1900 support.
EUR/USD With a Bullish Price Action ahead of ECB
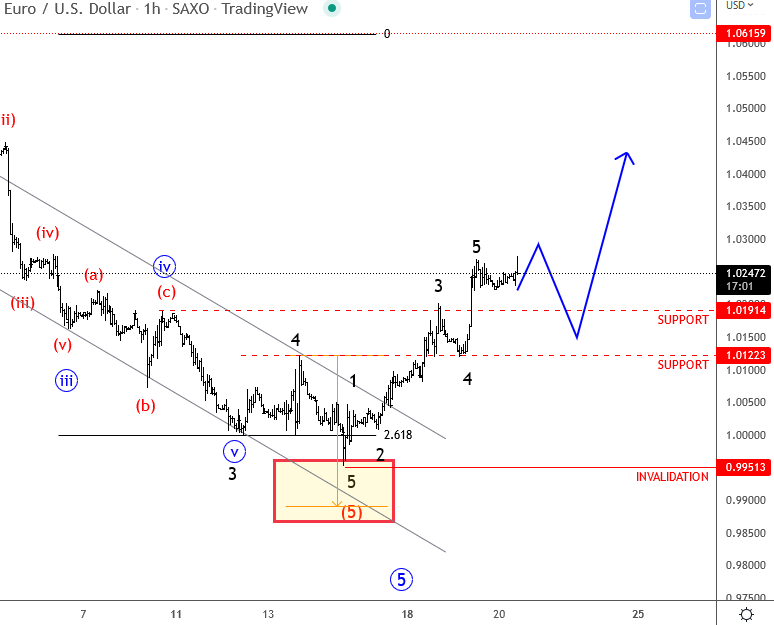
The sell-off of the USD resumed yesterday as stocks found support with a "turnaround Tuesday" price action. We see commodity currencies very strong across the board, with room for further gains after retracement. However, EUR will be under the spotlight this week because of ECB situation and also because of Nord Stream. Putin said if the turbine return is delayed, the volume of the Nord Stream will drop and this can cause some serious issues in Europe. Technically however, the EURUS appears to be turning bullish as rising out of a downward channel is in five waves, so be aware of more gains after the retracement. Support is at 1.01-1.012. If ECB will hike more than 0.25bp then we think EURUSD is going to see much more upside.
GBP/JPY Daily Outlook
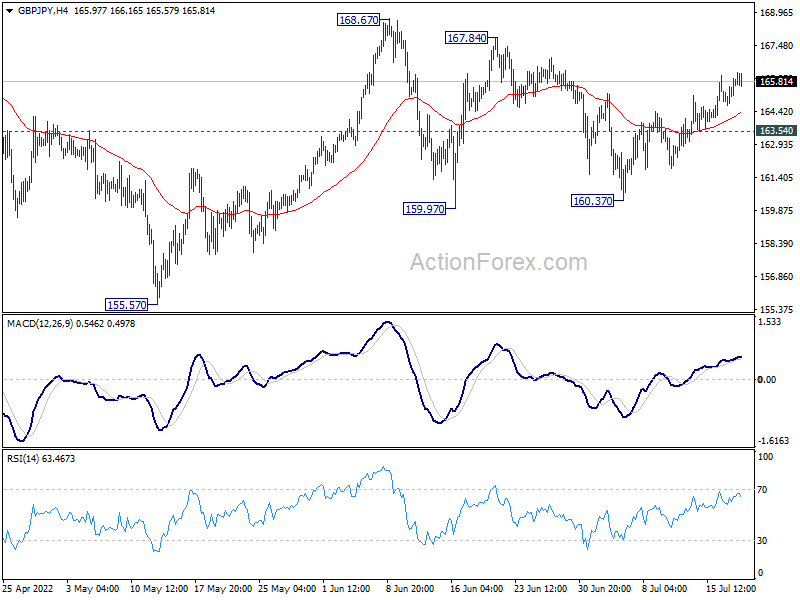
Daily Pivots: (S1) 164.16; (P) 165.13; (R1) 166.08; More...
Intraday bias in GBP/JPY remains on the upside for the moment. Consolidation from 168.67 should have completed with three waves to 160.37. Further rally should be seen to retest 168.67 high. Firm break there will resume larger up trend. On the downside, below 163.54 minor support will dampen this bullish view and turn bias back to the downside for 160.37 support instead.
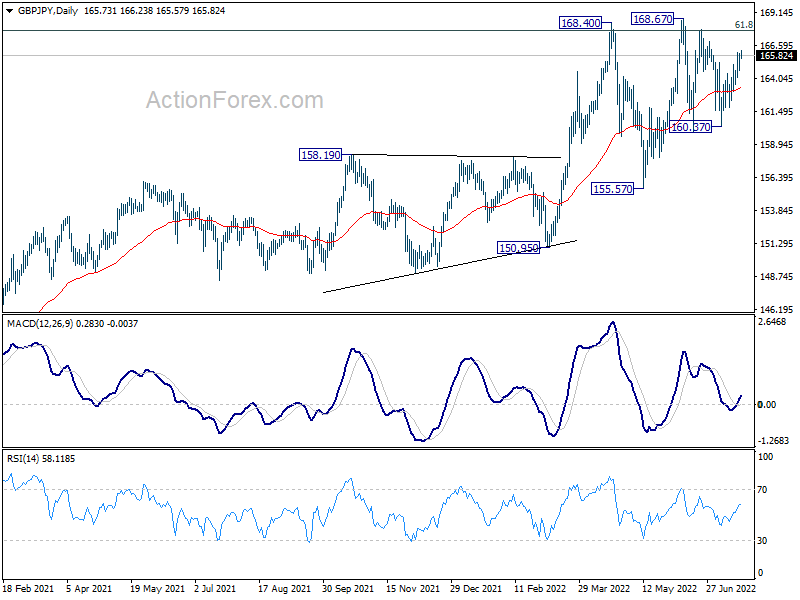
In the bigger picture, up trend from 123.94 (2020 low) is still in progress. Sustained break of 61.8% retracement of 195.86 (2015 high) to 122.75 (2016 low) at 167.93 will be a long term bullish signal, and could pave the way back to 195.86 high. This will now remain the favored case as long as 155.57 support holds, even in case of deep pull back.
EUR/JPY Daily Outlook
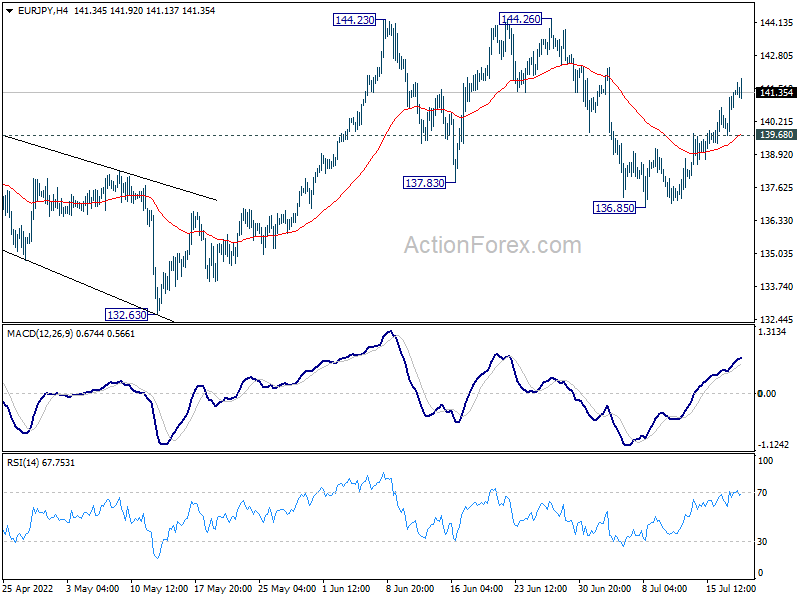
Daily Pivots: (S1) 140.20; (P) 140.82; (R1) 141.95; More....
Intraday bias sin EUR/JPY remain son the upside for the moment. Consolidation pattern from 144.23 should have completed with three waves to 136.85. Further rally should be seen to retest 144.26 resistance first. Firm break there will resume larger up trend. On the downside, below 139.68 minor support will dampen this bullish view and bring retest of 136.85 instead.
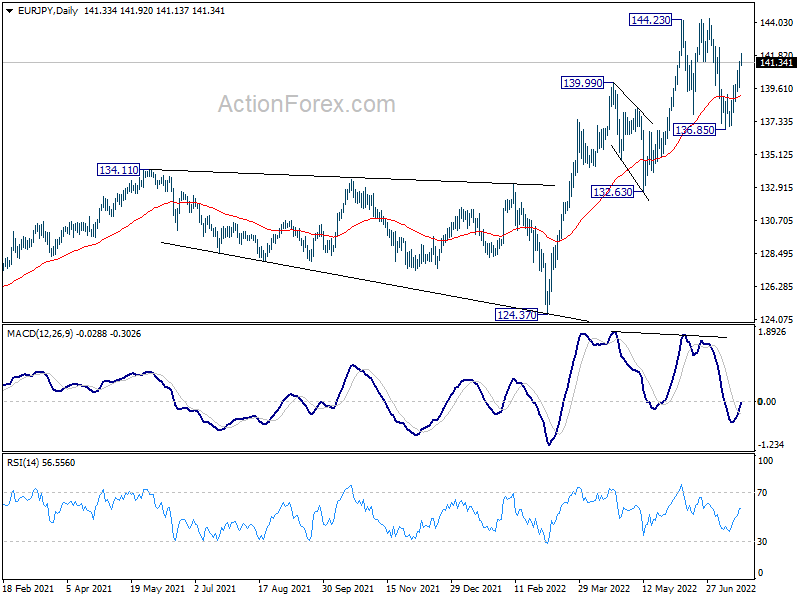
In the bigger picture, up trend from 114.42 (2020 low) is seen as the third leg of the pattern from 109.30 (2016 low). Further rally is in favor as long as 134.11 resistance turned support holds, even in case of deep pull back. Firm break of 139.78 will target 149.76 (2015 high. However, sustained break of 134.11 will be a sign of medium term bearish reversal and turn focus to 124.37 support for confirmation.
EUR/GBP Daily Outlook
Daily Pivots: (S1) 0.8487; (P) 0.8513; (R1) 0.8550; More...
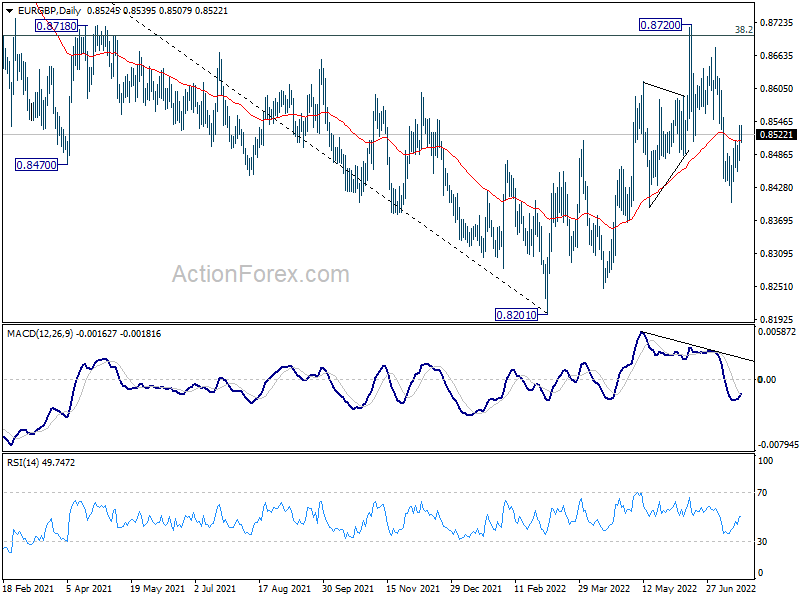
Intraday bias in EUR/GBP stays neutral for the moment. On the upside break of 0.8552 resistance will suggest that pull back from 0.8720 has completed. That will also also revive near term bullishness. Further rise should be seen to retest 0.8720 high. On the downside, break of 0.8401 will reaffirm rejection by 0.8697 medium term fibonacci level and target 0.8201/48 support zone next.

In the bigger picture, rejection by 38.2% retracement of 0.9499 to 0.8201 at 0.8697 argues that rebound from 0.8201 is merely a corrective move. That is, down trend from 0.9499 (2020 high) is now over. Sustained break of 0.8201 will resume such decline and target 61.8% retracement of 0.6935 to 0.9499 at 0.7917. This will now remain the favored case as long as 0.8720 resistance holds.