Sample Category Title
Oil Clings to Last Support at 200-day MA
Crude Oil has added 3% on Monday after finding support late last week as expectations of a meeting between the US and Saudi leaders did not materialise.
The much-anticipated and much-discussed meeting between Biden and Mohammed bin Salman took place without a joint press conference or formally announced agreements. The Saudis made it clear that the OPEC+ act is good and refused officially to commit to ramping up production despite US interest.
Over the weekend, there were also comments that Saudi Arabia has the potential to increase production to 13m BPD against the current 10m and a peak of 11m in March 2020, but reaching these levels is unsustainable due to underinvestment in the industry.
Weekly rotary rig counts from Baker Hughes point to a further gradual increase in activity in the US to 756 (+4 for the week) total, of which 599 (+2) are oil producers.
Saudi Arabia has ramped up investments in renewable energy, a strategy also followed by major US and UK producers. Because of international sanctions, Russia, Iran, and Venezuela are severely constrained in increasing their production.
OPEC+ seems to do well its homework after past episodes of the “oil wars” of late 2014 and the start of 2020, not wanting to make any sudden moves. Locally, this is positive news for the oil price, which received support on the downside.
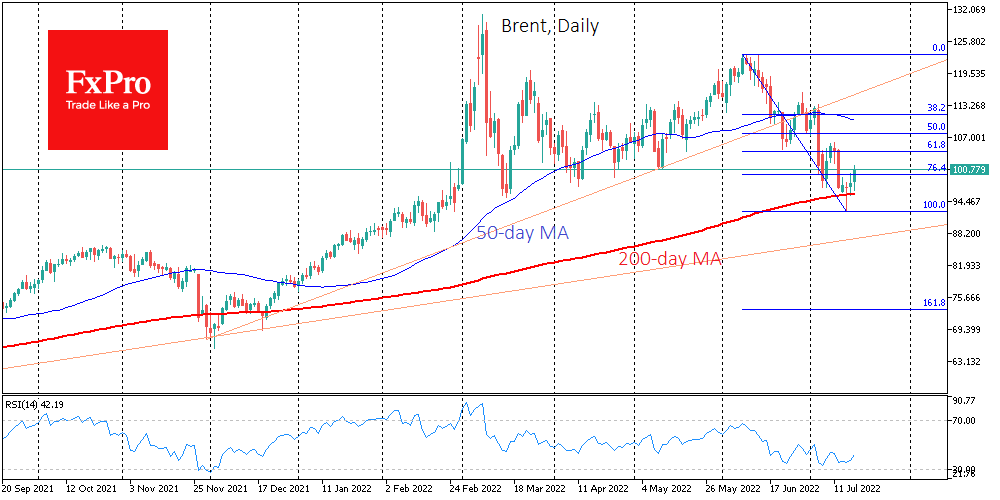
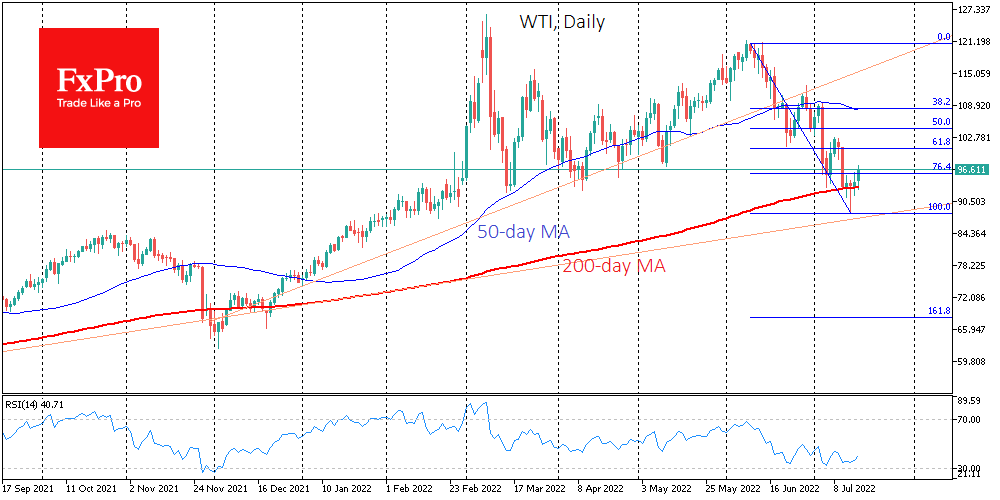
On the technical analysis side, buying support has strengthened on the downside to the 200-day moving average in WTI. Since last Tuesday, intraday downside punctures have intensified buying, and Oil has been closing the day above this significant line that defines the long-term trend.
Brent is now trading above $100, also attempting to move upward from the 200-day moving average.
We may see a serious attempt by the oil bulls to stay within the long-term bullish trend. We would only be able to say that they succeeded in the case of a strong growth above $105 for Brent and $101 for WTI. In that case, a bounce from the latter trend will exceed 61.8% Fibonacci and send Oil into the area above the previous local highs.
However, waning economic activity, with a trend of rising production and interest rates, make the scenario of further declines in Oil the main one to consider.
GBP/USD Outlook: Bears Pausing But Recovery Likely to Be Limited
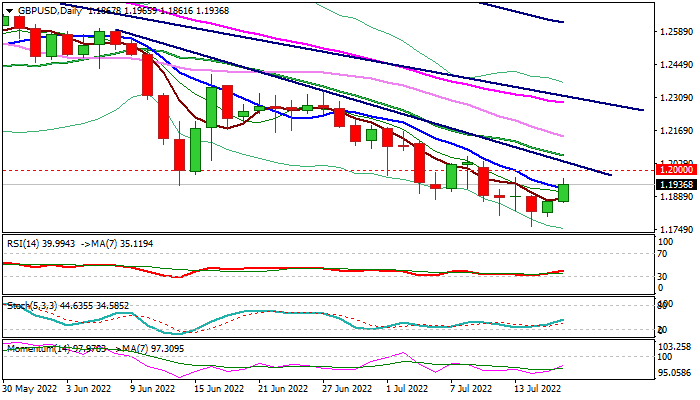
Cable regained traction and accelerated higher in early Monday trading, on revived risk sentiment after US policymakers cooled down expectations for Fed’s jumbo 1% rate hike in late July policy meeting that was speculated last week after the last report showed that US inflation continued to rise.
Recovery is unlikely to pick up as overall picture is negative, with fragile political situation and darkened economic conditions and outlook, leaving a little space for optimism.
Broken psychological 1.20 support reverted to solid barrier which should ideally cap, with extended upticks to stall under 1.2080 (broken Fibo 76.4% of 1.1409/1.4349 / daily Kijun-sen) and keep larger bearish structure intact.
Last week’s close below 1.20 level (for the first time since mid-March 2020) generated strong bearish signal and added to negative technical studies, which point to increased risk of fresh bearish acceleration towards 2020 pandemic lows.
Only sustained break above 1.2080 pivot would sideline larger bears and allow for stronger correction.
Trades focus on UK labor data on Tuesday and June inflation report on Wednesday, for fresh signals.
Res: 1.2000; 1.2055; 1.2083; 1.2125.
Sup: 1.1861; 1.1804; 1.1760; 1.1700.
AUD/USD Pair is Now Correcting Gains from $0.6818
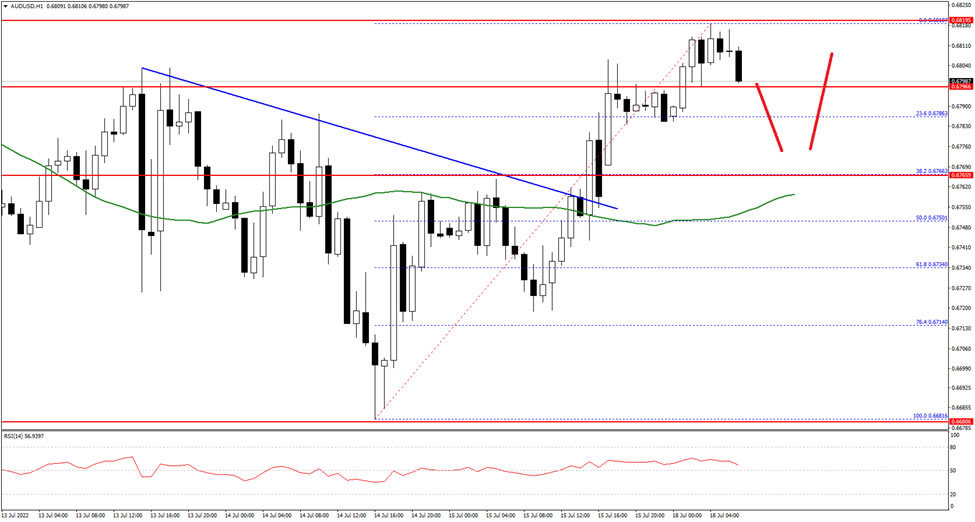
The Aussie Dollar started a decent recovery zone from the 0.6680 zone against the US Dollar. The AUD/USD pair was able to move above the 0.6750 resistance zone.
There was a clear move above a key bearish trend line with resistance near 0.6755 on the hourly chart. It traded as high as 0.6818 and settled above the 50 hourly simple moving average. It is now correcting gains, with an immediate support at 0.6795 on FXOpen.
The next key support is near the 0.6770 level. A downside break below the 0.6770 support could lead the pair towards the 0.6720 support.
An immediate resistance on the upside is near the 0.6820 level. If there is an upside break above the 0.6820 level, the pair could rise steadily towards the 0.6850 level in the near term. Any more gains could send the pair towards 0.6900.
Blockchain Projects are Pulling the Crypto Market Up
Bitcoin formally closed last week lower, ending it near $21,100. At the time of writing, the upside momentum has built up, taking the price to 21,800, the upper end of last month’s consolidation range.
Ethereum jumped 14.1% last week and is adding another 6.7% since the start of the day on Monday, rising to $1430. Finding itself one step ahead of BTC this time, ETH broke the upper bound of last month’s trading range on Friday. The second cryptocurrency’s steady rise underscores the heightened demand for risk among crypto enthusiasts.
Leading altcoins have gained in the last 24 hours, ranging from 1.8% (Dogecoin) to 16% (Polygon).
The total capitalisation of the crypto market, according to CoinMarketCap, rose 9.5% over the week to $998bn. Bitcoin’s dominance index fell by 1.1 percentage points to 41.7% over the same period.
The Crypto Fear-and-Greed Index was unchanged for the week, returning after falling to 24 points (extreme fear). By Monday, the index was down to 20, but recent market dynamics suggest the market is set to leave “extreme fear” territory.
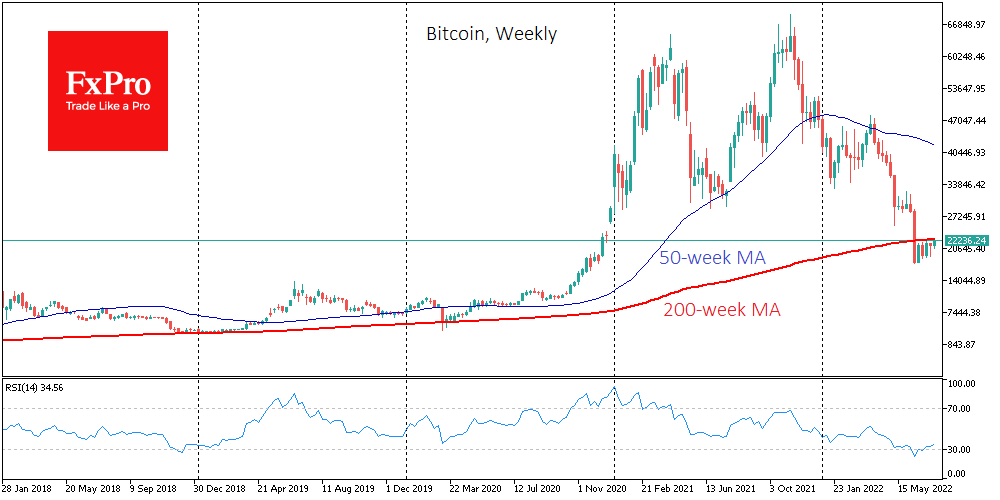
Bitcoin rebounded in the second half of the week from all its early declines. BTC has been consolidating below its 200-week moving average for almost a month, now running around $22,550. The first cryptocurrency cannot yet move significantly away from the $20,000 level (the high of the previous cycle). Optimists can look for a sequence of higher local lows over the past four weeks.
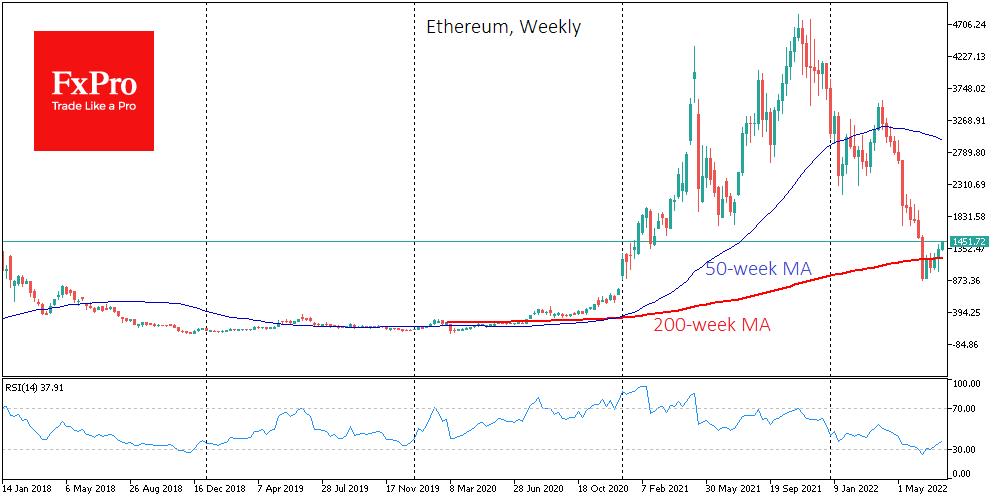
Ethereum showed notable gains after ETH developers approved the blockchain migration to PoS for September 19, 2022. Ethereum broke above its 200-week average late last week, which could spur early buyers to trade on technical signals.
And we also draw attention to increased investor interest in blockchain networks, as seen in the outperformance of Ethereum, Solana, Polygon, and Avalanche during the past week. In parallel, the NFT market continues to fade. This can be described as investors betting on long-term projects instead of collecting short-term speculation.
Bloomberg draws attention to the weakening correlation between bitcoin and US stock indices, which has fallen to its lowest levels since January. If BTC’s dependence on the stock market weakens in the coming weeks, the expert community will discuss bitcoin as “digital gold” again.
According to CryptoCompare, cryptocurrency spot trading volume fell to its lowest since June 2020. Fairlead Strategies estimates that the bearish phase of the market could drag on for several more months.
The UN has recommended that developing countries ban cryptocurrency advertising and require all cryptocurrency wallets and exchanges to register with regulators.
EURUSD Erases Losses after Hitting a Bottom at 0.9950
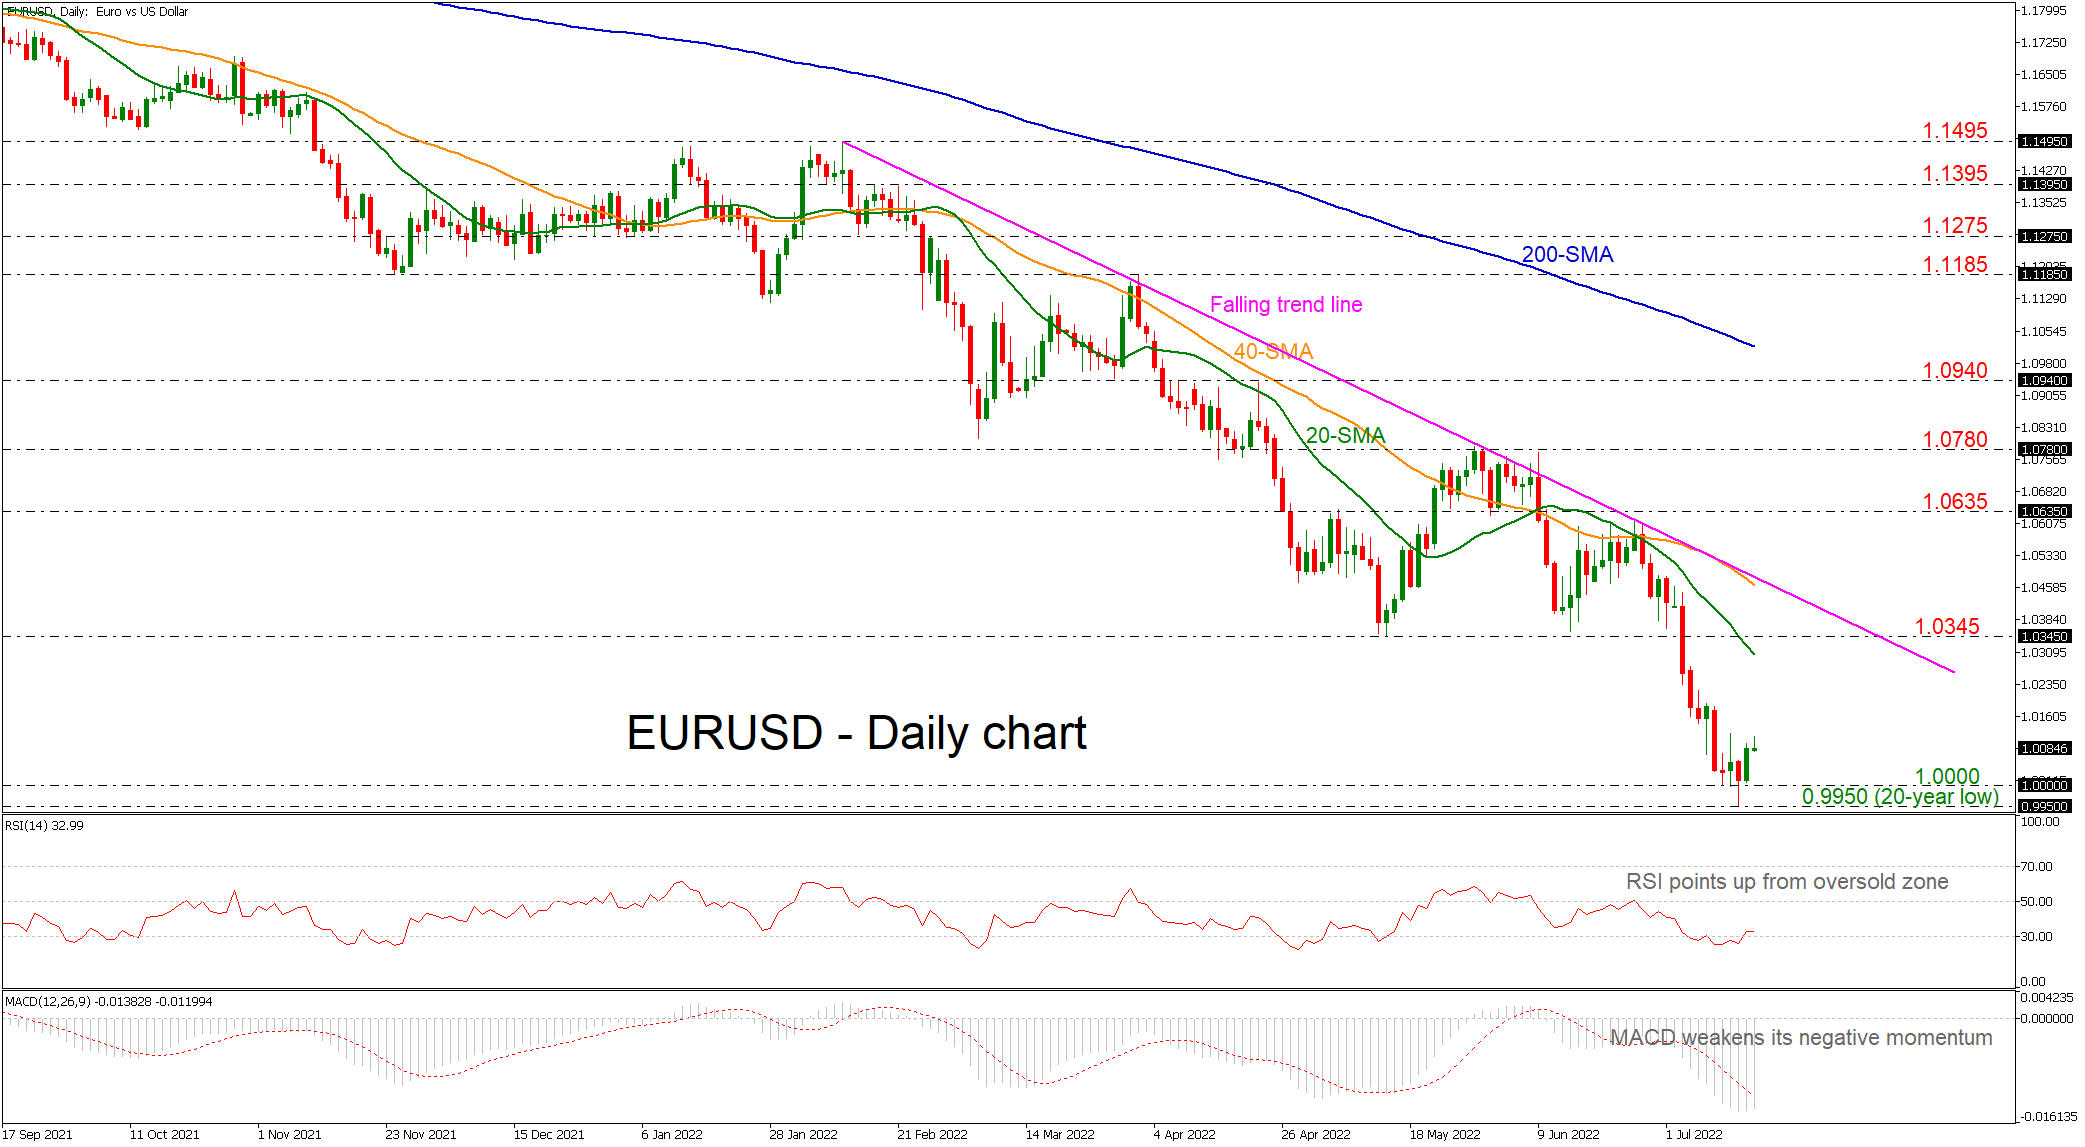
EURUSD is still failing to print a daily close below the parity level, despite the free fall towards the 20-year low of 0.9950 on Thursday. Chances for an upside reversal are increasing as the technical indicators are turning higher. The MACD is weakening its bearish movement, while the RSI jumped above the 30 level, suggesting an oversold market.
In case a rebound takes place, immediate resistance could come from the 20-day simple moving average (SMA) at 1.0300 ahead of the 1.0345 key level. Higher still, the 40-day SMA and the medium-term descending trend line could also restrict upside movements, though only a close above 1.0635 would confirm the start of a possible uptrend.
Alternatively, another step lower may reach a crucial support at 1.0000 again where the price stopped several times last week. Should this prove a weak obstacle this time, the sell-off could pick up speed until the 0.9950 bottom, where any violation would bring more pressure to the market. Specifically, the price could stretch further down to test the 0.9600 support, registered in August 2002.
In the medium-term picture the pair is still strongly bearish as long as it holds well below the falling trend line, and more importantly under the 200-day SMA, which is still falling.
Daily Technical Analysis
EUR/USD
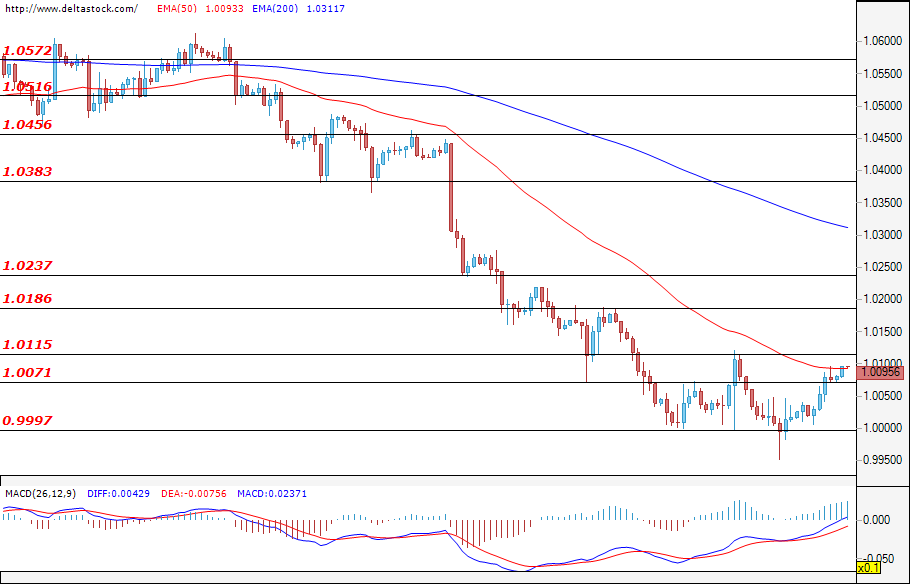
After the European common currency reached parity with the dollar once more, the psychological level withheld the bearish attack and the bulls took control. The pair breached the resistance at 1.0071, and during the early hours of today, the EUR/USD is heading for a test of the zone at 1.0115. If the buyers manage to remain in control and overcome the aforementioned zone, then the pair will most likely attack the resistance at 1.0186. However, only a violation of the resistance at 1.0237 could lead to a change in the current sentiment of market participants. In the more likely scenario, in which the bears prevail and again take the rate of the euro against the greenback below 1.0071, then the expectations are for a new attack on the major zone at 1.0000, marking the current upside move as corrective and could easily lead to future losses for the euro against the dollar. This week, traders will focus their attention on the European Central Bank interest rate decision (Thursday; 12:15 GMT) and the expected U.S. data on initial jobless claims, later on the same day at 12:30 GMT.
USD/JPY
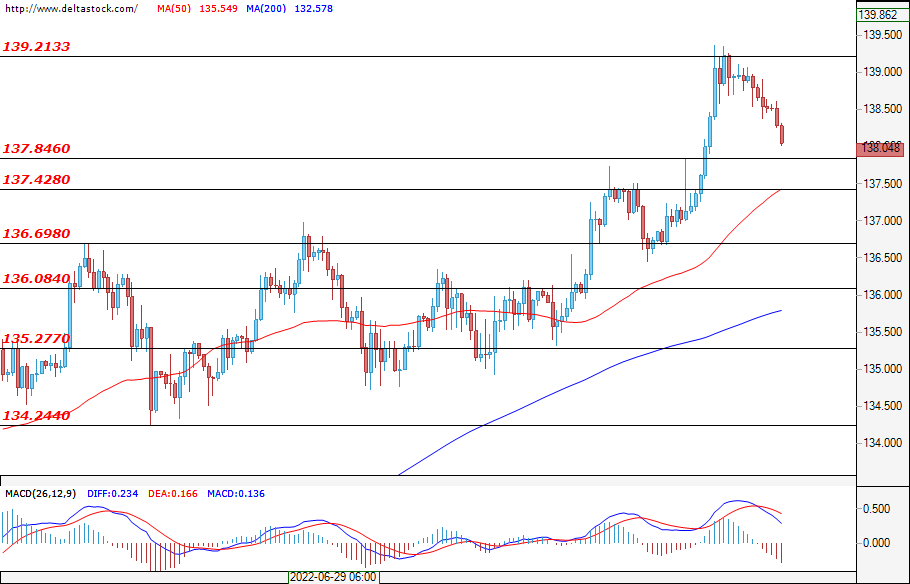
The bullish momentum faded and the rally was limited by the resistance at 139.21. The dollar erased some of its recent gains against the yen, and during the early hours of today`s trading, the pair is holding positions above the support at 137.84. А violation of this zone, followed by a breach of the one at 137.42, could encourage the bears to continue with their attack and could head the USD/JPY towards the major level at 136.69. If the buyers re-enter the market instead, then a new successful attack on the high at 139.21 could easily continue the rally for the Ninja towards the levels at around 140.00.
GBP/USD
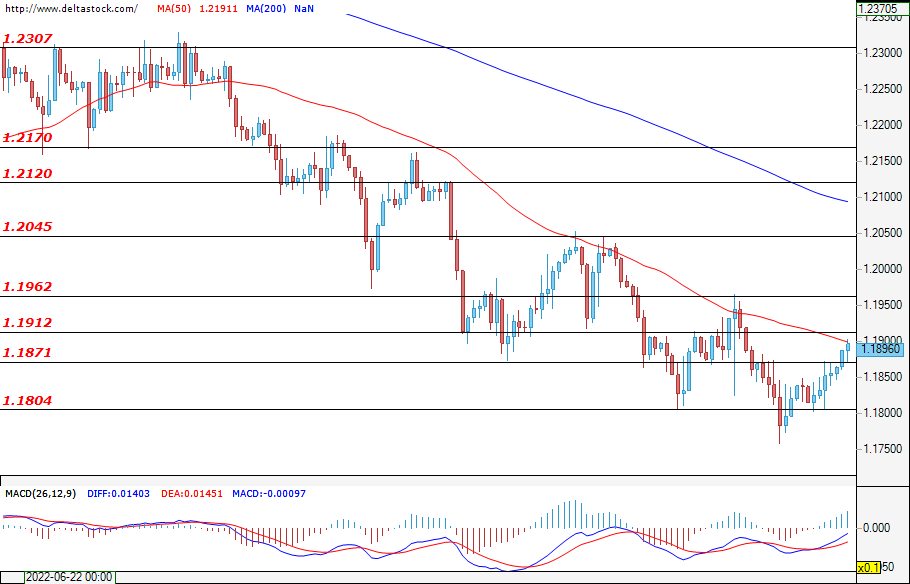
Last week, the sellers failed to breach the support at 1.1804 and the pound slightly appreciated against the dollar. The pair bounced back above the resistance zone at 1.1804, and at the time of writing the analysis, the price is headed for a test of the next level at 1.1912. Successful violation here could easily continue the recovery and could pave the way for an attempt at breaching the upper zone at 1.1962. If the bears take control, then their first target can be found at the level of 1.1871, which is now acting as support. A new successful attack on the lows at 1.1804 could deepen the sell-off and could strengthen the negative expectations for the future path of the Cable.
EUGERMANY40
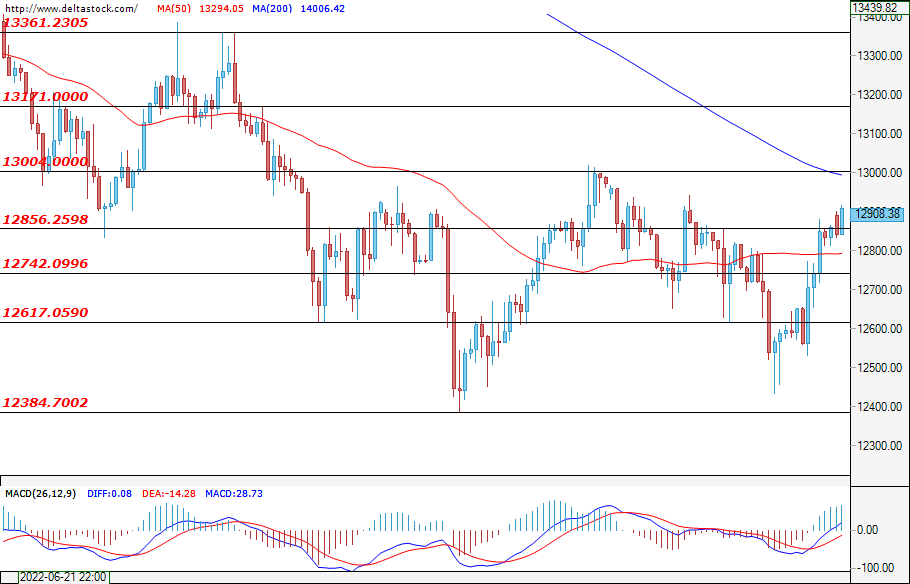
The German index recovered some of its recent losses and the price consolidated above the resistance zone at 12856. If the bulls manage to breach the psychological target at 13000, then the rally will most likely continue towards the local high at around 13171. If the bullish momentum fades instead and bears prevail, then a violation of the support at 12742, followed by a breach of the lower zone at 12617, could deepen the decline towards the important support at 12384.
US30
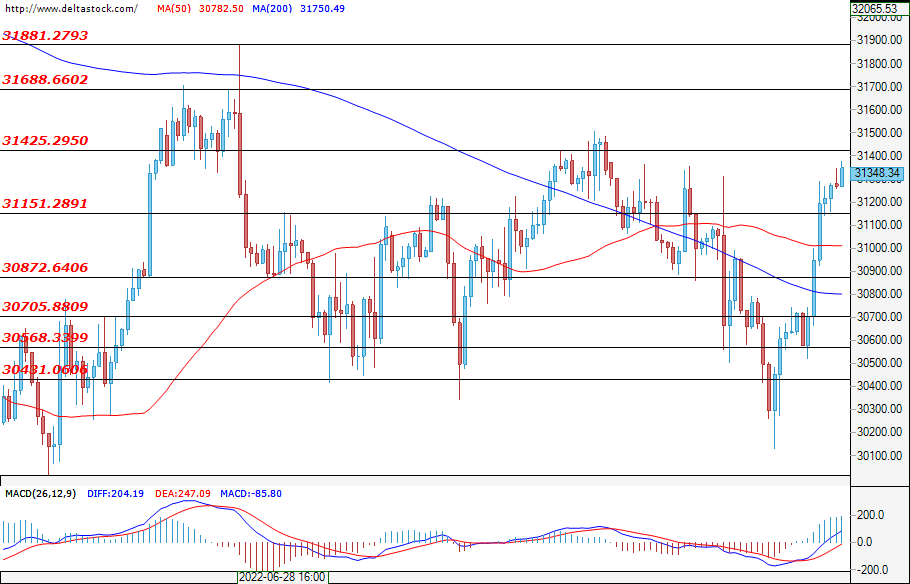
The positive sentiment from the end of last week remained intact, and after the breach of the resistance at 31151, the U.S. index is heading for a test of the next target at 31425. A violation of the mentioned zone could easily pave the way for an attempt at breaching the level at 31688 and could strengthen the positive expectations for the future path of the US30. The high volatility, expected around the announcement of the European Central Bank interest rate decision (Thursday; 12:15 GMT), and potential worse-than-expected U.S. jobless claims data later on this day at 12:30 GMT, could help bears prevail. Their first support can be found at 31151, followed by the lower zone at 30872.
Dow Jones Futures Rose Steady ahead of Goldman Sachs Earnings
US stocks rose sharply on Friday and in the futures market as investors focused on the ongoing earnings season. The Dow Jones, S&P 500, and Nasdaq 100 indices rose by more than 1% even as many companies warned about their profit margins. Some of the firms that warned about inflation are JP Morgan, Fastenal, and Delta Air Lines. According to FactSet, 7% of companies in the S&P 500 index have already published their Q2 reports. 60% of them have beaten analysts' expectations. Some of the top companies that will publish their results this week are IBM, Goldman Sachs, and Bank of America.
The price of crude oil rose slightly as investors reacted to the recent meeting between Joe Biden and Mohammed Salman of Saudi Arabia. According to Bloomberg, Saudi Arabia did not commit to increase production in a bid to lower prices. Instead, the kingdom committed to the strategy set by the OPEC+ cartel. In its most recent meeting, the cartel increased its supply increase quota by 643k barrels per day. Still, there are concerns about the refinery capacity of some countries.
The New Zealand dollar rose slightly after the latest consumer inflation data from the country. The data revealed that the headline consumer inflation rose from 6.9% in the first quarter to 7.2% in Q2. That was the highest increase in decades and was mostly caused by the soaring energy prices. The data came a few days after the Reserve Bank of New Zealand (RBNZ) decided to hike by 50 basis points. Looking ahead, the next key economic events to watch will be the latest monthly report by the German Central Bank.
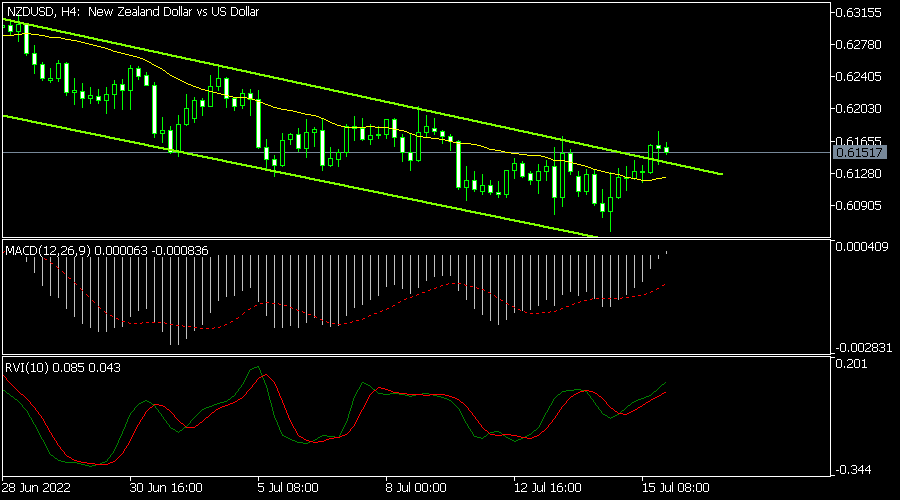
NZDUSD
The NZDUSD pair continued its recovery as investors reacted to the latest New Zealand inflation data. It rose to a high of 0.6172, which was the highest point since July 12th of this year. It moved above the descending channel shown in green. It has risen above the 25-day and 50-day moving averages while the MACD and the Relative Vigor Index (RVI) rose. It has also formed a small doji pattern. Therefore, the pair will likely start a bearish trend as sellers target the support at 0.6100.
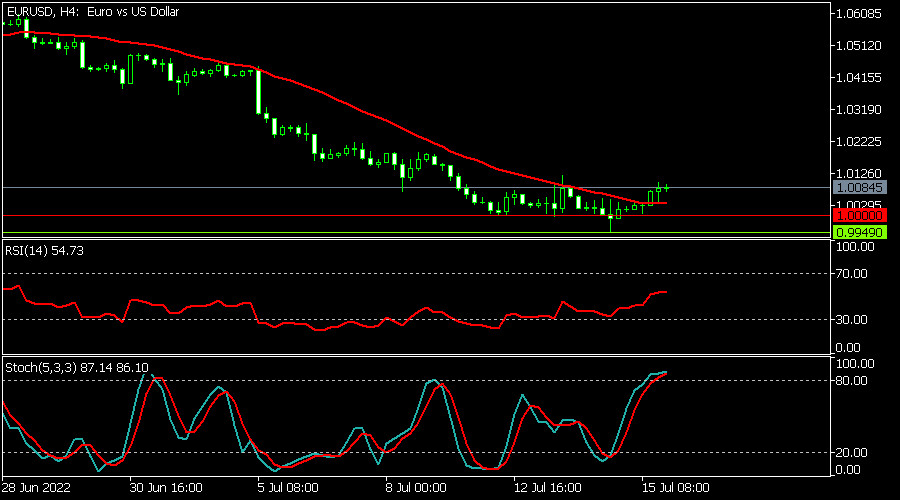
EURUSD
The EURUSD pair rose slightly on Monday morning as the dollar strength calmed. It is trading at 1.0084, slightly above last week’s low of 0.9950. The pair has moved slightly above the 25-day moving average. The Stochastic Oscillator has moved above the overbought level while the Relative Strength Index (RSI) has continued rising. The pair will likely keep rising as bulls target the key resistance at 1.0150.
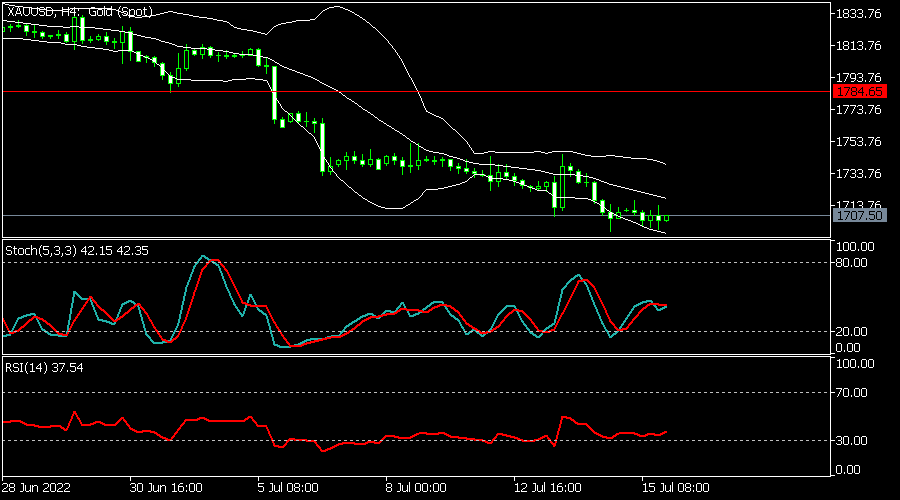
XAUUSD
The XAUUSD pair moved sideways on Monday morning. It is trading at 1,707, which was the lowest level in more than a year. On the four-hour chart, the pair is between the lower and midline line of the Bollinger Bands. The Stochastic Oscillator has moved to the neutral point while the Relative Strength Index (RSI) has moved slightly above the oversold level. Therefore, the pair will likely keep falling as bears target the support at 1650.
XAU/USD: Triple Zigzag Completion is Signal of Imminent Increase in Gold Prices
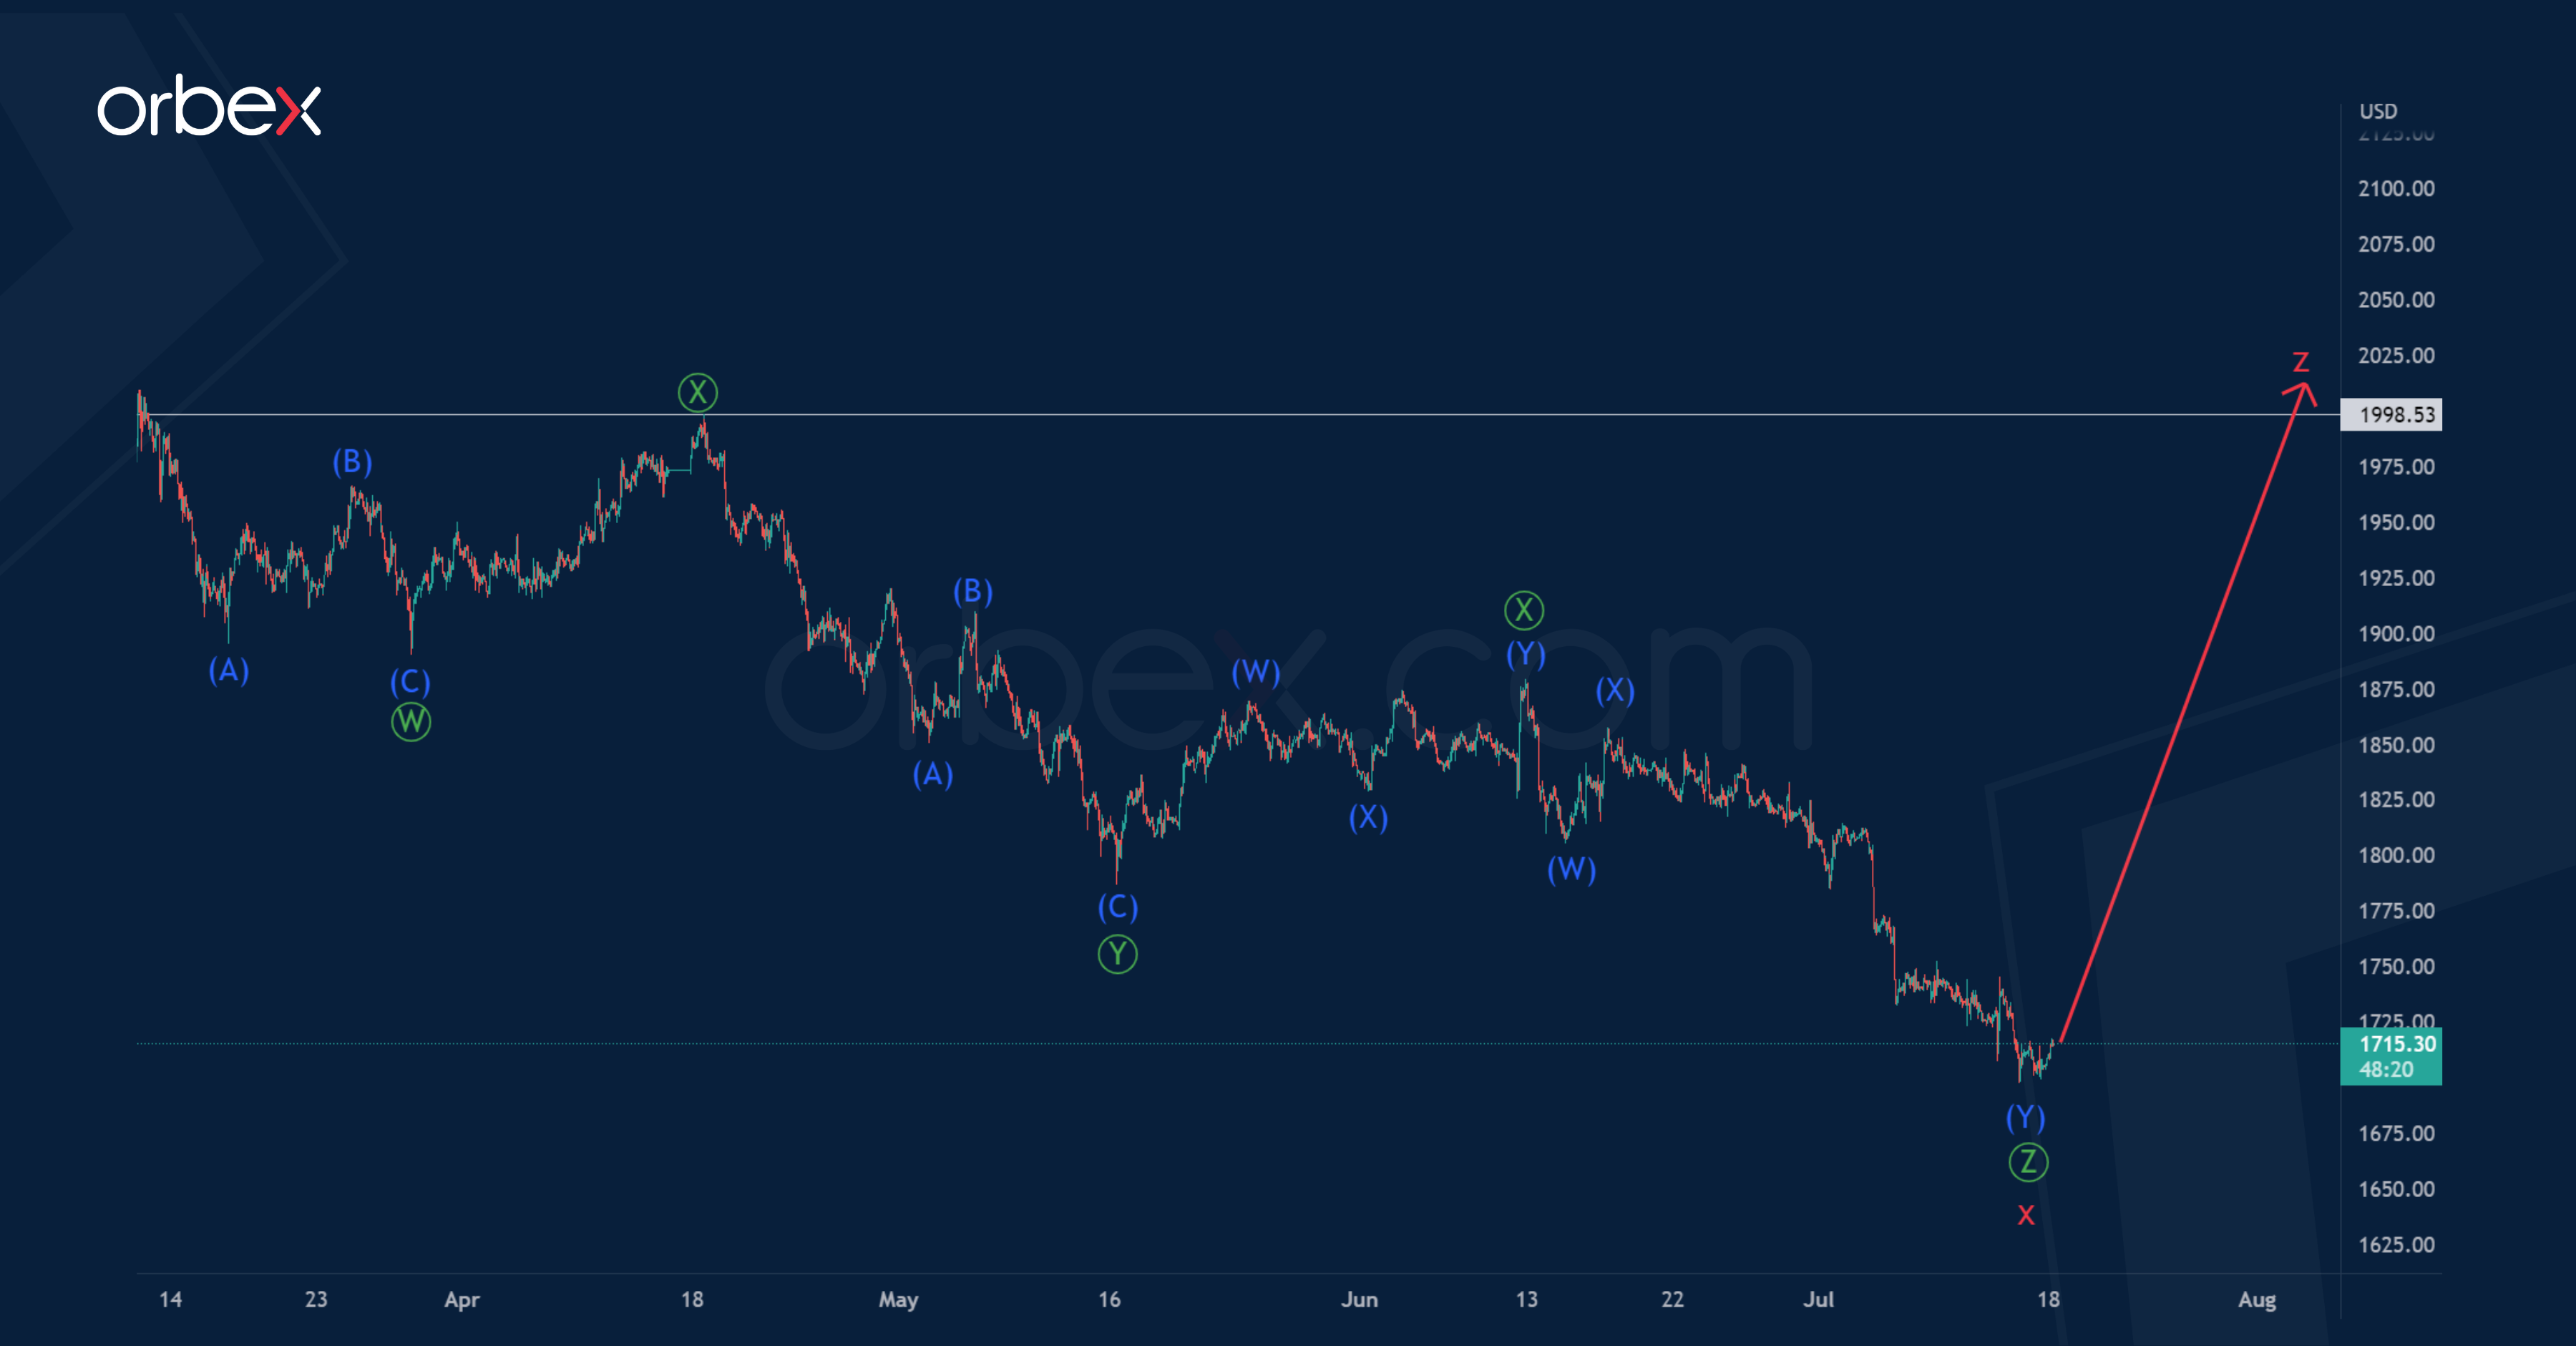
The XAUUSD formation hints at a global correction pattern that takes the form of a cycle triple zigzag.
The current chart shows the internal structure of the bearish cycle intervening wave x, which looks completed in the form of a primary triple zigzag.
Perhaps, after the completion of the cycle wave x, the market turned around and began to move up. That is, the construction of the initial part of the cycle wave z could begin. It can be any correctional model.
The price of gold in wave z may rise to the previous high of 1998.53, which was marked by the primary wave, or even higher.
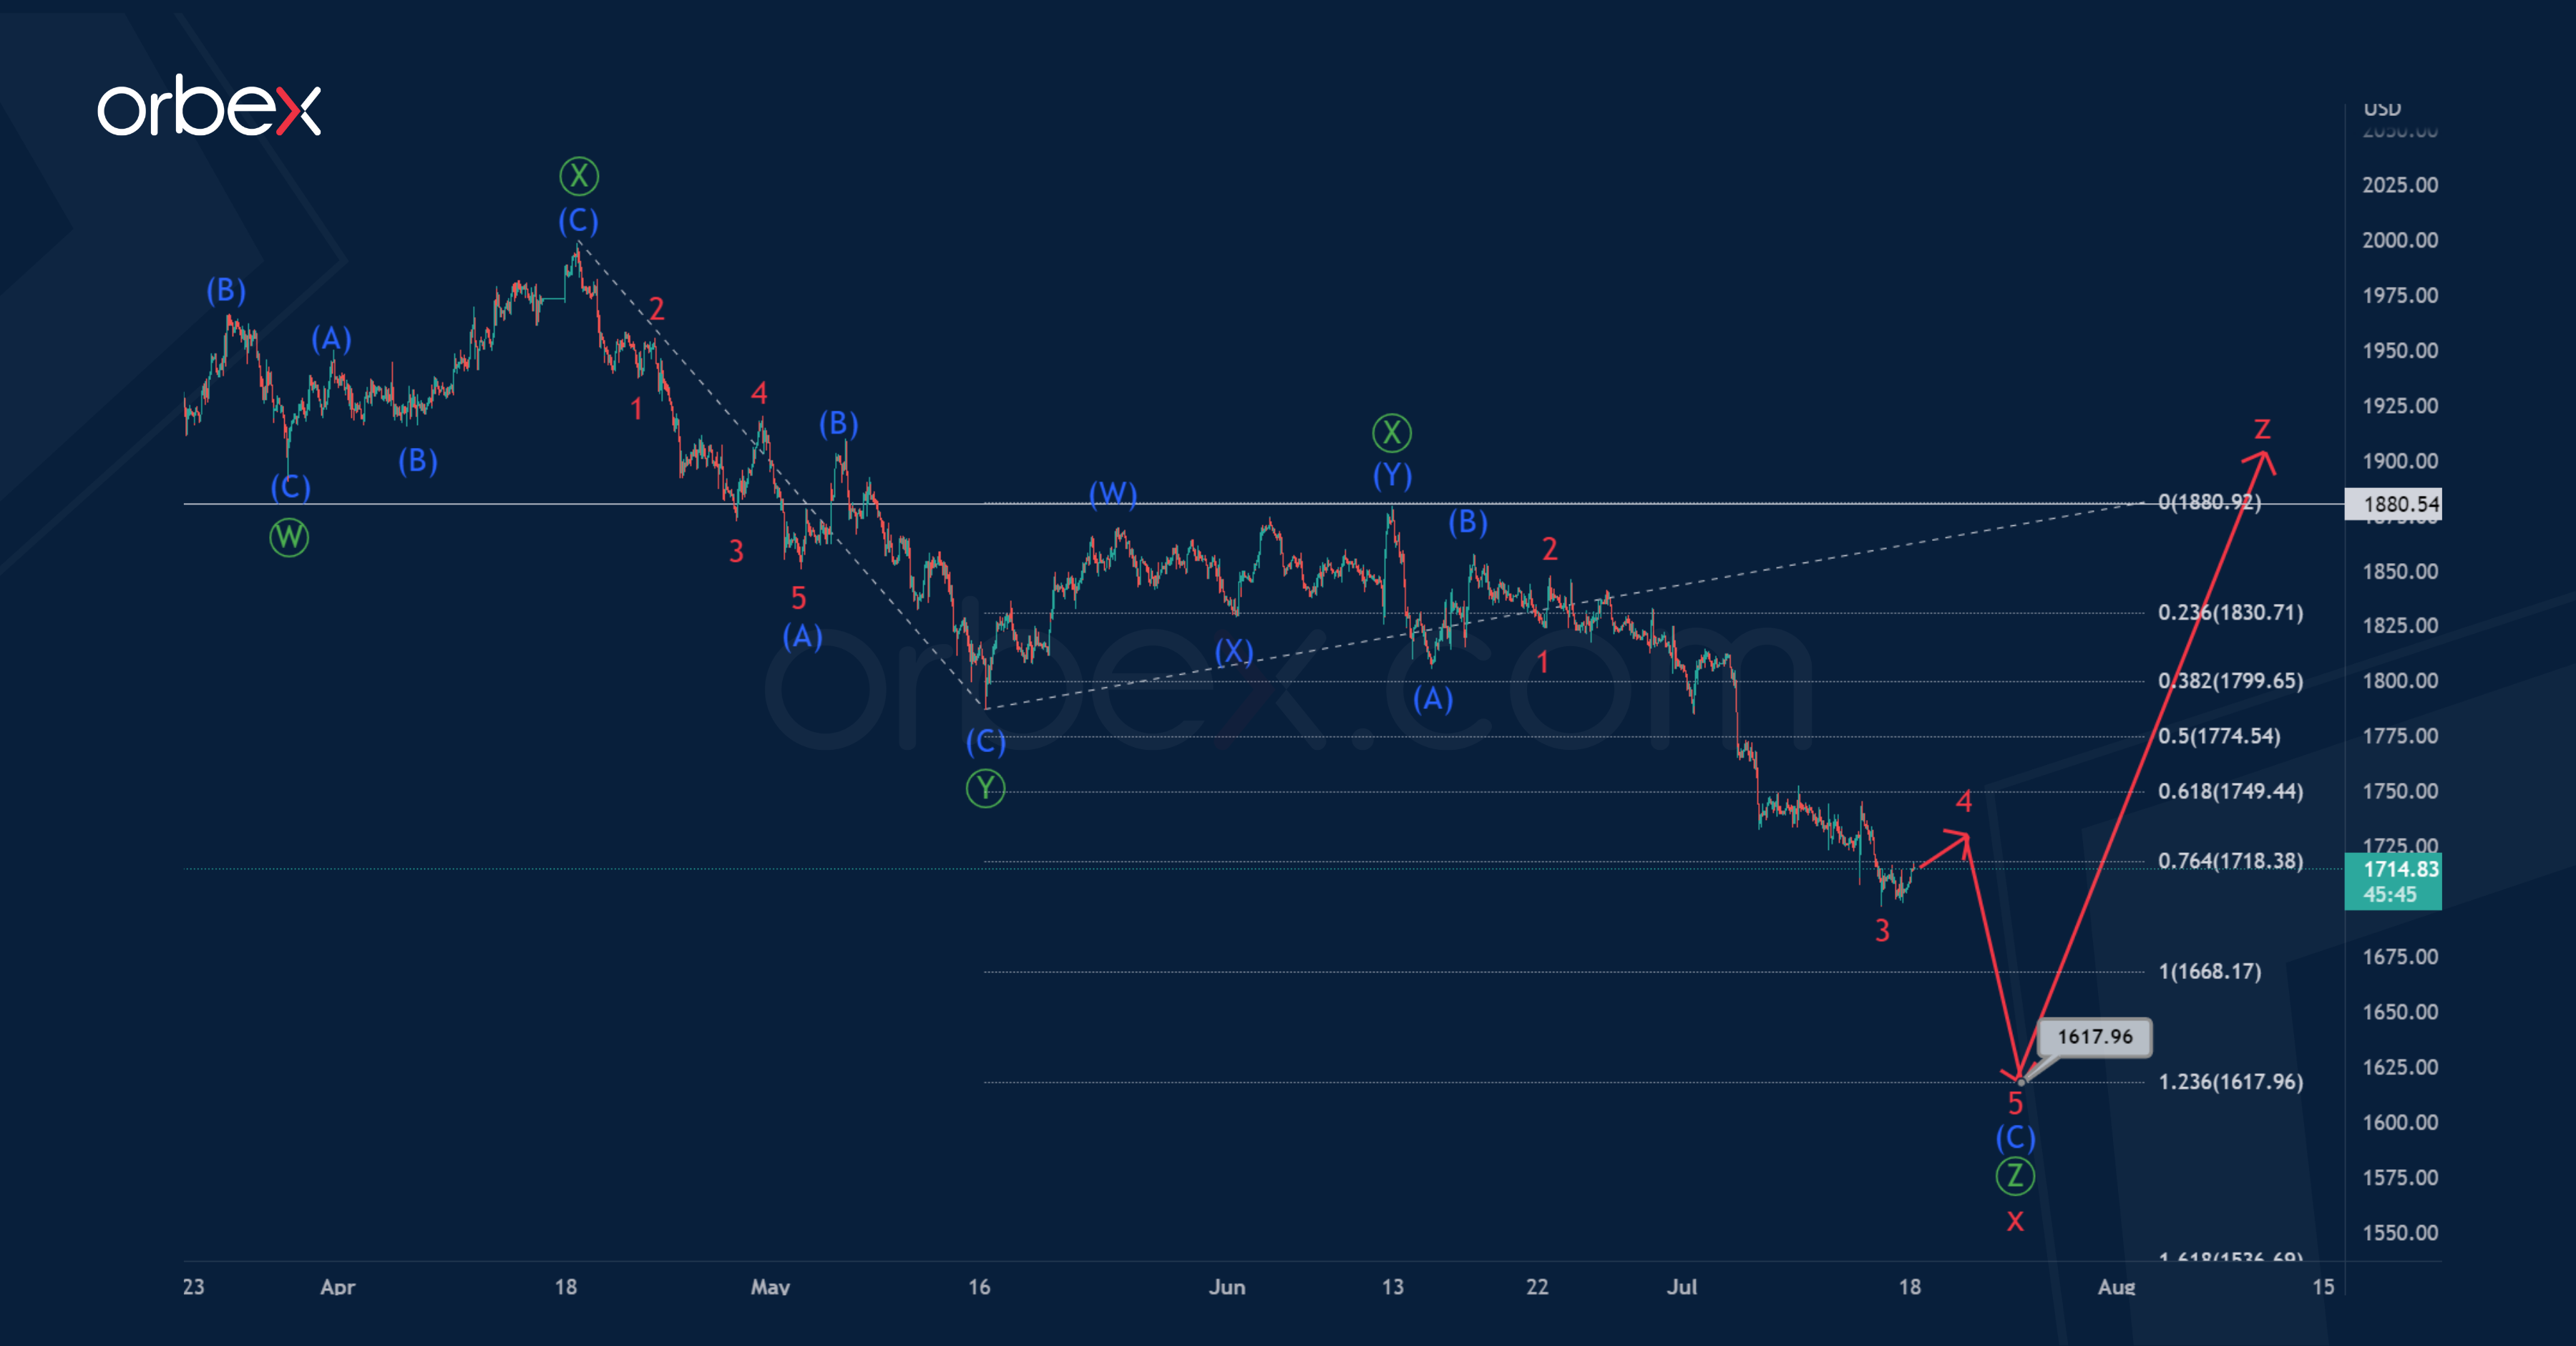
Alternatively, we can expect the continuation of the downward price movement in the cycle wave x. Wave x is also a triple zigzag, as in the main version.
However, in this scenario, the final primary wave is still under development. In the near future, a downward movement of XAUUSD is expected in the intermediate impulse wave (C), which is part of the zigzag wave.
The primary wave can complete its zigzag pattern (A)-(B)-(C) near 1617.96. At that level, it will be at 123.6% of primary wave.
DAX 40 Bounces Off Critical Support
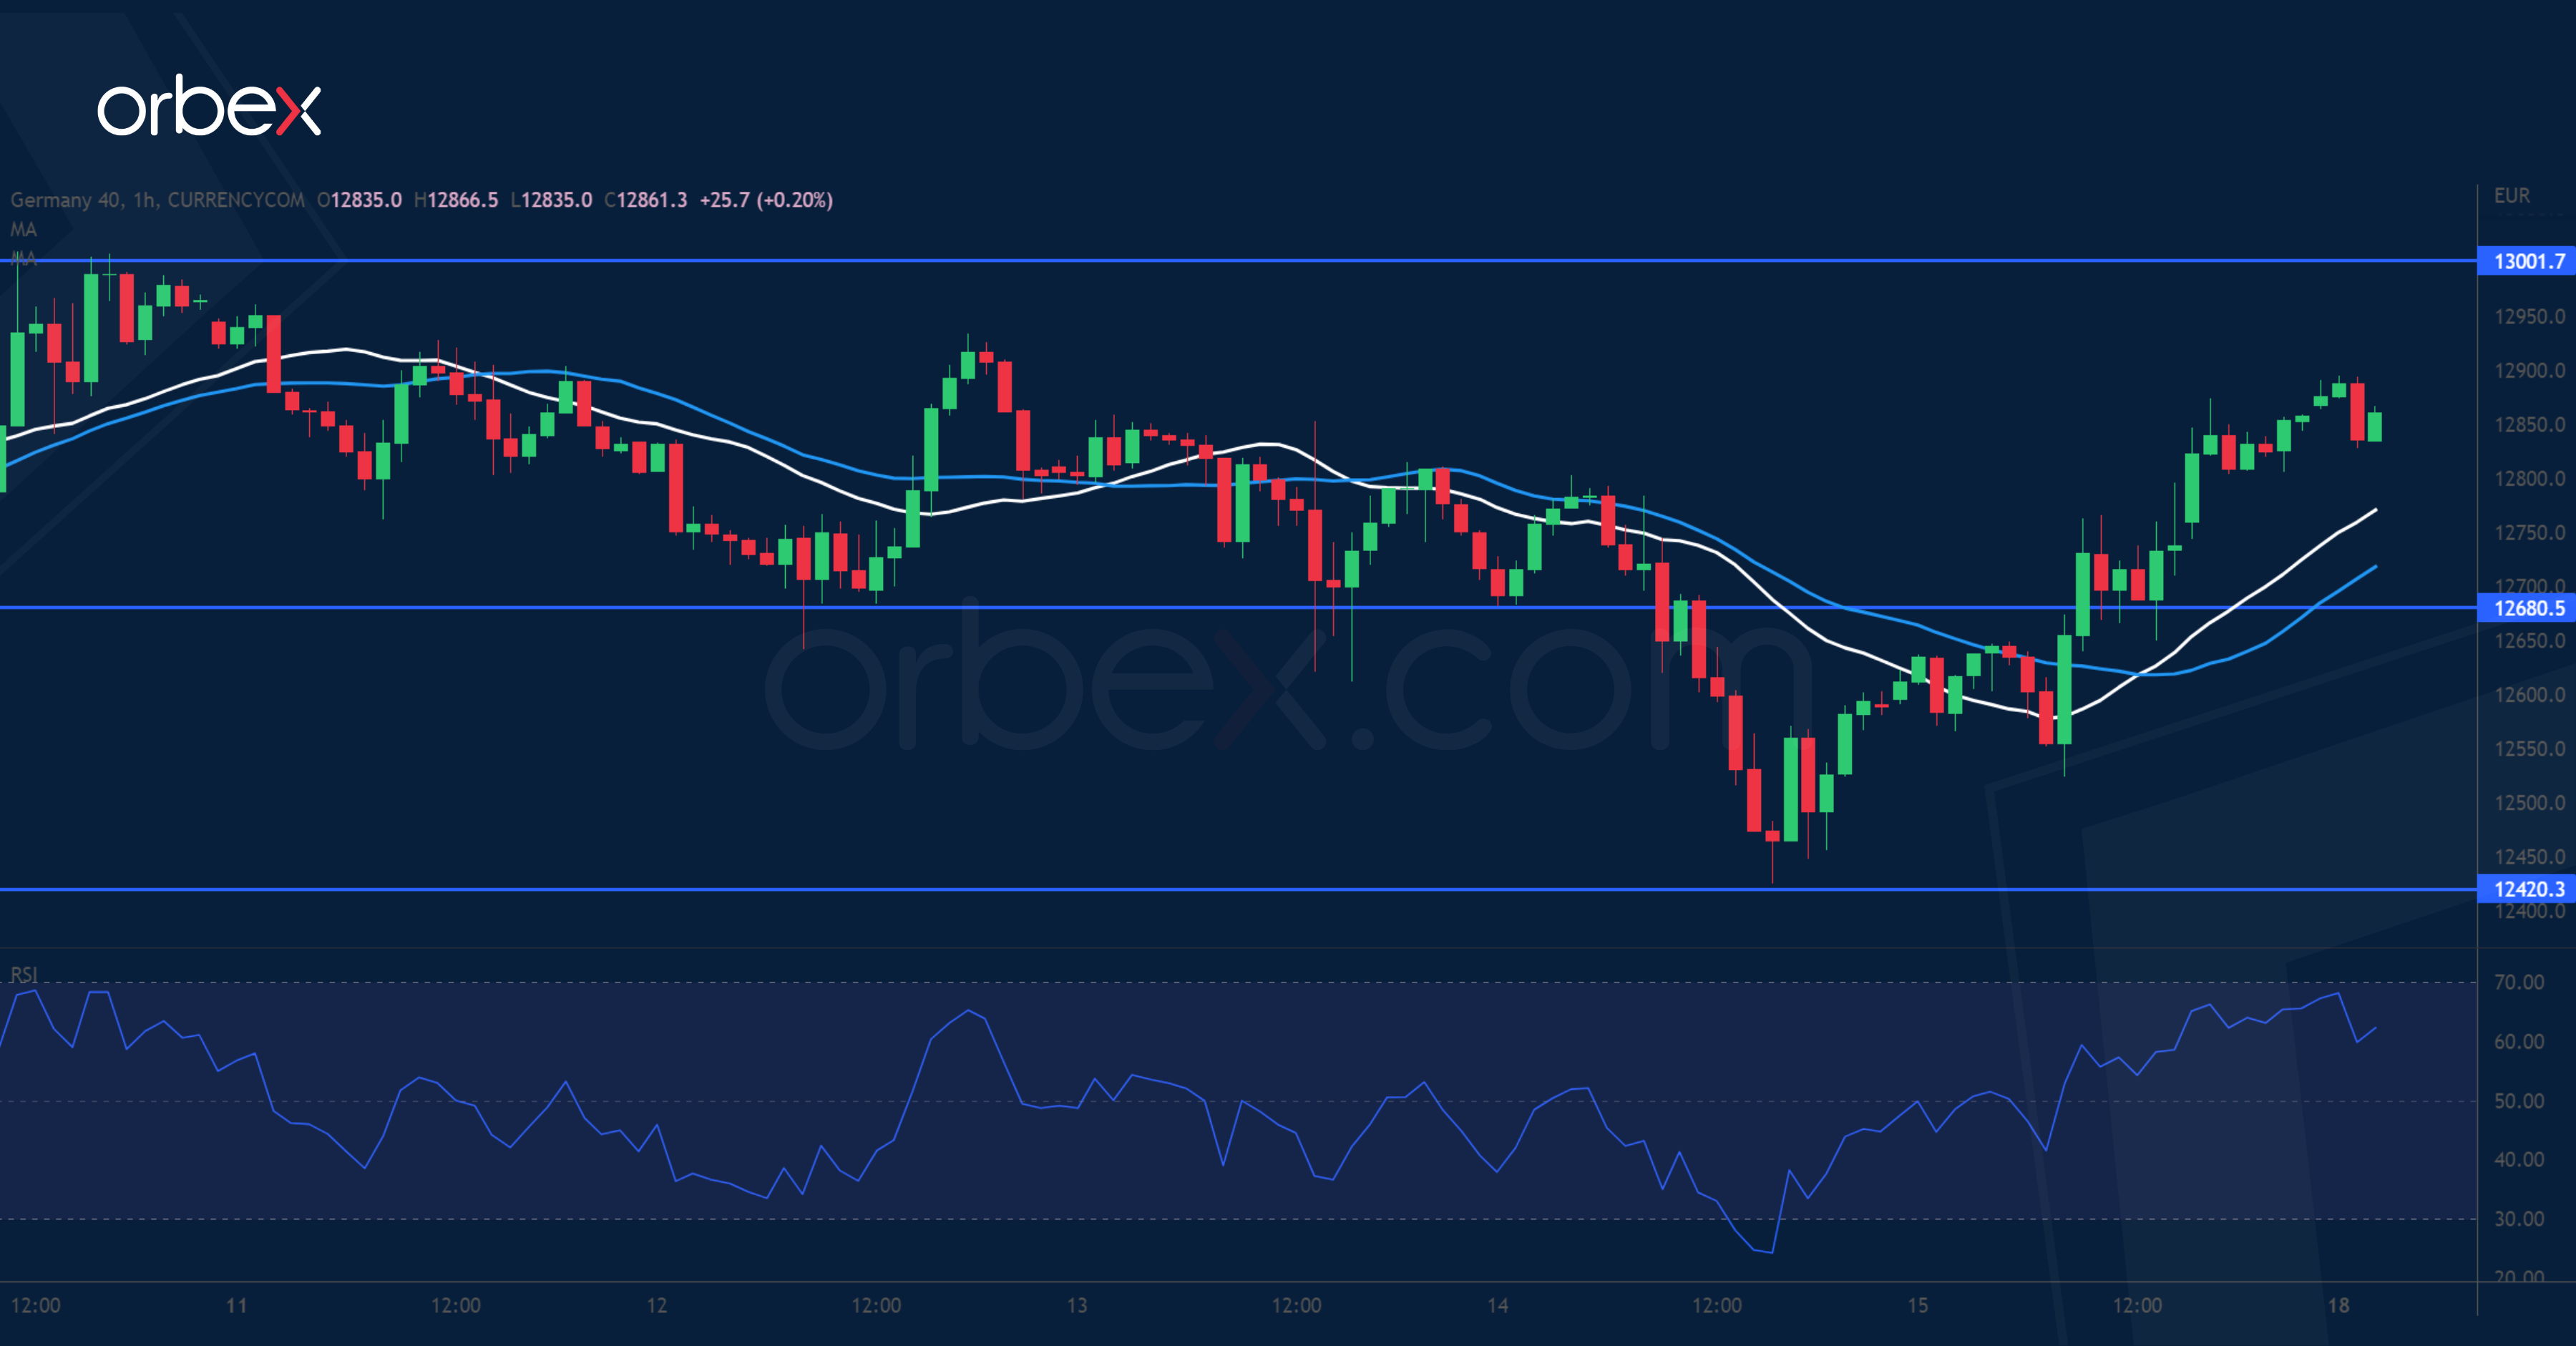
The Dax 40 consolidates ahead of the ECB interest rate decision later this week. The price action has been treading water over last March’s low near 12420, which suggests interest in keeping the index from dipping into bearish territory. However, the buy side needs to show stronger commitment to turn sentiment around. A rally above the psychological level of 13000 may attract more follow-up buying. On the downside, a fall below 12680 would send the index back to the bulls’ last stronghold at 12420.
XAG/USD Sees Limited Rebound
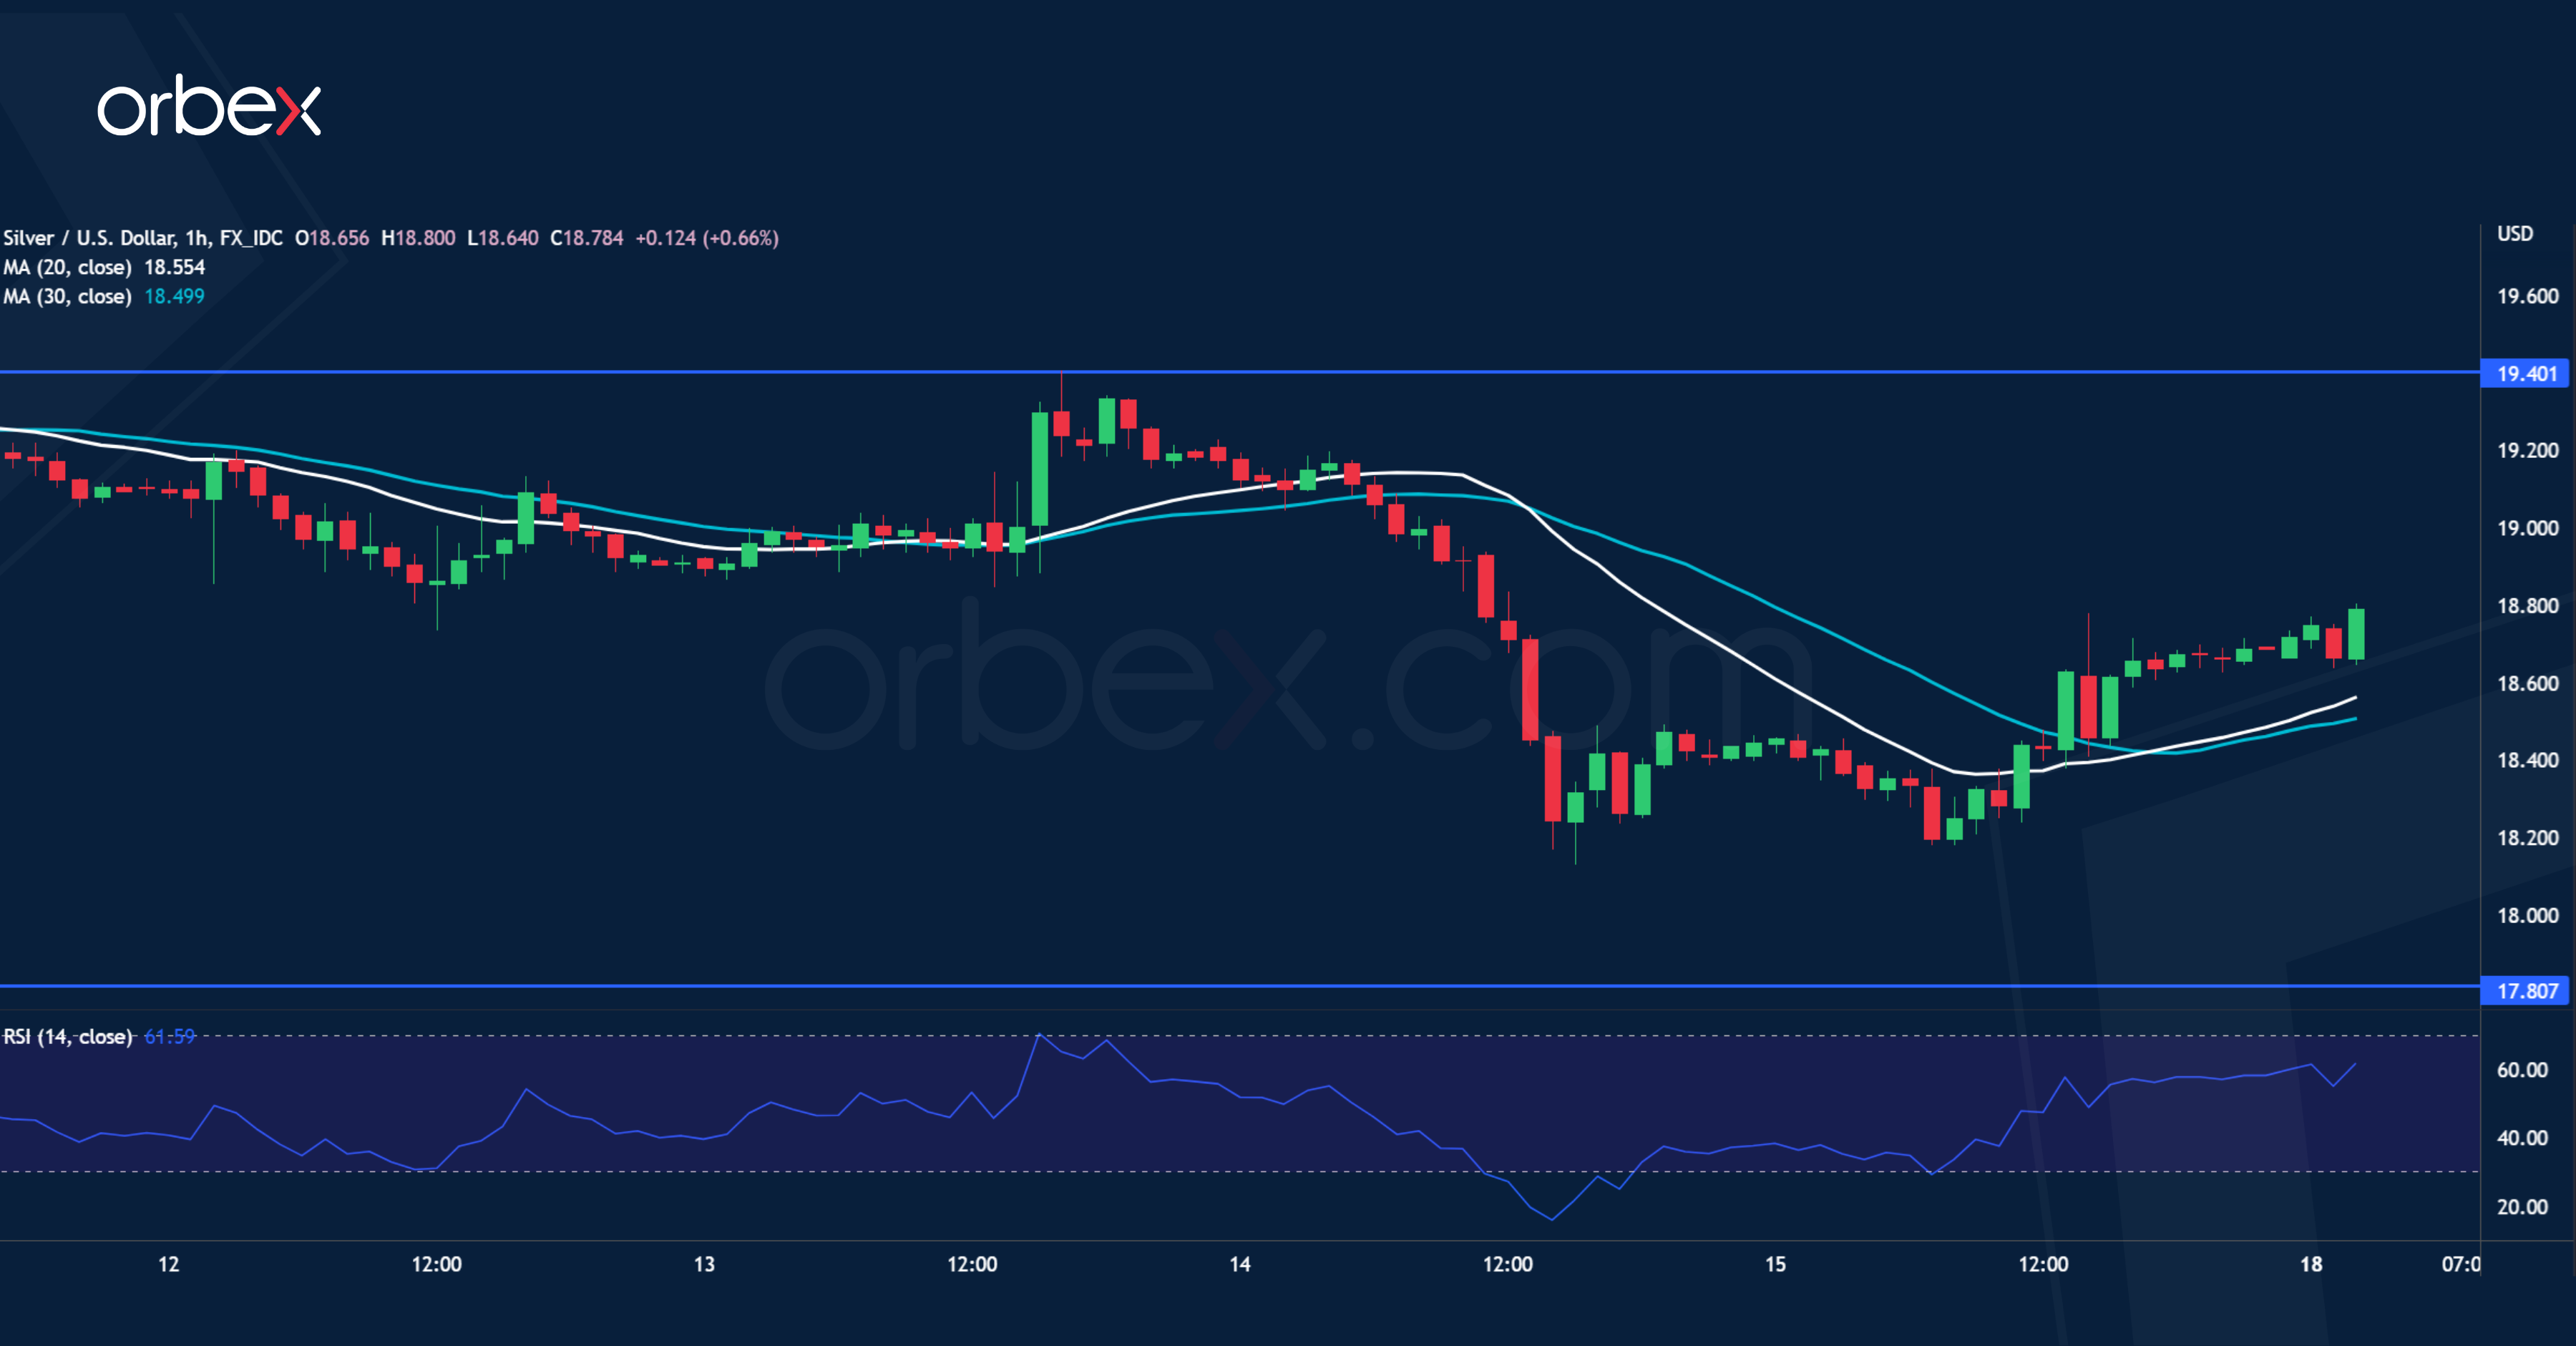
Silver recoups losses as risk assets recover at the expense of the US dollar. As the price approaches July 2020’s lows around 17.80, an oversold RSI on the daily chart suggests potential exhaustion in the current downtrend. The precious metal could use a rebound to take a breather. The RSI’s oversold situation on the hourly chart triggered a ‘buying-the-dips’ behavior. 19.40 has proven to be a tough resistance to crack and could cap the bounce. A bullish breakout, however, would trigger an extended rally above 20.00.