

Sample Category Title
RBA minutes: Arguments for 50bps hike stronger than 25bps in Jul
In the minutes of the July 5 meeting, RBA noted that members considered raising interest rates by 25bps or 50bps. The arguments for a 50bps hike were "stronger".
"The level of interest rates was still very low for an economy with a tight labour market and facing a period of higher inflation," the minutes noted. "Members viewed it as important that inflation expectations remained well anchored and that the period of higher inflation be temporary."
Also, board members agreed that "further steps would need to be taken to normalise monetary conditions in Australia over the months ahead," The "size and timing" of future hikes will be guided by "incoming data" and assessment of the outlook for "inflation and labor market".
(RBA) Minutes of the Monetary Policy Meeting of the Reserve Bank Board
Hybrid – 5 July 2022
Members participating
Philip Lowe (Governor and Chair), Michele Bullock (Deputy Governor), Mark Barnaba AM, Wendy Craik AM, Ian Harper AO, Carolyn Hewson AO, Steven Kennedy PSM, Carol Schwartz AO, Alison Watkins AM
Others participating
Luci Ellis (Assistant Governor, Economic), Christopher Kent (Assistant Governor, Financial Markets)
Penelope Smith (Acting Secretary)
Alexandra Heath (Head, International Department), Bradley Jones (Head, Economic Analysis Department), Marion Kohler (Head, Domestic Markets Department)
International economic developments
Members commenced their discussion of international developments by noting that inflation had increased further to multi-decade highs and that the outlook for growth in a number of advanced economies had become more uncertain. Risks to global growth had become skewed to the downside. This reflected the decline in households' purchasing power and the ongoing tightening in financial conditions as central banks were expected to lift policy rates substantially in the period ahead.
Consumer price inflation remained high. The continuing fallout from Russia's invasion of Ukraine was evident in increases in the prices of fuel, electricity and food in many economies, which had boosted headline inflation in May and June. Crude oil prices were below their peaks earlier in the year but remained high, while gas prices in Europe and Asia had increased further. Core inflation had also remained high in recent months; services inflation had continued to rise, largely reflecting the rebound in activity in the services sector and, in some economies, high rates of wages growth. However, there were signs that price pressures in parts of the global economy had started to abate. Growing concerns about the outlook for global growth had prompted large declines in base metals prices in recent weeks. Goods inflation in some advanced economies was beginning to ease as the supply of and demand for goods became more balanced. Shipping costs had levelled out at high levels. There were also signs of improvement in global supply chain bottlenecks; increased production of consumer durables and electronics in east Asia had contributed to this.
Activity in China had rebounded in May following the relaxation of COVID-19-related mobility restrictions and in response to ongoing policy stimulus. Industrial production and retail sales had recovered around one-third of the earlier declines and export volumes had bounced back; there did not appear to have been widespread disruptions to Asian supply chains from the COVID-19-related mobility restrictions in parts of the country. Timely surveys of business activity also indicated a further rebound in economic conditions in June. Nevertheless, the economic outlook in China continued to be clouded by the possibility of rolling lockdowns related to COVID-19 outbreaks and ongoing imbalances in the property sector. While public spending had supported fixed asset investment in China in recent months, iron ore prices had declined notably over the June quarter alongside falls in Chinese steel prices.
Members noted that consumer spending in advanced economies had generally been resilient to higher inflation and interest rates over recent months. Strong labour markets had supported household consumption and, outside of the United States and the United Kingdom, household saving rates in advanced economies remained high. Some households had also accumulated large saving buffers during the pandemic. However, the expectation that central banks would need to raise interest rates substantially over the second half of 2022 to bring inflation back to target was clouding the outlook and had prompted analysts to lower their growth forecasts substantially. The erosion of household purchasing power had occurred alongside a material decline in consumer sentiment. In some economies, the most interest-rate-sensitive forms of spending (especially housing-related spending) had begun to slow as financing costs increased. Timely survey measures of production and new orders in the United States and the euro area had also declined materially in June.
Domestic economic developments
Members noted that the resilience of the Australian economy continued to be evident in the labour market. Full-time employment had risen strongly again in May, to be around 6 per cent higher than its pre-pandemic level. The participation rate and employment-to-population ratio had also risen to record highs. The unemployment rate was at its lowest level in nearly 50 years, and broader measures of spare capacity were at their lowest levels in many years. Job vacancy rates remained very high across most industries, pointing to continued strong employment growth, at least in the near term; this was consistent with reported hiring intentions of employers in the Bank's liaison program. The increased availability of workers from overseas had yet to have much effect in easing labour shortages, based on reports from firms in the Bank's liaison program.
Other information received in June had affirmed the outlook for faster wages growth in the period ahead. The Fair Work Commission had announced a 5.2 per cent increase to the national minimum wage. An increase in modern award wages of between 4.6 per cent and 5.2 per cent had also been announced, with lower-paid workers set to receive increases at the upper end of this range. These increases in the national minimum wage and modern award wages were the largest since 2006, reflecting the Fair Work Commission's desire to support real wages for low-paid workers during a period of higher inflation. Separately, the New South Wales and Tasmanian governments had announced increases in their wage caps for public sector workers, while the Queensland Government had removed its wage cap. Members noted that this would support aggregate wages growth in the period ahead, given state governments are large employers. Further, around 60 per cent of private sector firms in the Bank's liaison program had reported that they expect wages growth to pick up over the coming year. Some contacts had highlighted the increase in inflation and the recent Fair Work Commission decision as relevant considerations in this assessment, as well as the need to respond to higher rates of voluntary turnover. Notwithstanding this more recent information, members observed that the Wage Price Index had increased by only 2.4 per cent over the year to the March quarter.
Ahead of the release of the June quarter Consumer Price Index (CPI) at the end of July, members noted that domestic inflationary pressures, including those outside of the labour market, continued to build. Non-labour input cost pressures were evident across a range of industries. Adverse weather conditions had affected the prices of some fresh produce. Rents were expected to pick up in response to tightening rental market conditions across most of the country. Wholesale electricity and gas prices had also increased sharply in recent months, reflecting domestic supply disruptions during a period of increased demand. The effect of these increases on retail electricity and gas prices was expected to be evident later in the year, since state subsidies and hedging arrangements had limited the near-term pass-through. More generally, firms in the Bank's liaison program had indicated a greater propensity to pass through cost increases to consumer prices. As a result of these price pressures, inflation was expected to increase in year-ended terms through the remainder of 2022.
Members noted that housing prices had declined in some cities in recent months. In Sydney and Melbourne, turnover and clearance rates had declined and the number of properties listed for sale was higher than over recent years. In other capital cities and regional areas, housing prices had continued to increase, albeit at a slower rate over recent months, supported by lower-than-average volumes of properties for sale. Rental market conditions remained tight, supported by low vacancy rates, lower average household size and strong household income growth.
Timely data indicated that growth in domestic demand had remained solid in the June quarter, led by household spending. Although consumer sentiment had declined notably, household consumption was supported by growth in disposable income, the increase in saving and wealth that occurred earlier in the pandemic, and the rebound in discretionary services spending. The pipeline of residential dwelling construction and infrastructure activity remained large, although capacity constraints were slowing the pace at which the pipeline could be worked through. Business surveys and information from the Bank's liaison program suggested the investment intentions of non-mining firms remained at or above average levels. Recent state government budgets also pointed to continued strength in public demand, supported in part by higher-than-projected revenue. Nevertheless, members agreed that the outlook for domestic economic activity had eased a little, with a key source of uncertainty relating to the response of households to rising inflation, higher interest rates and declining housing prices in some cities.
International financial markets
Members commenced their discussion of international financial markets by noting that global financial conditions had tightened further over June. A number of central banks had continued to withdraw some of the substantial policy stimulus that had been in place and had highlighted their willingness to raise policy rates more quickly and above neutral levels if inflation remained high. A number of central banks had also acknowledged that policy rates above neutral and declines in real household incomes were likely to result in lower growth. Reflecting this, financial markets had become more concerned about the outlook for global growth.
The US Federal Reserve had increased its policy target range by 75 basis points at its June meeting, which was more than had been expected a month earlier; members of the Federal Open Market Committee had also projected that the policy rate would be increased further to a contractionary setting before the end of 2022. The European Central Bank had indicated that it would increase its policy rate for the first time in 11 years at its July meeting and confirmed that it would end net asset purchases that month. The Bank of Japan was the only major central bank indicating it would continue to add to its bond holdings. Members noted that Japan had experienced low inflation for a long time, and that both households and businesses expected this to continue despite the significant depreciation of the yen.
Government bond yields had risen in the first half of June, reflecting higher-than-expected inflation in the United States and a number of other countries, and the associated upward revisions to expected policy rates. Later in the month, however, long-term government bond yields had declined, reflecting increasing concerns that higher policy rates would result in lower growth. As a result, long-term yields were little changed since the previous meeting in most advanced economies, including Australia, while shorter-term rates had increased a little. Market pricing continued to suggest that market participants expected inflation to be high over the coming year, but that the tightening in monetary policy would be sufficient to bring inflation back down towards target levels relatively quickly after that. Members noted that these expectations were also consistent with the view that supply disruptions would ease over the coming year.
Private sector financing conditions had tightened further over the prior month. Equity prices had fallen sharply and corporate bond spreads had risen noticeably across most major markets, including Australia. The US dollar had appreciated further, consistent with the relative increase in short-term US Government bond yields this year. The Australian dollar had depreciated over the prior month, alongside declines in commodity prices and concerns around global growth, but remained around its level at the beginning of the year on a trade-weighted basis.
In China, financial conditions remained accommodative, with a range of policy measures in place to stabilise growth and support private investment. Private-sector demand for credit continued to be relatively weak, while equity prices had partially recovered from their recent lows following the easing of some COVID-19-related restrictions. Chinese property developers remained under severe stress. By contrast, financial conditions had tightened across other emerging market economies, reflecting domestic policy rate rises in response to higher inflation, the policy tightening in advanced economies and increasing concerns around global growth.
Domestic financial markets
Members noted that Australian financial conditions had tightened further in June, reflecting the larger-than-expected increase in policy rates at the June meeting and market expectations for a sharper policy tightening over the period ahead. Accordingly, money market rates had increased further in the month and Australian long-term government bond yields had risen to 2014 levels before declining later in the month. Market pricing implied that market participants expected the cash rate target to reach around 3 per cent by December. Members noted this was considerably higher than market economists' expectations. Nevertheless, both groups attached a high probability to a 50 basis point increase at the present meeting.
Banks' funding costs had risen considerably in preceding months in response to the rise in money market rates. Members observed that most lenders had passed on the policy rate increases in May and June in full to existing variable-rate housing borrowers and to most variable-rate small business borrowers. Fixed-rate loans accounted for almost 40 per cent of outstanding housing credit, and pass-through to these loans was expected to occur progressively over the following couple of years or so. Pass-through to deposit rates had been more selective to date.
Members noted that the stock of housing credit as a share of household disposable income was around three times higher than in the 1990s, which suggested the cash-flow channel of monetary policy had become larger over this period. In net terms, the ratio of debt to income was relatively steady over the prior decade as borrowers accumulated significant balances in offset and redraw accounts. These balances had increased further during the pandemic and could provide some buffer before rising interest payments affected consumption, although the distribution of these buffers was likely to vary significantly across different types of borrowers.
Growth in total credit had remained strong in May, at around its fastest pace in more than a decade. Lending to large and medium-sized businesses continued to grow strongly, supported by economic growth. Demand for housing finance remained high, although owner-occupier housing credit growth had eased in recent months and commitments for housing loans for both owner-occupiers and investors had edged down from their recent peaks. This was consistent with some signs of activity easing in the housing market.
The neutral interest rate
Ahead of their discussion about monetary policy, members considered the staff's estimates of the neutral real interest rate for Australia. The neutral rate is the real policy rate that is neither expansionary nor contractionary. It is one benchmark for assessing the stance of monetary policy.
Any development that affects the desired levels of saving or investment will affect the neutral rate. This includes slow-moving influences, such as trend productivity growth and demographic change, and more rapidly evolving influences, such as persistent changes in risk appetite. In a small open economy like Australia, where capital flows freely across borders, the neutral rate is determined by both global and domestic factors. Estimates of the neutral rate tend to be correlated across countries over time, reflecting similar global influences on saving and investment as well as spillovers across borders. In recent decades, estimates of the neutral rate have drifted lower in major advanced economies and in Australia.
Members noted that gauging the level of the neutral rate is challenging in practice because it cannot be directly observed and must instead be inferred from the data. The staff apply a range of methods for estimating the neutral rate, each with its own advantages and disadvantages, and each method produces a different estimate. The range of estimates is wide.
Members also observed that the cash rate is set in nominal terms, while the neutral rate is defined in real terms. Translating estimates of the neutral rate to a nominal interest rate involves adding inflation expectations. Like the neutral rate, economy-wide expectations for inflation cannot be directly observed and must be inferred from the data, adding an additional layer of uncertainty. Members observed that estimates of the nominal neutral rate were above the cash rate in the decade prior to the pandemic. This was a period when inflation was low, and potentially indicated limitations of the framework as a benchmark for the stance of policy.
In the context of the significant degree of uncertainty about estimates of the neutral rate and the limitations of the framework, members discussed three points. The first was that the current level of the cash rate is well below the lower range of estimates for the nominal neutral rate. This suggests that further increases in interest rate will be needed to return inflation to the target over time. The second was that the neutral rate framework indicates that if inflation expectations rise, the level of nominal interest rates required to return inflation to the target will be higher than otherwise. And the third was that the neutral rate framework provides only a general guide and any specific estimates need to be treated with caution.
Considerations for monetary policy
In considering the policy decision, members observed that inflation in Australia had increased significantly and was expected to increase further in the near term. Global factors, including COVID-19-related disruptions to supply chains and the war in Ukraine, accounted for much of the increase in inflation. However, domestic factors were also playing a role. Strong demand, a tight labour market and capacity constraints in some sectors were contributing to the upward pressure on prices. The east coast floods earlier in the year had also affected some prices, and the July floods would likely result in this persisting for a longer period of time.
Members noted that inflation is forecast to peak later in 2022 and then decline back towards the 2 to 3 per cent range in 2023. Inflation is expected to moderate as global supply-side problems continue to ease and commodity prices stabilise, even if at a high level. Higher interest rates will also help establish a more sustainable balance between the demand for and the supply of goods and services. A full set of updated forecasts will be published in August following the release of the June quarter CPI.
Members discussed the ongoing resilience of the Australian economy. Growth had been supported by household and business balance sheets that are generally in good shape, an upswing in business investment and the large pipeline of construction work to be completed. Macroeconomic policy settings were also supportive of growth and higher commodity prices had provided a boost to national income.
The resilience of the economy was most evident in the labour market. Employment had grown significantly in preceding months and the unemployment rate was at a multi-decade low. Job vacancies and advertisements were at high levels and further declines in unemployment and underemployment were expected. Information from the Bank's liaison program continued to indicate that wages growth would increase from the low rates of recent years as firms compete for staff in a tight labour market.
Members considered the evolving risks to household consumption, including how households would adjust their spending in response to higher prices and interest rates, and the impact of higher interest rates on the housing market. The recent spending data had been positive, although household budgets are under pressure from higher prices and higher interest rates. The household saving rate is also still higher than it was before the pandemic. Many households have built up large financial buffers and are benefiting from stronger income growth. Housing prices had declined in some markets over preceding months, but remained significantly higher than prior to the pandemic, thereby supporting household wealth and spending. Members agreed it was important to continue to monitor these various influences on household spending when assessing the appropriate setting of monetary policy.
Members also considered the risks to the global outlook, which remained clouded by the war in Ukraine and its effect on the prices of energy and agricultural commodities. Members noted that real household incomes are under pressure in many economies and financial conditions are tightening, as central banks increase interest rates. There are also ongoing uncertainties related to COVID-19, especially in China.
In making their policy decision, members considered the possibility of raising interest rates by 25 basis points or 50 basis points. Members agreed that arguments for raising interest rates by 50 basis points were stronger. The level of interest rates was still very low for an economy with a tight labour market and facing a period of higher inflation. Members viewed it as important that inflation expectations remained well anchored and that the period of higher inflation be temporary. If medium-term inflation expectations were to adjust upward, the task of returning inflation to the target would be more difficult and would come at a higher cost in terms of activity and employment. Members noted that, while short-term inflation expectations had risen with actual inflation, longer-term measures of inflation expectations were well anchored.
Members agreed that further steps would need to be taken to normalise monetary conditions in Australia over the months ahead. The size and timing of future interest rate increases will continue to be guided by the incoming data and the Board's assessment of the outlook for inflation and the labour market, including the risks to the outlook. The Board remains committed to doing what is necessary to ensure that inflation in Australia returns to the target over time.
The decision
The Board decided to increase the cash rate target by 50 basis points to 1.35 per cent. It also increased the interest rate on Exchange Settlement balances by 50 basis points to 1.25 per cent.
Technical Outlook and Review
DXY:
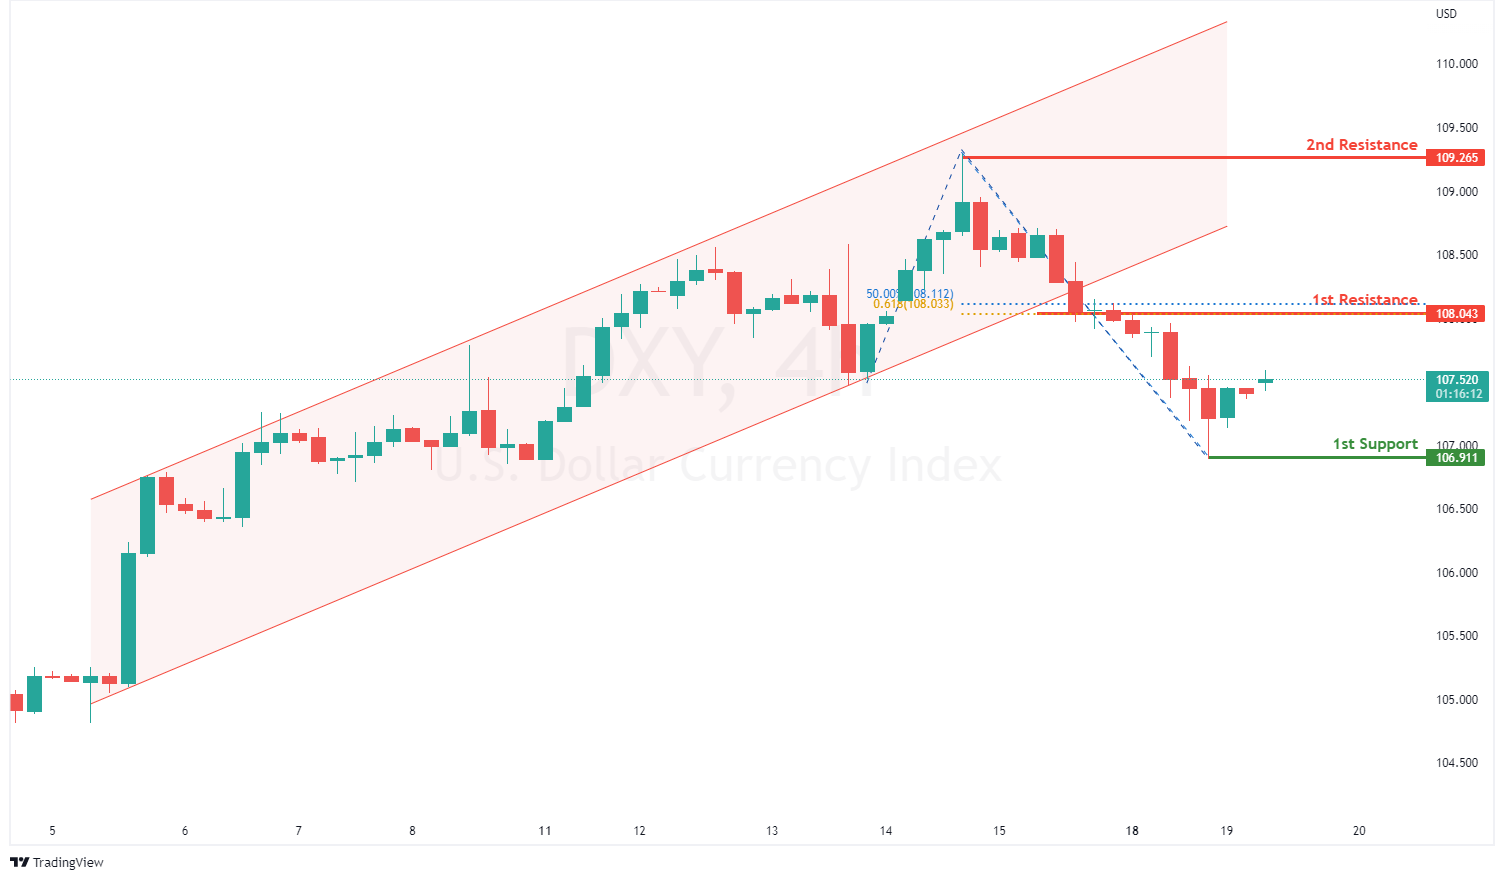
On the H4, with prices breaking out of the ascending channel, we have a bearish bias that prices will rise and drop from the 1st resistance at 108.043 where the 61.8% fibonacci projection and 50% fibonacci retracement are to the 1st support at 106.911 where the swing low support is. Alternatively, prices could break 1st resistance and rise to 2nd resistance at 109.265 in line with swing high resistance.
Areas of consideration:
- H4 time frame, 1st resistance at 108.043
- H4 time frame, 1st support at 106.911
XAU/USD (GOLD):
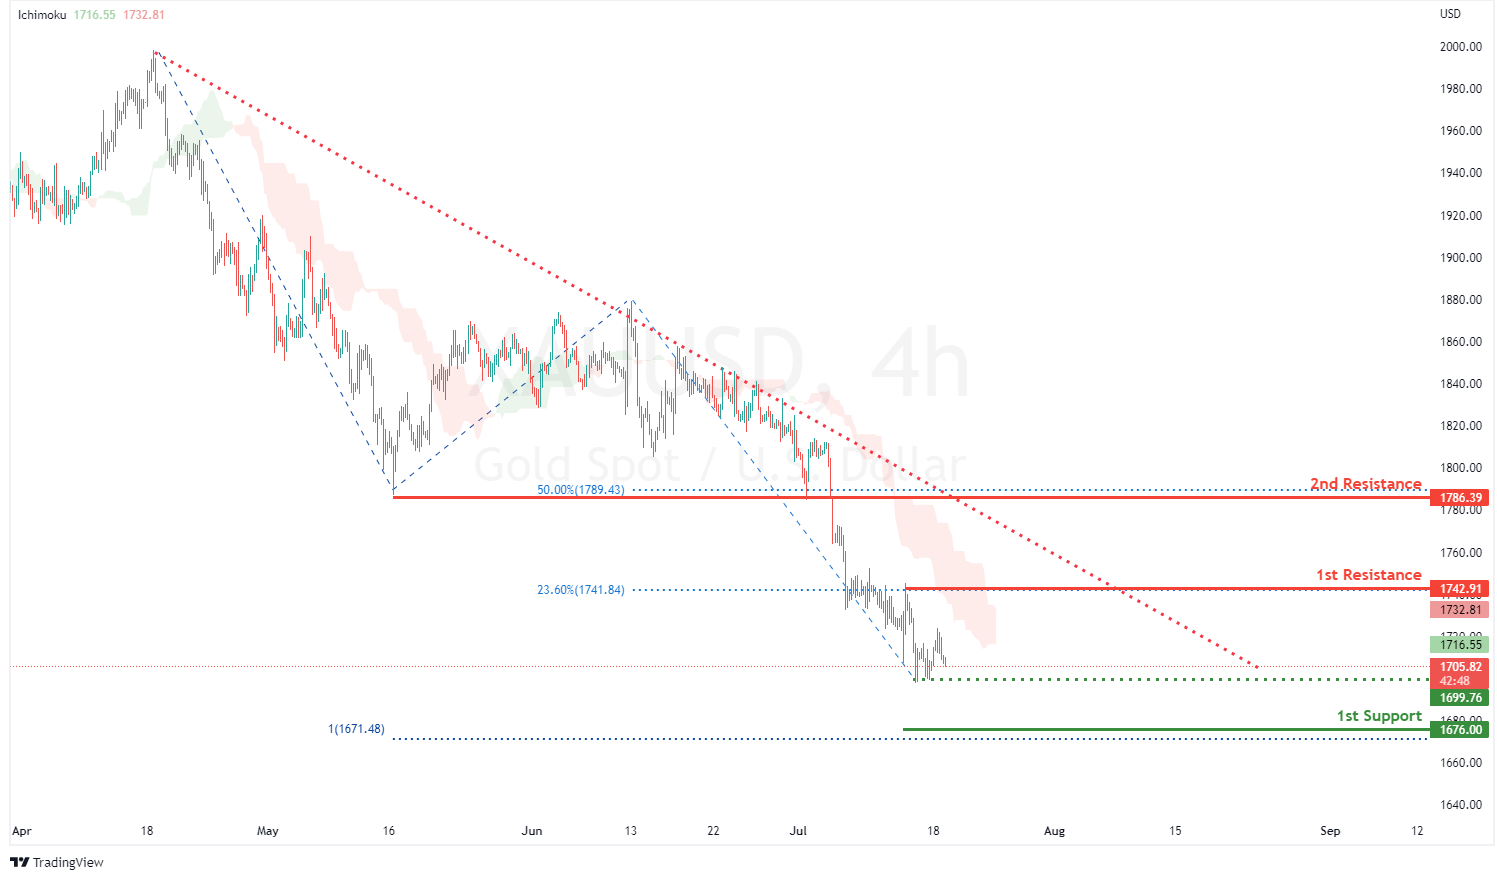
On the H4, with price moving below the ichimoku cloud and in a descending trendline, we have a bearish bias that price will rise and drop from the 1st resistance at 1742.91 where the swing high resistance and 23.6% fibonacci retracement are to the 1st support at 1676.00 in line with the 100% fibonacci projection and swing low support on the daily timeframe. Take note of intermediate support at 1699.76 where the swing low support is. Alternatively, price could break 1st resistance on the upside and we would expect bullish momentum to carry prices to 2nd resistance at 1786.39 where the pullback resistance and 50% fibonacci retracement are.
Areas of consideration:
- H4 time frame, 1st Resistance at 1742.91
- H4 time frame, 1st Support at 1676.00
GBP/USD:
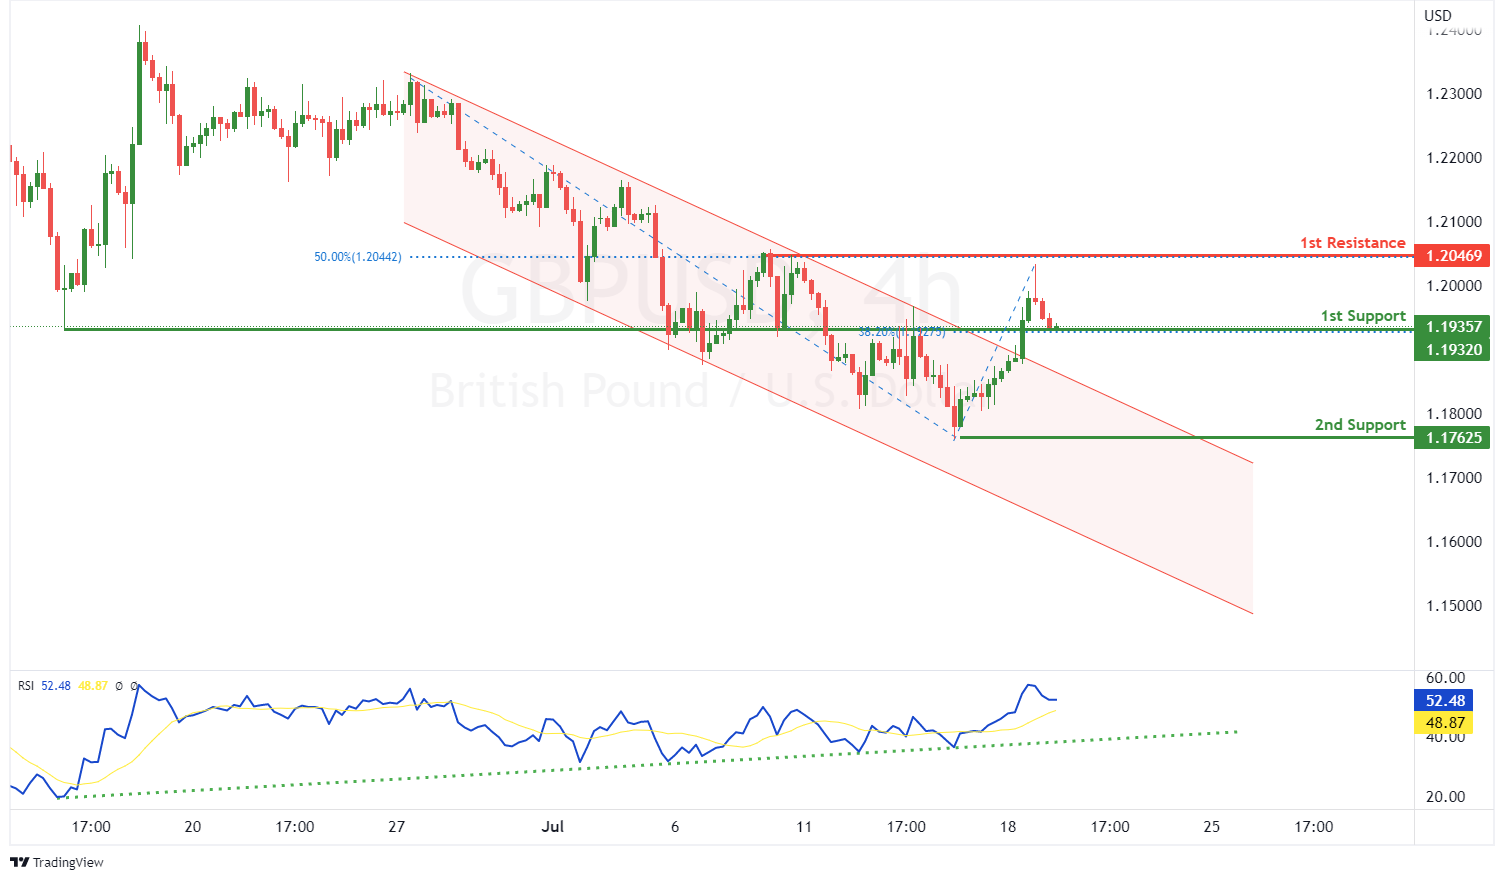
On the H4, with prices breaking out of the descending channel and RSI moving along an ascending trendline, we have a bullish bias that prices will rise from the 1st support at 1.19320 where the 38.2% fibonacci retracement and pullback support are to the 1st resistance at 1.20469 where the swing high resistance and 50% fibonacci retracement are. Alternatively, prices could break 1st support and drop to 2nd support at 1.17625 in line with swing low support.
Areas of consideration:
- H4 1st resistance at 1.20469
- H4 1st support at 1.19320
USD/CHF:
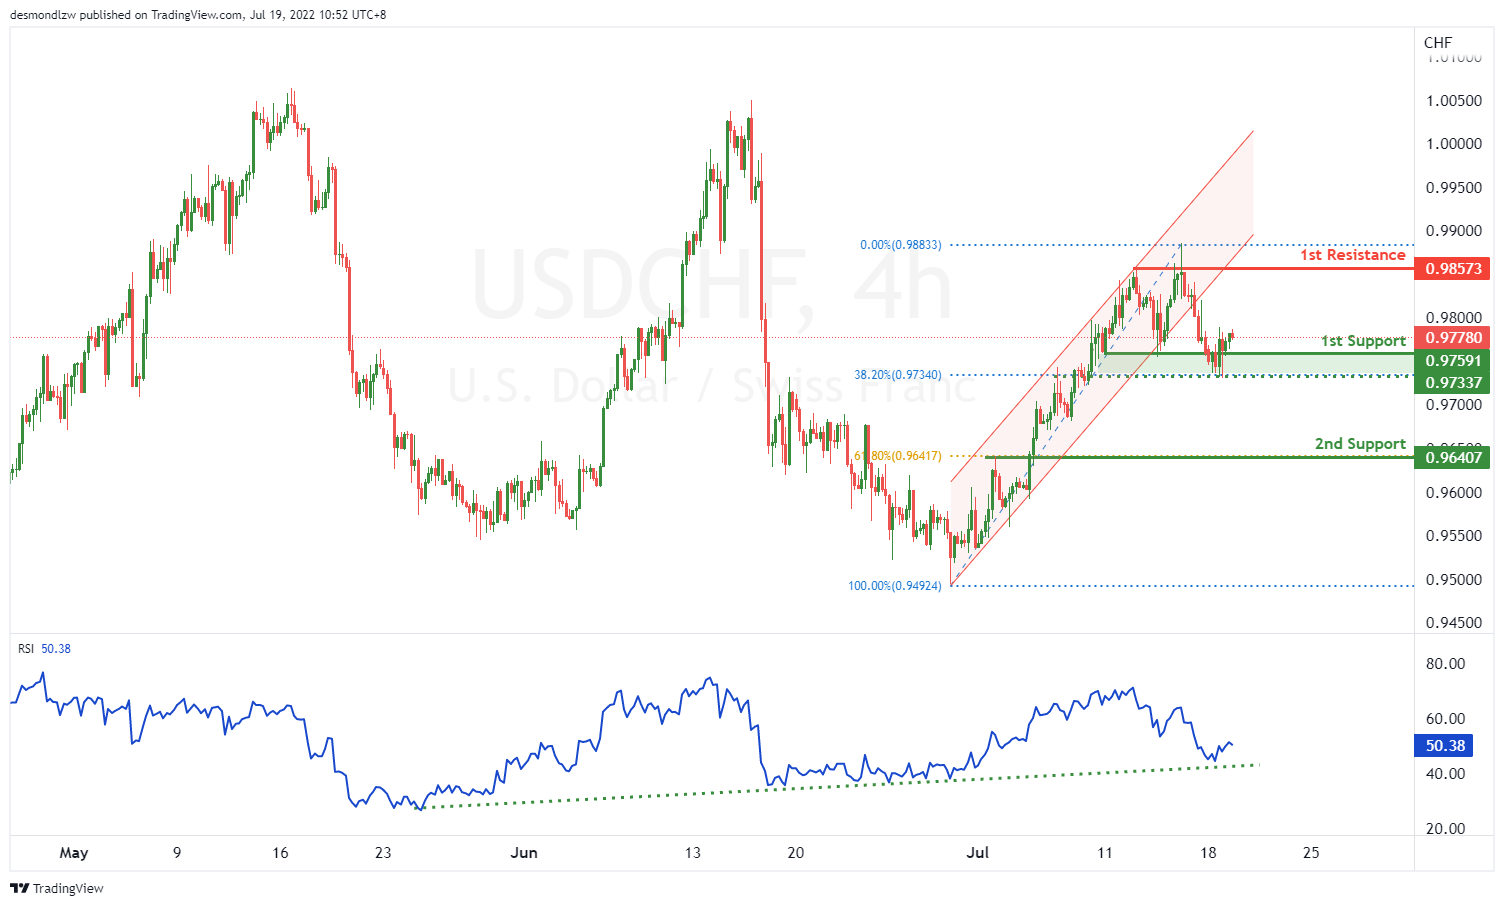
On the H4, with price breaking the bullish channel, we have a bearish bias that price might drop from our 1st support at 0.97591 where the neckline is to our 2nd support at 0.96407 in line with the 61.8% fibonacci retracement. Alternatively, price may not break 1st support and head for 1st resistance at 0.98573 where the multiple swing highs are.
Areas of consideration
- 1st support level at 0.97591
- 2nd support level at 0.96407
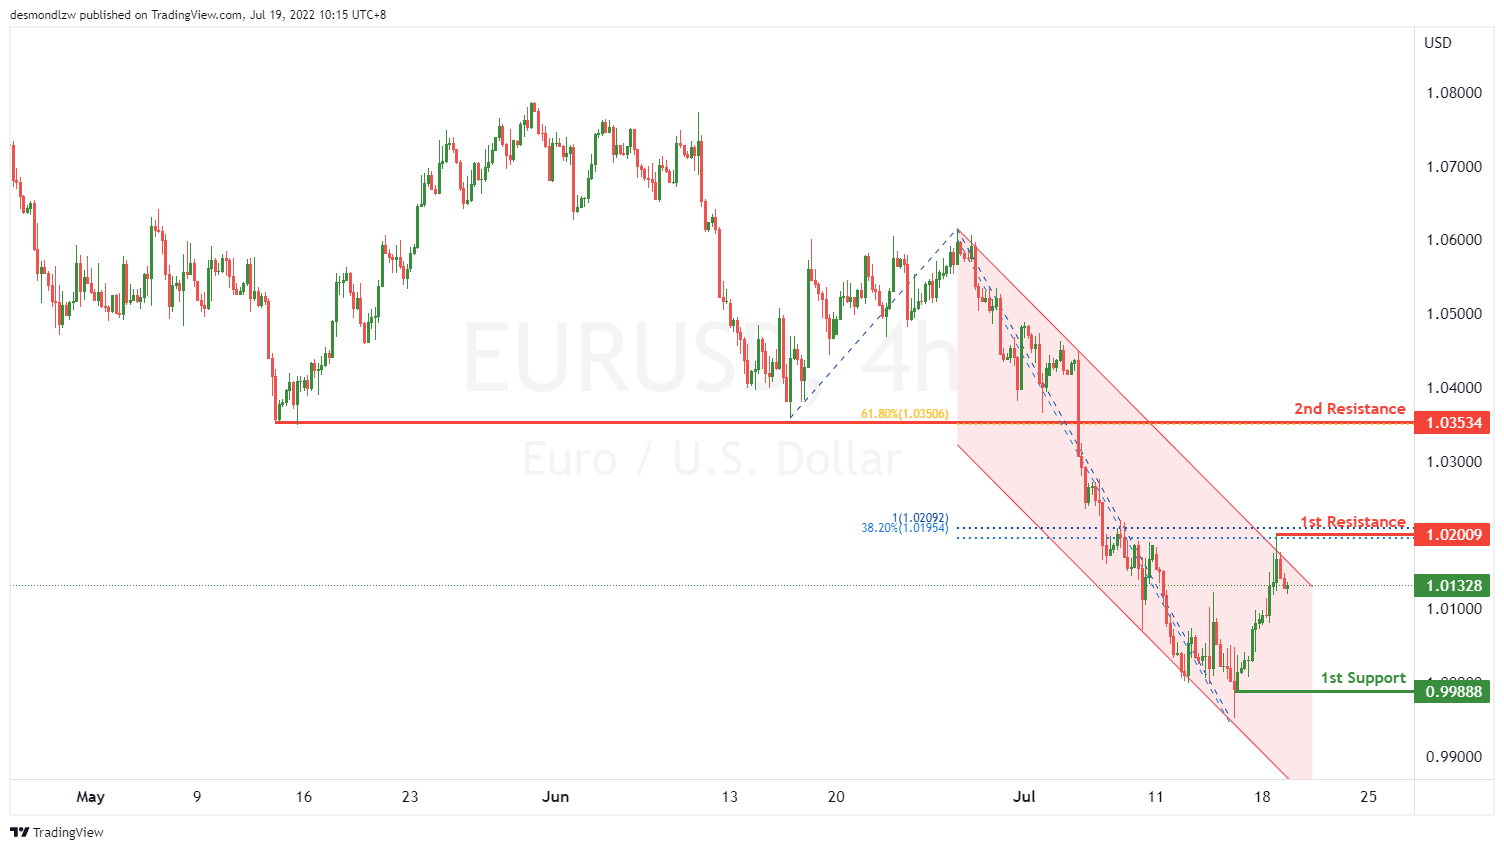
EUR/USD :
On the H4, with price moving within the descending trend channel, we have a bearish bias that price will drop from the 1st resistance at 1.02009 at the swing high in line with the 38.2% fibonacci retracement and 100% fibonacci projection to the 1st support at 0.99888 at the swing low. Alternatively, price may reverse off the 1st resistance and rise to the 2nd resistance at 1.03534 at the overlap resistance in line with the 61.8% fibonacci retracement.
Areas of consideration :
- H4 1st resistance at 1.02009
- H4 1st support at 0.9988
USD/JPY:
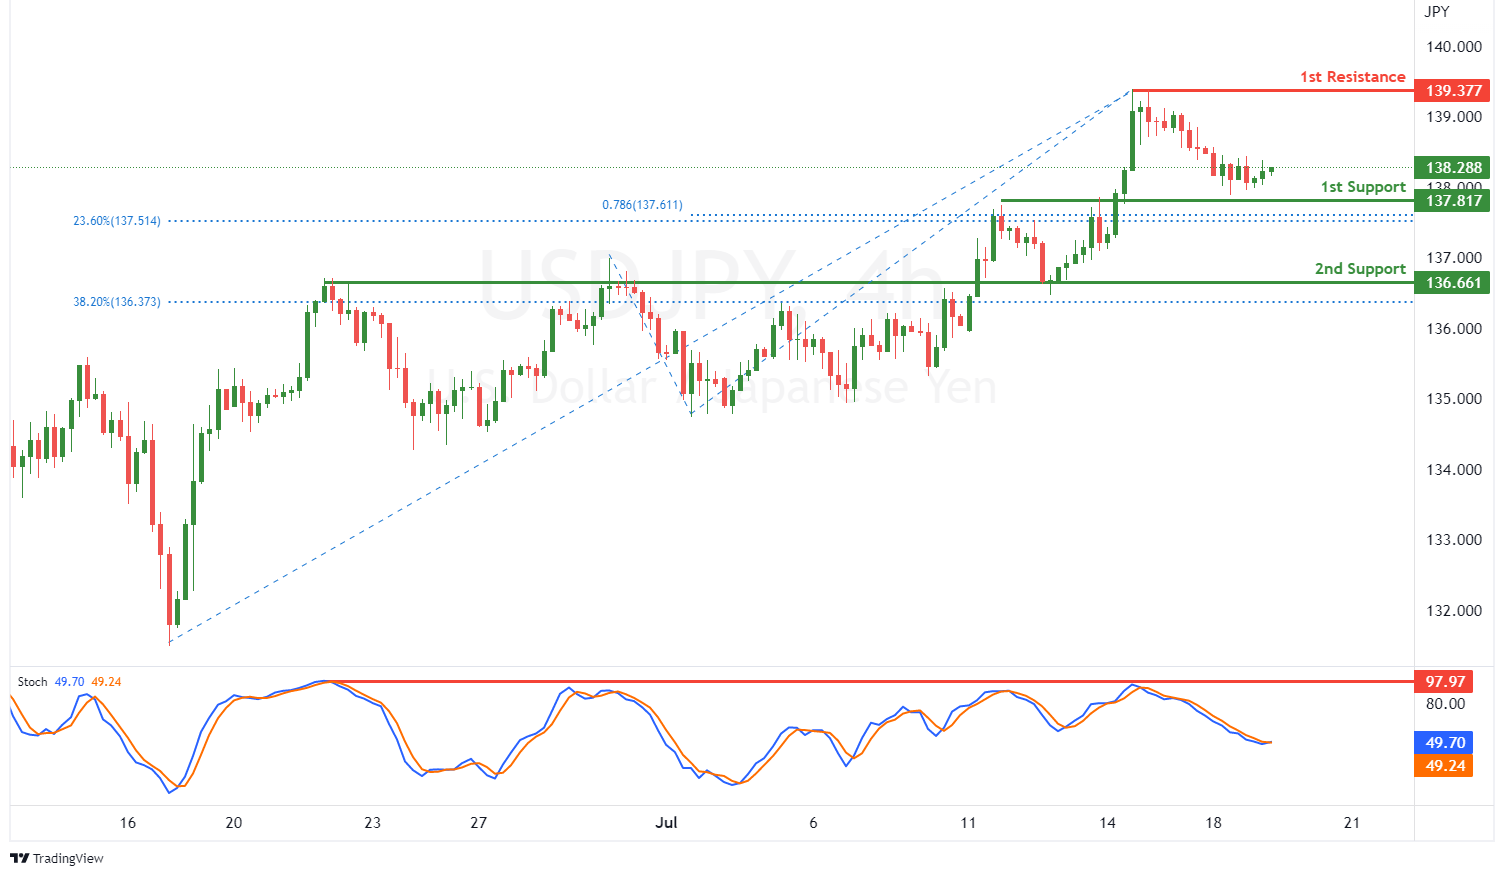
On the H4, with price reversing off stochastic resistance, we have a bearish bias that price will drop to our 1st support at 137.817 where the pullback support, 78.6% fibonacci projection and 23.6% fibonacci retracement. Once there is downside confirmation of price breaking 1st support, we would expect bearish momentum to carry price to 2nd support at 136.661 in line with overlap support and 38.2% fibonacci retracement. Alternatively, price could rise to 1st resistance at 139.377 where the swing high resistance is.
Areas of consideration:
- H4 time frame, 1st resistance at 139.377
- H4 time frame, 1st support at 137.817
AUD/USD:
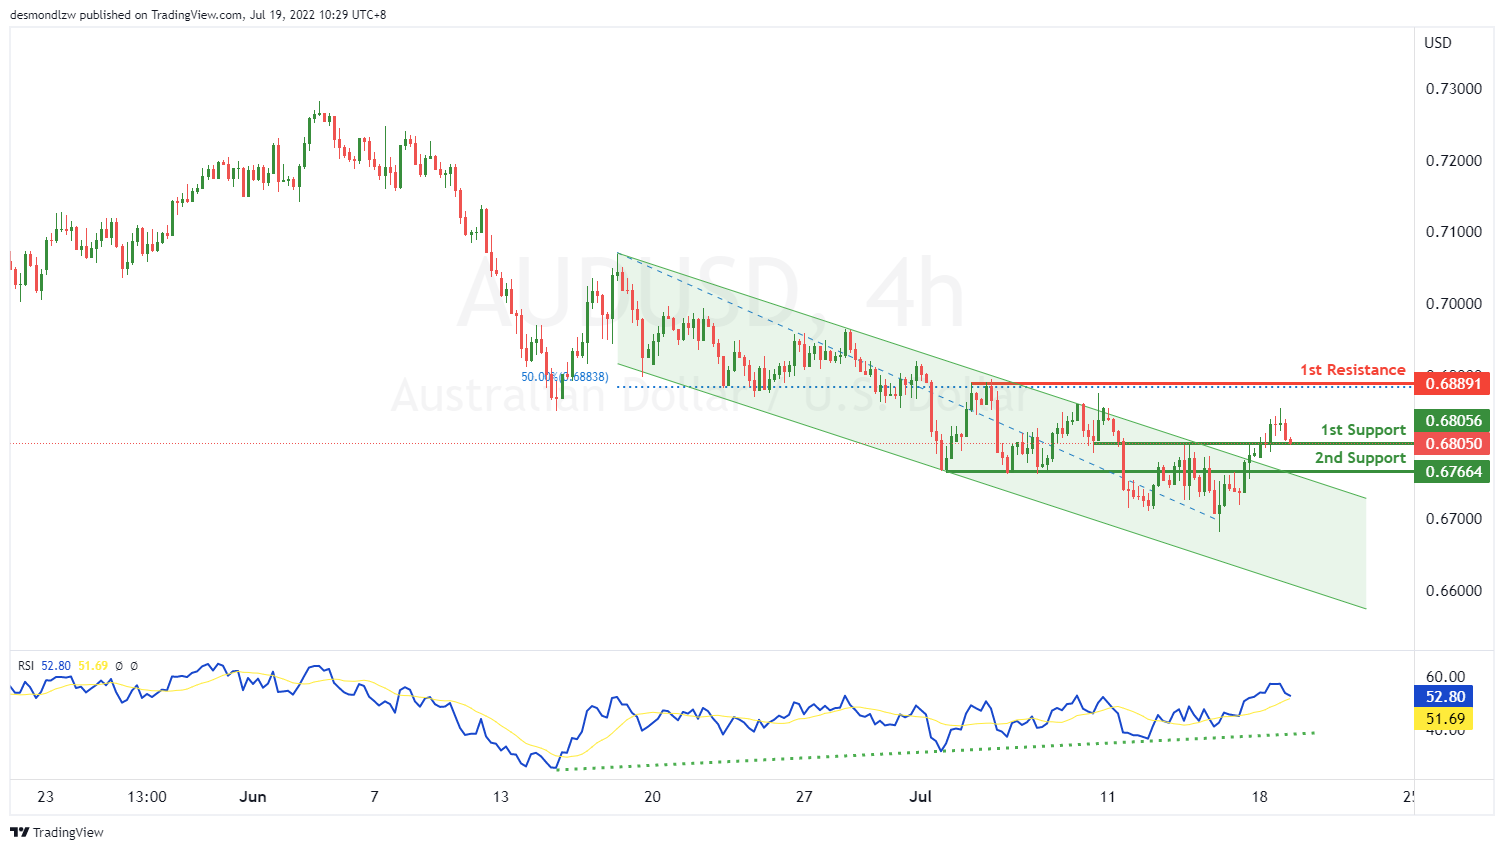
On the H4, with price moving in an ascending trendline on the RSI and price recently breaking the descending trend channel, we have a bullish bias that price will rise from the 1st support at 0.68056 at the pullback support to the 1st resistance at 0.68891 at the swing high in line with the 50% fibonacci retracement. Alternatively, price may break the 1st support and drop to the 2nd support at 0.67664 at the pullback support.
Areas of consideration
- H4 1st resistance at 0.68891
- H4 1st support at 0.68056
NZD/USD:
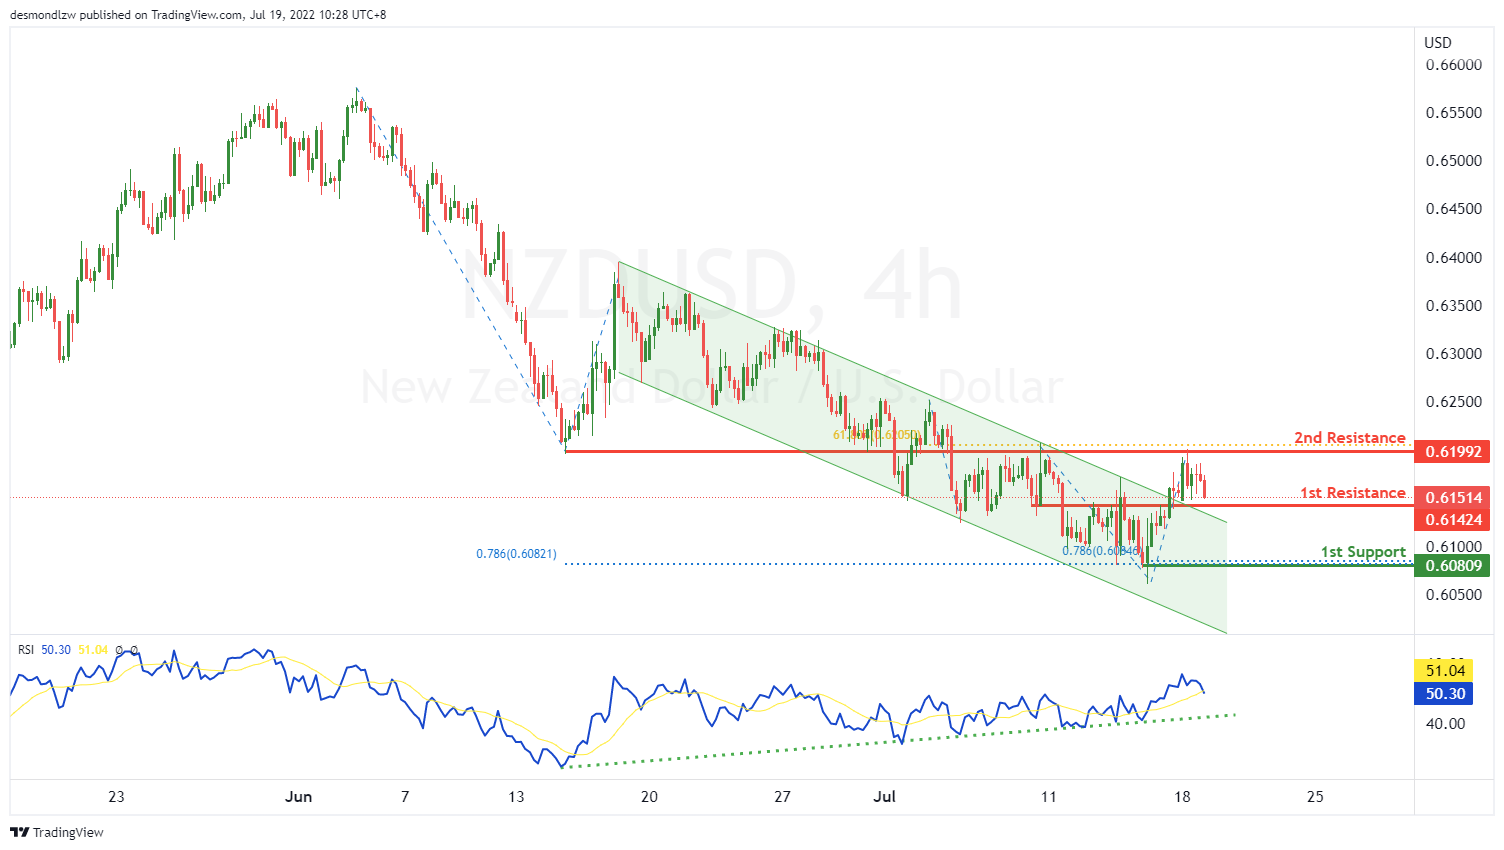
On the H4, with price recently breaking the descending trend channel and price moving in an ascending trendline on the RSI, we have a bullish bias that price will rise from the 1st resistance at 0.61424 at the pullback resistance to the 2nd resistance at 0.61992 at the overlap resistance in line with the 61.8% fibonacci retracement. Alternatively, price may reverse off the 1st resistance and drop to the 1st support at 0.60809 at the swing low in line with the 2 78.6% fibonacci projections.
Areas of consideration:
- H4 time frame, 1st support at 0.60809
- H4 time frame, 1st resistance at 0.6142
USD/CAD:
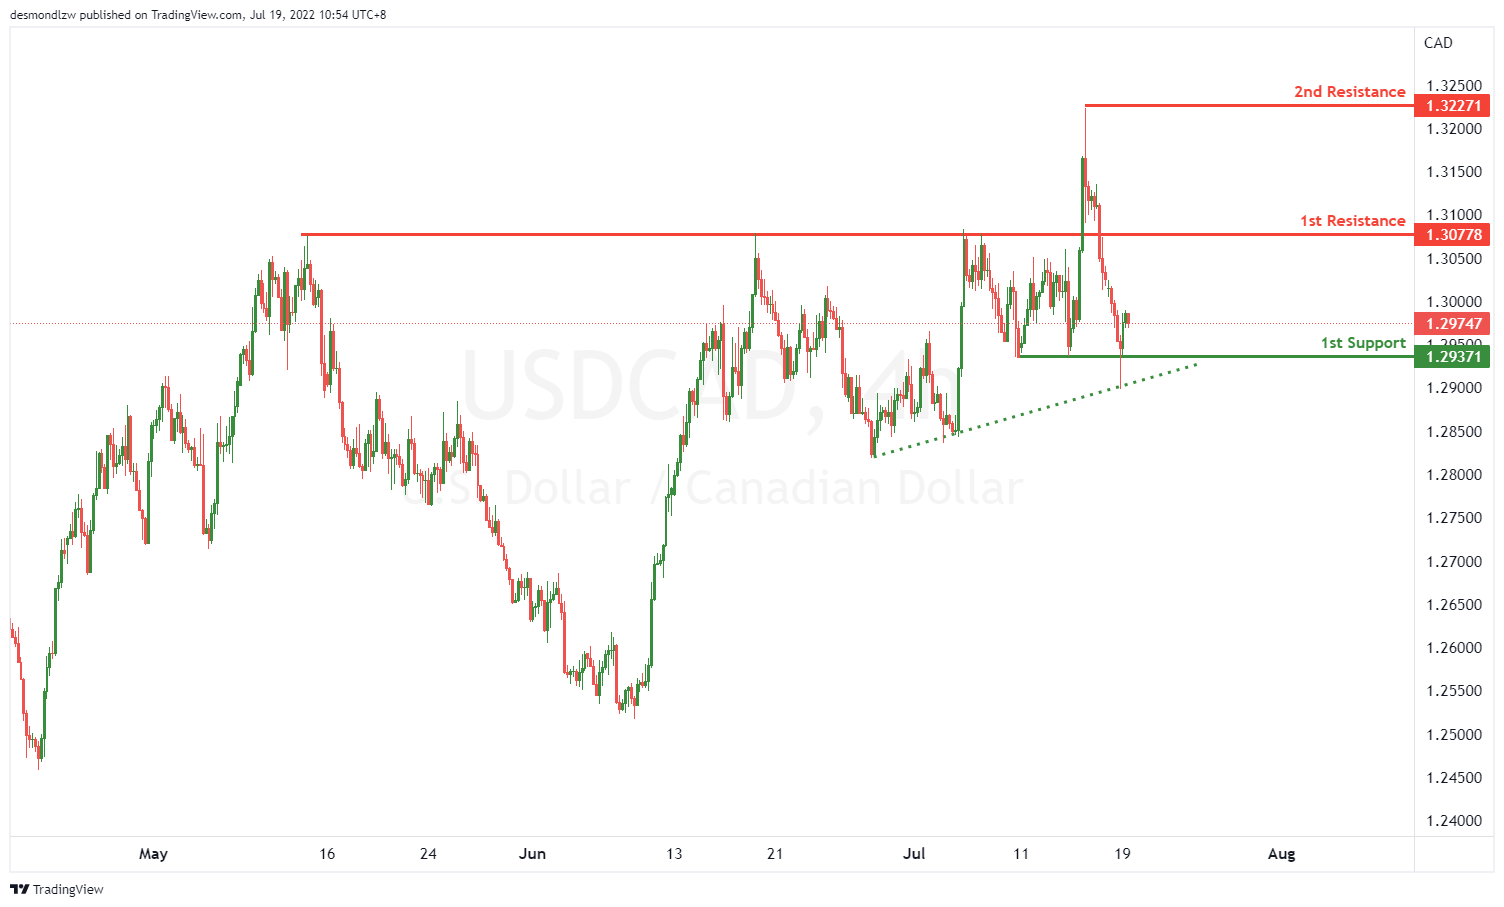
On the H4, with price moving in an ascending trendline, we have a bullish bias that price will rise from our 1st support at 1.29371 where the overlap support is to the 1st resistance at 1.30778 in line with the multiple swing highs resistance. Alternatively, price may break the resistance structure at the 1st resistance and rise to the 2nd resistance at 1.32271 at the swing high.
Areas of consideration:
- H4 time frame, 1st resistance at 1.30778
- H4 time frame, 1st support at 1.29371
OIL:
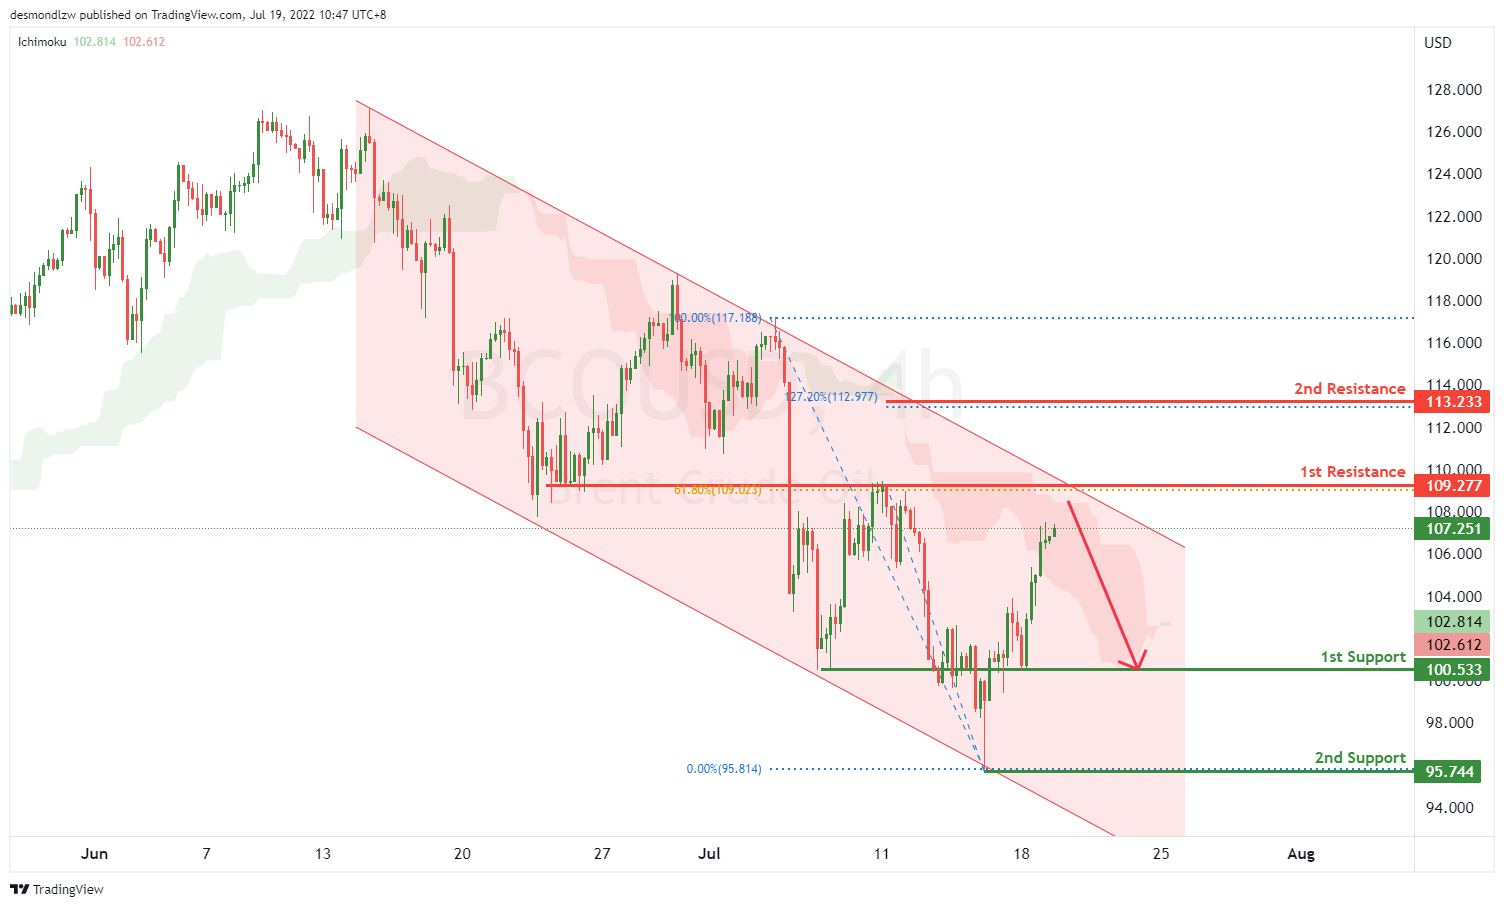
On the H4, with price moving along the descending channel and testing the overlap resistance, we have a bearish bias that price will drop to our 1st support at 100.463. Once there is downside confirmation of price breaking 1st support, we would expect bearish momentum to carry price to 2nd support at 95.744 where the swing low support is. Alternatively, price may rise to 1st resistance at 109.277 in line with 61.8% fibonacci fibonacci retracement. Should price break 1st resistance, we would have a bullish bias that price would rise to 2nd resistance at 113.233 where the 127.2% fibonacci retracement is.
Areas of consideration:
- H4 time frame, 1st resistance of 109.277
- H4 time frame, 1st support of 100.533
Dow Jones Industrial Average:
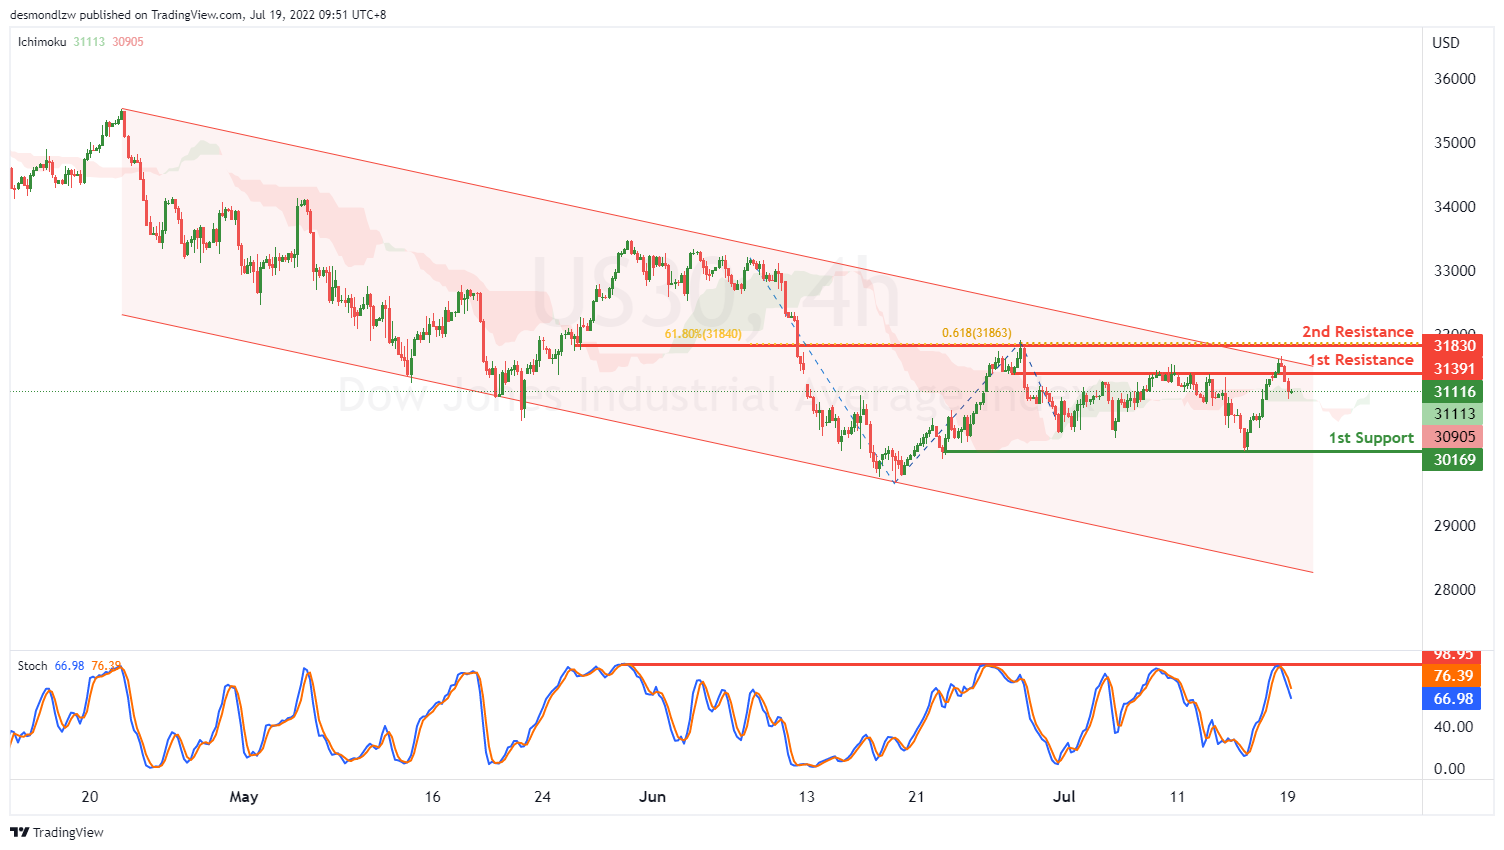
On the H4, with price moving in a descending trend channel and stochastics showing price recently reversing off the resistance level, we have a bearish bias that price will continue to drop from the 1st resistance at 31391 at the overlap resistance to the 1st support at 30169 at the swing low. Alternatively, price may reverse off the 1st resistance and rise to the 2nd resistance at 31830 at the overlap resistance in line with the 61.8% fibonacci retracement and 61.8% Fibonacci projection.
Areas of consideration:
- H4 time frame, 1st resistance of 31391
- H4 time frame, 1st support of 30169
Elliott Wave View: GBPUSD Rally Should Fail in 3, 7, 11 Swing
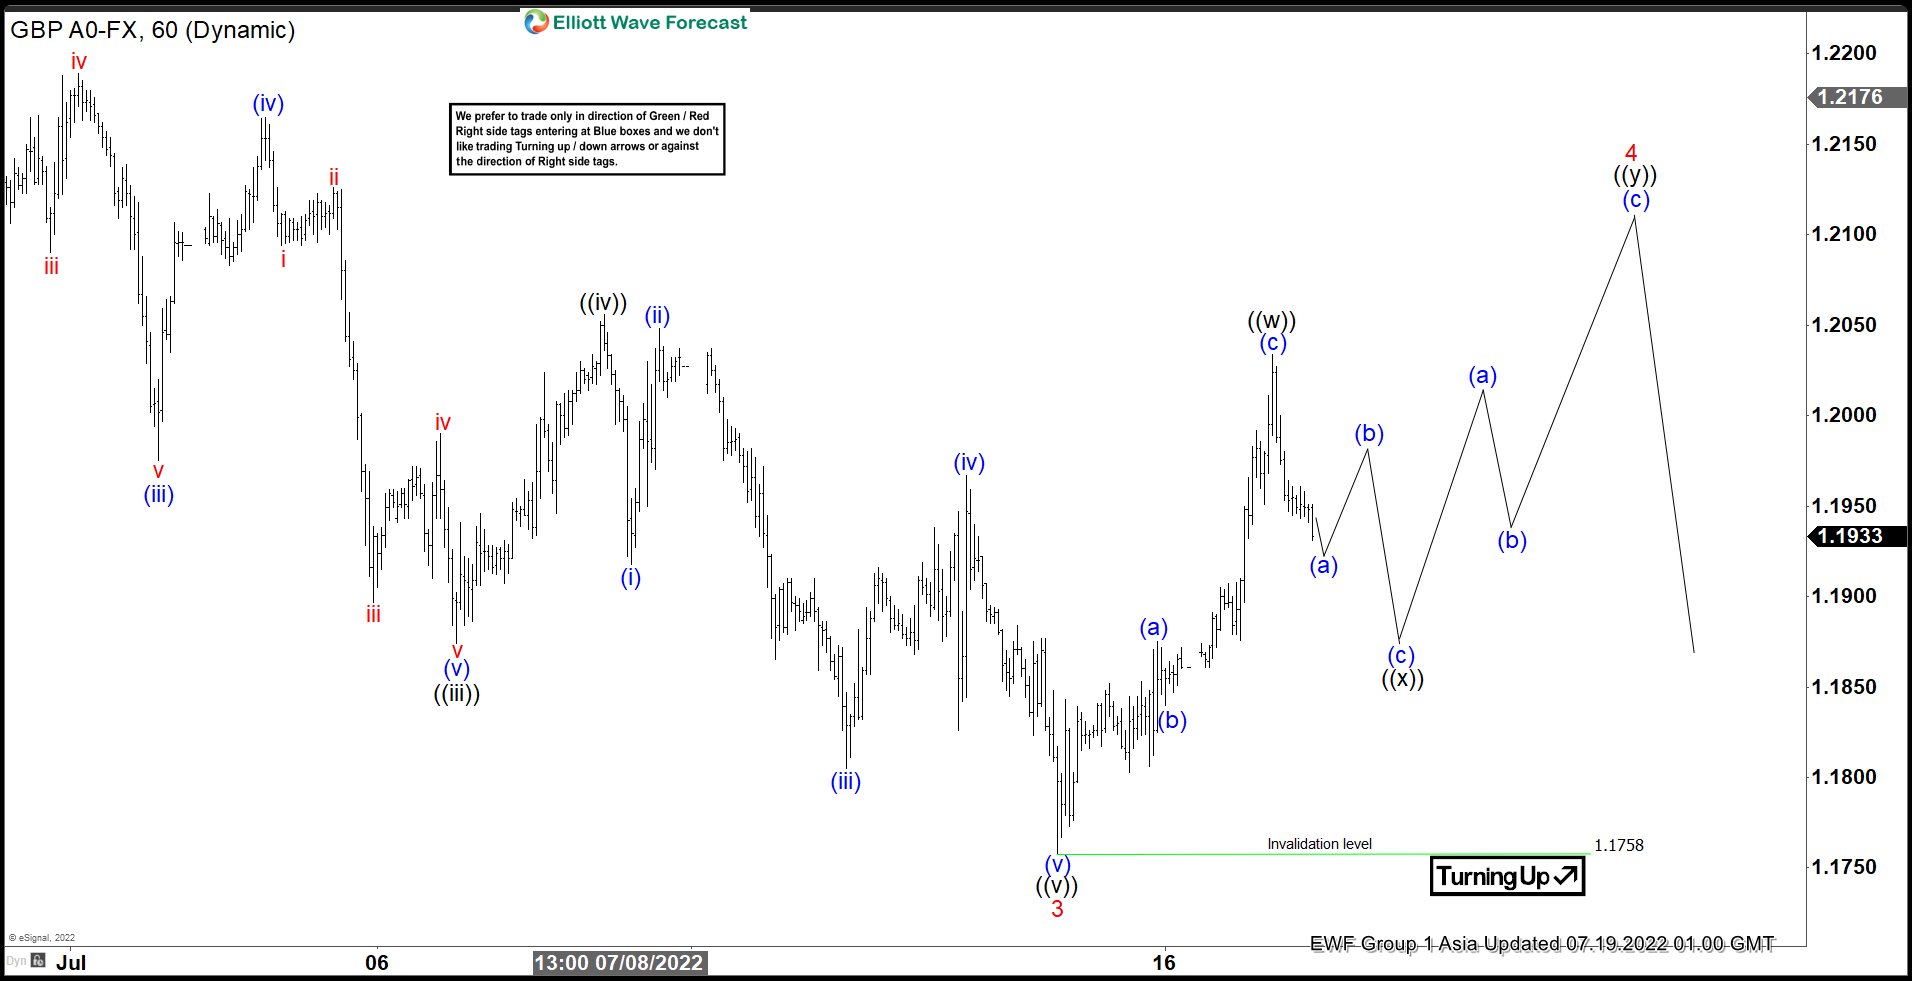
Short term Elliott Wave view in GBPUSD suggests the decline from 5/27/2022 peak is unfolding as a 5 waves impulse Elliott Wave structure. Down from 5/27/2022 peak, wave 1 ended at 1.1932 and rally in wave 2 ended at 1.2407. Pair then resumes lower in wave 3 which ended at 1.1758 as the 1 hour chart below shows. Wave 4 is currently in progress to correct cycle from 6/17/2022 peak before the decline resumes.
Internal of wave 4 is proposed to be taking the form of a double three Elliott Wave structure. A double three is a 7 swing structure or sometimes also called a double zigzag. It’s a complex correction where two zigzags are joined together. Up from wave 3, wave (a) ended at 1.1875, and pullback in wave (b) ended at 1.184. Pair then resumed higher in wave (c) which ended at 1.2034. This is the first zigzag and ended wave ((w)) in larger degree. Pullback in wave ((x)) is in progress now in 3, 7, or 11 swing and while the dips stay above 1.1758, pair can then see another leg higher in wave ((y)) as the second zigzag. Potential target for wave ((y)) can be measured later once wave ((x)) is fully formed as 100% – 161.8% Fibonacci extension of wave ((w)), projected from wave ((x)) low.
GBPUSD 60 Minutes Elliott Wave Chart
EURCHF Wave Analysis
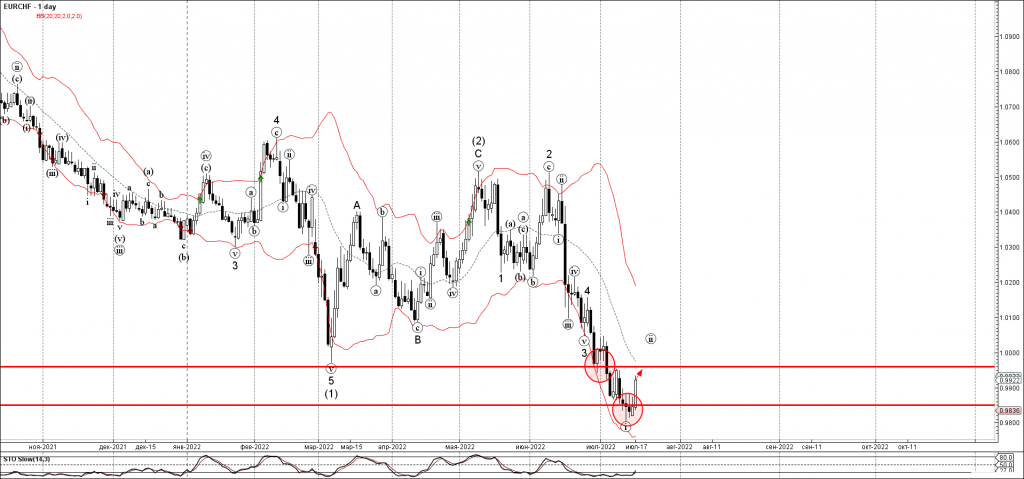
- EURCHF reversed from support area
- Likely to rise to resistance level 0.9960
EURCHF currency pair recently reversed up from the support area located between the key support level 0.9850 and the lower daily Bollinger Band.
The upward reversal from this support area started the active minor corrective wave (ii) – which belongs to waves 2 and (2) from June and May respectively.
Given the improving euro sentiment, EURCHF can be expected to rise further toward the next resistance level 0.9960 (former multi-month support from March).
Brent Wave Analysis
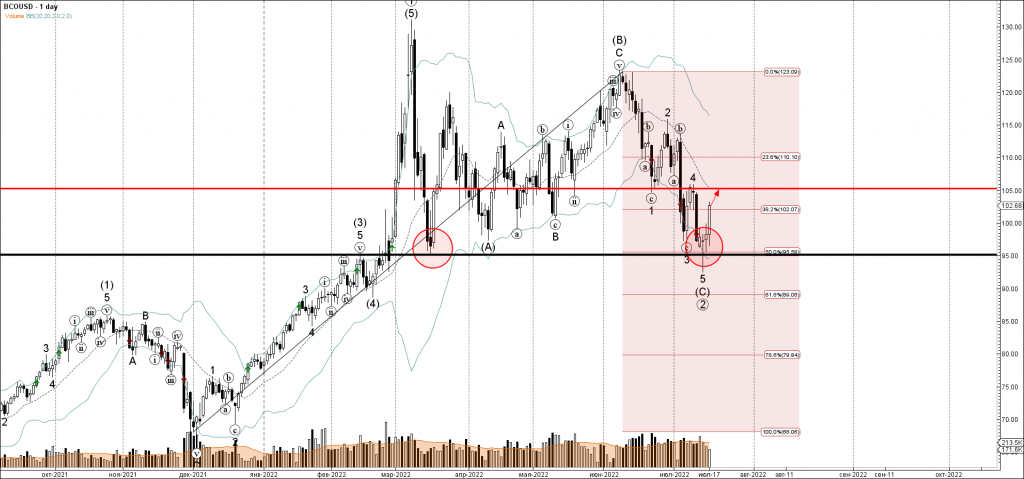
- Brent reversed from support area
- Likely to rise to resistance level 105.00
Brent crude oil recently reversed up from the support area located between the key support level 95.00 (former monthly low from March), lower daily Bollinger Band and the 50% Fibonacci correction of the upward impulse from December.
The upward reversal from this support area started the active intermediate impulse wave (1).
Given the clear daily uptrend, Brent crude oil can be expected to rise further toward the next resistance level 105.00 (top of wave 4 and low of wave 1 from June).
Eco Data 7/19/22
[php_everywhere instance="1"]
NZD Jumps on Strong Inflation But Unlikely to be for Long
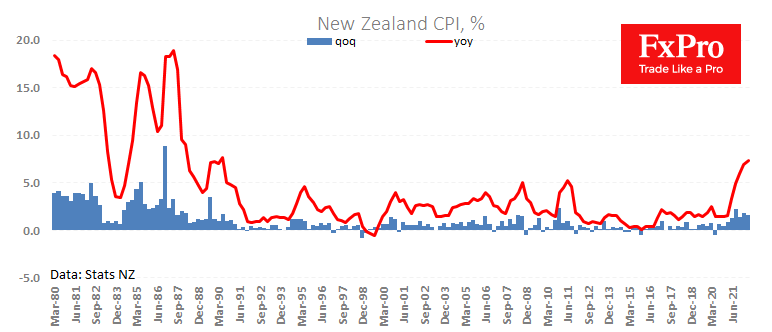
The annual inflation rate in New Zealand accelerated to 7.3%, a new high since 1990 and above average forecasts for 7.1%. The quarterly price growth of 1.7% also remains elevated, showing no deceleration in the last quarter.
Short-term inflation figures above expectations have triggered a “classic” strengthening of NZD buying. However, we believe that the market played the kiwi higher, relying on the heightened risk appetite that prevailed in the morning rather than on fundamentals.
The RBNZ still missed its chance to catch up with the pace of Fed policy tightening, as at the July 13 meeting, they raised their rate by 50 points, which is lower than the 75 points by which the Fed raised their rate. It is widely priced in by markets that both central banks will repeat their steps next time. Additionally, the next Fed meeting is in 9 days versus 30 days for the RBNZ, which widens the yields differential even more.
The kiwi is now locally overbought in the dollar, which forms a pullback in risky assets, and traders use fundamental news to take profits from the previous strong move.
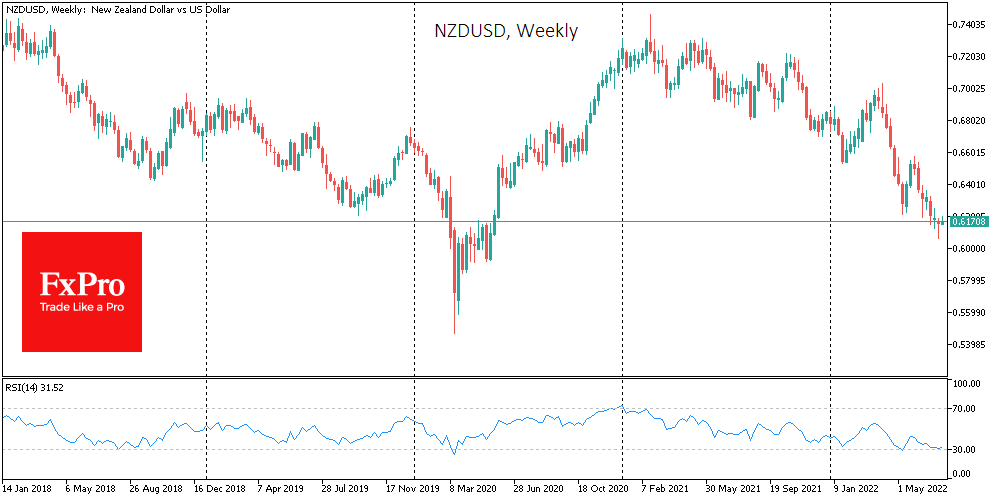
As part of the rebound gaining momentum, it is worth paying attention to the dynamics of the pair NZDUSD near 0.7200, the level of the previous local lows. An active rise in the pair above these levels would indicate that we are seeing a broader recovery rather than a local rebound. But that will require a global dollar retreat and a sustained reversal of the markets to the upside. For now, we see a bear market with regular bounces.
China Macro Monitor – Strong Headwinds from Property, Covid and Global Recession Risks
Outlook. We lower our GDP forecast for 2022 to 2.7% (from 3.7%) while keeping the 5.7% forecast for 2023. The economy recovered in June in a post-lockdown rebound. However, China is facing renewed headwinds from rising property stress and weakening US and euro demand. Q2 GDP was weaker than we expected falling 2.6% q/q. Uncertainty over new possible covid restrictions takes a big toll on private consumption and small businesses and the arrival of the more contagious Omicron variant BA.5 is adding to the uncertainty. The main impetus to growth comes from stimulus, not least the part related to infrastructure.
China today
- Growth. PMIs rebounded further in June and the credit impulse is robust. Retail sales increased in June but is still weak. Confidence is very low. The property sector is still in a deep crisis and stress among developers has increased again lately.
- Inflation. PPI inflation declined further to 6.1% in June coming from 13.5% in October. CPI inflation is edging higher to 2.5% in June from 2.1% in May, but still below the 3% target.
- Monetary policy. PBoC has kept the RRR rate unchanged since April. China is reluctant to cut rates and prefers fiscal policy to underpin growth. M1 growth is still weak.
- CNY. The yuan is still stable against USD after weakening in May.
- Stock markets. Stocks declined lately on renewed concerns over the property sector and covid. The China USD offshore high yield rate has pushed higher to almost 26%.
- For more China research, see our website here
July Flashlight for the FOMC Blackout Period
Summary
- The FOMC appears poised to raise its target range for the federal funds rate by at least 75 bps at its next meeting on July 27. The 372K increase in nonfarm payrolls in June indicates that the economy is holding up reasonably well at present. Furthermore, inflation remains forefront in the minds of most FOMC members as CPI inflation jumped to 9.1% in June from 8.6% in May.
- The forecast that we published last week, which was made in the immediate aftermath of the higher-than-expected inflation data for June, looks for a 100 bps rate hike on July 27.
- Most Committee members indicate a desire to get the fed funds rate to "neutral" as soon as possible. Many members believe that policy needs to get into "restrictive" territory to wring inflation out of the economy. We reasoned that a 100 bps rate hike would get the fed funds rate to neutral and close to restrictive in an expeditious fashion.
- We think 100 bps will be on the table on July 27, but data on real economic activity in June that were released after we published our forecast make the case for a supersized rate hike less compelling. These data reinforced previously published data that point in the direction of economic deceleration.
- Furthermore, comments by Fed officials at the end of last week suggest that a rate increase of 100 bps may be a bit too aggressive for many FOMC members. Therefore, we acknowledge that the FOMC may indeed opt to raise rates by "only" 75 bps.
- As is customary for the July meeting, an updated Summary of Economic Projections will not be released on July 27. Therefore, the Committee will be limited to the post-meeting statement and Chair Powell's press conference as mediums through which to express its future policy intentions. We expect that the statement will continue to express concern over inflation, and Chair Powell likely will echo these concerns in his press conference.
- But will the statement and/or Chair Powell make any reference to recent signs of economic deceleration? If so, then the Committee may be signaling that a slower pace of policy tightening may be appropriate in coming meetings.
- With inflation continuing to climb faster than expected, the FOMC remains squarely focused on the price stability side of its mandate. Before taking its foot off the brake, Chair Powell has made clear the Committee will need to see a series of declining inflation readings.
- But once inflation does begin to moderate, how low does the FOMC need to see it go, and at what cost to the labor market, before the Committee stops tightening? Based on prior tightening cycles and the blistering pace of inflation at present, we suspect core PCE inflation would need to slow to at least a 3% pace, even if that brings higher unemployment.
A Supersized 100 bps Rate Hike Will Be on the Table on July 27
At the beginning of the last FOMC "blackout period," which began on Saturday, June 4, market participants were widely expecting a 50 bps rate hike at the conclusion of the policy meeting on June 15. However, higher-than-expected CPI inflation data for May, which were released on Friday, June 10, changed the narrative. The 1.0% monthly increase in the overall consumer price index pushed the year-over-year rate of CPI inflation up to 8.6%, which was 0.3 percentage points higher than the consensus forecast. In the wake of the hotter-than-expected inflation data, news reports began to circulate that a 75 bps rate hike would be under active consideration at the upcoming FOMC meeting. Market expectations immediately reset, and a few days later the Committee did indeed raise its target range for the federal funds rate by 75 bps.
Another rate hike of at least 75 bps seems like a sure bet for the July 27 FOMC meeting. Nonfarm payrolls rose by 372K in June, which was markedly stronger than the consensus forecast, suggesting that the economy is holding up reasonably well. Moreover, Fed officials seem to be comfortable with another 75 bps rate hike. Federal Reserve Governor Christopher Waller said on July 7 that "I am definitely in support of doing another 75 basis point hike in July." St. Louis Fed President Bullard, who is a voting member of the Committee this year, stated that a 75 bps rate hike at the upcoming FOMC meeting "would make a lot of sense." The need to move by at least 75 bps was reinforced by the CPI data for June that printed on July 13. As shown in Figure 1, the CPI shot up another 1.3% in June, pushing the year-over-year rate up to 9.1%. Not only was the headline rate of CPI inflation significantly higher than the consensus forecast, but as we discussed in our write-up of the data, price increases were widespread.
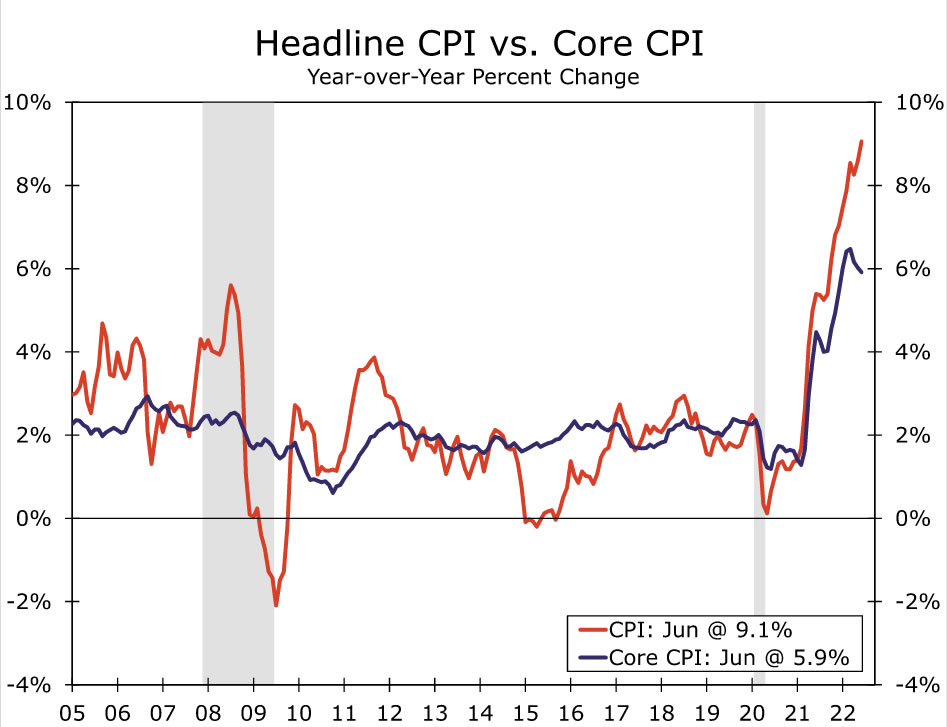
The disturbing price data made Fed officials even more concerned about the inflation outlook. Atlanta Fed President Bostic, who is not a voting member this year but who participates in the Committee's deliberations, said that "the top-line number is a source of concern." When asked if the higher-than-expected inflation data could lead the Committee to hike rates by 100 bps on July 27, Bostic replied "everything is in play." Cleveland Fed President Mester (a voting member this year) characterized the June CPI data as "uniformly bad" and added that she saw no reason for moving less than the Committee did in June when it raised rates by 75 bps. The combination of higher-than-expected inflation and its widespread nature led us to change our forecast of a 75 bps rate hike to 100 bps, which we discussed in more detail in the monthly U.S. Economic Outlook that we published last week.
Most Fed officials have expressed the need to get back to "neutral," which is the level of the federal funds rate that is neither stimulating the economy nor restraining it, as soon as possible. Although precisely estimating neutral is highly difficult in real time, many FOMC members currently estimate that it is somewhere around 2.50%. Lifting the fed funds rate by 100 bps on July 27 would take the target range to 2.50%-2.75%, which would be in the vicinity of most estimates of neutral. In our view, the higher-than-expected inflation data for June reinforced the need for haste in getting to a neutral policy rate.
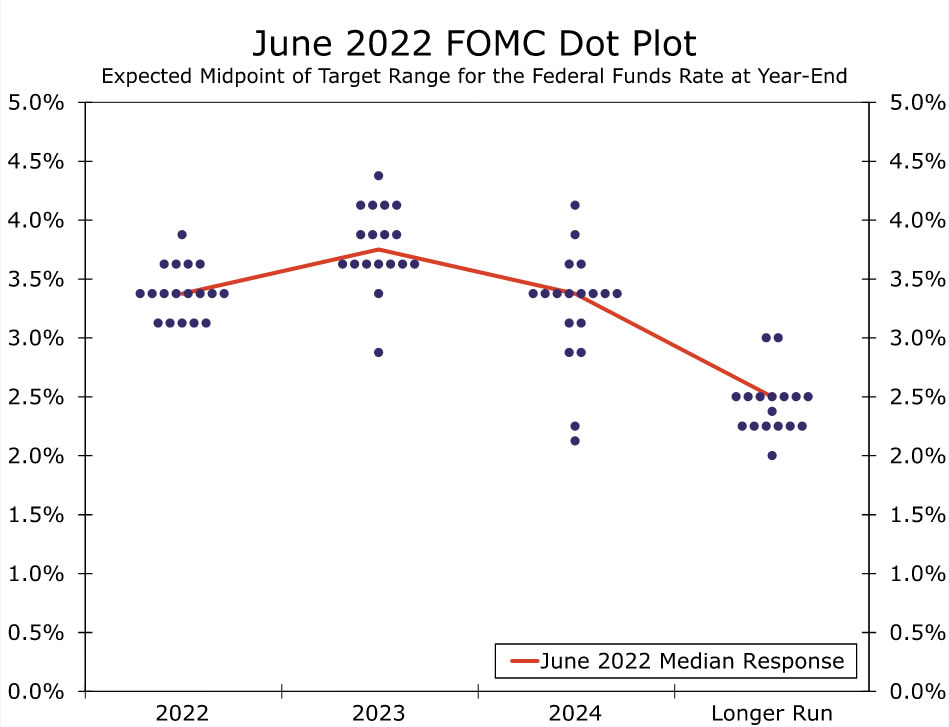
Additionally, many policymakers believe that rates will eventually need to move into "restrictive" territory, which implies further tightening at upcoming FOMC meetings. The dot plot that was released after the June FOMC meeting showed that many Committee members thought that a fed funds target range of 3.25%-3.50% would be appropriate at the end of 2022 with further tightening needed next year (Figure 2). Although a dot plot will not be released following the meeting on July 27, it seems reasonable to us that a more expeditious rise into restrictive territory would be appropriate in light of the recent inflation data.
We believe that a supersized rate hike of 100 bps will be on the table on July 27, but developments since we published our most recent forecast have raised the probability that the Committee opts for a smaller increase of "only" 75 bps. Retail sales in June rose by a strong 1.0% relative to the previous month. But the headline rate was flattered by the sharp increase in good prices in June. On a real basis, retail spending likely edged lower in June. Industrial production declined 0.2% in June relative to the previous month, and May's increase of 0.2% was revised lower to flat on the month. Long-term inflation expectations as measured in the University of Michigan's Survey of Consumer Sentiment, which was cited by Chair Powell as a reason for opting for the larger-than-guided 75 bps hike in June, retreated from 3.1% in June to 2.8% in July.
Moreover, official commentary at the end of last week indicates that many FOMC members seem to think that a rate increase of 100 bps may be a bit too aggressive. Atlanta Fed President Bostic walked back his previous comments by suggesting that he would not favor a 100 bps rate increase. Governor Waller left the door open to a 100 bps rate hike but indicated that he favors 75 bps, while St. Louis Fed President Bullard also played down the notion of an increase of 100 bps. As of this writing, markets are priced for a 20% probability of a 100 bps increase and an 80% probability of a 75 bps rate hike. But news stories during the last blackout period re-calibrated market expectations for the outcome of the June FOMC meeting. Market participants will be on high alert in the days ahead for news stories that are meant to guide expectations ahead of the July 27 policy meeting.
How Will the FOMC Characterize the State of the Economy?
The FOMC releases its Summary of Economic Projections (SEP), in which it summarizes its macroeconomic forecasts, four times a year: March, June, September and December. Because a SEP will not be released on July 27, the Committee will be limited to its post-meeting statement and to Chair Powell's press conference as mediums through which it can signal its future policy intentions. Inflation was largely the focus of the statement that was issued at the conclusion of the June 15 FOMC meeting. Specifically, the statement noted that "the Committee is highly attentive to inflation risks." In contrast, policymakers did not appear to be overly concerned about economic growth, noting that "overall economic activity appears to have picked up after edging down in the first quarter."
We expect inflation will remain the focus of the post-meeting statement on July 27, and Chair Powell likely will stress during his press conference that the Committee remains committed to meeting its 2% inflation target "over the longer run." But will the statement, as well as Chair Powell, make any reference to signs of slower growth?
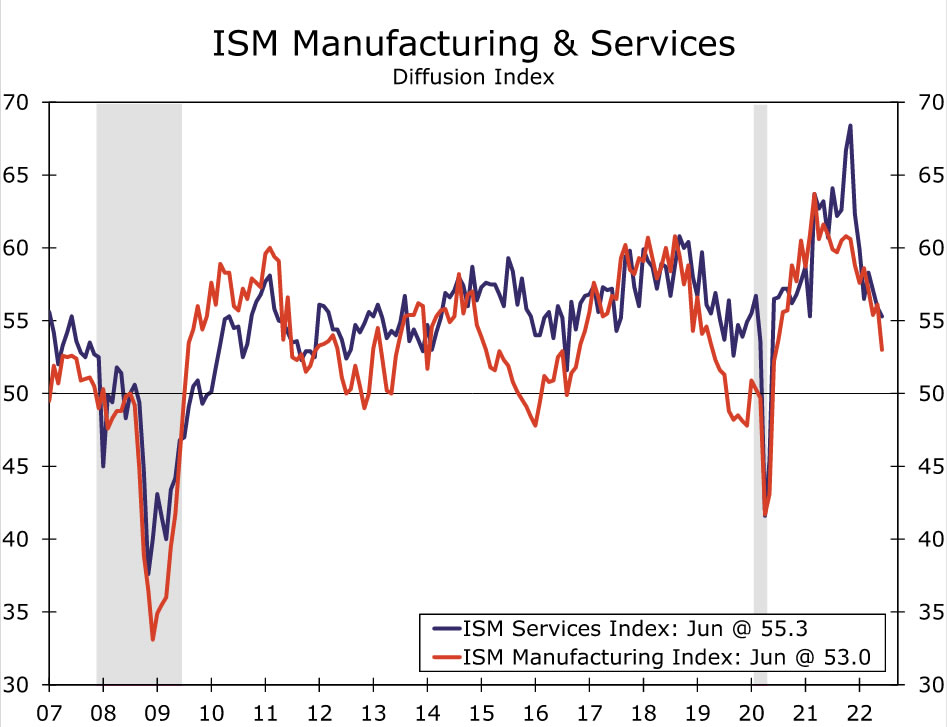
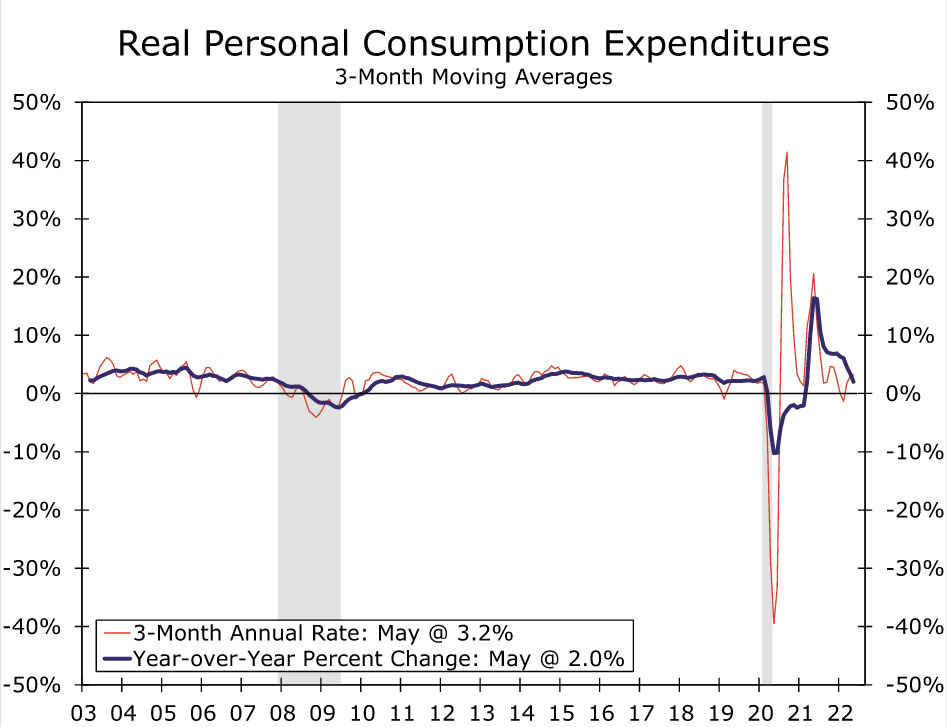
The 372K jobs that were created in June suggest that the economy is holding up reasonably well at present. But as discussed previously, there have also been some unmistakable signs of economic deceleration. In addition to the indicators noted above, the ISM indicies for the manufacturing and service sectors have both receded in recent months, although both remain above 50, which is the demarcation separating expansion from contraction (Figure 3). Real consumer spending has decelerated sharply in recent months (Figure 4), and consumer confidence has taken a nosedive. The headline rate of real GDP growth likely was sluggish and may even have been negative again in the second quarter. Will signs of slowing economic growth be noted more in the statement following the July 27 meeting than they were on June 15? If they are, then the Committee may be signaling that a slower pace of tightening may be appropriate at upcoming meetings. But even if the FOMC opts to raise rates by 75 bps in July and then downshifts to 50 bps in September, it would still represent a remarkably aggressive pace of rate hikes since March, exemplifying the seriousness with which the FOMC is approaching the inflation problem.
Searching for Reaction Function Clues
The Federal Reserve is tasked with achieving the two goals of its dual mandate: full employment and price stability. Both of these goals are paramount for monetary policymakers. But, depending on macroeconomic conditions, FOMC officials may focus more on one half of the mandate when making policy decisions at any given time. For example, when the COVID-19 pandemic first struck the United States and the unemployment rate skyrocketed to levels not seen since the Great Depression, the Federal Reserve took unprecedented steps to support the economy and labor market. In other words, the FOMC seemed to be putting more weight on the employment part of its mandate than on the inflation part. More recently, historically high inflation has pushed FOMC officials to tighten monetary policy aggressively and with a fervor that has not been seen in decades. It seems as if the Committee is focused almost entirely on its inflation mandate at present.
Of course, over the longer-run the two prongs of the mandate are in harmony. Longer-run price stability is key to longer-run full employment and vice versa. But, as John Maynard Keynes famously said, "in the long-run we are all dead," and achieving the correct policy prescription in real time is highly difficult. To that point, it has been remarkable how much consensus there has been among FOMC participants in recent months given this rapid shift in Fed policy. As recently as early March the federal funds rate was near 0% and asset purchases were just coming to a close. Fast-forward a bit more than four months and quantitative tightening is underway and the federal funds target range is poised to be 2.25%-2.50% if the FOMC hikes by 75 bps, or 2.50%-2.75% if it chooses a more aggressive 100 bps rate increase.
The relative harmony among FOMC participants over the past few months makes more sense when viewed through the lens of macroeconomic conditions and the current stance of monetary policy. The unemployment rate has remained exceptionally low in recent months, employment growth has been robust and CPI inflation touched yet another cycle-high in July. Against this backdrop, the case for moving monetary policy away from its highly accommodative stance has been a fairly straightforward one. Put another way, everyone is a hawk when inflation is running at 9%, the unemployment rate remains near a five-decade low and the effective federal funds rate is still well below most estimates of "neutral." However, moving forward we expect the FOMC to face an increasingly difficult task, and this in turn could lead to a more nuanced reaction function. Quashing elevated inflation clearly remains the top priority before the FOMC. But, just how far into restrictive territory does the federal funds rate need to go to achieve that goal? And at what cost to the labor market?
Before taking its foot up off the brake, the Fed will need to see a moderation in actual inflation. At Chair Powell's last post-meeting press conference, he shared that the Committee would like to see "compelling evidence" that inflation is slowing in the form of a "series of declining monthly" rates. That directional shift has yet to start, let alone cement itself. Once it does, we suspect the FOMC will tighten policy more slowly given that policy would likely already be in restrictive territory and officials will presumably want to see how the medicine is taking. However, we believe it will take more than just directional improvement in inflation for the Fed to stop tightening altogether given the elevated starting point.
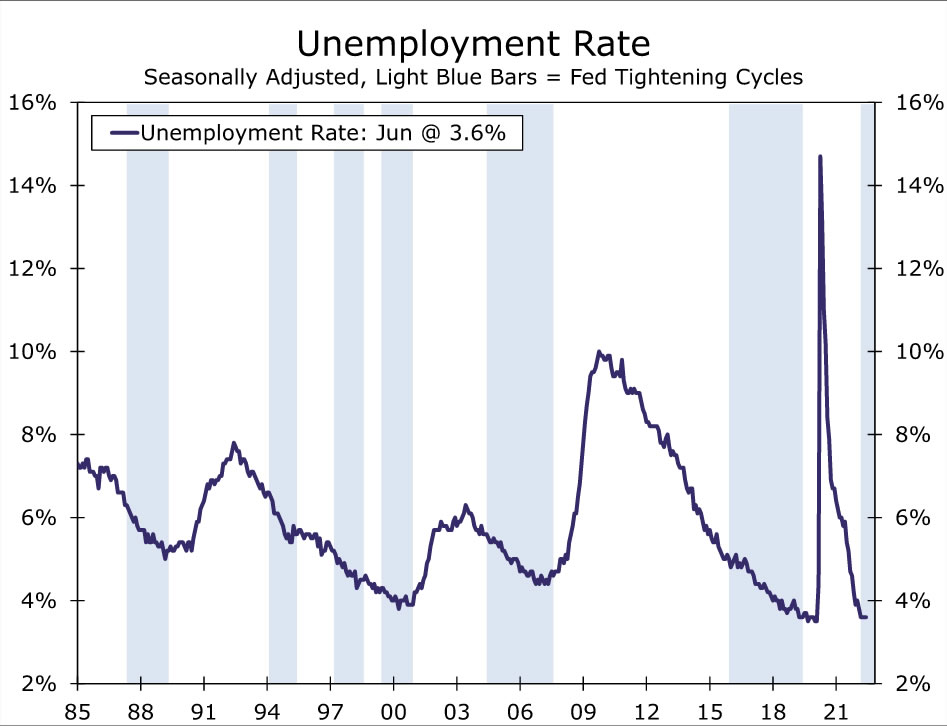
Since the fed funds rate became the primary tool of FOMC policy, the Committee has stopped tightening when the unemployment rate stopped falling (Figure 5) or, as in the case of the 1997-1998 and 2015-2018 cycles, core PCE inflation was generally below the 2% target (Figure 6). But inflation was significantly lower in those periods while the unemployment rate was significantly higher. We therefore expect the Fed to accept more pain in the labor market than prior tightening cycles. Fed officials increasingly appear to have the stomach for some deterioration in the labor market. In the most recent SEP, the median estimate among FOMC officials saw the unemployment rate rising above 4% after taking the policy rate into restrictive territory. With core inflation remaining below 3% in each of the tightening cycles since the 1990s, we suspect the FOMC will not be comfortable calling it quits with rate hikes until inflation has slowed to around a 3% pace. If the labor market continues to hang in there and the unemployment rate remains within the FOMC's longer run central tendency range of 3.5%-4.2%, the FOMC could press further ahead in an effort to insure inflation does not flare up again.
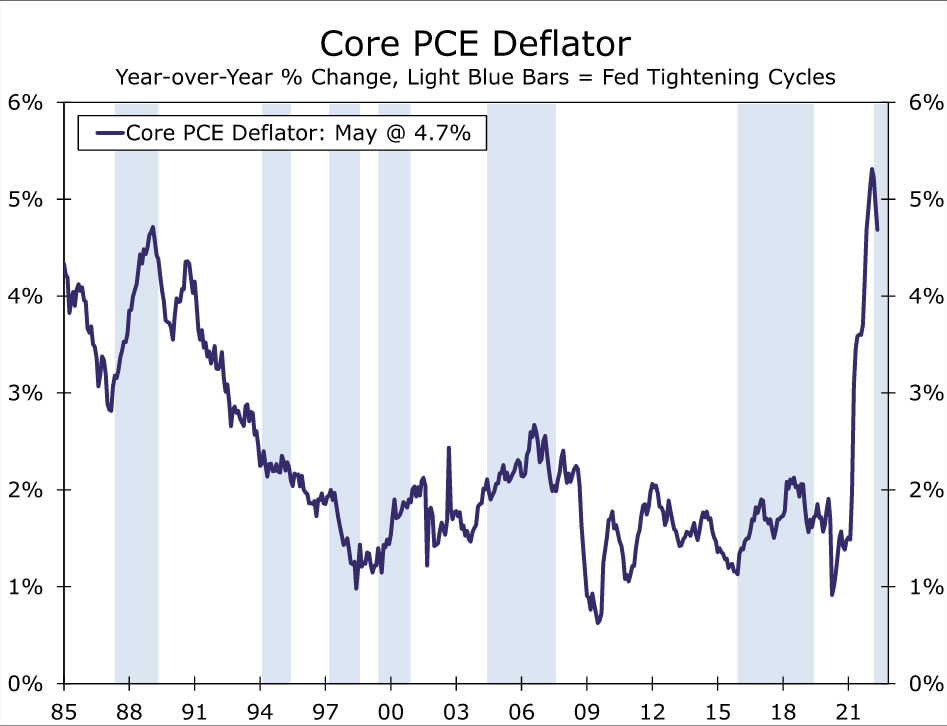
The FOMC looks set to get some help on headline inflation soon as commodity prices fall. However, we suspect a series of slower monthly core readings would be more compelling evidence that inflation is on a sustainable downward trend given the volatility that surrounds energy and food commodities in today's fraught geopolitical and physical climate. The composition of core inflation is also likely to play a role in the Fed's thinking. The largest components of the core index, primary rent and owners' equivalent rent, have notoriously long lags with housing market conditions. Therefore, the Fed may narrow in even further to core-ex-shelter inflation if private sector measures of housing costs show softening prices that will take a few quarters to appear in the official inflation measures. While the more nuanced cuts of inflation data are likely to be tricky to communicate at such a delicate time in the economy, a slowdown in the right components could accelerate the rate at which the Fed's focus shifts back to the labor market.