Sample Category Title
Gold: Bears Lose Traction on Weak Dollar and Signals of Less Hawkish Fed, But Still Hold Grip
Spot gold edges higher on Monday after hitting the lowest in almost one year last week, being deflated by rising dollar on expectations of aggressive Fed in its July policy meeting.
The US central bank announced it will likely raise interest rate by 75 basis points, in its fight with soaring inflation, but speculations about stronger hike of 1% started to circulate last week after report showed that US inflation continued to rise and hit the highest in four decades.
The latest comments from US policymakers who said that the central bank will stick to its decision for 0.75% hike, cooled the situation and soured metals strong bearish sentiment that resulted in so far mild recovery, after gold was in a steep descend for five consecutive weeks.
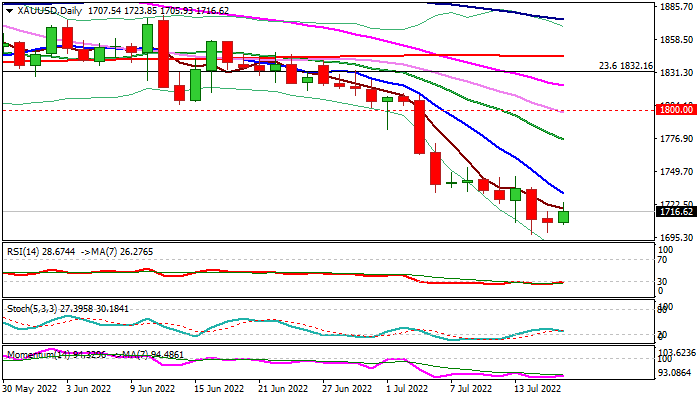
Fresh bounce sees a break through falling 10DMA ($1731) as a minimum requirement to keep recovery in play, though more work at the upside, such as lift above falling 20DMA ($1776) and psychological $1800 level, would be required to confirm reversal and shift focus higher.
Daily technical studies remain weak, with strong negative momentum and MA’s in full bearish setup, weighing on recovery
Res: 1723; 1731; 1745; 1758
Sup: 1705; 1697; 1680; 1652
Gold Halts Decline, But Bearish Risks Still Intact
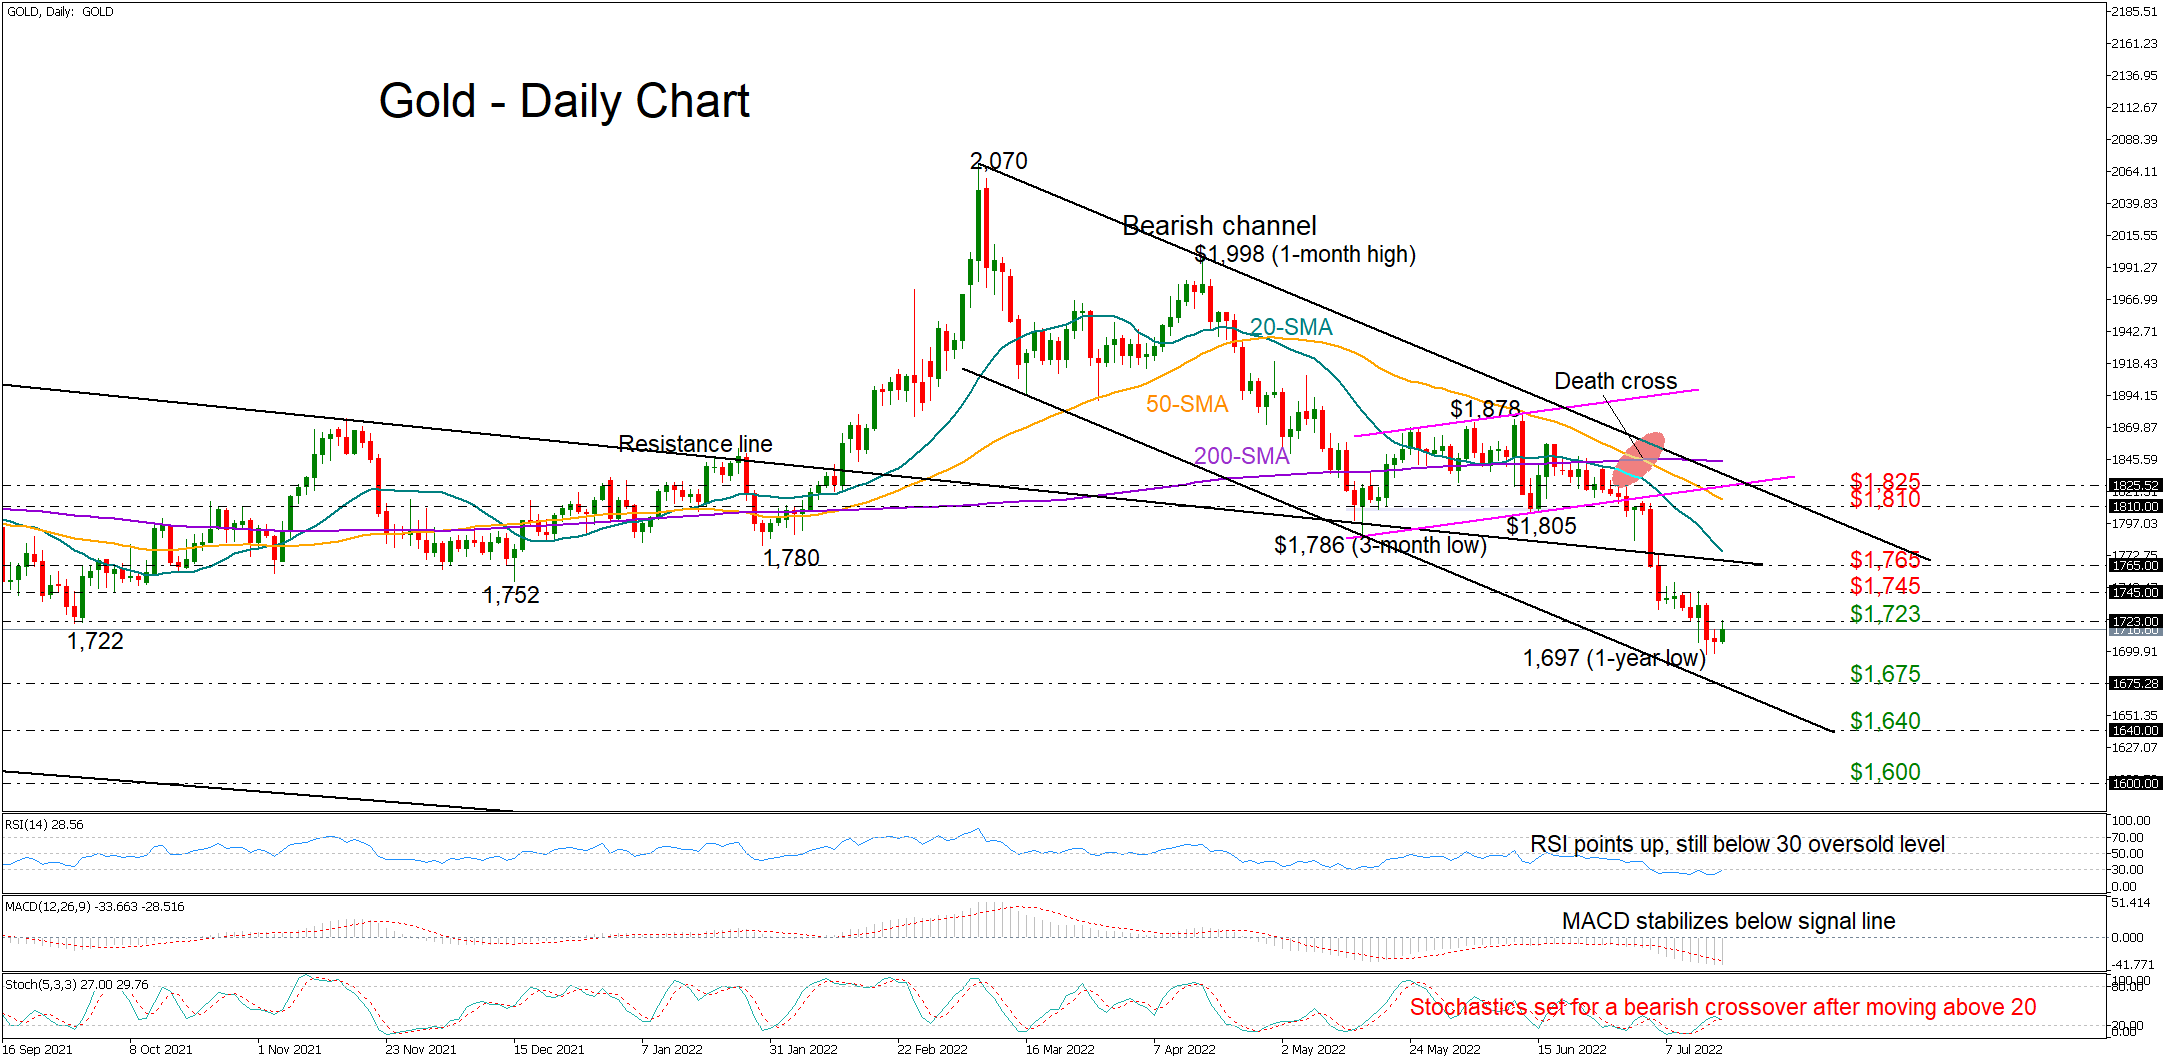
Gold is trying to heal its wounds after sliding to an almost one-year low of $1,697/ounce last week, but the technical picture is not bright enough to back a potential proper recovery in the short term.
On the one hand, the precious metal seems to have escaped an extension towards the lower boundary of the four-month-old bearish channel, raising hopes that the bulls may dominate in the coming sessions. On the other, the RSI is still below its 30 oversold level and the Stochastics are already looking for a downside reversal despite their latest soft upturn, suggesting sellers are still active in the market. The fact that the broken $1,723 support region has switched to resistance today is also feeding skepticism.
Should the bears retake control, they will not hesitate to press the price towards the 2021 lows this time, where the channel’s lower bar is currently located at $1,645. In case that floor collapses, the next pivot point could be found within the $1,640 - $1,600 constraining zone taken from February – April 2021.
On the upside, a move above $1,723 could immediately see a test around last week’s ceiling of $1,745. Snapping the latter, the bulls will next target the resistance line at $1,765, which they could not overcome earlier this month. If they prove successful this time, boosting the precious metal above the 20-day simple moving average (SMA) too, the door will open for the $1,800 psychological number and the 50-day SMA.
In brief, although the market is trying to push for some recovery at the moment, there is not enough bullish evidence to support a potential upside reversal in the price. Perhaps, a close above the constraining area between $1,723 and $1,745 may reduce downside risks, while a sustainable break above $1,765 might be considered a bigger achievement.
Australian Dollar Rises, RBA Minutes Next
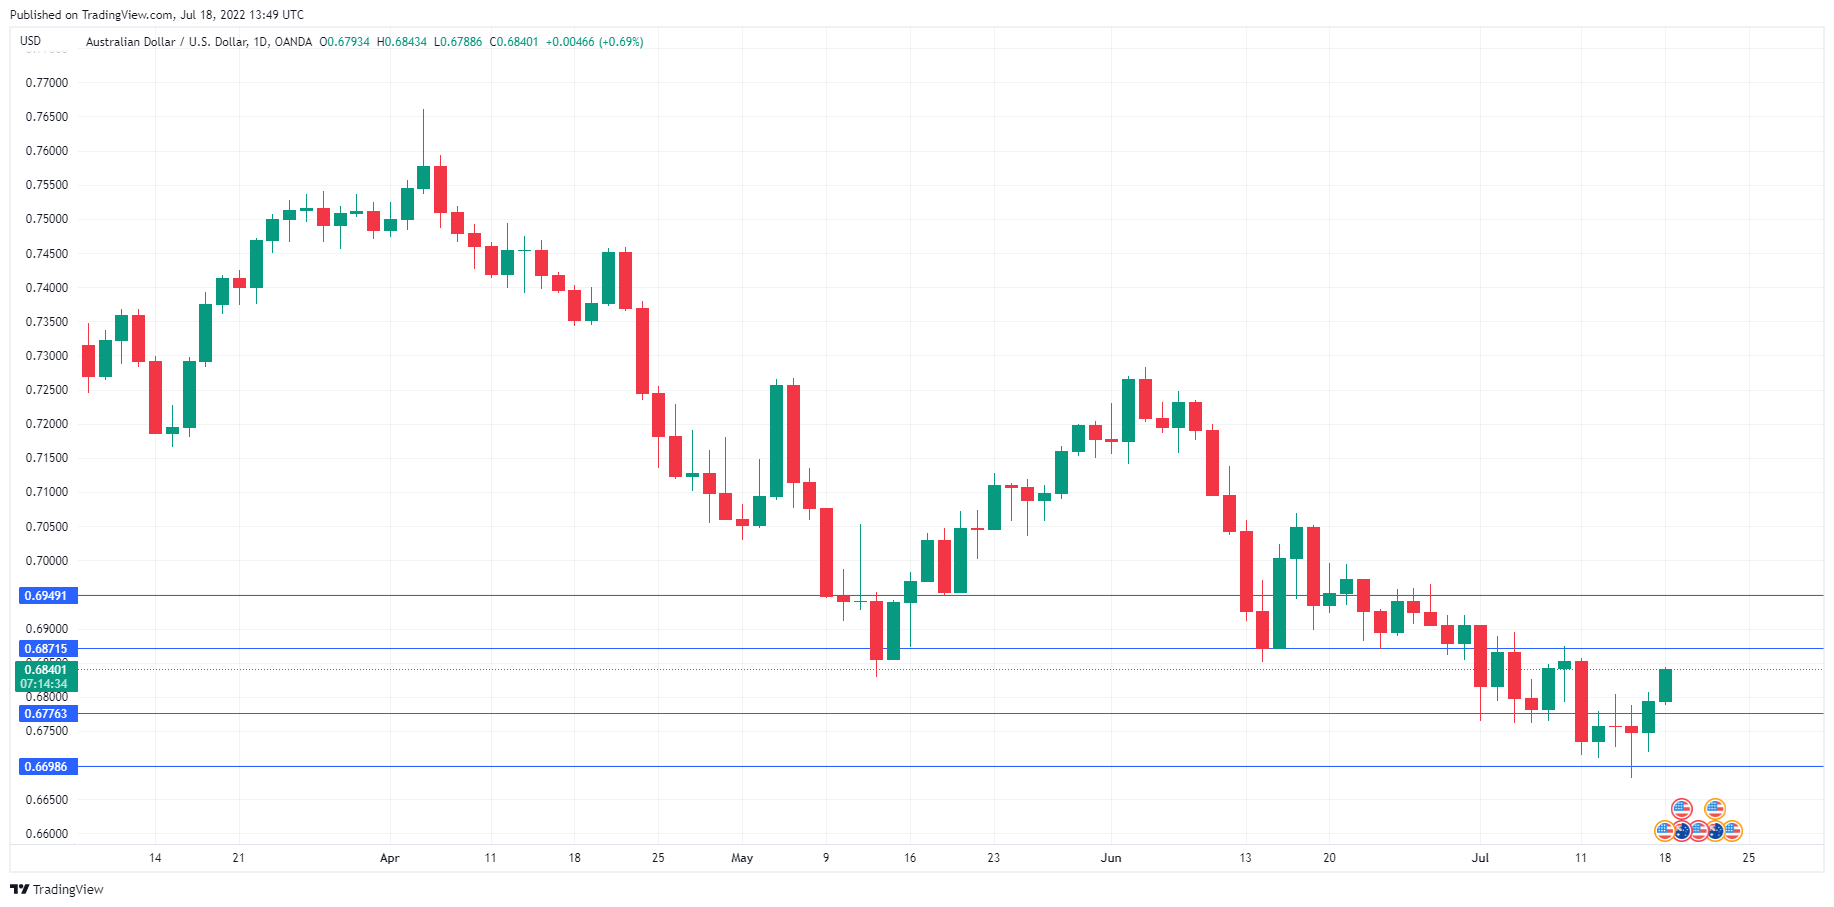
The Australian dollar has started the trading week with strong gains, extending the upswing from Friday. AUD/USD is trading at 0.6835, up 0.62% on the day.
Aussie buoyed by US retail sales
Market risk sentiment has strengthened, courtesy of better-than-expected data out of the US on Friday. Headline retail sales and core retail sales both posted a gain of 1.0% MoM in June, above the forecast and an improvement from the May numbers. As well, UoM Consumer Sentiment improved slightly to 51.0, above the consensus for a contraction at 49.0. This has boosted the Australian dollar, a bellwether of risk appetite.
The financial markets were pleased with US retail sales, which points to consumers’ willing to spend despite the bite that higher inflation is taking out of disposable incomes. At the same time, strong consumer spending paves the way for a massive 100bp hike from the Federal Reserve next week, as strong US data indicates that the economy is strong enough to withstand higher rates. There is a pre-meeting blackout of the FOMC ahead of next Thursday’s meeting, but we can still expect plenty of discussion about whether the Fed will deliver a 75 bp or 100 bp increase. The more likely scenario is a 75bp move, but the Fed has surprised before, and a 100bp move is certainly on the table.
The RBA is also in the midst of a rate-tightening cycle, but the cash rate is only at 1.35%, which won’t make a significant dent on surging inflation. The central bank is likely to continue tightening throughout the remainder of 2022. The minutes from the July meeting will be released on Tuesday, and investors will be looking for clues as to how aggressive the RBA plans to be as it tries to balance hiking rates without choking economic activity and causing a recession.
AUD/USD Technical
- There is resistance at 0.6871 and 0.6949
- 0.6776 is providing support, followed by 0.6698
Cable Trying to Break Out of an Ending Diagonal/Wedge, Bullish? Elliott Wave Analysis
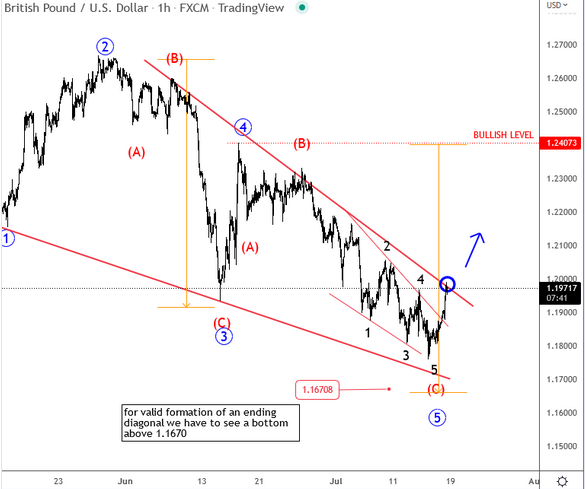
Cable is making a nice reversal from the low; it s a sharp and interesting bullish price action for now that can cause more upside this week. Keep in mind that we are tracking an ending diagonal which is normally a very powerful reversal pattern. A daily close above 1.2 can make a room for 1.24, but after intraday pullbacks. Count remains valid as long as the market trades above 1.1670 lv. Below that level wave three would be the shortest, so in such case our count should be adjusted.
What is an ending diagonal?
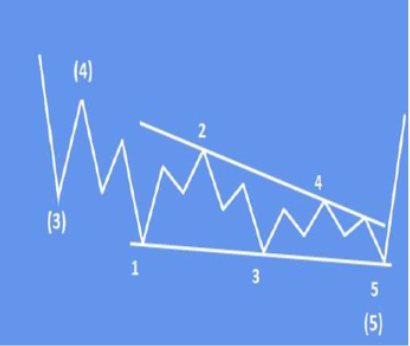
I'ts a special reversal type of the pattern labeled with waves 1-2-3-4-5, where each leg is made by three subwaves. Normally it will occurs in a fifth wave but we can also find it in wave C or sometimes in wave Y of a complex correction. So, it means they occur in very late stages of a higher degree trends, and normally the price action will be slow, choppy and overlapping with a very low volume and momentum. But after market clears some stops with minor highs/lows within waves 3 and waves 5, the market will normaly make a sharp and explosive turn in the opposite dirrection. A confirmaiton point for a change in trend is when wave 2-4 line is broken, plus a closing price beyond wave 4 termination level. When diagonal is completed you can expect price to retrace back to teh starting point of the pattern.
Dollar Continues Correction Off Recent Multiyear Top
MarketsEuropean markets are supposed to face multiple event risk this week. The ECB will likely start policy normalization with a 25 bps rate hike, but a 50 bps step still isn’t completely ruled out. The bank also will have to come up with a convincing, but ‘politically acceptable’ new tool to address market fragmentation. Aside from ECB policy, European investors face the uncertainty of the reopening of the Nord Stream 1 Russian gas supply (or the absence of it) and a potential political crisis in Italy. Last but not least, on Friday, the EMU July preliminary PMI is at risk of flagging a standstill in European growth, maybe even worse. Given these event risks, one would expect something different compared to what appeared on the screens this morning. European equities rebounded, yields at some point jumped 10+ bps and EUR/USD touched an intra-day peak near 1.0175. The reason for this optimism wasn’t that easy to find in hard data or other news. From a European point of view, today’s market reaction suggests that some investors are pondering how much recession risk is discounted after recent repositioning. Globally, markets apparently also feel a bit more at ease as Fed comments suggested that the bar for 1.0%pt rate hike is high. Even a convincing anti-inflation approach leaves room for the Fed to keep an eye at other factors except killing inflation at any cost. Whatever the driver, German yields are rising between 6 bps (2-y) and 8 bps at longer tenors. Also remarkable, the 10-y Italian spread versus Germany reversed a (modest) widening to currently ease 6 bps even as the Italian Parliament will vote on the Draghi government on Wednesday. Broader markets also remain in risk-on modus. US yields are gaining 5/7 bps across the curve. European equities (including Italy) are gaining about 1.0%. US indices also opened up to 1.25% higher on solid earnings of some major banks. On FX markets, the dollar continues the correction off the recent multiyear top. The DXY trade-weighted index currently trades near 107.5, down from 108-area early in Asian dealings this morning (but off the intraday low). The correction in USD/JPY remains modest (138.25). EUR/USD also trades off the intraday peak (currently 1.014). Still, even in a more constructive environment the case for a sustained euro rebound probably isn’t that strong. From a technical point of view, EUR/USD needs to regain 1.0350 to call of the downside alert. Even after current rebound, this level still is some distance away. Sterling outperforms both the dollar and the euro. BoE’s Saunders in a speech indicated that the BoE policy rate might need to surpass 2.0% as the labour market will remain tight despite growth slowing, raising the risk for more persistent wage and price rises. EUR/GBP trades near 0.8460 (0.85 area this morning). Tomorrow’s UK labour data and Wednesday’s June price data are the next important reference for UK markets in the run-up to the August 4 BoE policy meeting.
News Headlines
Polish core inflation as calculated by the National Bank of Poland amounted to 9.1% in June, up from 8.5% the month before. That’s slightly less than the 9.3% analyst consensus. Monthly dynamics remained at a strong 0.6% though decelerated from the 1% in May and also below expectations (0.8%). Three other core indices constructed by the NBP all continued to rise further into the double digit area as well, ranging from 10.7% to 15.9%. The data confronts the central bank with the need for further tightening. That said, the today’s constructive risk setting depresses Polish swap yields across the curve. Moves range between 10 bps and 38 bps lower. The Polish zloty strengthens marginally though left intraday highs behind. EUR/PLN trades at 4.78.
The Kingdom of Belgium successfully tapped three outstanding OLO lines for a total amount of €3.712bn today. It tapped OLO’s 91 (€0.93bn 0.0% Oct2027), 94 (€1.60bn 0.35% Jun2023) and 95 (€1.18bn 1.40% Jun2053). Bid-to-cover ranged between 1.56 and 2.08. The Kingdom has now completed 78% of this year’s €41.2bn OLO funding needs.
WTI Oil : Oil Prices Rebound after a False Break Through Key Supports
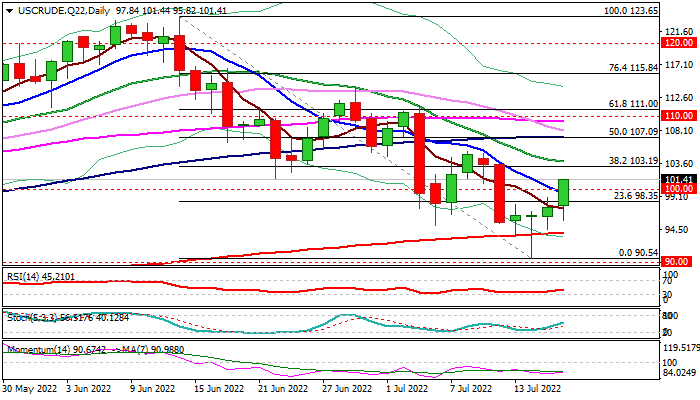
WTI oil price accelerated through $100 barrier on Monday, extending recovery from last Thursday’s spike low at $90.54 into third straight day.
Oil received fresh support from weaker dollar and renewed supply concerns that offset worries about demand on recession signals and China’s sharp slowdown in economic activity due to Covid restrictions.
Price rebounded after strong downside rejection on probe through key supports at $93.85/ $92.64 (200DMA /Mar 16 low) forming a bear-trap on daily chart and generating initial reversal signal.
Fresh bulls look for close above $100 level (reinforced by falling 10DMA) to support recovery and open way for test of next pivots at $103.19 (Fibo 38.2% $123.65/$90.54) and $103.80 (falling 20DMA), regain of which would neutralize downside risk and open way for stronger rebound.
Broken $100 level now acts as strong support which should keep the downside protected and maintain near-term bullish bias.
Res: 102.30; 103.19; 103.80; 105.21.
Sup: 100.00; 98.35; 97.43; 95.82.
EURUSD Is Growing After Unsuccessful Test of Parity
EUR/USD is steadily rising and has already reached 1.0138. After testing 1.0000 for several trading sessions, the pair reversed upwards after all.
Investors are now switching their attention to the ECB rate decision. There is no doubt that the rate will be raised by at least 25 basis points in July, but there are opinions and expectations that the regulator might be more aggressive and announce a 50-point rate hike in September. These factors are strongly in favour of bulls. Well, even July’s hike will be the first one since 2011.
However, this decision might not be enough to reverse the pair and push it upwards, because the US Fed is also acting very aggressively and many investors are using the “greenback” as a “safe haven” asset. The decline of the European currency does cause a problem for the ECB and might boost inflation, which is already high above its target level. The moves to strengthen the Euro are now considered highly doubtful; that’s why the current movement is probably just a correction before the major currency pair resumes the downtrend. The overall downside target might be at 0.9000.
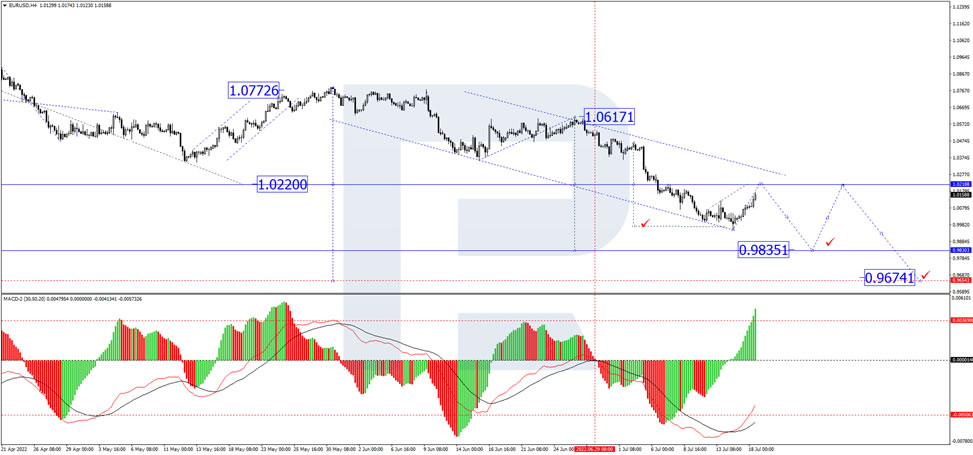
On the H4 chart, after completing the third descending wave at 0.9955, EUR/USD is correcting upwards to test 1.0220 from below. Later, the pair is expected to resume trading downwards with the target at 0.9835. From the technical point of view, this scenario is confirmed by the MACD Oscillator: its signal line is growing towards 0. In the future, it may rebound from this level and resume falling to update the lows.
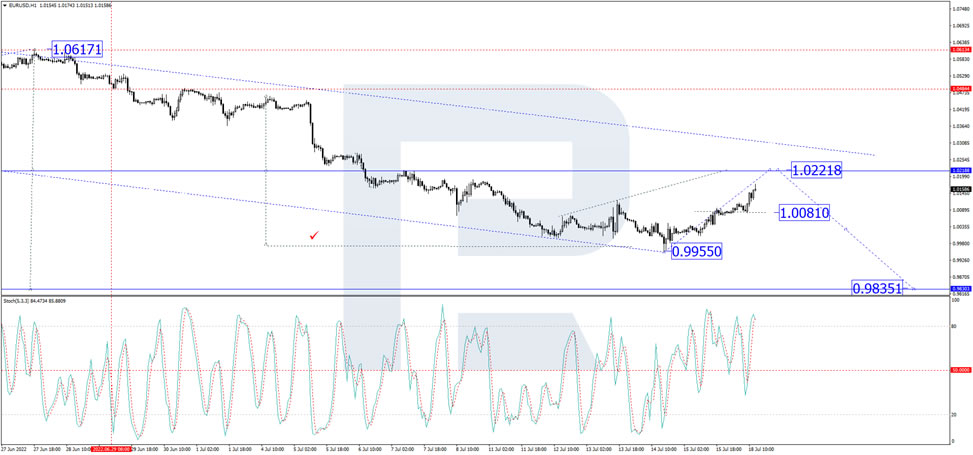
As we can see in the H1 chart, having finished the descending wave at 0.9855, forming a new consolidation range above this level, and then breaking it to the upside, EUR/USD has reached 1.0081; right now, it is forming another consolidation range around the latter level and may later break it upwards to extend this structure up to 1.0220. After that, the instrument may resume trading downwards. From the technical point of view, this idea is confirmed by the Stochastic Oscillator: after breaking 50 upwards, its signal line is moving above 80. In the future, the line may fall to rebound from 50 and resume growing to return to 80.
USD/CAD Mid-Day Outlook
Daily Pivots: (S1) 1.2979; (P) 1.3058; (R1) 1.3101; More...
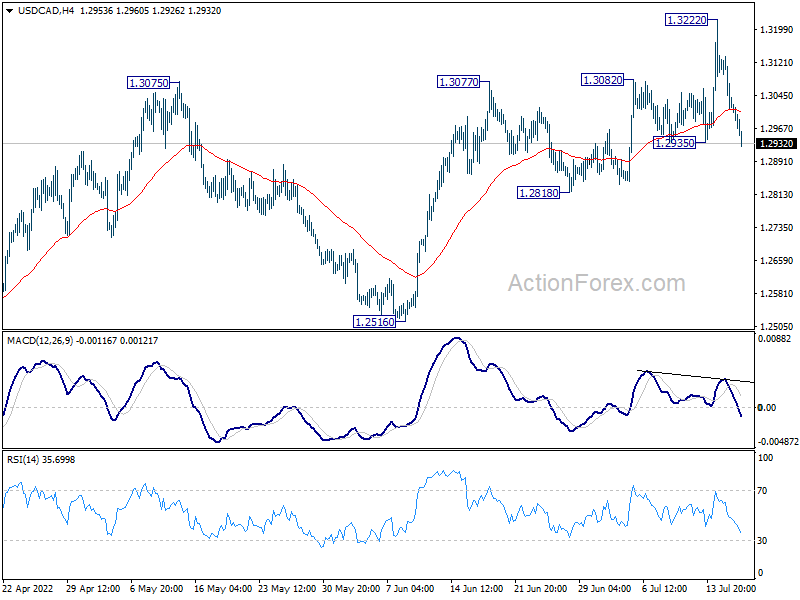
USD/CAD's break of 1.2935 minor support suggests that a short term top was formed already at 1.3222. Intraday bias is back on the downside for 1.2818 support first. Firm break there will bring deeper fall back to 1.2516 key support. For now, risk will stay mildly on the downside as long as 1.3222 resistance holds, in case of recovery.
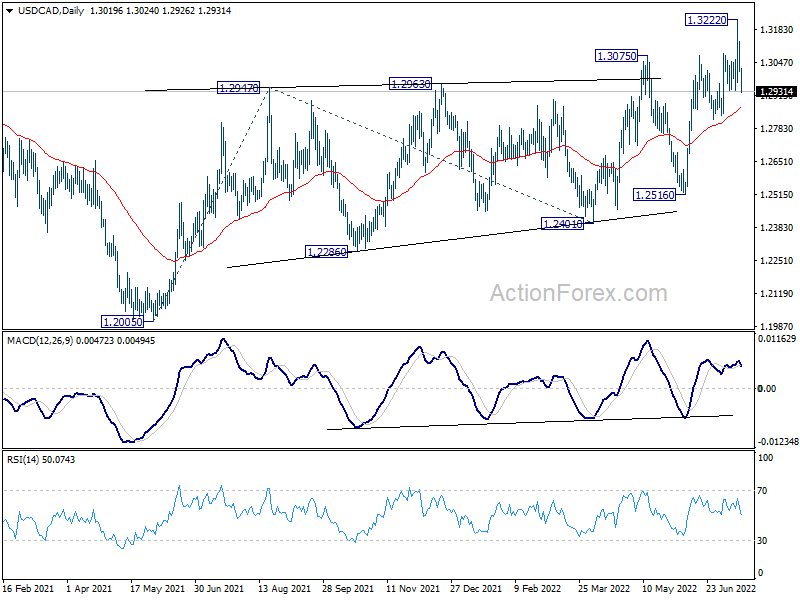
In the bigger picture, down trend from 1.4667 (2020 high) should have completed at 1.2005, after defending 1.2061 long term cluster support. Rise from there should target 61.8% retracement of 1.4667 to 1.2005 (2021 low) at 1.3650. This will remain the favored case now as long as 1.2516 support holds.
GBP/JPY Mid-Day Outlook
Daily Pivots: (S1) 163.78; (P) 164.25; (R1) 164.84; More...
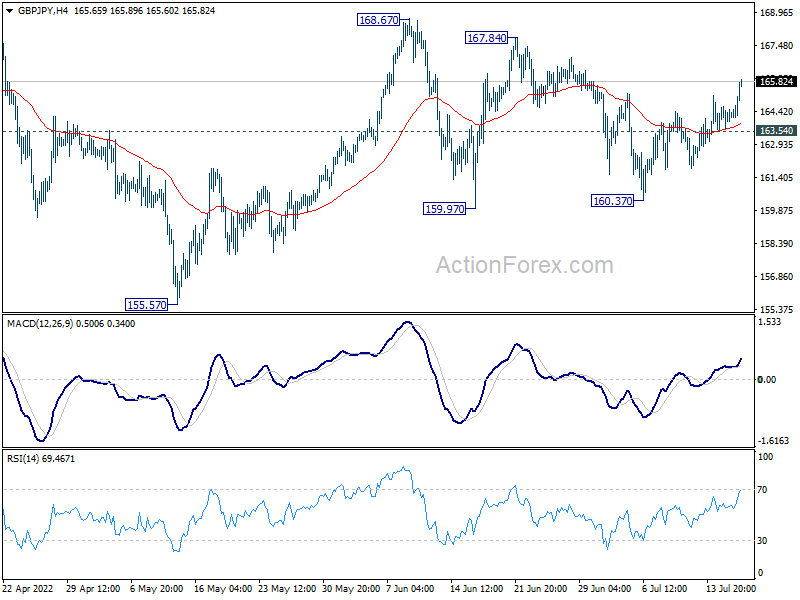
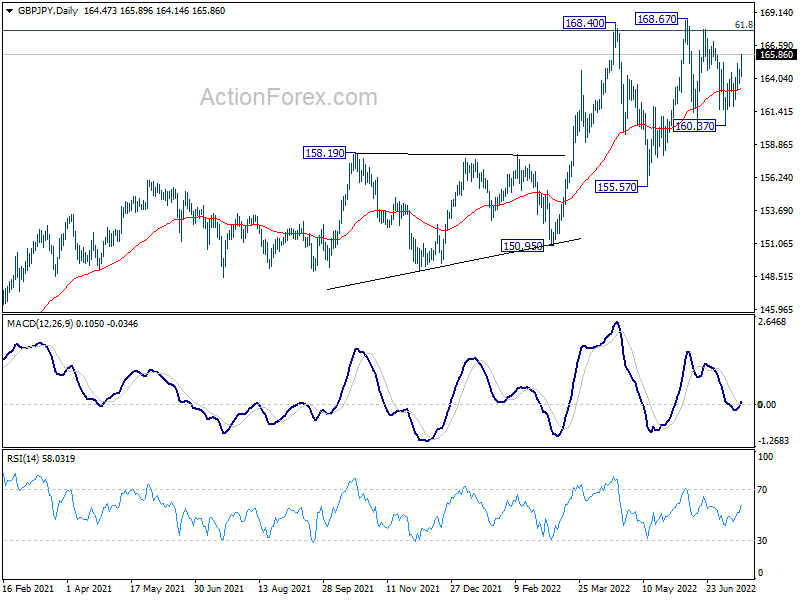
GBP/JPY's break of 165.26 minor resistance suggests that consolidation from 168.67 has completed at 160.37. Intraday bias is back on the upside for retesting 168.67 high. Firm break there will resume larger up trend. On the downside, below 163.54 minor support will dampen this bullish view and turn bias back to the downside for 160.37 support instead.
In the bigger picture, up trend from 123.94 (2020 low) is still in progress. Sustained break of 61.8% retracement of 195.86 (2015 high) to 122.75 (2016 low) at 167.93 will be a long term bullish signal, and could pave the way back to 195.86 high. This will now remain the favored case as long as 155.57 support holds, even in case of deep pull back.
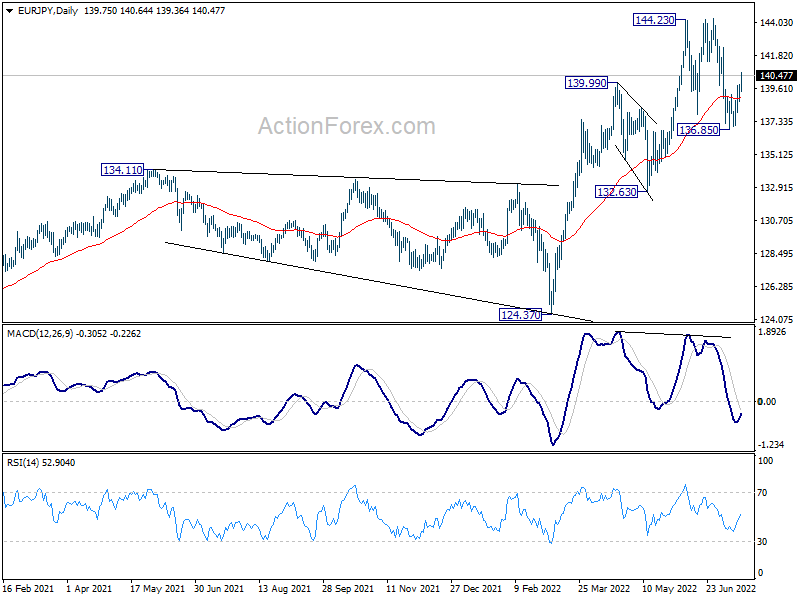
EUR/JPY Mid-Day Outlook
Daily Pivots: (S1) 139.03; (P) 139.46; (R1) 140.17; More....
EUR/JPY's break of 139.78 minor resistance suggests that pull from1 44.26 has completed at 136.85 already, so has the consolidation pattern from 144.23. Intraday bias is back on the upside for retesting 144.26 resistance first. Firm break there will resume larger up trend. On the downside, below 138.54 minor support will dampen this bullish view and bring retest of 136.85 instead.
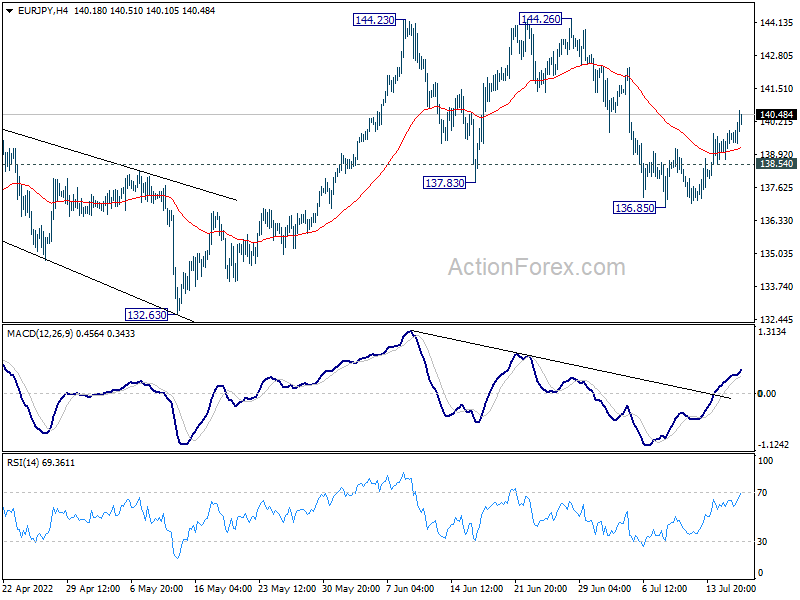
In the bigger picture, up trend from 114.42 (2020 low) is seen as the third leg of the pattern from 109.30 (2016 low). Further rally is in favor as long as 134.11 resistance turned support holds, even in case of deep pull back. Firm break of 139.78 will target 149.76 (2015 high. However, sustained break of 134.11 will be a sign of medium term bearish reversal and turn focus to 124.37 support for confirmation.