Sample Category Title
EUR/GBP Daily Outlook
Daily Pivots: (S1) 0.8462; (P) 0.8484; (R1) 0.8509; More...
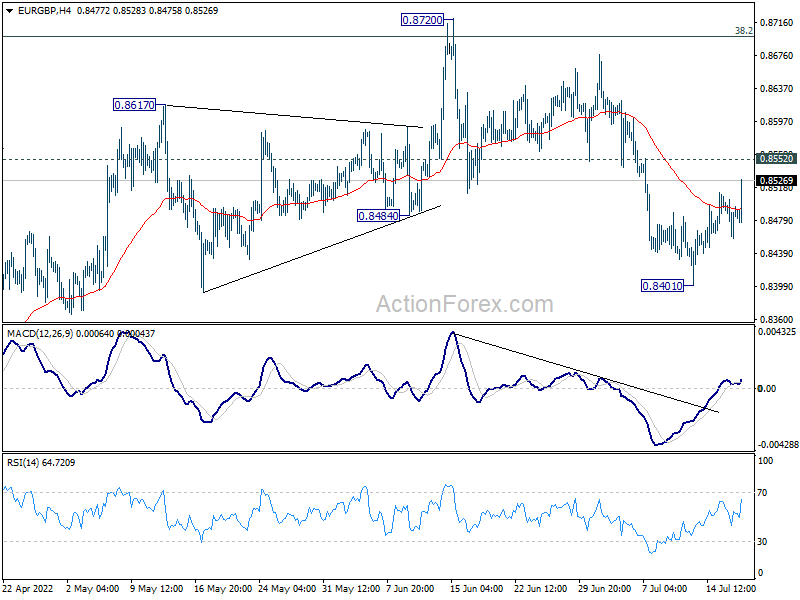
intraday bias in EUR/GBP remains neutral at this point. On the upside break of 0.8552 resistance will suggest that pull back from 0.8720 has completed. That will also also revive near term bullishness. Further rise should be seen to retest 0.8720 high. On the downside, break of 0.8401 will reaffirm rejection by 0.8697 medium term fibonacci level and target 0.8201/48 support zone next.
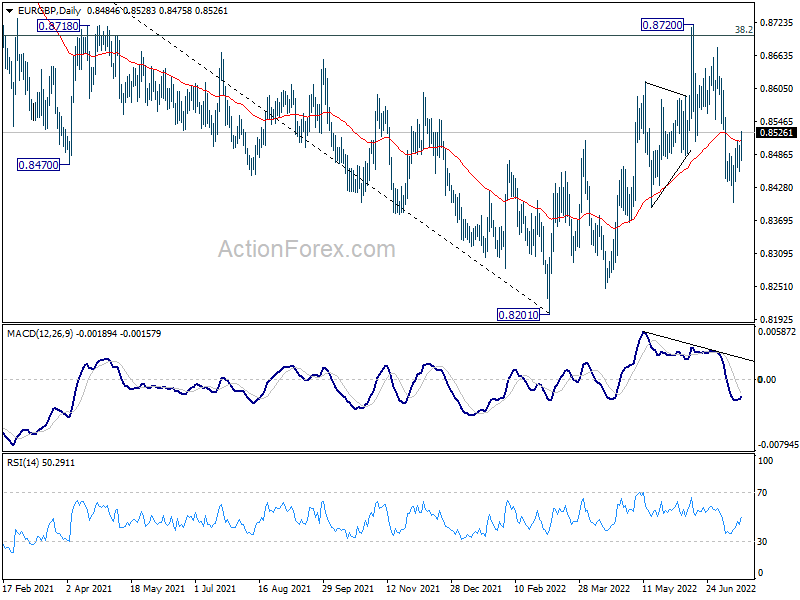
In the bigger picture, rejection by 38.2% retracement of 0.9499 to 0.8201 at 0.8697 argues that rebound from 0.8201 is merely a corrective move. That is, down trend from 0.9499 (2020 high) is now over. Sustained break of 0.8201 will resume such decline and target 61.8% retracement of 0.6935 to 0.9499 at 0.7917. This will now remain the favored case as long as 0.8720 resistance holds.
EUR/AUD Daily Outlook
Daily Pivots: (S1) 1.4836; (P) 1.4871; (R1) 1.4928; More...
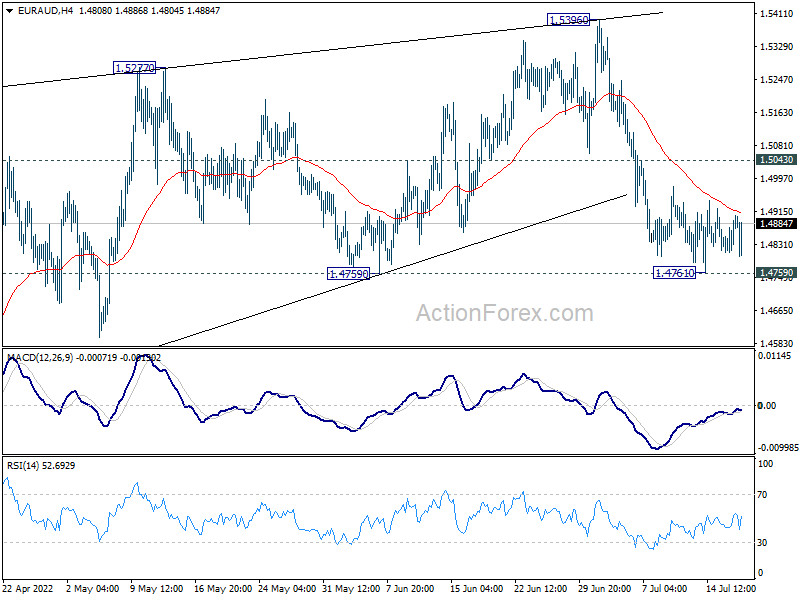
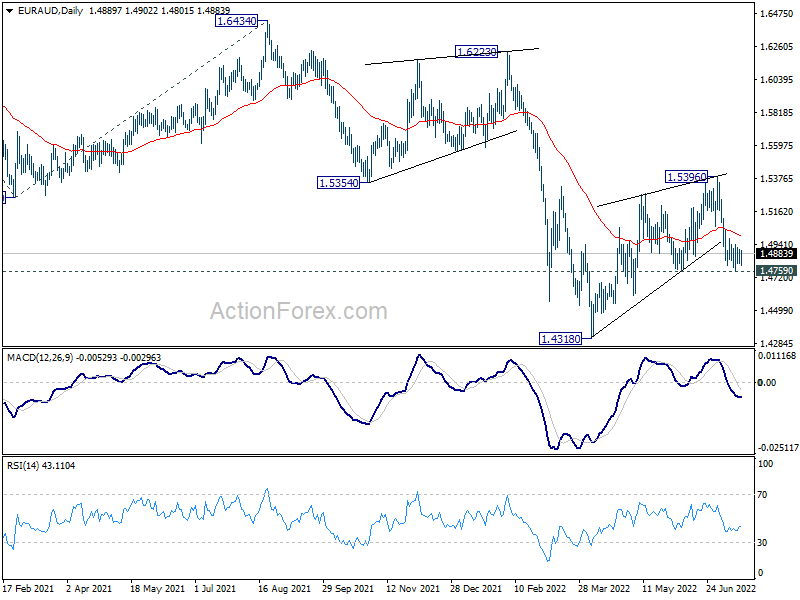
Sideway consolidation continues in EUR/AUD and intraday bias remains neutral. Further decline is in favor with 1.5043 resistance intact. On the downside, decisive break of 1.4759 support should confirm that corrective rise from 1.4318 has completed at 1.5396 after rejection by 1.5354 support turned resistance. Deeper fall should then be seen back to retest 1.4318 low. On the upside, however, break of 1.5043 will bring stronger rebound back towards 1.5396.
In the bigger picture, rejection by 1.5354 support turned resistance, as well as 55 week EMA (now at 1.5378), maintain medium term bearishness. That is, larger down trend from 1.9799 is not completed yet. Break of 1.4318 low will target 61.8% projection of 1.9799 to 1.5250 from 1.6434 at 1.3623, which is close to 1.3624 long term support (2017 low). This will remain the favored case now as long as 1.5396 resistance holds.
EUR/CHF Daily Outlook
Daily Pivots: (S1) 0.9858; (P) 0.9896; (R1) 0.9954; More....
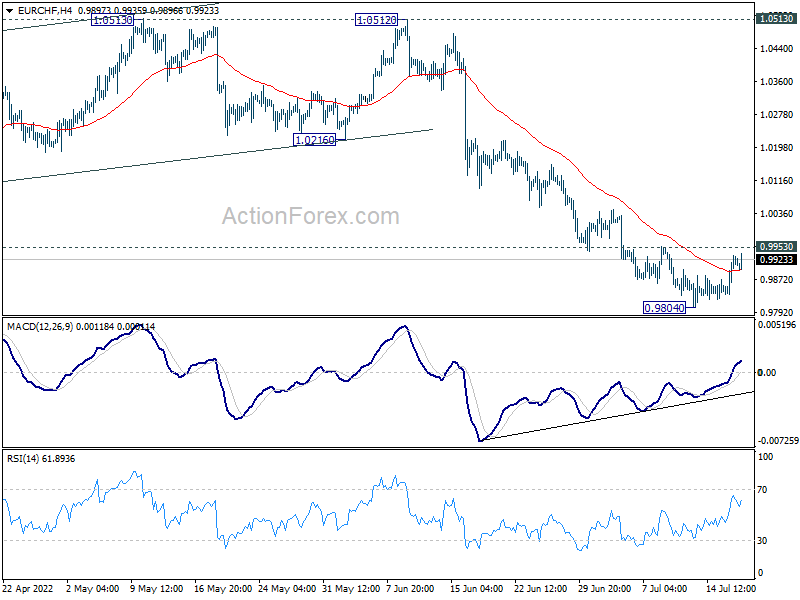
Intraday bias in EUR/CHF remains neutral for the moment. On the upside, break of 0.9953 minor resistance will suggests short term bottoming at 0.9804, on bullish convergence condition in 4 hour MACD. Intraday bias will be back on the upside for 55 day EMA (now at 1.0125). on the downside, break of 0.9804 will resume larger down trend to 0.9650 long term projection level.
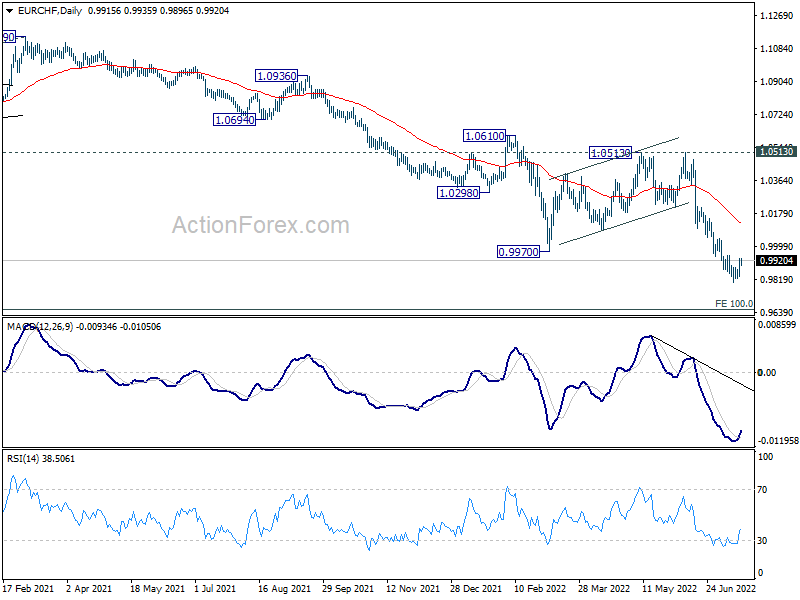
In the bigger picture,long term down trend from 1.2004 (2018 high) is expected to target 100% projection of 1.2004 to 1.0505 to 1.1149 at 0.9650. On the upside, break of 1.0513 resistance is needed to indicate medium term bottoming. Otherwise, outlook will stay bearish in case of strong rebound.
EUR/USD Daily Outlook
Daily Pivots: (S1) 1.0082; (P) 1.0141; (R1) 1.0204; More...
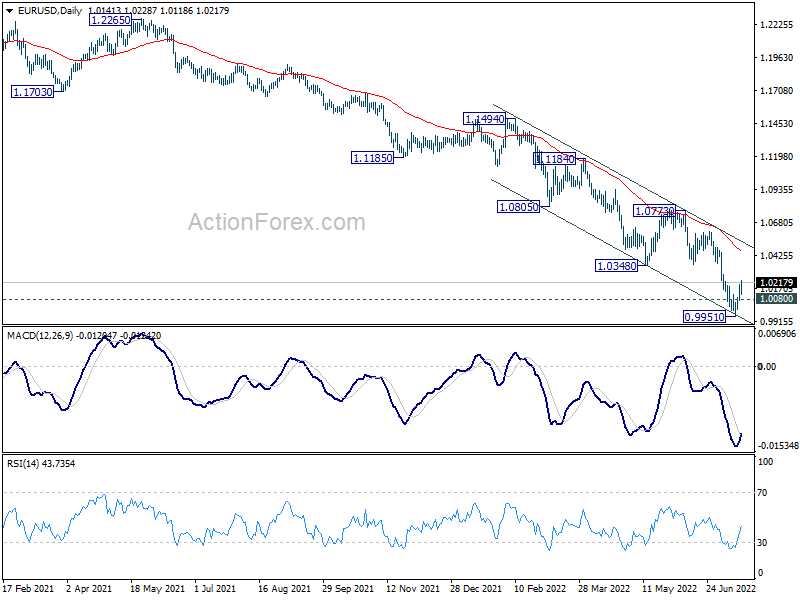
Intraday bias in EUR/USD remains on the upside at this point. Rebound from 0.9951 short term bottom is in progress for 1.0348 support turned resistance. Break will target channel resistance at 1.0514. On the downside, below 1.0080 minor support will bring retest of 0.9951 low instead.
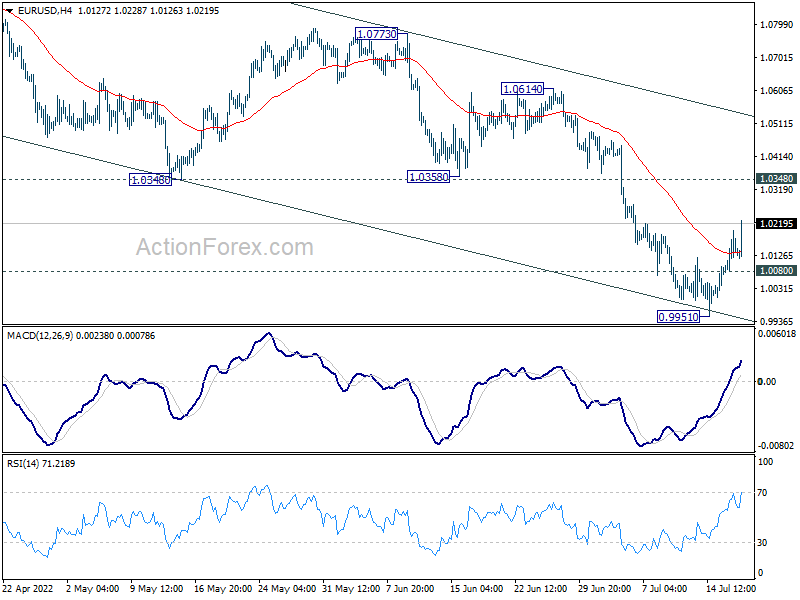
In the bigger picture, down trend from 1.6039 (2008 high) is still in progress. Next target is 100% projection of 1.3993 to 1.0339 from 1.2348 at 0.8694. In any case, outlook will stay bearish as long as 1.0773 resistance holds, in case of rebound.
GBP/USD Daily Outlook
Daily Pivots: (S1) 1.1866; (P) 1.1950; (R1) 1.2036; More...
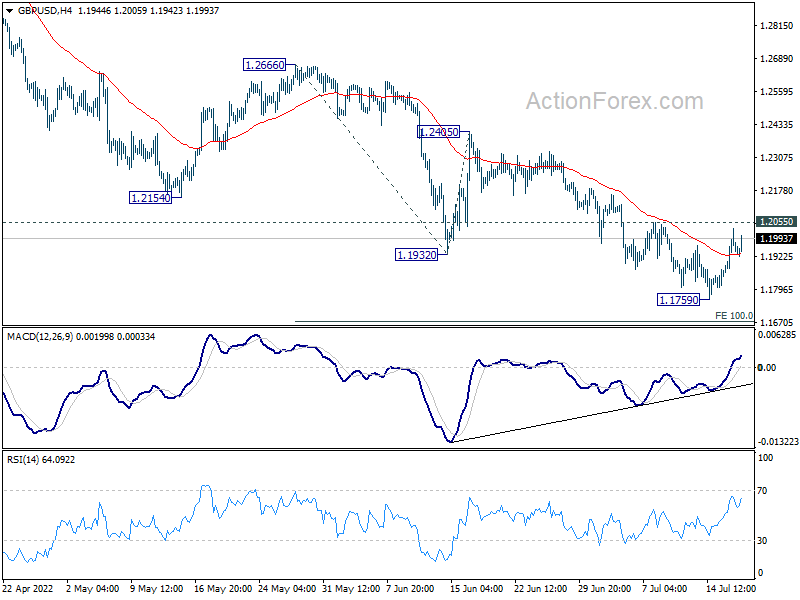
Intraday bias in GBP/USD remains neutral with focus on 1.2055 minor resistance. Firm break there will confirm short term bottoming at 1.1759. Bias will be turned back to the upside for 1.2405 resistance next. On the downside, below 1.1759 will resume larger down trend to 100% projection of 1.2666 to 1.1932 from 1.2405 at 1.1671.
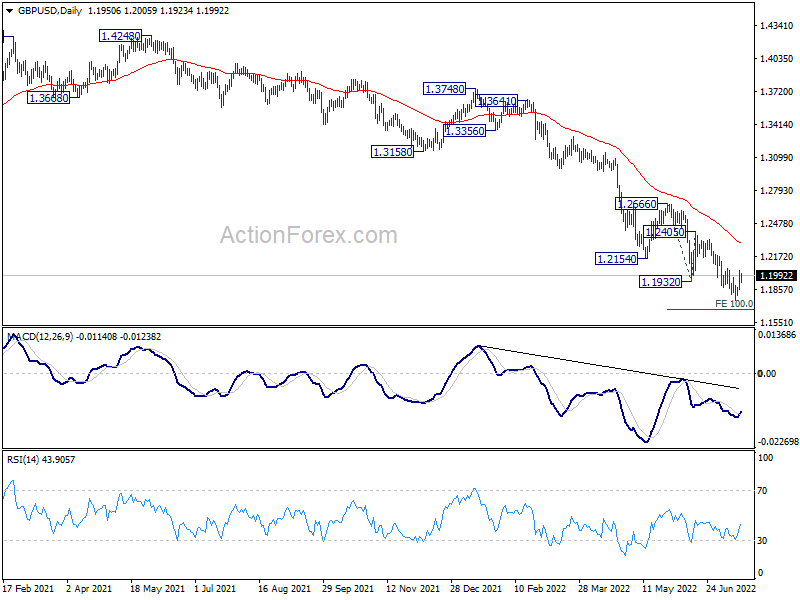
In the bigger picture, fall from 1.4248 (2018 high) could be a leg inside the pattern from 1.1409 (2020 low), or resuming the longer term down trend. Deeper decline is expected as long as 1.2666 resistance holds. Next target is 1.1409 low. However, firm break of 1.2666 will bring stronger rise back to 55 week EMA (now at 1.3065).
USD/CHF Daily Outlook
Daily Pivots: (S1) 0.9740; (P) 0.9765; (R1) 0.9799; More...
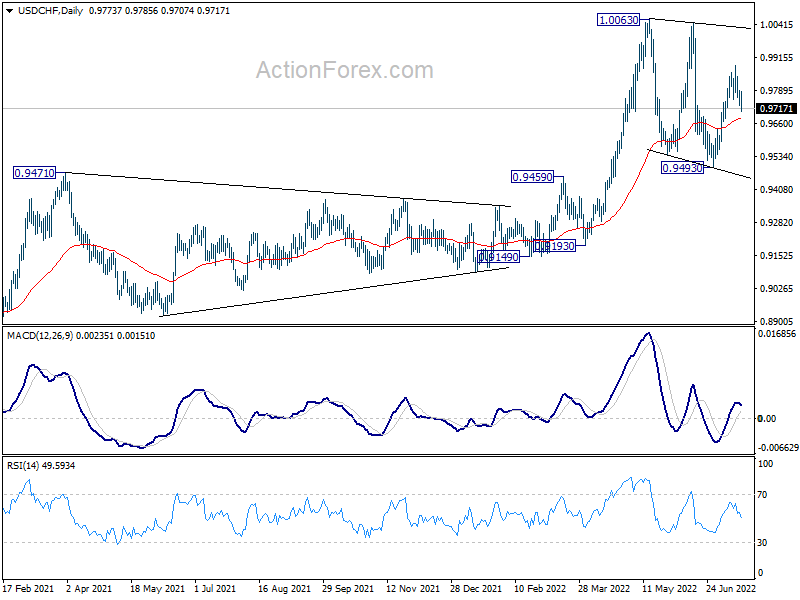
Intraday bias in USD/CHF remains mildly on the downside at this point. Fall from 0.9884 is seen as a falling leg of the consolidation from 1.0063. Deeper decline would be seen to 55 day EMA (now at 0.9682). Firm break there will target 0.9493 support again. On the upside, above 0.9884 will resume the rebound to retest 1.0063 high.
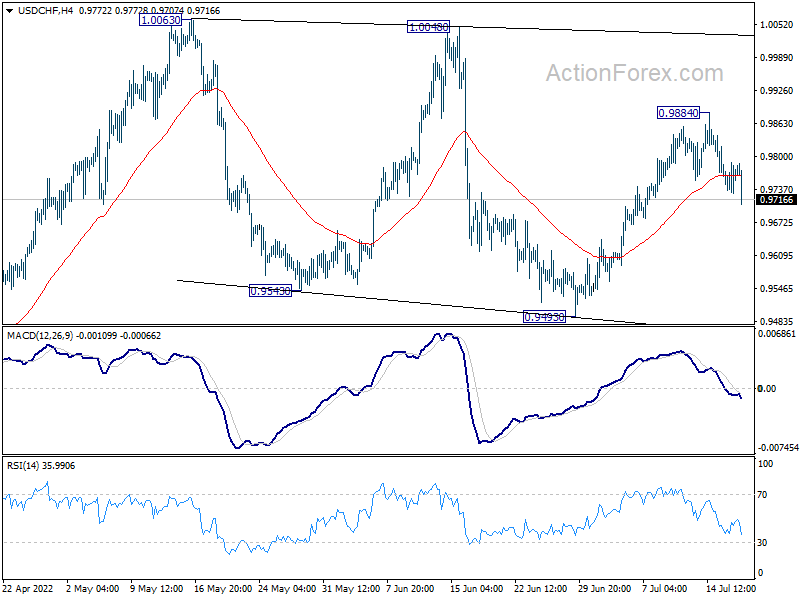
In the bigger picture, medium term up trend from 0.8756 (2021 low) is still in progress. Next target is 1.0342 (2016 high). Sustained break there will resume long term up trend from 0.7065 (2011 low). This will remain the favored case as long as 0.9471 resistance turned support holds.
USD/JPY Daily Outlook
Daily Pivots: (S1) 138.20; (P) 138.67; (R1) 138.94; More...
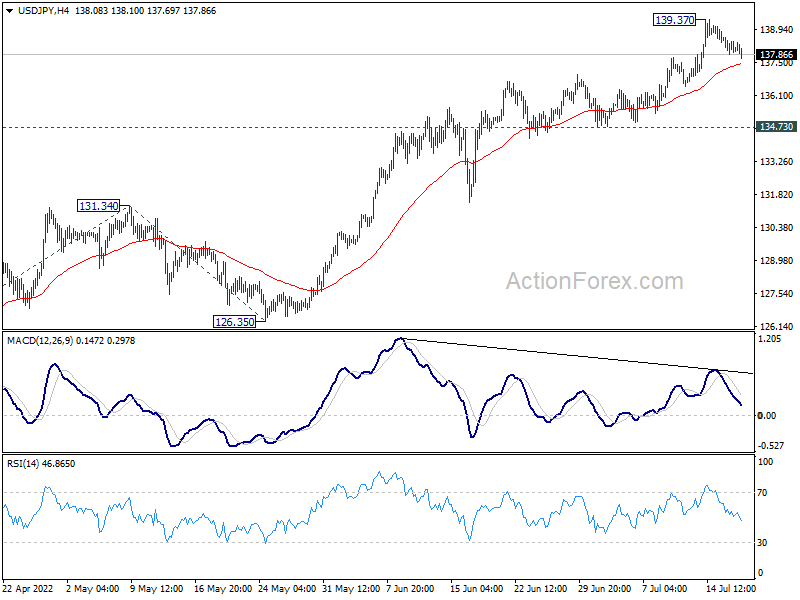
USD/JPY is staying in consolidation from 139.37 and intraday bias remains neutral first. Downside of retreat should be contained by 134.73 support. On the upside, break of 139.37 will resume larger up trend to 100% projection of 114.40 to 131.34 from 126.35 at 143.29.
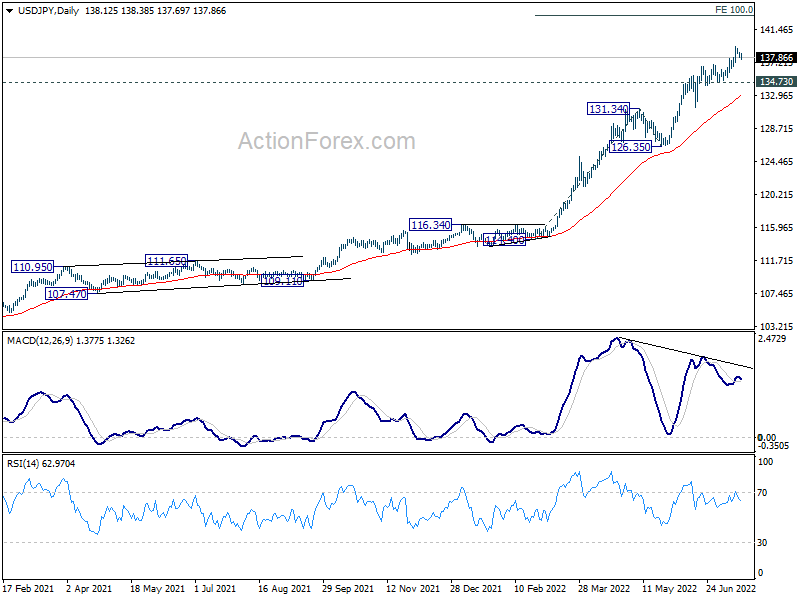
In the bigger picture, current rally is seen as part of the long term up trend from 75.56 (2011 low). Next target is 100% projection of 75.56 (2011 low) to 125.85 (2015 high) from 98.97 at 149.26, which is close to 147.68 (1998 high). This will remain the favored case as long as 126.35 support holds.
USD/CAD Daily Outlook
Daily Pivots: (S1) 1.2914; (P) 1.2970; (R1) 1.3040; More...
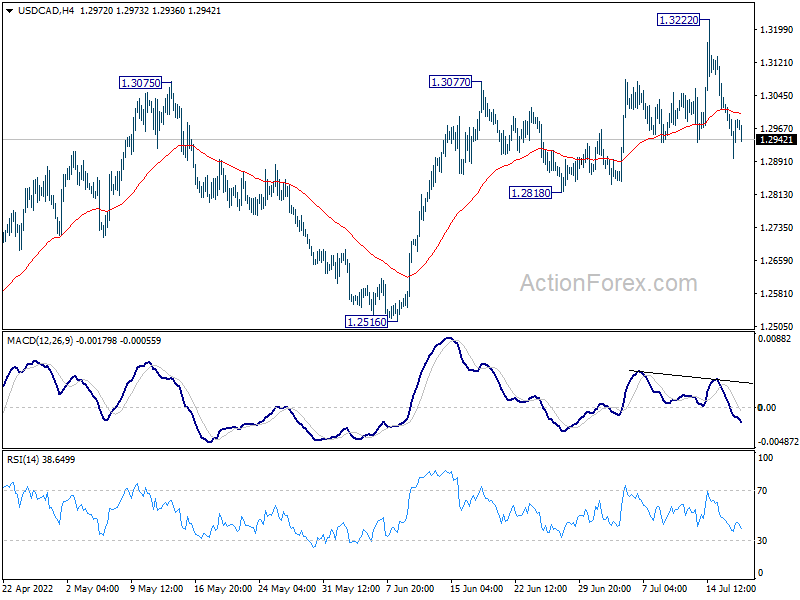
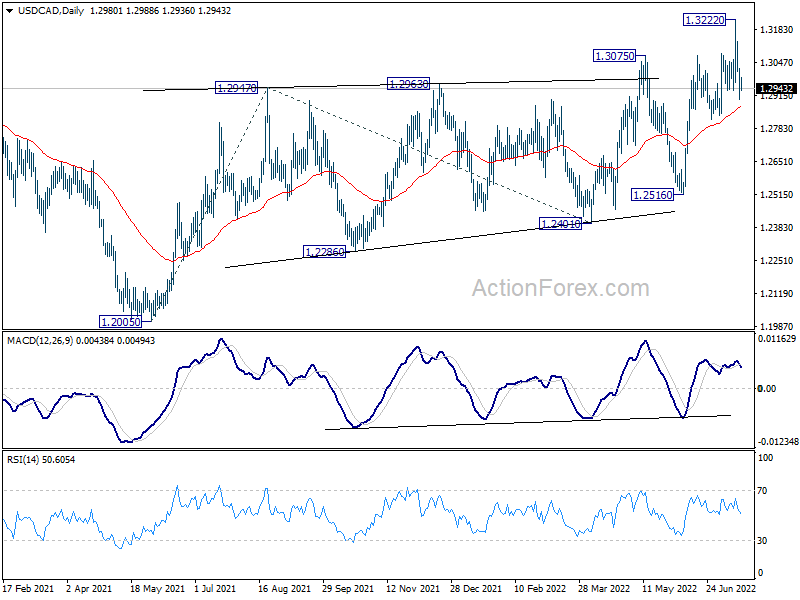
Intraday bias in USD/CAD remains mildly on the downside at this point. Fall from 1.3222 short term top would target 1.2818 support first. Firm break there will bring deeper fall back to 1.2516 key support. For now, risk will stay mildly on the downside as long as 1.3222 resistance holds, in case of recovery.
In the bigger picture, down trend from 1.4667 (2020 high) should have completed at 1.2005, after defending 1.2061 long term cluster support. Rise from there should target 61.8% retracement of 1.4667 to 1.2005 (2021 low) at 1.3650. This will remain the favored case now as long as 1.2516 support holds.
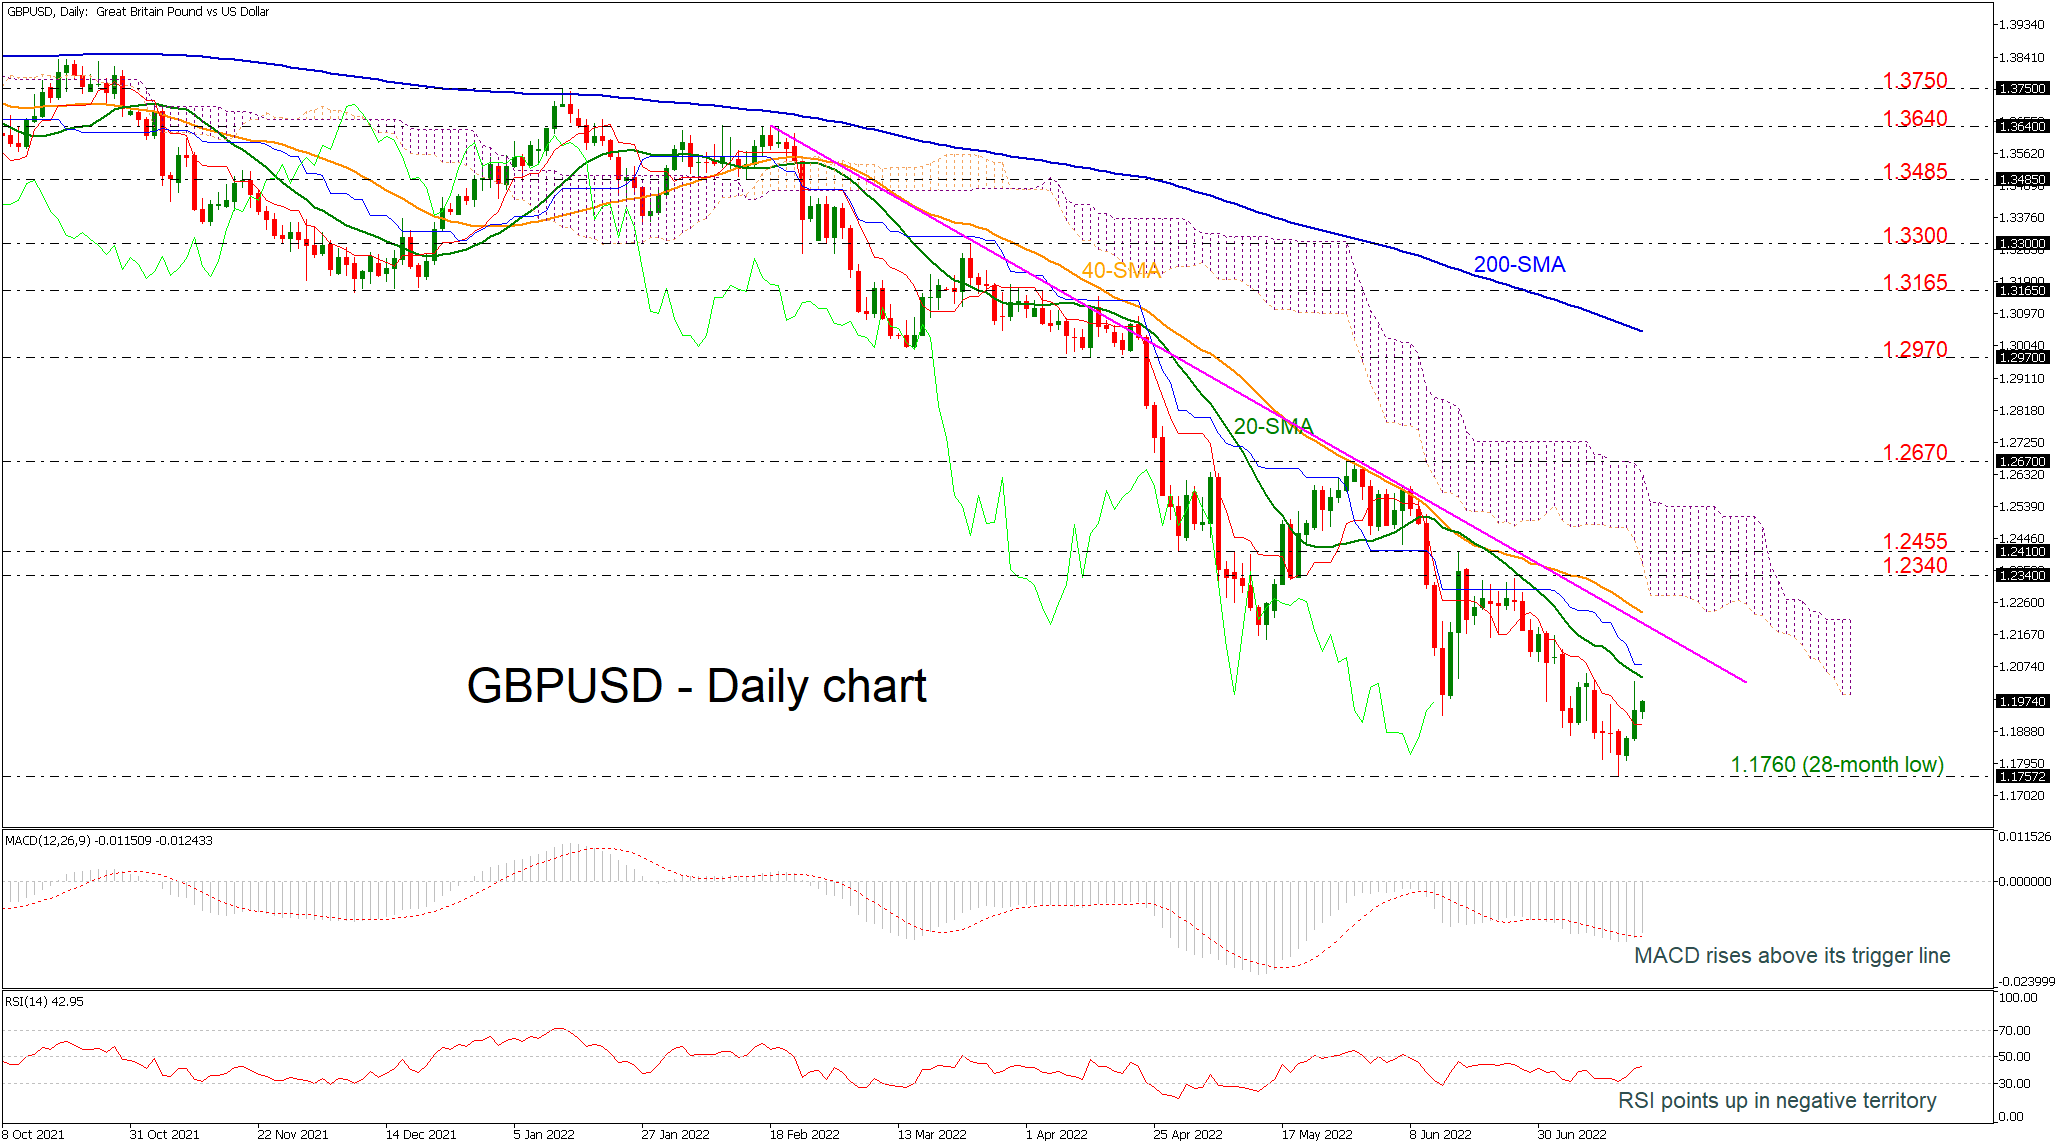
GBPUSD Jumps Higher to Meet 1.2000
GBPUSD is showing signs of being positive in the short run, after gaining ground on Thursday and breaking over its 28-month low of 1.1760. The technical indicators are pointing upwards as the RSI is on the rise, but it has not yet come close to the neutral threshold of 50, and the MACD is crossing its trigger line to the upside while still being in the negative region.
The 20-day simple moving average (SMA), which is located at 1.2040, and the blue Kijun-sen line are expected to present an immediate barrier to any additional price advances. This is also close to the descending trend line of 1.2200, which means that this could prove to be a challenging obstacle for the pair to overcome. In the event that a successful breakout occurs above this region, additional resistance is likely to be found in the area of 1.2340-1.2455.
On the other hand, if the momentum weakens, and the pair were to start moving in the opposite direction again, the multi-month low at 1.1760 would be the first support level. If prices break below this level, they may move closer to the barrier at 1.1410, which was registered in March 2020.
As long as prices are located below the declining trend line, the bearish scenario will most likely continue to apply to the more medium-term picture, where it has not changed at all and where it is likely to continue to hold.
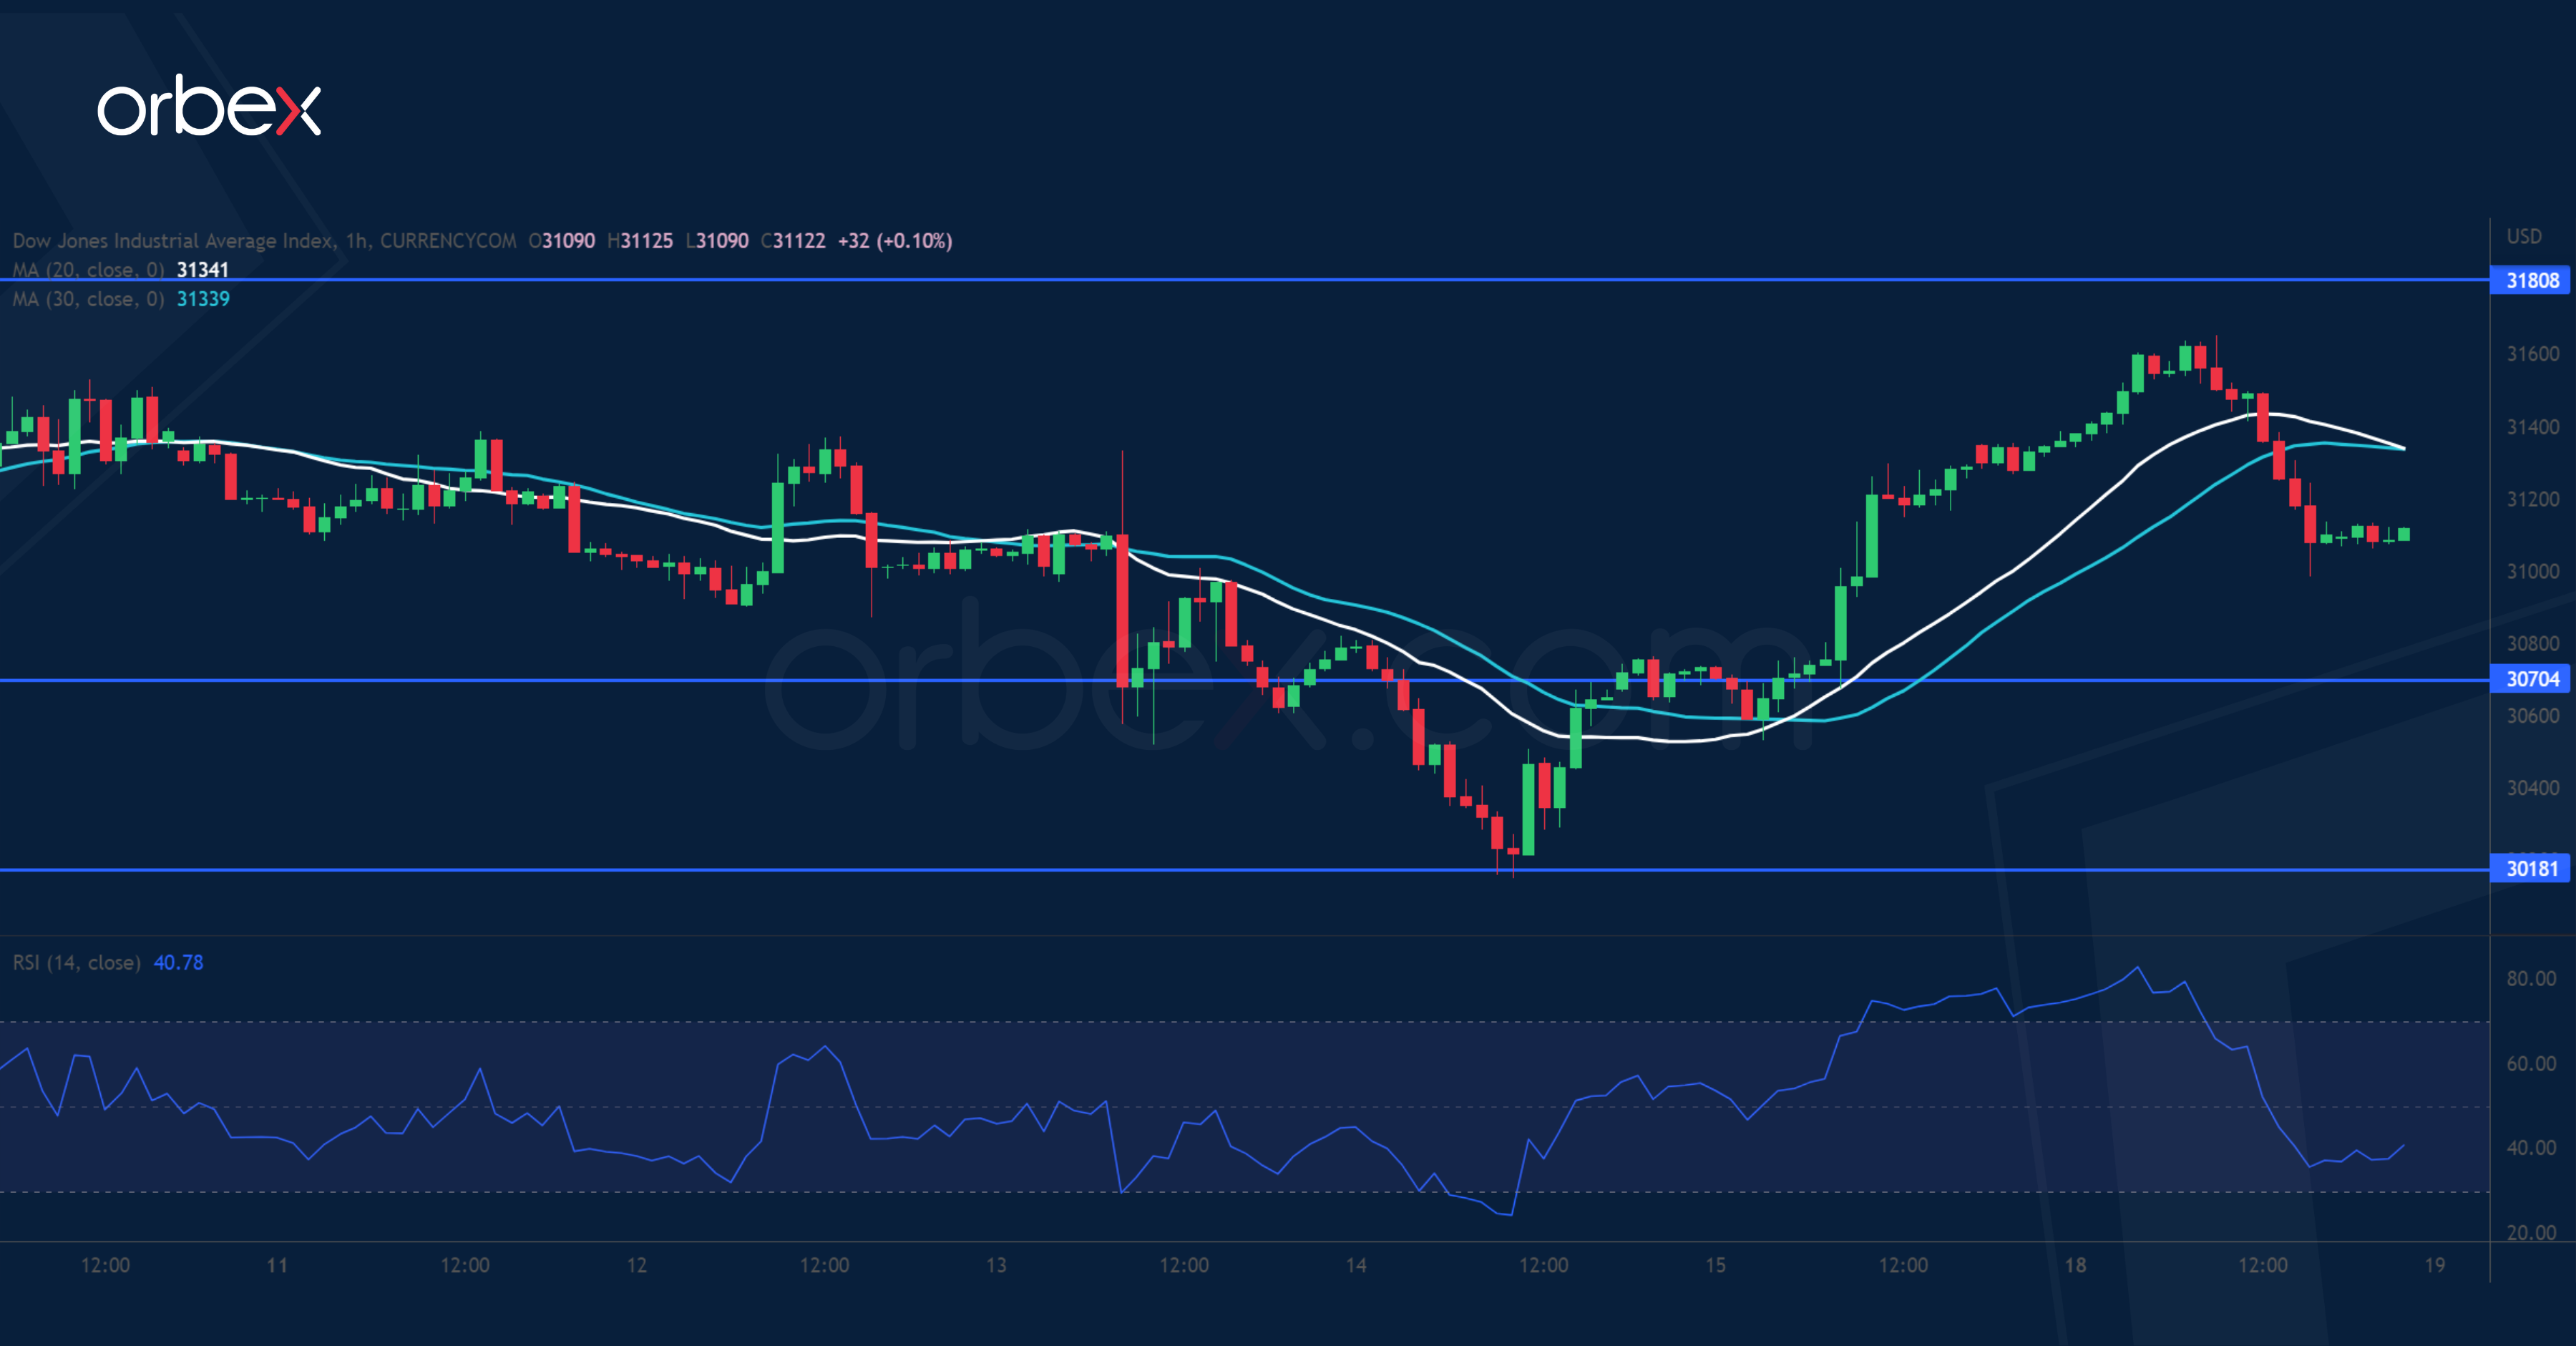
US 30 Hits Resistance
The Dow Jones 30 fell back after major financial stocks reported lower profits in the second quarter. A rally back above the 30-day moving average near 31500 indicates solid interest in keeping the index steady. The recent high at 31800 is a critical ceiling and a breakout might turn short-term sentiment around, opening the door to June’s high at 33300. In the meantime, the RSI’s overbought condition led buyers to take profit. 30700 is a fresh support and 30180 an important floor to keep the current rebound intact.