

Sample Category Title
AUD/USD Daily Report
Daily Pivots: (S1) 0.6739; (P) 0.6772; (R1) 0.6826; More...
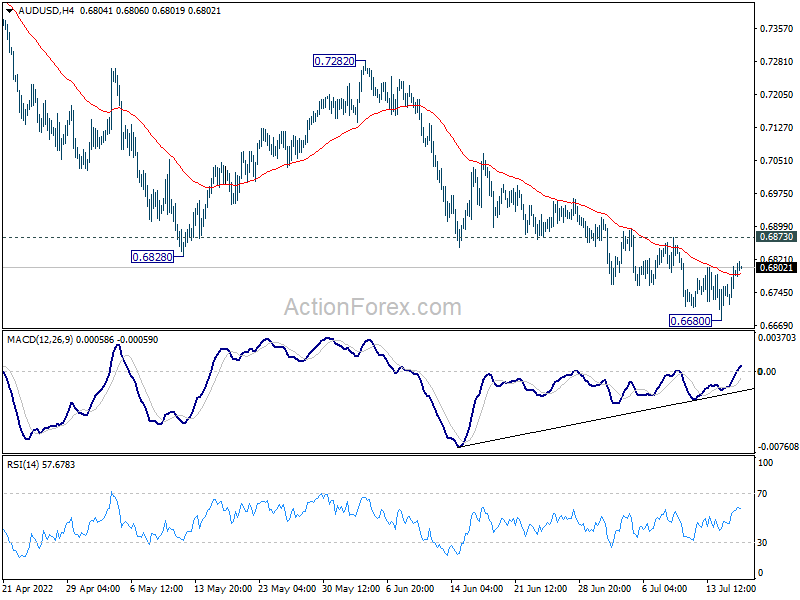
Intraday bias in AUD/USD remains neutral for the moment. Further decline is expected with 0.6873 resistance intact. Break of 0.6680 will target next fibonacci level at 0.6461. On the upside, break of 0.6873 minor resistance will turn bias back to the upside for stronger rebound instead.
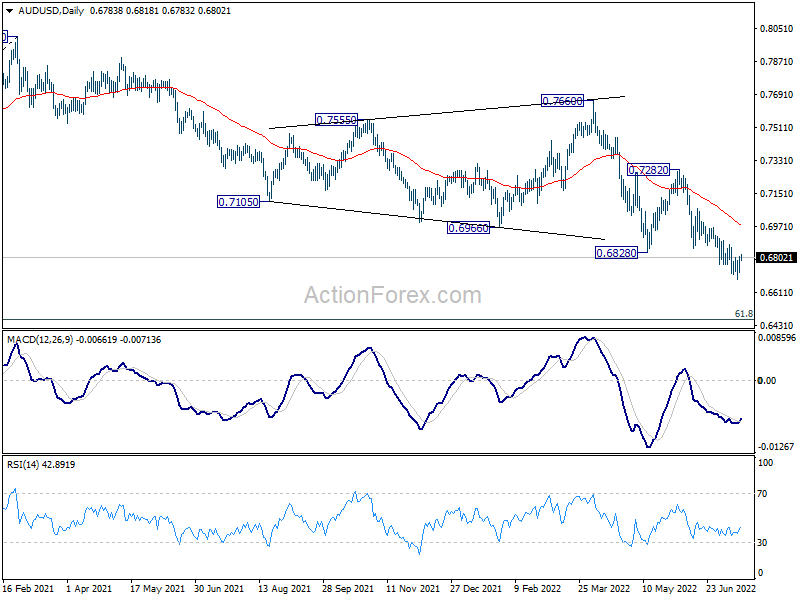
In the bigger picture, price actions from 0.8006 could still be a corrective pattern to rise from 0.5506 (2020 low). But current downside acceleration is raising the chance that it's a bearish impulsive move. In either case, outlook will remain bearish as long as 0.7282 resistance holds. Next target is 61.8% retracement of 0.5506 to 0.8006 at 0.6461.
EUR/USD Daily Outlook
Daily Pivots: (S1) 1.0031; (P) 1.0064; (R1) 1.0122; More...
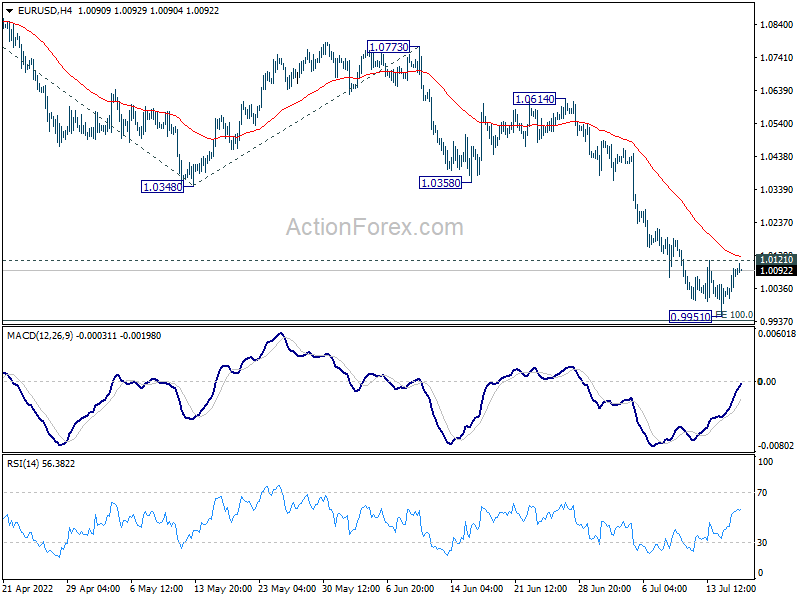
Intraday bias in EUR/USD remains neutral for the moment. On the upside, break of 1.0121 will turn bias back to the upside for stronger rebound to 1.0348 support turned resistance. Nevertheless, sustained break 100% projection of 1.1184 to 1.0348 from 1.0773 at 0.9937 will extend larger down trend to 161.8% projection at 0.9420.
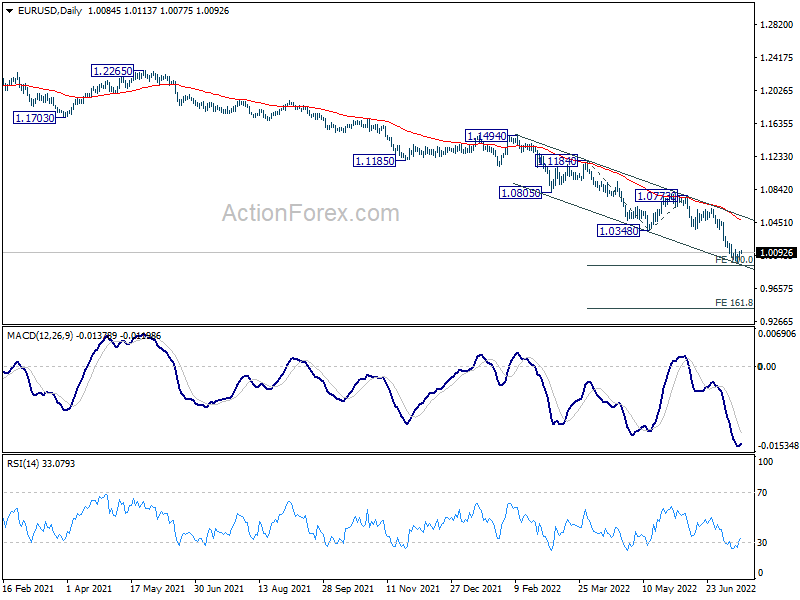
In the bigger picture, down trend from 1.6039 (2008 high) is still in progress. Next target is 100% projection of 1.3993 to 1.0339 from 1.2348 at 0.8694. In any case, outlook will stay bearish as long as 1.0773 resistance holds, in case of rebound.
GBP/USD Daily Outlook
Daily Pivots: (S1) 1.1824; (P) 1.1850; (R1) 1.1894; More...
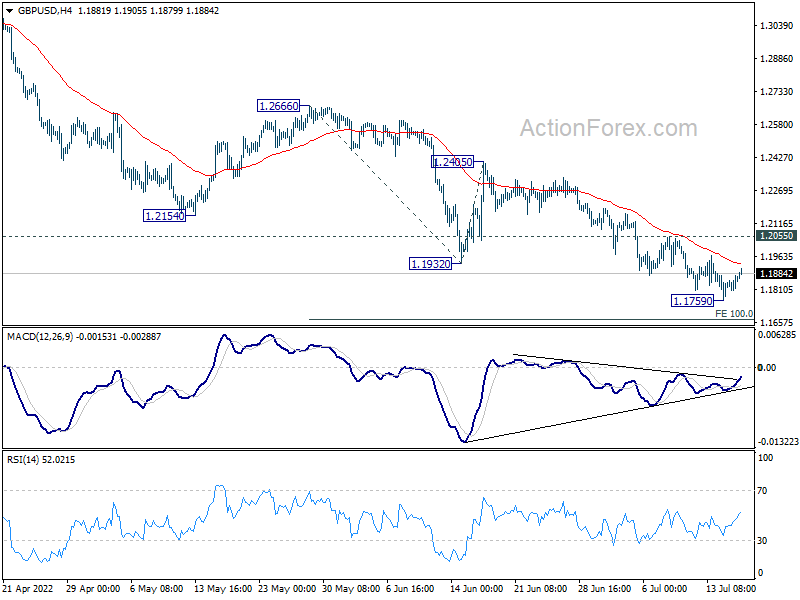
Intraday bias in GBP/USD remains neutral for the moment and consolidation from 1.1759 could extend further. Deeper decline is still expected with 1.2055 minor resistance intact. Below 1.1759 will resume recent down trend to 100% projection of 1.2666 to 1.1932 from 1.2405 at 1.1671. Break there will target 1.1409 long term support. Nevertheless, break of 1.2055 will turn bias to the upside for stronger rebound.
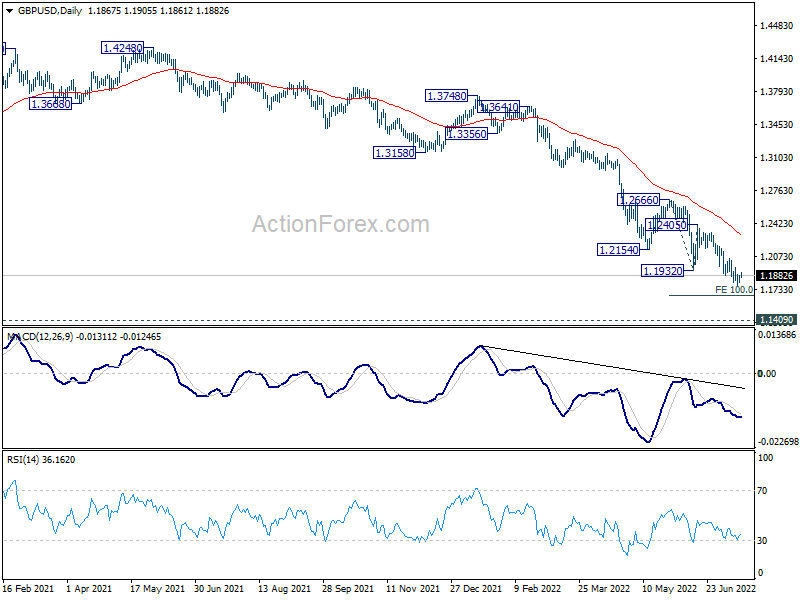
In the bigger picture, fall from 1.4248 (2018 high) could be a leg inside the pattern from 1.1409 (2020 low), or resuming the longer term down trend. Deeper decline is expected as long as 1.2666 resistance holds. Next target is 1.1409 low. However, firm break of 1.2666 will bring stronger rise back to 55 week EMA (now at 1.3065).
USD/JPY Daily Outlook
Daily Pivots: (S1) 138.20; (P) 138.67; (R1) 138.94; More...
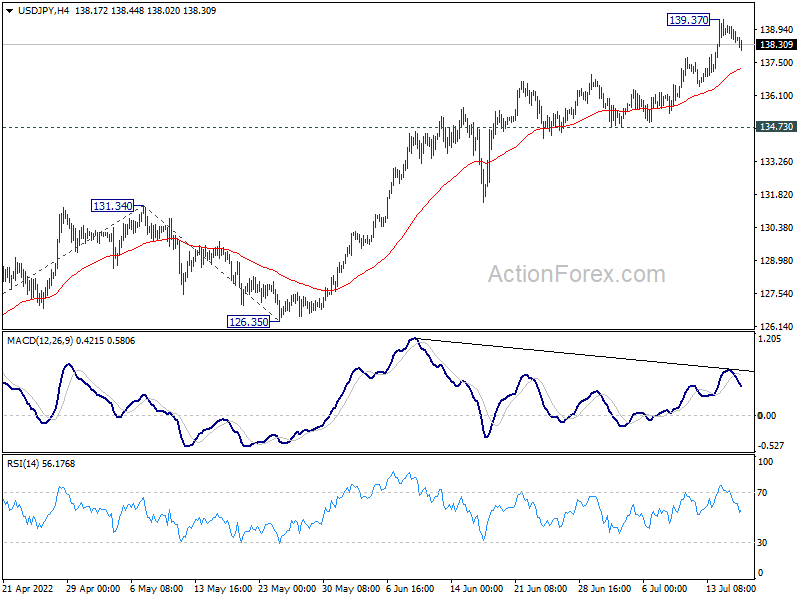
Intraday bias in USD/JPY remains neutral as consolidation from 139.37 continues. Downside of retreat should be contained by 134.73 support. On the upside, break of 139.37 will resume larger up trend to 100% projection of 114.40 to 131.34 from 126.35 at 143.29.
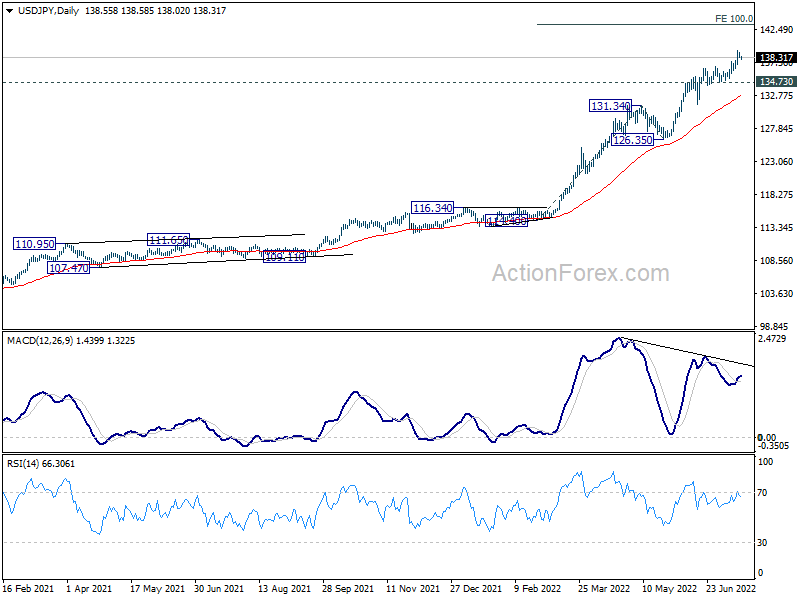
In the bigger picture, current rally is seen as part of the long term up trend from 75.56 (2011 low). Next target is 100% projection of 75.56 (2011 low) to 125.85 (2015 high) from 98.97 at 149.26, which is close to 147.68 (1998 high). This will remain the favored case as long as 126.35 support holds.
Technical Outlook and Review
DXY:
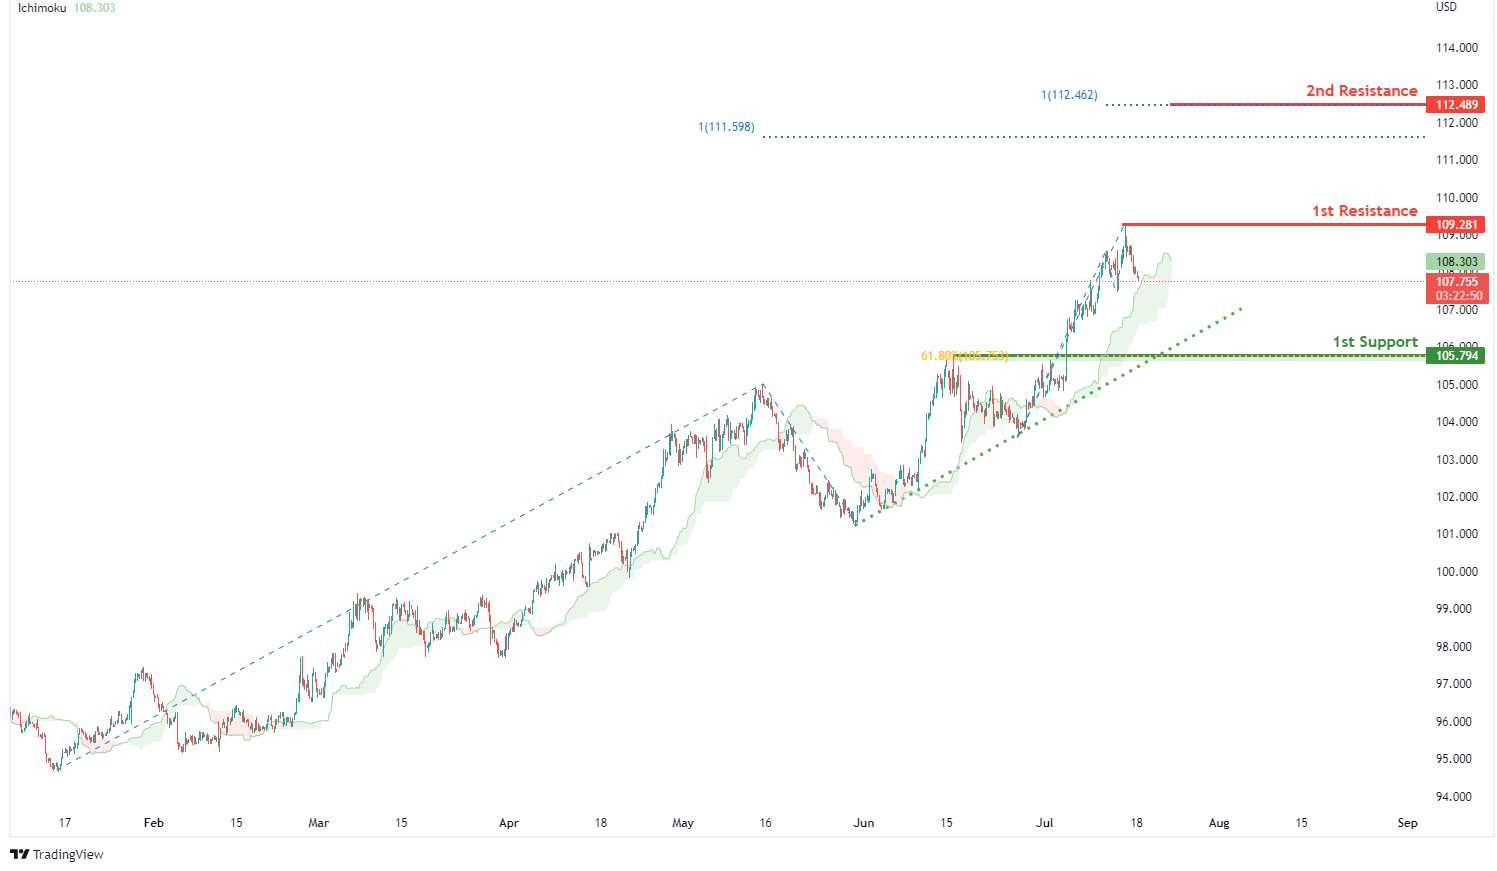
On the H4, with prices moving above the ichimoku indicator and along the ascending trendline, we have a bullish bias that prices will rise to 1st resistance at 109.281 where the swing high resistance is. Once there is upside confirmation of price breaking 1st resistance, we would expect bullish momentum to carry price to 2nd resistance at 112.489 in line with 100% fibonacci projection and 100% fibonacci projection. Alternatively, price may drop to 1st support at 105.794 where the horizontal pullback support and 61.8% fibonacci retracement are.
Areas of consideration:
- H4 time frame, 1st resistance at 112.489
- H4 time frame, 1st support at 109.281
XAU/USD (GOLD):
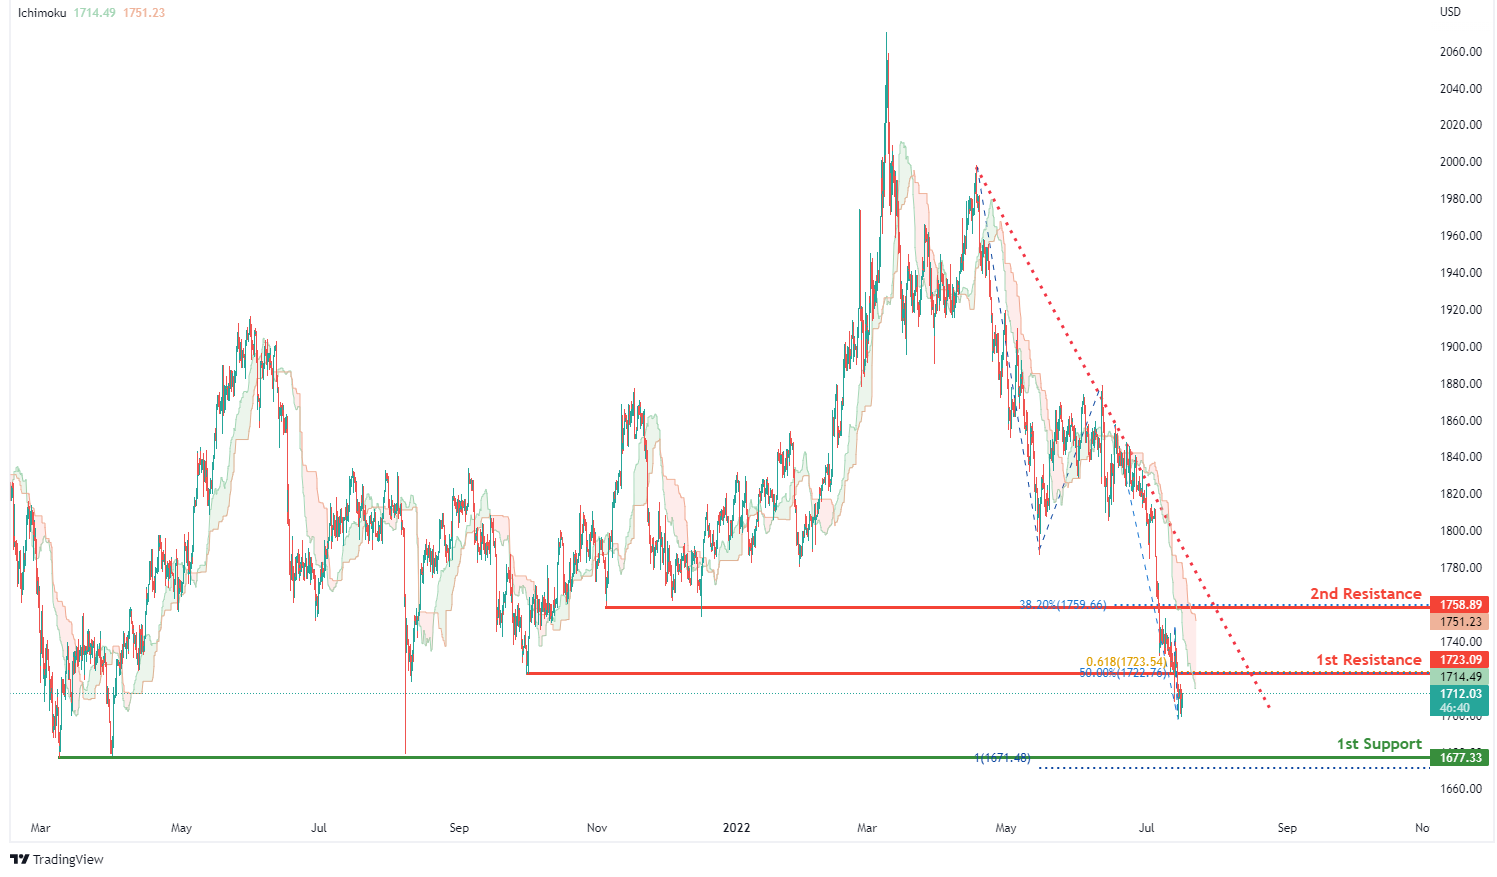
On the H4, with prices moving below the ichimoku indicator and along a descending trendline, we have a bearish bias that prices will rise and drop from our 1st resistance at 1723.09 where the horizontal pullback resistance, 50% fibonacci retracement and 61.8% fibonacci projection are to our 1st support at 1677.33 in line with swing low support and 100% fibonacci projection. Alternatively, price could break 1st resistance structure and rise to our 2nd resistance at 1758.89 in line with overlap resistance and 38.2% fibonacci retracement.
Areas of consideration:
- H4 time frame, 1st Resistance at 1723.09
- H4 time frame, 1st Support at 1677.33
GBP/USD:
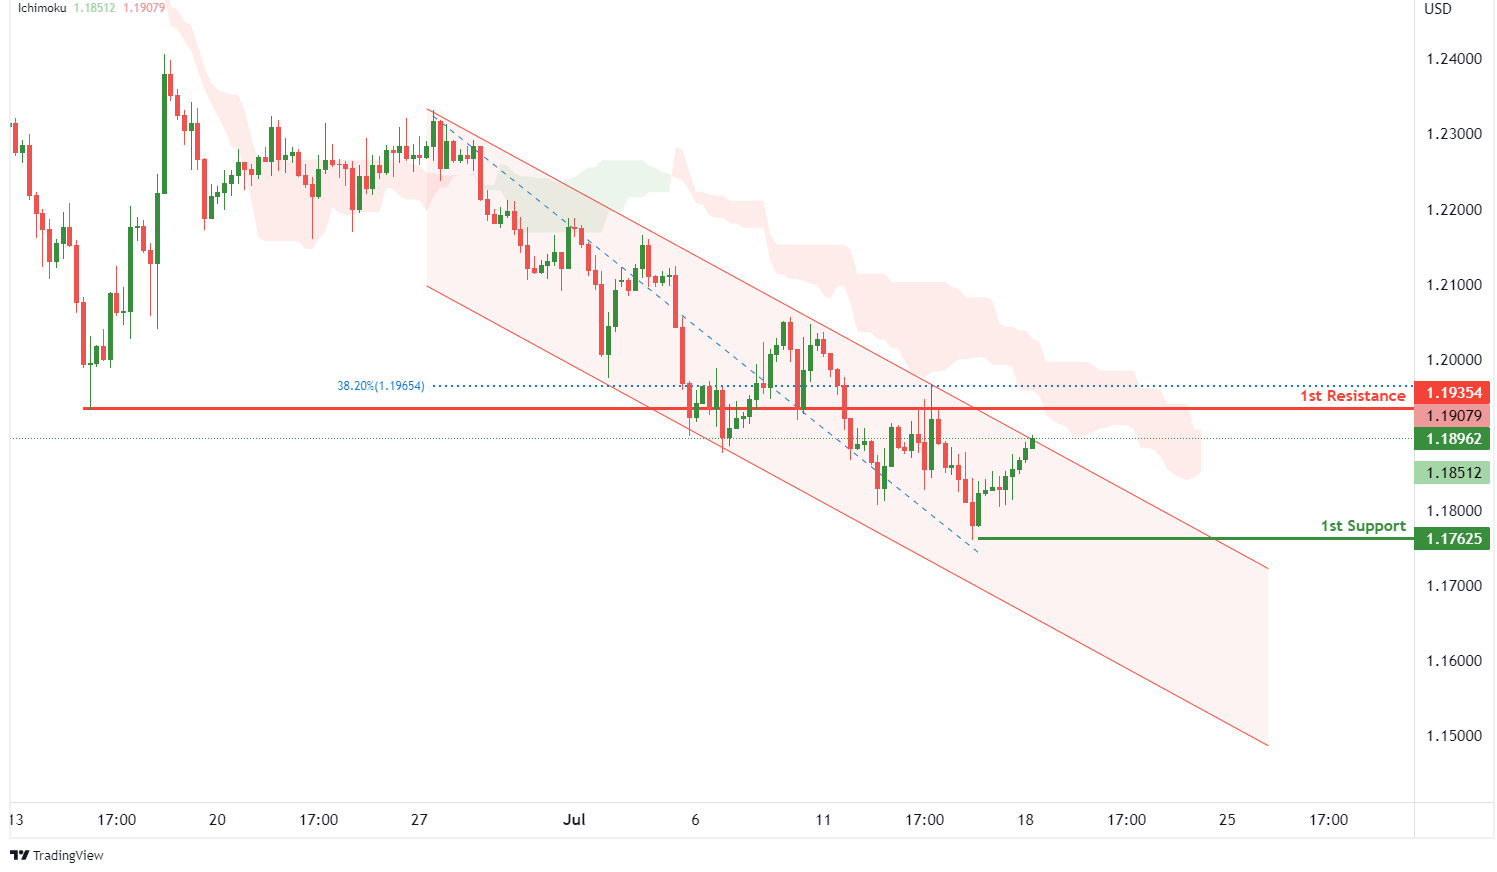
On the H4, with prices moving below the ichimoku indicator and within the descending channel, we have a bearish bias that prices will drop to our 1st support at 1.17625 where the swing low support is. Alternatively, price could rise to 1st resistance at 1.19354 in line with the pullback resistance and 38.2% fibonacci retracement.
Areas of consideration:
- H4 1st resistance at 1.19354
- H4 1st support at 1.17625
USD/CHF:
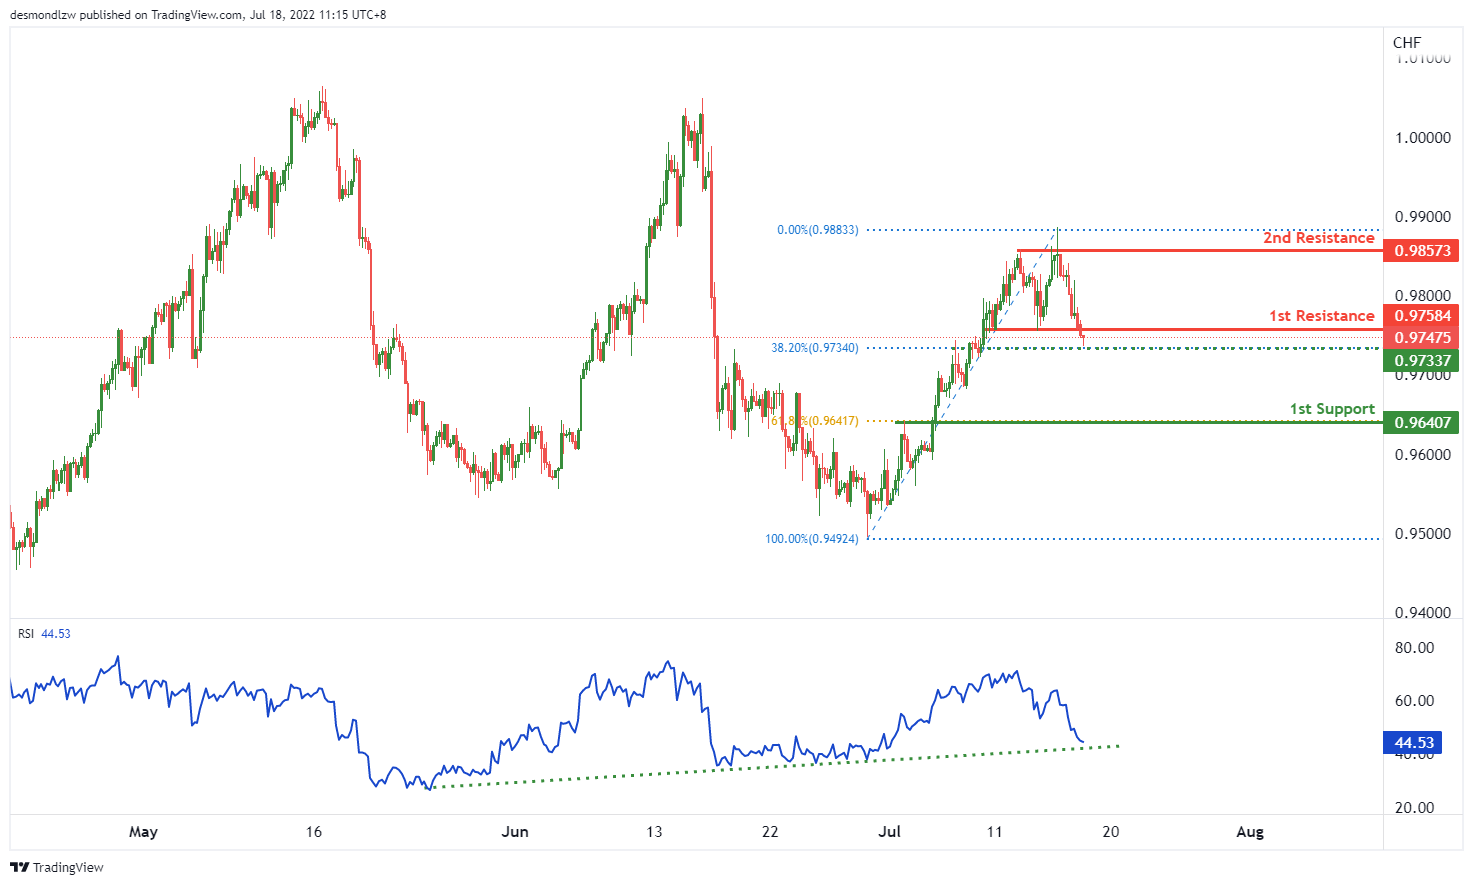
On the H4, with price is shown as a “double top” pattern, we have a bearish bias that price will drop from our 1st support at 0.97584 where the neckline is to our 1st support at 0.96407 in line with the 61.8% fibonacci retracement. Alternatively, price may not break 1st resistance and head for 2nd resistance at 0.98573 where the double tops are..
Areas of consideration
- 1st support level at 0.96407
- 1st resistance level at 0.97584
EUR/USD :
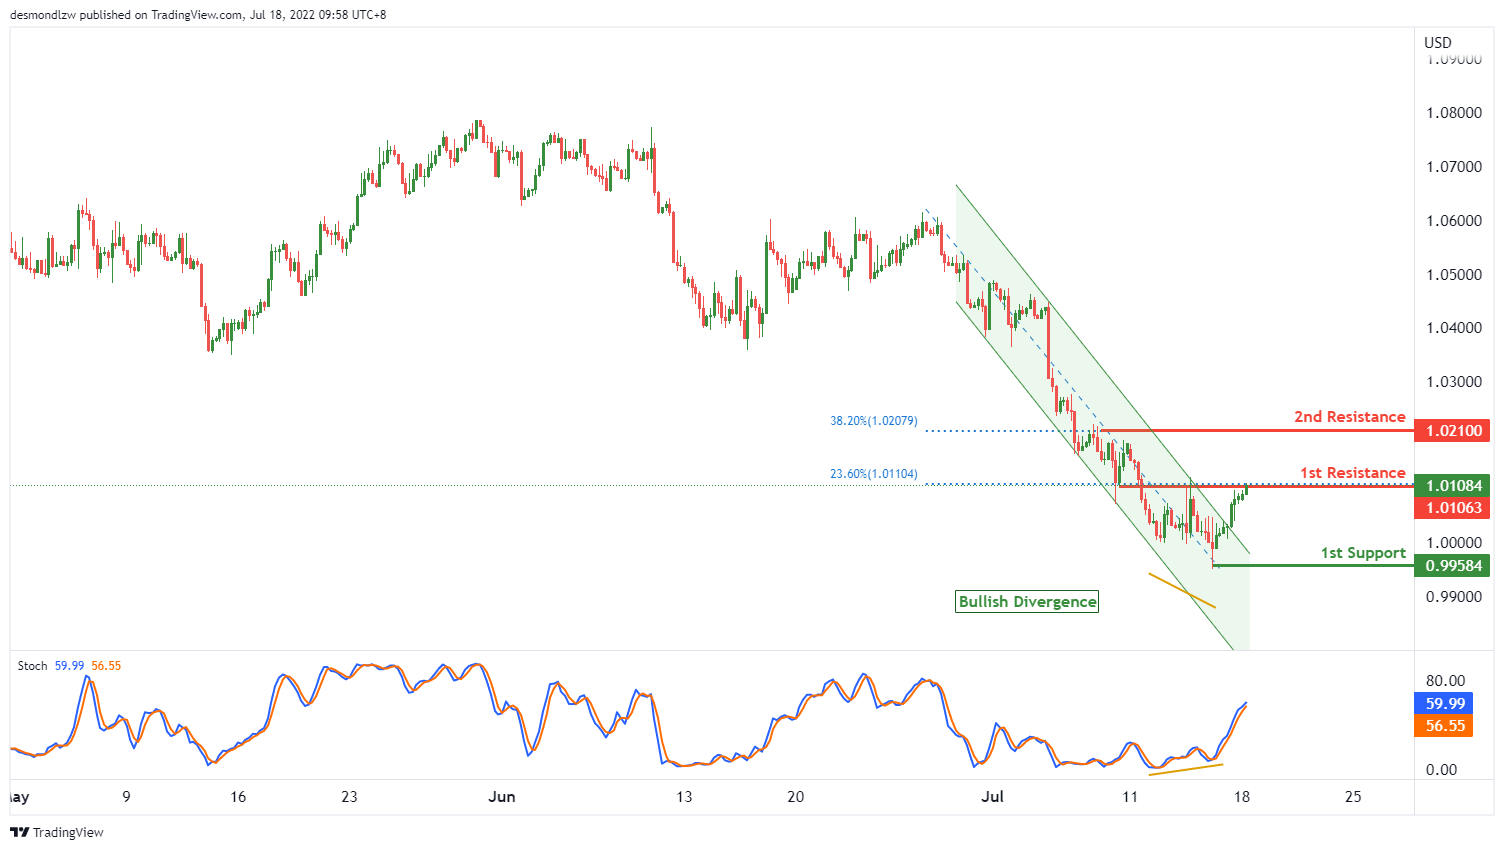
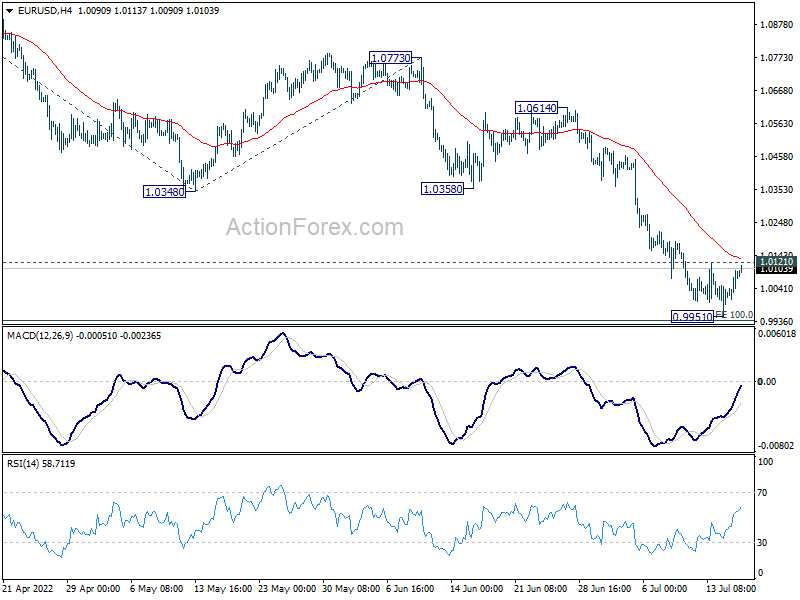
On the H4, with price recently breaking the descending trend channel and showing bullish divergence on stochastics, we have a bullish bias that price will rise from the 1st resistance at 1.01063 at the overlap resistance in line with the 23.6% fibonacci retracement to the 2nd resistance at 1.02100 in line with the 38.2% fibonacci retracement. Alternatively, price may reverse off the 1st resistance and drop to the 1st support at 0.99584 at the swing low.
Areas of consideration :
- H4 1st resistance at 1.01063
- H4 1st support at 0.99584
USD/JPY:
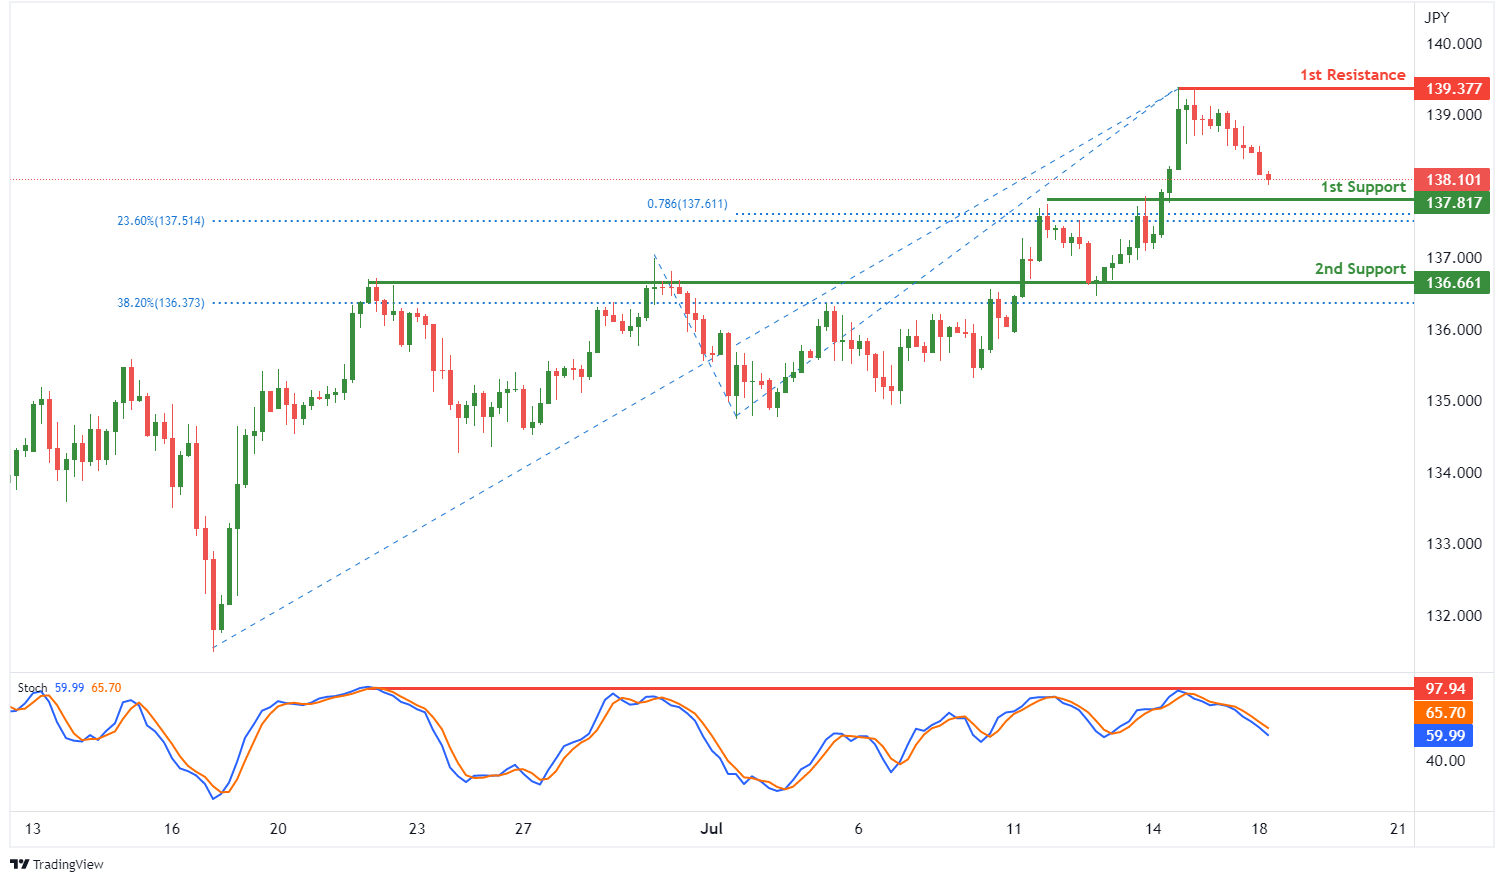
On the H4, with price reversing off stochastic resistance, we have a bearish bias that price will drop to our 1st support at 137.817 where the pullback support, 78.6% fibonacci projection and 23.6% fibonacci retracement. Once there is downside confirmation of price breaking 1st support, we would expect bearish momentum to carry price to 2nd support at 136.661 in line with overlap support and 38.2% fibonacci retracement. Alternatively, price could rise to 1st resistance at 139.377 where the swing high resistance is.
Areas of consideration:
- H4 time frame, 1st resistance at 139.377
- H4 time frame, 1st support at 137.817
AUD/USD:
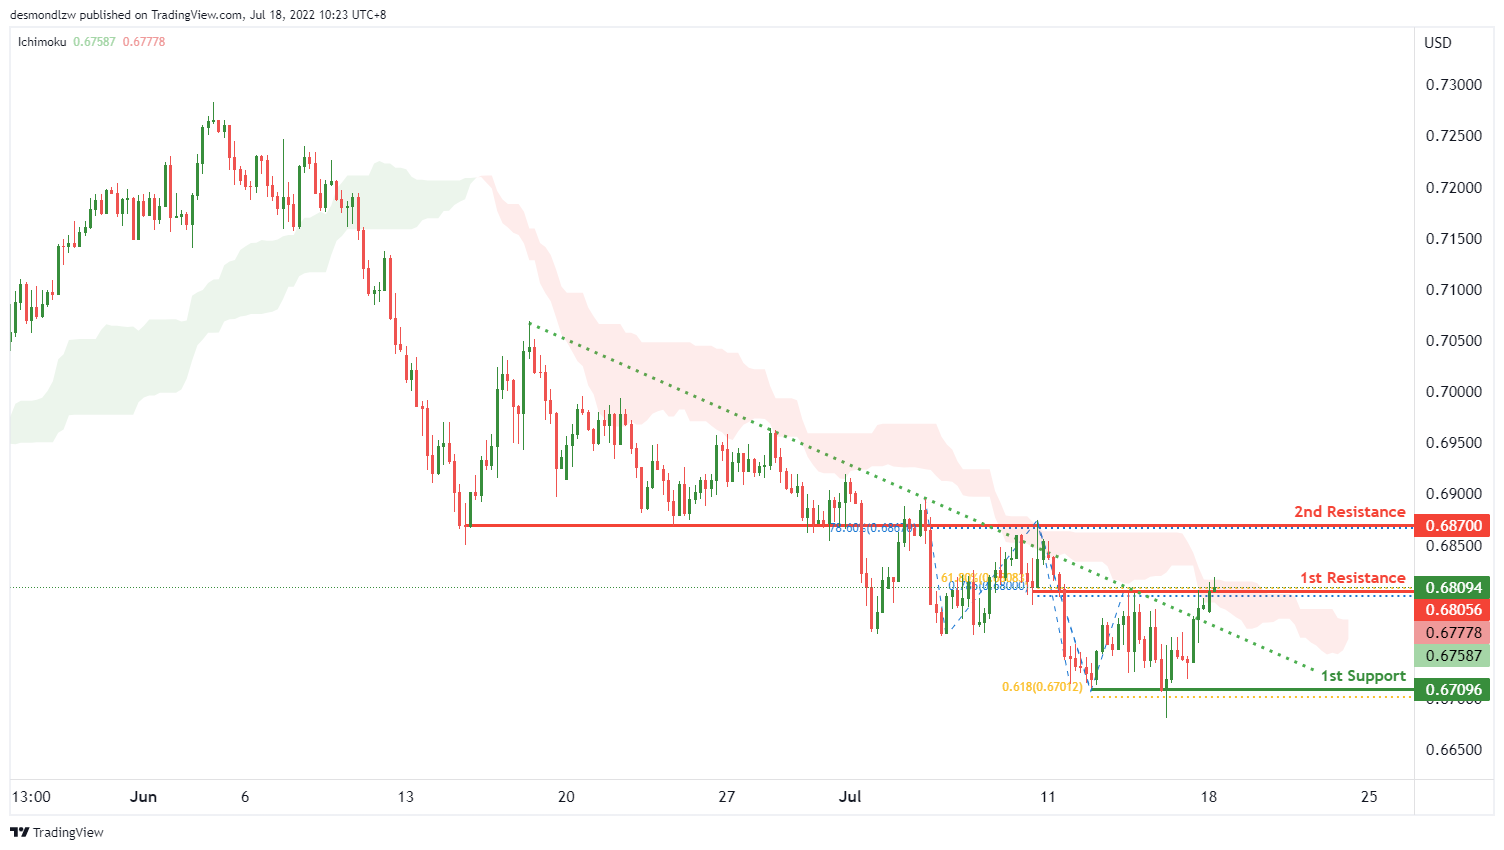
On the H4, with price recently breaking the descending trendline and bouncing off the ichimoku cloud, we have a bullish bias that price will continue to rise from the 1st resistance at 0.68056 at the pullback resistance in line with the 78.6% fibonacci projection and 61.8% fibonacci retracement to the 2nd resistance at 0.68700 at the overlap resistance in line with the 78.6% fibonacci retracement. Alternatively, price may reverse off the 1st resistance and drop to the 1st support at 0.67096 at the swing low in line with the 61.8% fibonacci projection.
Areas of consideration
- H4 1st resistance at 0.68056
- H4 1st support at 0.67096
NZD/USD:
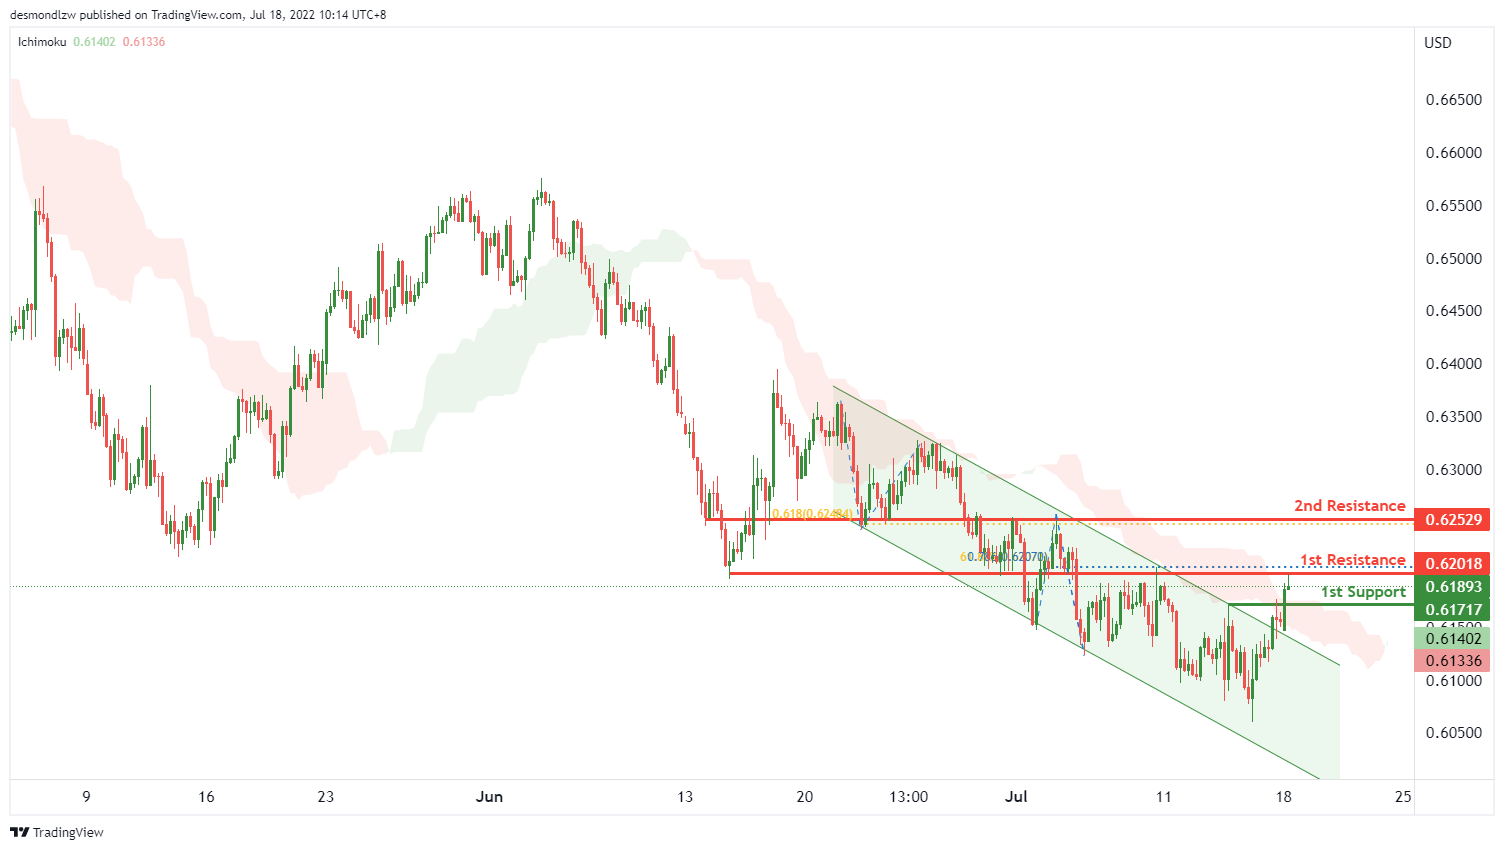
On the H4, with price recently breaking the descending trend channel and moving above the ichimoku cloud, we have a bullish bias that price will continue to rise from the 1st resistance at 0.62018 in line with the 61.8% fibonacci retracement and 78.6% Fibonacci projection to the 2nd resistance at 0.62529 at the pullback resistance in line with the 61.8% fibonacci projection. Alternatively, price may reverse off the 1st resistance and drop to the 1st support at 0.61717 at the pullback support.
Areas of consideration:
- H4 time frame, 1st support at 0.61717
- H4 time frame, 1st resistance at 0.62018
USD/CAD:
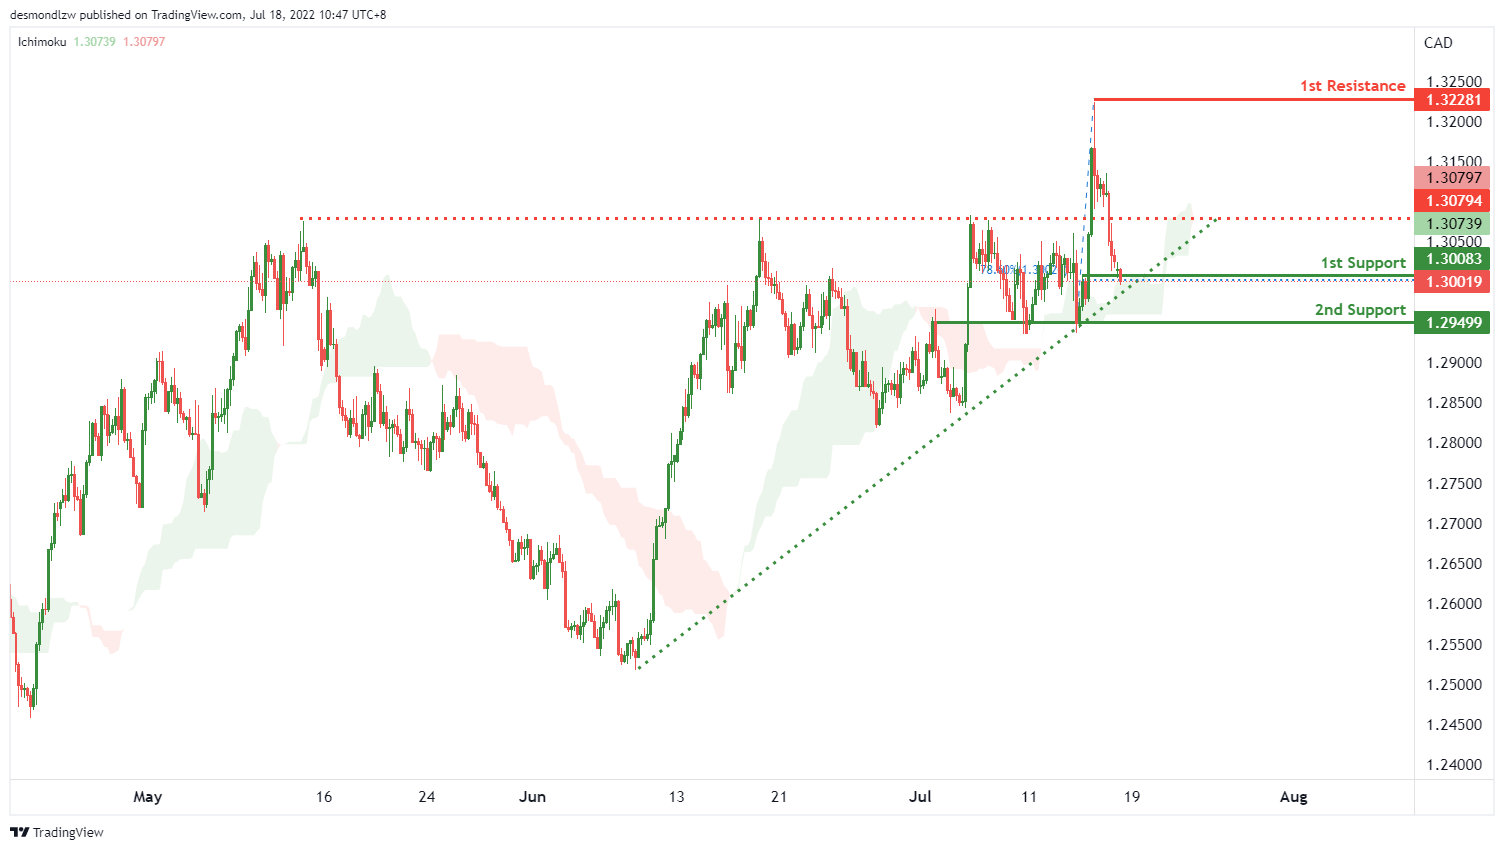
On the H4, with price bouncing off the ichimoku cloud and moving in an ascending trendline, we have a bullish bias that price will rise from our 1st support at 1.30083 where the horizontal pullback support is in line with the 78.6% fibonacci retracement to the 1st resistance at 1.32281 in line with the horizontal swing high resistance. Alternatively, price may break the support structure at the 1st support and drop to the 2nd support at 1.29499 at the overlap swing low. Take note of the pullback resistance at 1.30794 in line with multiple swing highs.
Areas of consideration:
- H4 time frame, 1st resistance at 1.32281
- H4 time frame, 1st support at 1.30083
OIL:
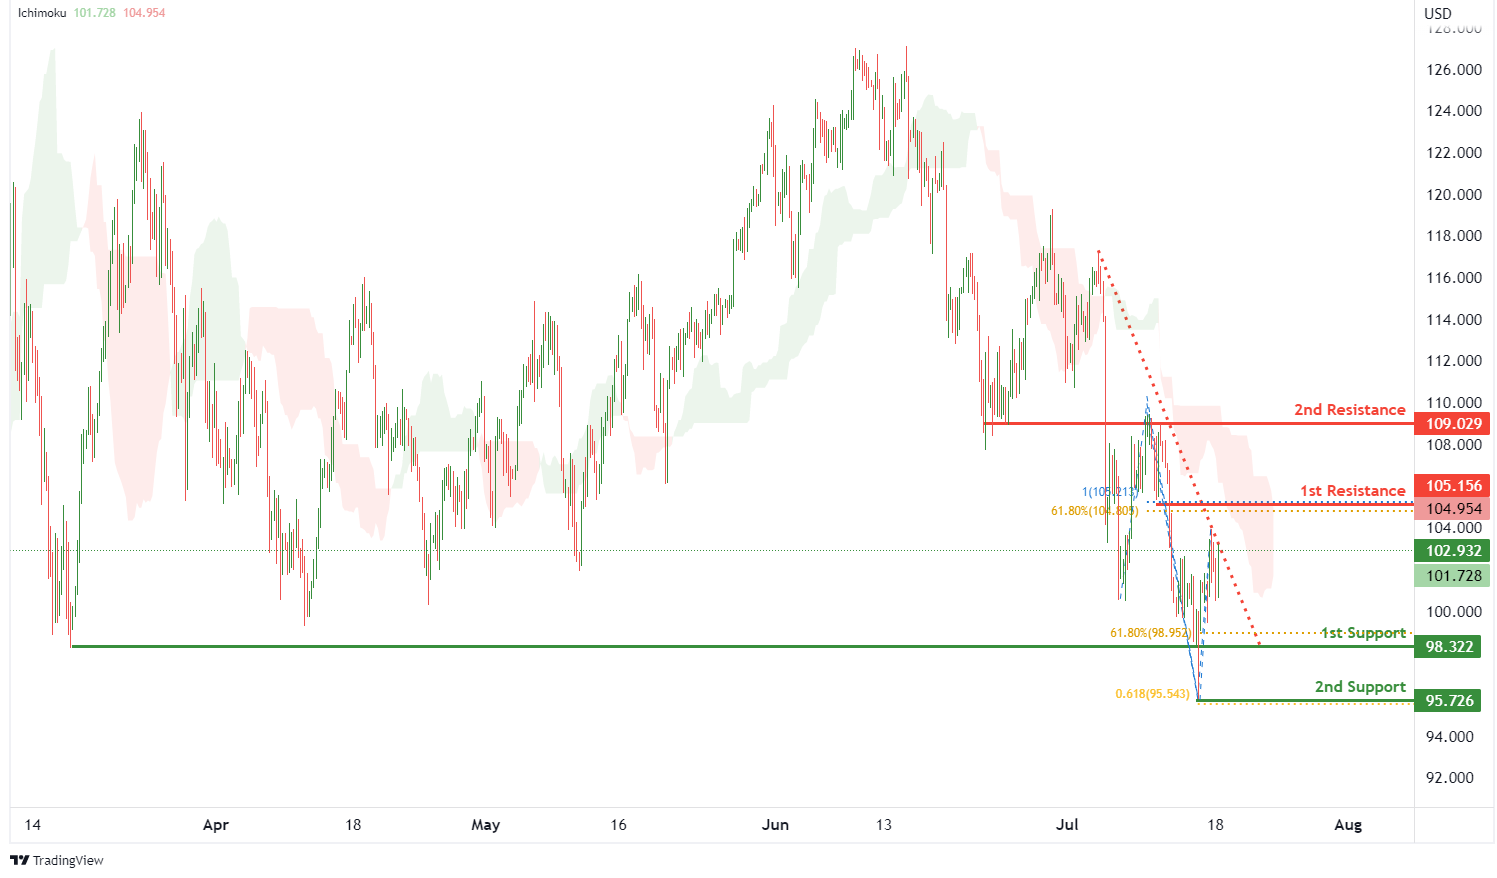
On the H4, with price moving below the ichimoku cloud and along the descending trendline, we have a bearish bias that price will drop to our 1st support at 98.322 where the swing low support and 61.8% Fibonacci retracement are. Once there is downside confirmation of price breaking 1st support, we would expect bearish momentum to carry price to 2nd support at 95.726 where the swing low support and 61.8% fibonacci projection are. Alternatively, price may rise to 1st resistance at 105.156 in line with 100% fibonacci projection and 61.8% fibonacci retracement. Should price break 1st resistance, we would have a bullish bias that price would rise to 2nd resistance at 109.029 where the overlap resistance is.
Areas of consideration:
- H4 time frame, 1st resistance of 105.156
- H4 time frame, 1st support of 98.322
Dow Jones Industrial Average:
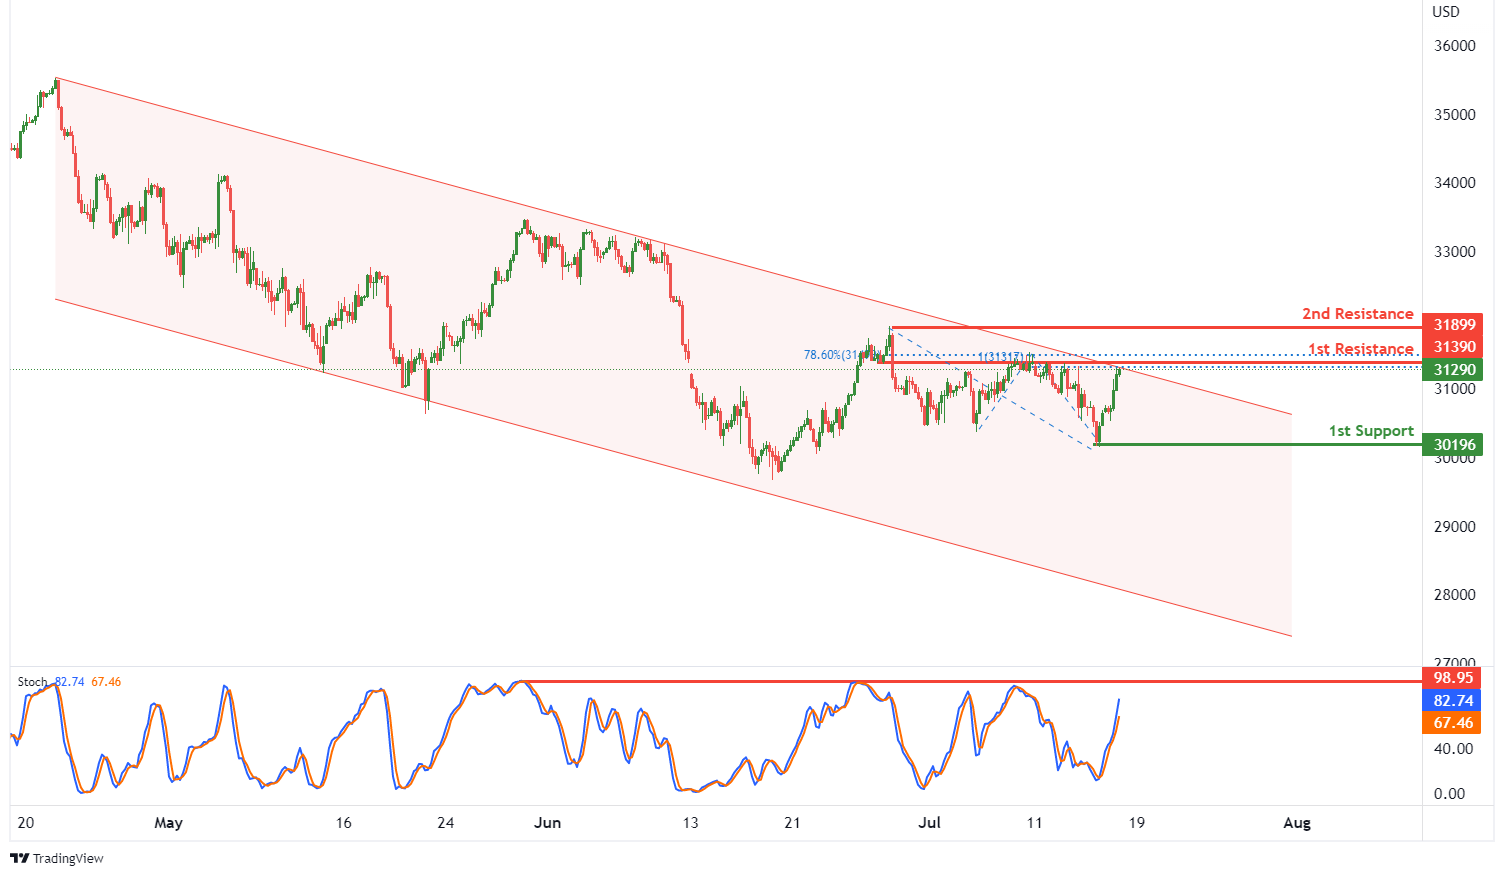
On the H4, with price moving within the descending channel and expected to reverse off the stochastic resistance, we have a bearish bias that price will rise and drop from the 1st resistance at 31390 at the overlap resistance, 100% fibonacci projection and 78.6% fibonacci retracement to the 1st support at 30196 at the swing low support. Alternatively, price may break 1st resistance and rise to 2nd resistance at 31899 where the swing high resistance is.
Areas of consideration:
- H4 time frame, 1st resistance of 31390
- H4 time frame, 1st support of 30196
USD/CHF Daily Outlook
Daily Pivots: (S1) 0.9731; (P) 0.9789; (R1) 0.9818; More...
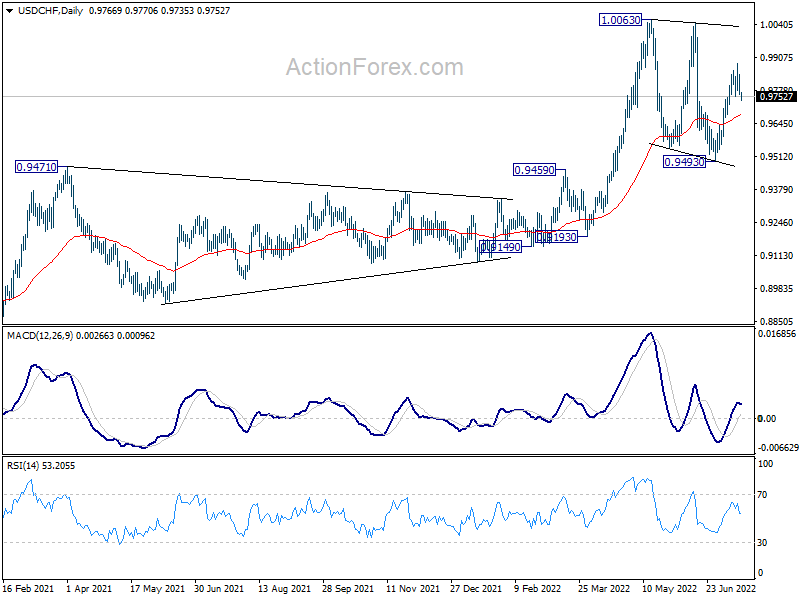
USD/CHF's break of 0.9754 minor support argues that rebound from 0.9493 is complete at 0.9884. Consolidation from 1.0063 is extending with another falling leg. Intraday bias is back on the downside for 55 day EMA (now at 0.9680). Firm break there will target 0.9493 support again. on the upside, above 0.9884 will resume the rebound to retest 1.0063 high.
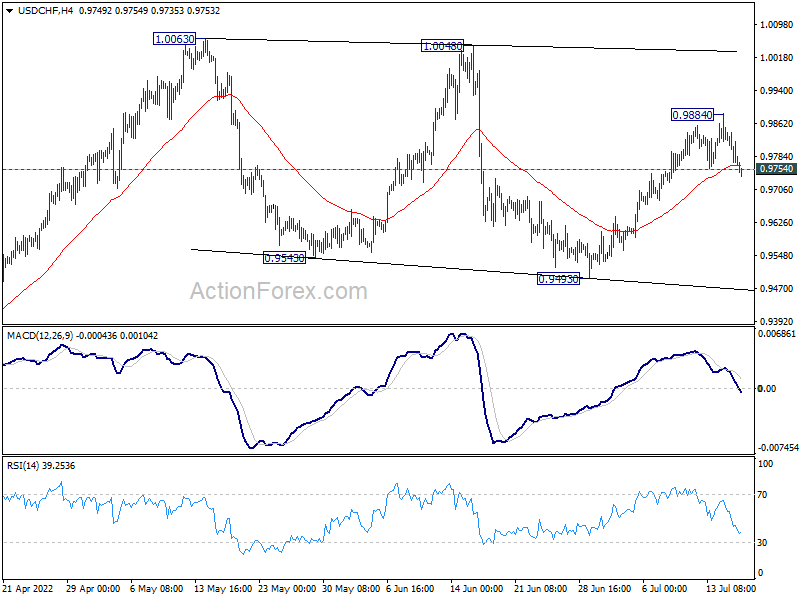
In the bigger picture, medium term up trend from 0.8756 (2021 low) is still in progress. Next target is 1.0342 (2016 high). Sustained break there will resume long term up trend from 0.7065 (2011 low). This will remain the favored case as long as 0.9471 resistance turned support holds.
Dollar Extending Pull Back; ECB, BoJ and Lots of Data This Week
Risk sentiment is positive as another week starts, with major Asian indexes trading higher while Japan is on holiday. Dollar is extending its near term pull back while Yen and Swiss Franc are also soft. On the other hand, New Zealand Dollar is lifted slightly by stronger than expected consumer inflation data, while Aussie and Sterling are also firmer. Euro is mixed for now, and looks forward to ECB's rate hike later in the week.
Technically, USD/CHF's break of 0.9754 minor support is the first sign of a more sustainable pull back in Dollar. Attention will now be on 1.0121 minor resistance in EUR/USD. Firm break there will argue that parity is safe for EUR/USD for now, and stronger rebound would be seen back to 1.0348 support turned resistance. That would accompanied by more broad-based position squaring in the greenback.
In Asia, at the time of writing, Hong Kong HSI is up 2.57%. China Shanghai SSE is up 1.34%. Singapore Strait Times is up 0.62%. Japan is on holiday.
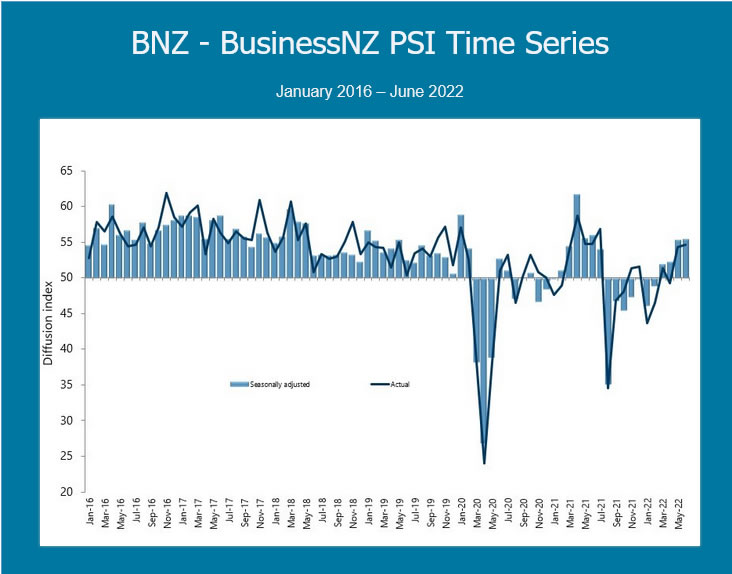
New Zealand BusinessNZ services rose slightly to 55.4, sustained improvement
New Zealand BusinessNZ Performance of Services Index ticked up from 55.3 to 55.4 in June, staying above long term average of 53.6 or the survey. Activity/sales dropped from 59.4 to 56.5. But employment improved notably from 49.0 to 53.1. New orders/business rose from 62.0 to 61.7. Stocks/inventories dropped from 54.7 to 54.1. Supplier deliveries rose from 45.6 to 47.8.
BNZ Senior Economist Craig Ebert said that "the move to traffic light Orange in mid-April, along with the expedited opening of the border, is clearly providing a basis for sustained improvement in New Zealand's services sector".
New Zealand CPI jumped to 32-yr high at 7.3% yoy in Q2
New Zealand CPI rose 1.7% qoq, 7.3% yoy in Q2, above expectation of 1.5% qoq, 7.1% yoy. The annual inflation accelerated from 6.9% yoy to 7.3%, a 32-year high, after 7.6% in Q2 1990.
StatsNZ said, "the main driver for the 7.3 percent annual inflation to the June 2022 quarter was the housing and household utilities group, due to rising prices for construction and rentals for housing... Transport was also a main driver of the quarterly rise, driven by petrol and diesel."
ECB to finally start rate hikes, lots of data featured
ECB will finally start raising interest rate this week. As the central bank has pre-committed, there will be a 25bps rate hike, in all the three policy rates. The question is whether ECB will pre-commit the size of September's hike, or keep it open. BoJ will also meet, but it's very sure that the central bank will stand bank. Other central bank activity include RBA minutes.
On the data front, inflation will again come into spotlights will CPI from new Zealand, UK, Canada, and Japan featured. UK will also publish job data, retail sales, and consumer confidence. Meanwhile, PMI data from Australia, Japan, UK, and Eurozone will be the focus towards the end of the week. Some highlights for the week:
- Monday: New Zealand CPI; Italy trade balance; Canada housing starts, NAHB housing index.
- Tuesday: RBA minutes; Swiss trade balance; UK employment; Eurozone CPI final; US housing starts and building permits.
- Wednesday: Germany PPI; UK CPI, PPI; Eurozone current account; Canada CPI, IPPI and RMPI; US existing home sales.
- Thursday: New Zealand trade balance; Japan trade balance, BoJ rate decision; UK public sector net borrowing; ECB rate decision; Canada new housing price index; US Philly Fed survey, jobless claims, leading index.
- Friday: Australia PMIs; Japan CPI, PMI manufacturing; UK Gfk consumer confidence, retail sales, PMIs; Eurozone PMIs; Canada retail sales; US PMIs.
USD/CHF Daily Outlook
Daily Pivots: (S1) 0.9731; (P) 0.9789; (R1) 0.9818; More...
USD/CHF's break of 0.9754 minor support argues that rebound from 0.9493 is complete at 0.9884. Consolidation from 1.0063 is extending with another falling leg. Intraday bias is back on the downside for 55 day EMA (now at 0.9680). Firm break there will target 0.9493 support again. on the upside, above 0.9884 will resume the rebound to retest 1.0063 high.
In the bigger picture, medium term up trend from 0.8756 (2021 low) is still in progress. Next target is 1.0342 (2016 high). Sustained break there will resume long term up trend from 0.7065 (2011 low). This will remain the favored case as long as 0.9471 resistance turned support holds.
Economic Indicators Update
| GMT | Ccy | Events | Actual | Forecast | Previous | Revised |
|---|---|---|---|---|---|---|
| 22:30 | NZD | Business NZ PSI Jun | 55.4 | 55.2 | 55.3 | |
| 22:45 | NZD | CPI Q/Q Q2 | 1.70% | 1.50% | 1.80% | |
| 22:45 | NZD | CPI Y/Y Q2 | 7.30% | 7.10% | 6.90% | |
| 08:00 | EUR | Italy Trade Balance (EUR) May | -2.32B | -3.67B | ||
| 12:15 | CAD | Housing Starts Y/Y Jun | 285K | 287K | ||
| 14:00 | USD | NAHB Housing Market Index Jul | 68 | 67 |
New Zealand CPI jumped to 32-yr high at 7.3% yoy in Q2
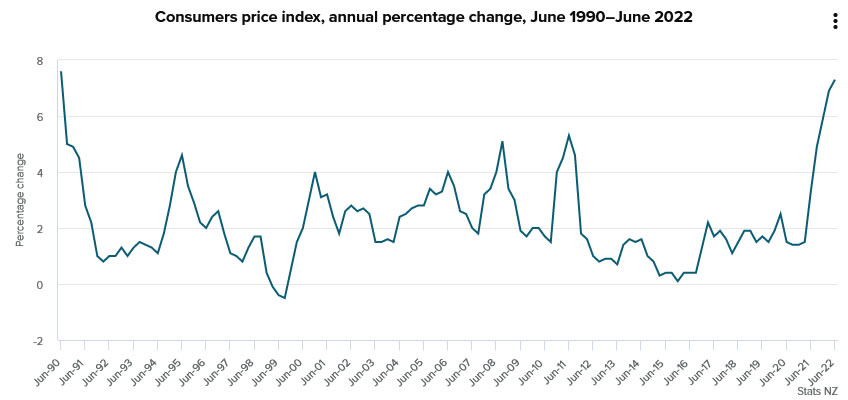
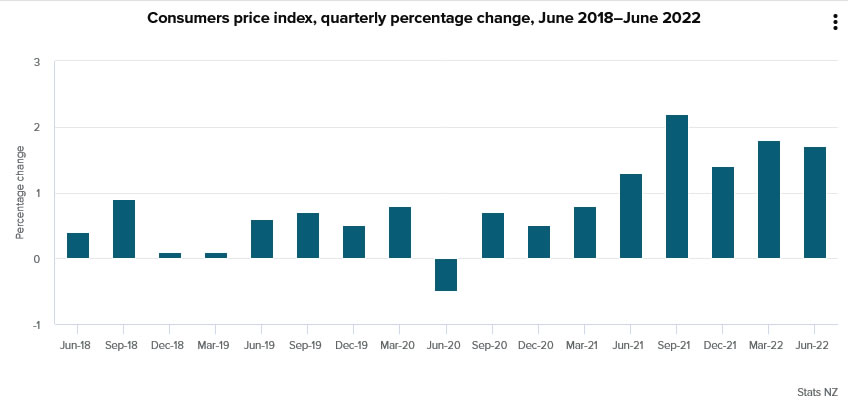
New Zealand CPI rose 1.7% qoq, 7.3% yoy in Q2, above expectation of 1.5% qoq, 7.1% yoy. The annual inflation accelerated from 6.9% yoy to 7.3%, a 32-year high, after 7.6% in Q2 1990.
StatsNZ said, "the main driver for the 7.3 percent annual inflation to the June 2022 quarter was the housing and household utilities group, due to rising prices for construction and rentals for housing... Transport was also a main driver of the quarterly rise, driven by petrol and diesel."
New Zealand BusinessNZ services rose slightly to 55.4, sustained improvement
New Zealand BusinessNZ Performance of Services Index ticked up from 55.3 to 55.4 in June, staying above long term average of 53.6 or the survey. Activity/sales dropped from 59.4 to 56.5. But employment improved notably from 49.0 to 53.1. New orders/business rose from 62.0 to 61.7. Stocks/inventories dropped from 54.7 to 54.1. Supplier deliveries rose from 45.6 to 47.8.
BNZ Senior Economist Craig Ebert said that "the move to traffic light Orange in mid-April, along with the expedited opening of the border, is clearly providing a basis for sustained improvement in New Zealand's services sector".
NZ First Impressions Consumers Price Index June Quarter 2022
Consumer prices rose 1.7% in the June quarter. That took the annual inflation rate to 7.3%, its highest level since 1990. Inflation pressures are widespread and likely to persist for some time yet. Today’s result reinforces our forecast for a series of further OCR hikes over the coming months.
Consumers Price Index, June quarter 2022
Quarterly change: +1.7% (prev: +1.8%)
- Westpac: +1.4%, RBNZ: +1.4%
- Median market f/c: +1.5%, range +1.3% to +1.7%
Annual change: +7.3% (prev: +6.9%)
- Westpac: +7.0%, RBNZ: +7.0%, Market f/c: +7.1%
There’s been no let-up in the intense price pressures that have been buffeting New Zealand households, with consumer prices rising at their fastest annual pace in 32 years.
Consumer prices rose 1.7% in the June quarter. Coming on the back of the strong price rises in previous quarters, that took the annual inflation rate to 7.3% (up from 6.9% in the March quarter). The last time annual inflation was this high was in 1990 following the hike in GST.
Today’s result was much stronger than our own and market forecast. As discussed below, today’s result was also stronger than the RBNZ’s forecast. Upside surprises to our own forecast were spread across domestic and imported categories, with a notable upside surprise in building costs.
Much of the strength in consumer prices has been due to large increases in the price of food, petrol and housing costs. However, the high level of inflation isn’t just due to a few specific items. Price pressures have been boiling over in every corner of the economy. That was reflected in the suite of core inflation measures released by Stats NZ today, which smooth through the quarter-to-quarter swings in prices and track the underlying trend in inflation. Most core inflation measures are now running above 6%.
Underlying that broad-based strength in inflation has been a cocktail of supply-side cost pressures and firm consumer demand. On the cost side of the ledger, continued disruptions to global and local supply chains have resulted in shortages of both production inputs and consumer goods. There has also been increasing upwards pressure on local wages.
But what’s really lit a fire under consumer prices has been the strength of domestic demand. Indeed, if we look at the areas where businesses are reporting significant shortages of supplies, they’re predominantly in areas where demand has been strong, like the construction sector. That is a big concern for the RBNZ, because if demand is running hot, inflation is likely to remain elevated even when the current pressure on operating costs (eventually) eases off. And a key factor underpinning the strength of household demand has been stimulus from low interest rates.
Looking across the broad product groups, imported prices (sometimes referred to as tradables) rose by 1.9% over the past three months, and are up 8.7% over the past year. While much of that was due to fuel costs, other tradable prices are up 5.4% over the past 12 months. Notably, the June quarter saw larger than expected increases in the prices of a range of durables and semi-durable retail items like furnishings which tend to be imported.
Domestic (or non-tradable) prices were up 1.4% in the June quarter and have risen by 6.3% over the past year. That is the fastest annual pace of non-tradables inflation since records began in 2000. The RBNZ pays particular attention to non-tradables inflation, and it is currently running at around twice the pace we’ve seen over the past two decades.
With widespread pressure on operating costs, we expect that inflation will remain elevated over the remainder of this year. In fact, we aren’t forecasting a return back within the RBNZ’s target band until the middle of next year at the earliest. That signals an ongoing squeeze on households’ purchasing power.
What does today’s result mean for the RBNZ?
Today’s result was stronger than the RBNZ’s latest published forecast for a 1.4% rise. However, since that number was published, the RBNZ had noted the upside risk for prices.
Last week, when delivering its third consecutive 50bp hike, the RBNZ reaffirmed that they are planning to continue raising the cash rate to a level where they are confident that inflation will settle within the 1% to 3% target range. And with price pressures continuing to sizzle, there was nothing in today’s report to dissuade them from that course.
Given the continuing and widespread strength in inflation pressures, we’re forecasting the RBNZ will deliver a fourth 50bp hike at the time of the August policy review. We expect that to be followed by 25bp hikes in both October and November, taking the OCR to a level of 3.50% by year’s end.
Details
While strength in price pressures has been widespread, the June quarter saw particularly large price increases in a number of areas.
The biggest contributor to the strong June quarter inflation result was a further large increase in building costs. The cost of purchasing a newly built home rose by 4.5% in the June quarter. That followed similarly large increases in recent months, with construction costs up a massive 18% over the past year. Building activity has been charging higher over the past year. At the same time, acute shortages of materials and staff have seen input costs climbing rapidly.
Adding to the pressure on housing costs, rents have been rising rapidly, with an increase of 1.2% in the June quarter. The annual increase in rents of 4.3% was the largest increase since records began.
The past three months also saw a chunky 1.3% increase in food prices. That includes sizeable increases in the prices for groceries and fresh vegetables.
Fuel prices have also risen strongly, increasing by 6.2% over the past three months. Despite the 25 cent reduction in the petrol excise tax, prices across the country hit record levels in recent months. That’s flowed through to consumers wallets, and the related increases in transport and production costs have added to the prices for all manner of goods and services.
Providing some offset to the above price increases were the reduction in road user charges and the halving of public transport fares that the Government introduced earlier this year.