

Sample Category Title
EUR/JPY Daily Outlook
Daily Pivots: (S1) 138.24; (P) 139.00; (R1) 140.01; More....
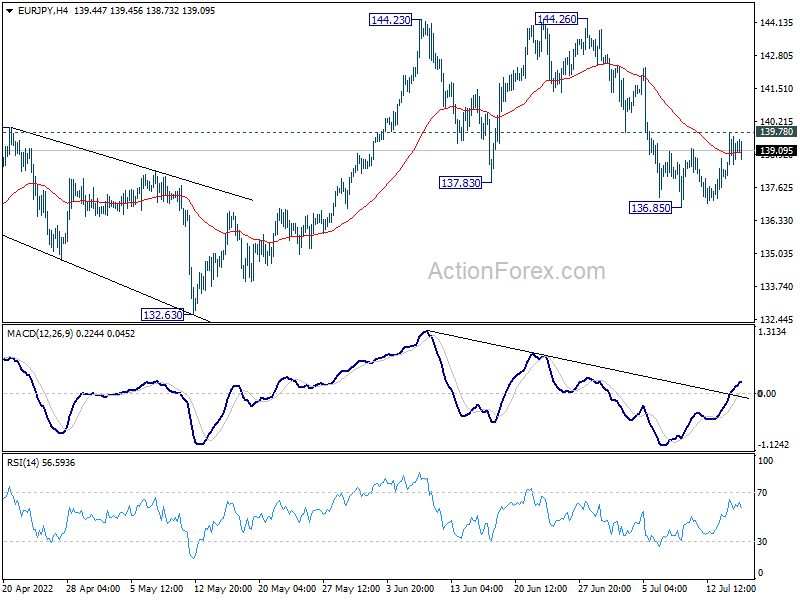
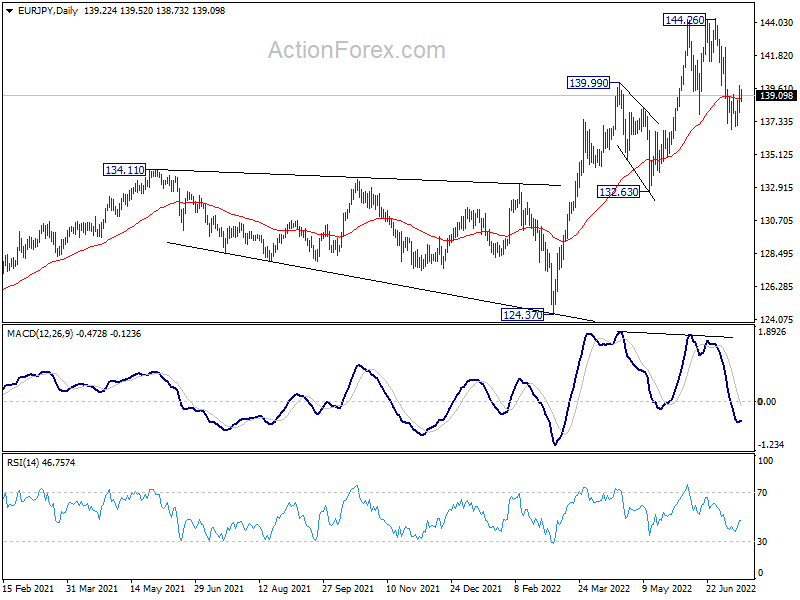
Intraday bias in EUR/JPY remains neutral for the moment. On the upside, firm break of 139.78 minor resistance will argue that pull back from 144.26 has completed at 136.85. Further rally would be seen back to retest 144.26 high. On the downside, though, below 136.85 will resume the fall back to 132.63 support.
In the bigger picture, up trend from 114.42 (2020 low) is seen as the third leg of the pattern from 109.30 (2016 low). Further rally is in favor as long as 134.11 resistance turned support holds, even in case of deep pull back. Firm break of 139.78 will target 149.76 (2015 high. However, sustained break of 134.11 will be a sign of medium term bearish reversal and turn focus to 124.37 support for confirmation.
EUR/GBP Daily Outlook
Daily Pivots: (S1) 0.8443; (P) 0.8471; (R1) 0.8500; More...
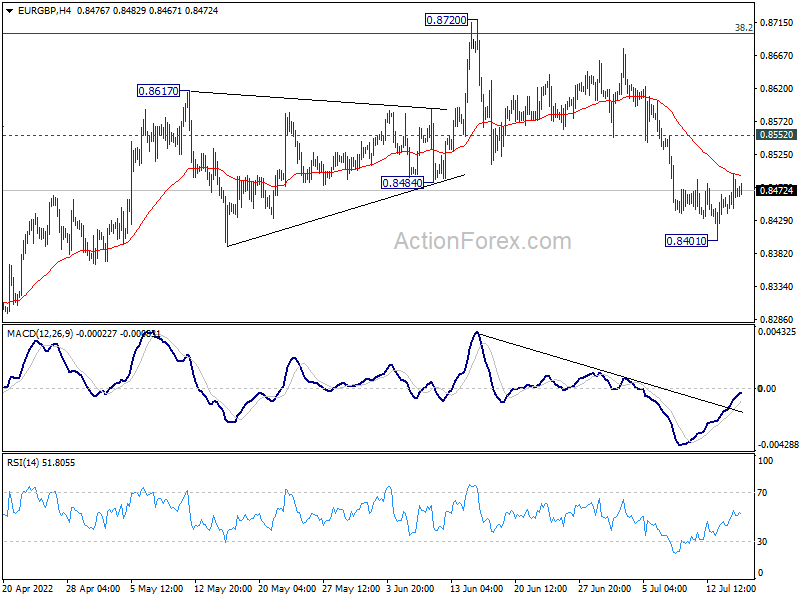
Intraday bias in EUR/GBP stays neutral at this point. Further decline is expected as long as 0.8552 minor resistance holds. Rebound from 0.8201 should have completed at 0.8720, after rejection by 0.8697 medium term fibonacci level. Below 0.8401 ill target a test on 0.8201/48 support zone next.
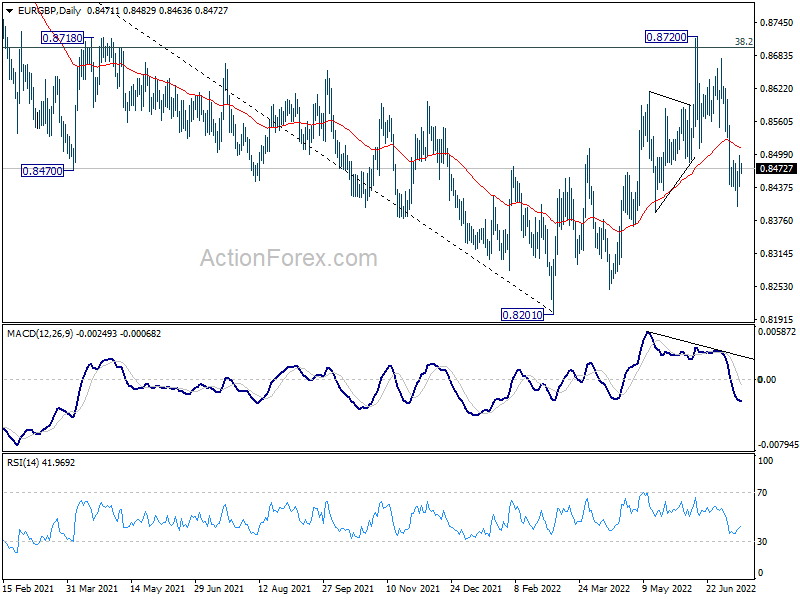
In the bigger picture, rejection by 38.2% retracement of 0.9499 to 0.8201 at 0.8697 argues that rebound from 0.8201 is merely a corrective move. That is, down trend from 0.9499 (2020 high) is now over. Sustained break of 0.8201 will resume such decline and target 61.8% retracement of 0.6935 to 0.9499 at 0.7917. This will now remain the favored case as long as 0.8720 resistance holds.
EUR/AUD Daily Outlook
Daily Pivots: (S1) 1.4760; (P) 1.4852; (R1) 1.4939; More...
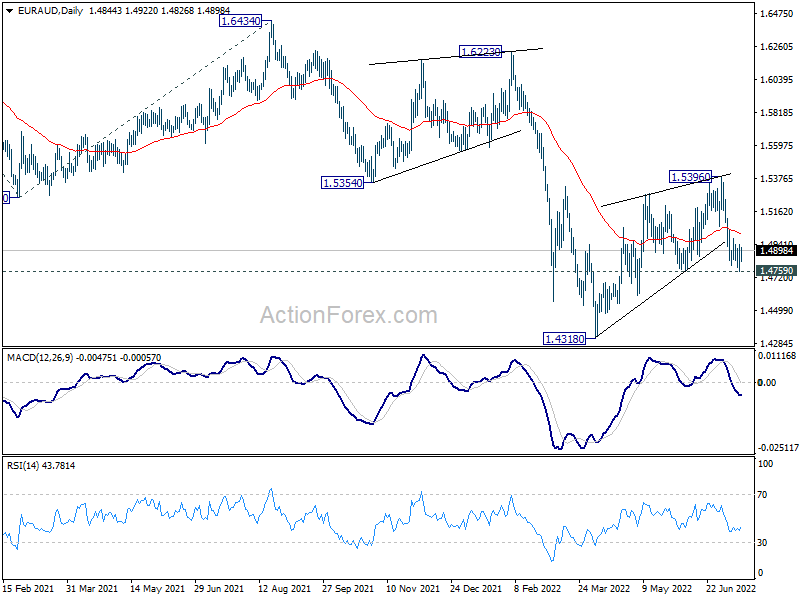
Intraday bias in EUR/AUD remains neutral for the moment. Further decline is in favor with 1.5043 minor resistance intact. Decisive break of 1.4759 support should confirm that corrective rise from 1.4318 has completed at 1.5396 after rejection by 1.5354 support turned resistance. Deeper fall should then be seen back to retest 1.4318 low. On the upside, however, break of 1.5043 will bring stronger rebound back towards 1.5396.
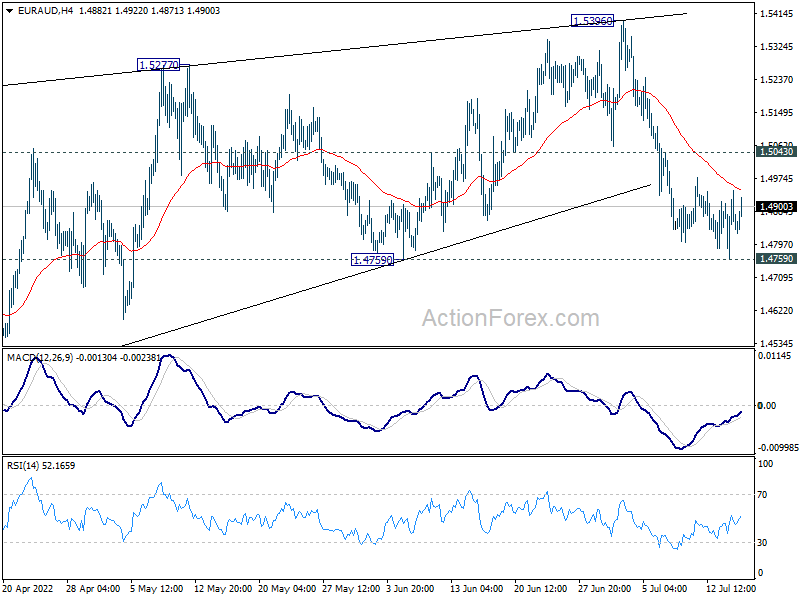
In the bigger picture, rejection by 1.5354 support turned resistance, as well as 55 week EMA (now at 1.5398), maintain medium term bearishness. That is, larger down trend from 1.9799 is not completed yet. Break of 1.4318 low will target 61.8% projection of 1.9799 to 1.5250 from 1.6434 at 1.3623, which is close to 1.3624 long term support (2017 low). This will remain the favored case now as long as 1.5396 resistance holds.
EUR/CHF Daily Outlook
Daily Pivots: (S1) 0.9827; (P) 0.9856; (R1) 0.9885; More....
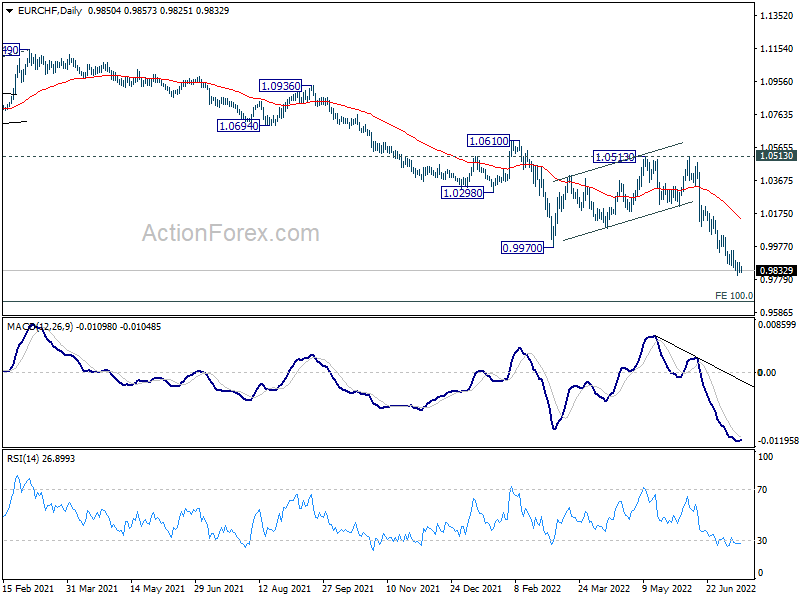
EUR/CHF continues to lose downside momentum but there is no clear sign of bottoming yet. Further decline is in favor to 0.9650 long term projection level next. On the upside, above 0.9953 minor resistance will turn intraday bias back to the upside for stronger rebound first.
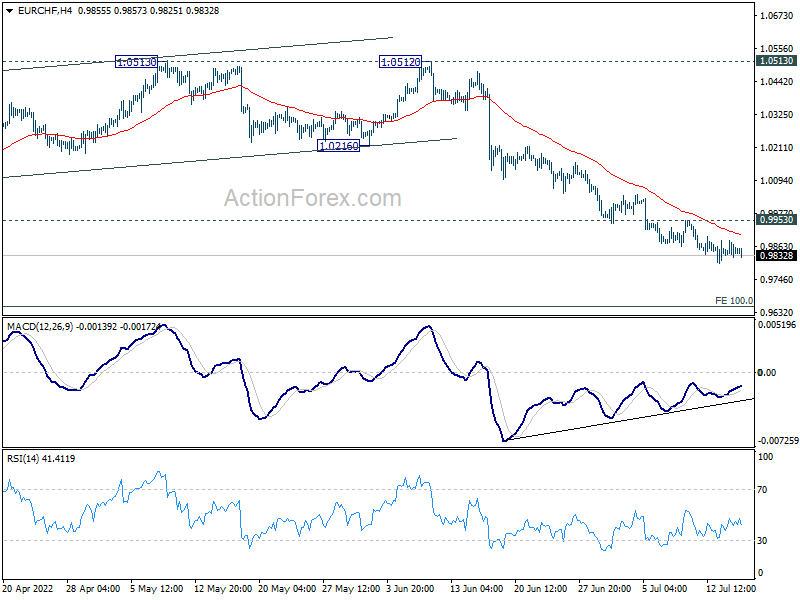
In the bigger picture, rejection by 55 week EMA affirmed medium term bearishness. Long term down trend from 1.2004 (2018 high) is expected to target 100% projection of 1.2004 to 1.0505 to 1.1149 at 0.9650. On the upside, break of 1.0513 resistance is needed to indicate medium term bottoming. Otherwise, outlook will stay bearish in case of strong rebound.
USDCAD Enjoys Summer Vibes after Explosive Rally
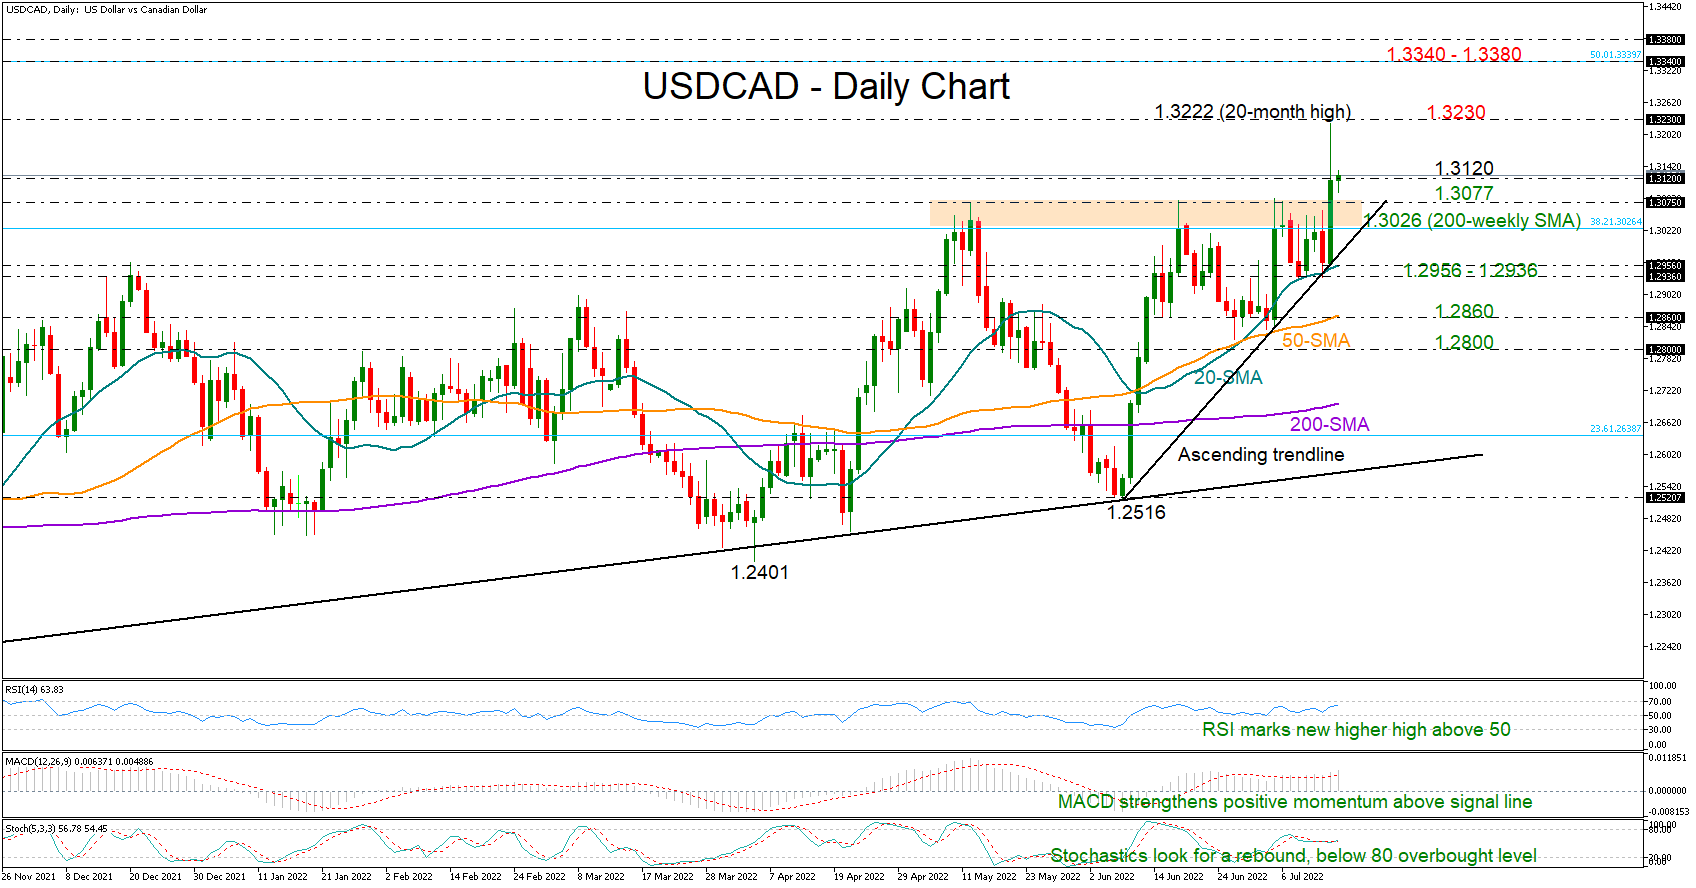
USDCAD skyrocketed by 2.0% to a 20-month high of 1.3222 on Thursday, and although the pair could not cling to this top, it managed at least to close clearly above the 1.3026–1.3077 block, which had been strongly rejecting the bulls since mid-May.
Strikingly, the market is now finally ready to win a weekly close above the 200-weekly simple moving average (SMA) for the first time since October 2020, signaling further progress ahead.
In the daily chart, the technical picture is looking brighter. The price is now trading comfortably above its upward-sloping SMAs, while both the RSI and the MACD have further grown in the bullish area, with the former ticking above its previous highs and the latter speeding up above its red signal line. Notably, the RSI and the Stochastics are halfway below their overbought levels, suggesting that the bullish cycle has more fuel in the tank.
Should buyers overtake the 1.3120 territory, where the price almost finished yesterday’s session, the door will open again for the 1.3222–1.3230 resistance. If that bar cracks this time, the rally may stretch towards the 1.3340–1.3380 restrictive zone taken from the second half of 2020. Notably, this area also encapsulates the 50% Fibonacci of the 2020–2021 downtrend (1.4667–1.2006).
In the event the price halts its bull run around 1.3120 and reverses lower instead, it would be interesting to see whether the broken resistance of 1.3026–1.3077 can change its role to defend the ascend in the market. Within a short distance, the ascending trendline drawn from June's low of 1.2516 could be the last opportunity for a rebound before the outlook weakens back to neutral and the spotlight turns again to the 20-day SMA, currently at 1.2956. Even lower, the 50-day SMA at 1.2859 could be the next destination.
All in all, USDCAD is currently exhibiting a bullish appetite for the coming sessions. Another successful move above 1.3120 is expected to release fresh buying. Otherwise, a negative reversal below 1.3026 could inject some caution back into the market.
DXY Approaching 110 Level – Elliott Wave forecast
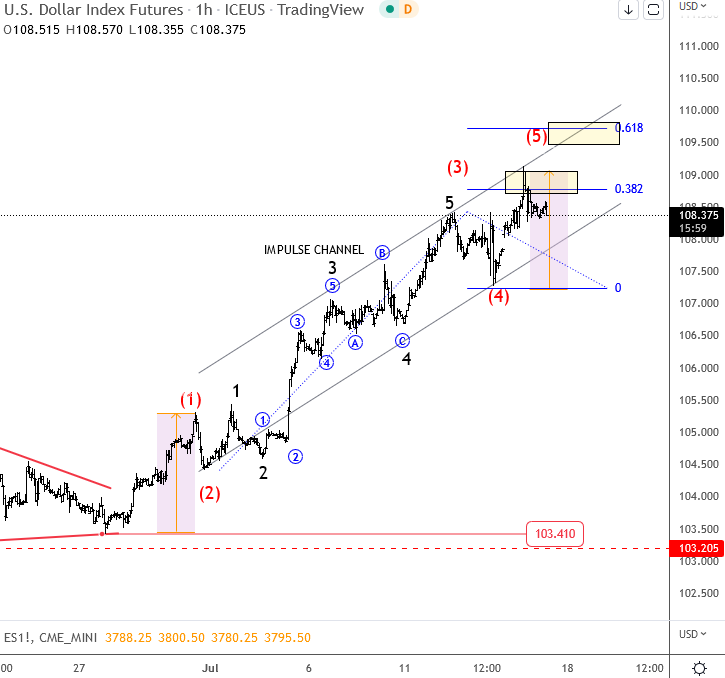
The USD remains strong as inflation in US remains the primary issue. Speculators believe FED will have to be more aggressive so USD is breaking to a new high while stocks are coming down into support. However, stocks are not in a very strong sharp sell-off, so I am wondering if maybe the market figured out that FED cannot do much with this hawkish policy? We will see, but technically speaking the DXY is moving into a resistance, currently in a fifth wave that can slow down at 109/110 area.
RBA 50bp Hike Confirmed for August with No Scope for September Pause
We now expect the RBA to delay its pause to October with a 25bp increase in September to follow on from our 50bp hike forecast for August. By moving the forecast rate hike in December forward to September we have not changed our terminal rate forecast of 2.6%.
We have reconfigured our RBA cash rate profile following the July employment report and some revisions to our inflation forecasts.
However, we have not lifted the forecast terminal rate of 2.6% by the February 2023 Board meeting.
We continue to expect a 50bp increase in the cash rate at the August 2 Board meeting.
But a pause in the cycle in September now seems unlikely.
We expect a 25bp increase in the cash rate at the September 6 Board meeting.
With our estimate of the neutral range of policy being 1.5-2.0% the September move of 25bps would shift the cash rate to 2.1%, into contractionary territory.
As we move further towards the end of 2022, we expect that the evidence that the RBA’s 200bp increase in just five months will start to impact the spending momentum.
Factors that we assess as important to maintaining spending momentum through the June and September quarters will have eased by October. These will include the ‘reopening’ effect in NSW and Victoria and the boost to spending capacity from the fall in the savings rate over the course of 2020.
To date our Westpac Card Tracker Index, based on consumption-related card transaction activity, has held up quite strongly but we expect that by late September spending momentum will have eased significantly.
Along with what are likely to be more very weak reads on Consumer Sentiment and Business Confidence; a sharp deterioration in housing markets; and evidence that the US economy is faltering under the weight of the high inflation and aggressive tightening from the FOMC, the case for a pause in October will be convincing.
We have slightly lifted our forecast for the June quarter inflation report.
Our forecast for underlying inflation (trimmed mean measure) has been lifted from 1.3%qtr to 1.4%qtr – largely reflecting a stronger increase in the cost of new dwelling construction, marked up from 4.6% to 5.5% in the quarter.
Our forecast for headline inflation in the quarter has also been lifted from 1.5% to 1.7%.
Overall, annual underlying inflation is expected to print 4.6%yr, up from 3.7%yr in March, and headline inflation is expected to lift from 5.1%yr to 6.1%yr (compared to our earlier forecast of 5.8%yr).
This slightly higher inflation is not sufficient to cause the RBA Board to lift the hike at the August meeting to 75bps but does increase the headwind for a pause in September, when the cash rate would be within the neutral zone.
The sharp fall in the June unemployment rate from 3.9% to 3.5% is more rapid but broadly consistent with our long-held forecast that the unemployment rate would reach 3.2% in the second half of 2022.
There is no need to lift the pace of the rate hike in August from 50bps to 75bps but the rapid improvement does weaken the case for a pause in September.
We did note that despite now factoring in a hike in September rather than a pause we still expect the peak in the cash rate to be 2.6%.
The rate hike we had previously expected in December has been moved ahead to September. That is consistent with our view that by December the evidence will be convincing that the Australian economy is slowing under the weight of a cash rate of 2.35% (following the expected 25 basis point move in November), which is firmly in contractionary territory.
We have also not changed the timing of the final rate hike in the cycle – a 25bp increase at the February 2 Board meeting.
We expect that the final move in the cycle will be in response to the March quarter inflation report that will show underlying inflation printing 1.0% for the quarter and a peak 5% annual rate, with headline inflation also expected to peak at 7.2%.
However, the key track of the underlying quarterly prints is expected to be: 1.4% (March); 1.4% (June); 1.2% (September); and 1.0% (December). That is a clear slowing in the quarterly pace but the annual rate is still too high for the RBA to pause. The mood of central banks to err in favour of containing inflation and expectations rather than fine tuning activity will be apparent in that decision.
That quarterly pause is expected to come at the May Board meeting when the quarterly pace in underlying inflation slows to 0.8% for 4.4%yr; down from 5%yr in the December quarter.
By May, the slowing Australian and US economies and the encouraging slowing in the quarterly inflation pace will be sufficient for the RBA to remain on hold, pending inflation and growth developments that could allow an eventual easing in policy.
By the second half of 2023 there will be some upward drift in the unemployment rate while underlying inflation will be converging on the top of the target band, although there will be caution around easing policy while inflation remains above the top of the 2-3% range.
Elliott Wave View: Silver Has Reached Daily Extreme Area
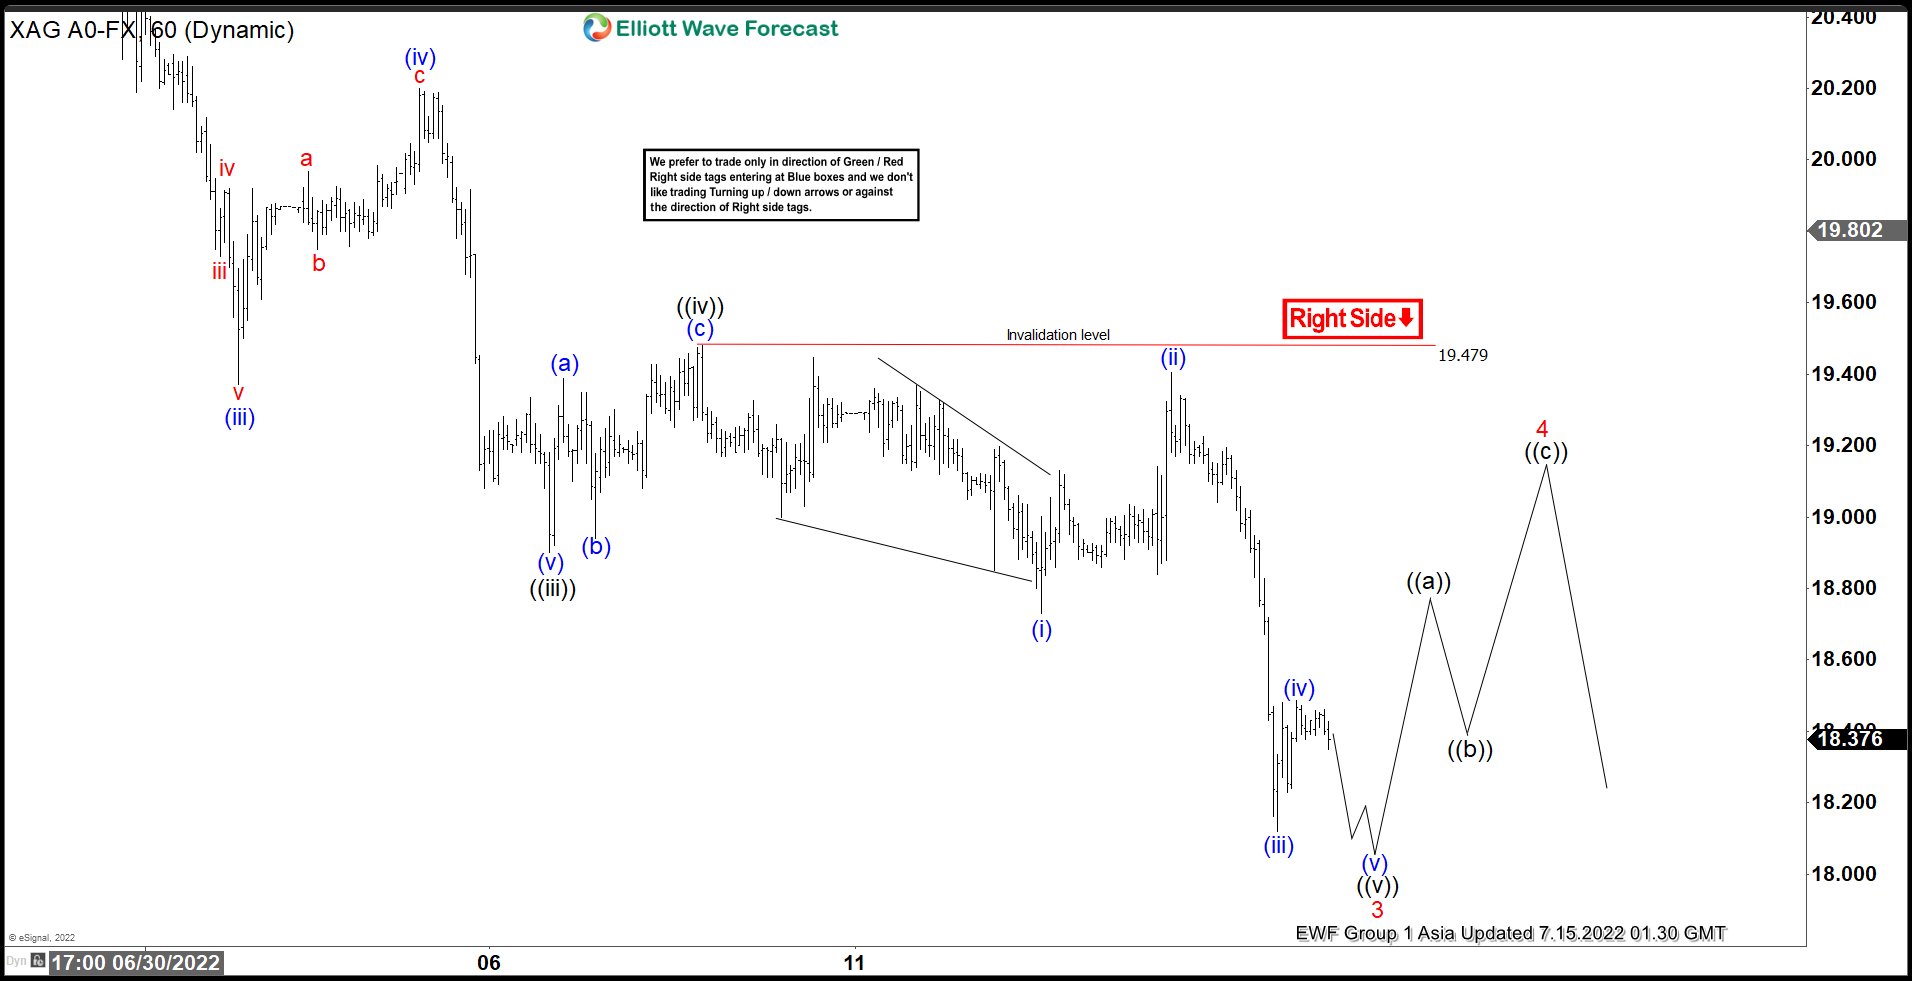
Silver has reached the minimum 100% target in daily time frame from 2.1.2021 at $18.37. However, short term, the metal can still see further downside. Near term Elliott Wave view in Silver (XAGUSD) suggests the decline from 6/6/2022 high is in progress as a 5 waves impulse Elliott Wave structure. Down from 6/6/2022 high, wave 1 ended at 20.87 and rally in wave 2 ended at 21.96. Wave 3 lower is now in progress and subdivides as another 5 waves impulse in lesser degree. Down from wave 2, wave ((i)) ended at 20.58 and rally in wave ((ii)) ended at 21.54. The metal then extends lower in wave ((iii)) towards 1.1890.
Wave ((iii)) lower subdivides as another 5 waves impulse in lesser degree. Wave (i) ended at 20.68 and rally in wave (ii) ended at 21.06. Then wave (iii) ended at 19.37. Bounce as wave (iv) completed at 20.20 and last drop to finish wave (v) and wave ((iii) at 1.1890. Wave ((iv)) correction ended at 19.48 with internal subdivision as a zigzag. Currently, we are developing wave ((v)) to end wave 3. Wave ((v)) lower subdivides as another 5 waves impulse in lesser degree. Down from wave ((iv)), wave (i) ended at 18.73 and rally in wave (ii) ended at 19.40. Then wave (iii) ended at 18.12. Bounce as wave (iv) should be completing soon and turning lower again to end wave (v) of ((v)) and wave 3. Near term, as far as pivot at 19.48 high stays intact, expect rally to fail and the metal to extend lower.
Silver (XAGUSD) 60 Minutes Elliott Wave Chart
Bitcoin: Miners Sell, Markets Buy
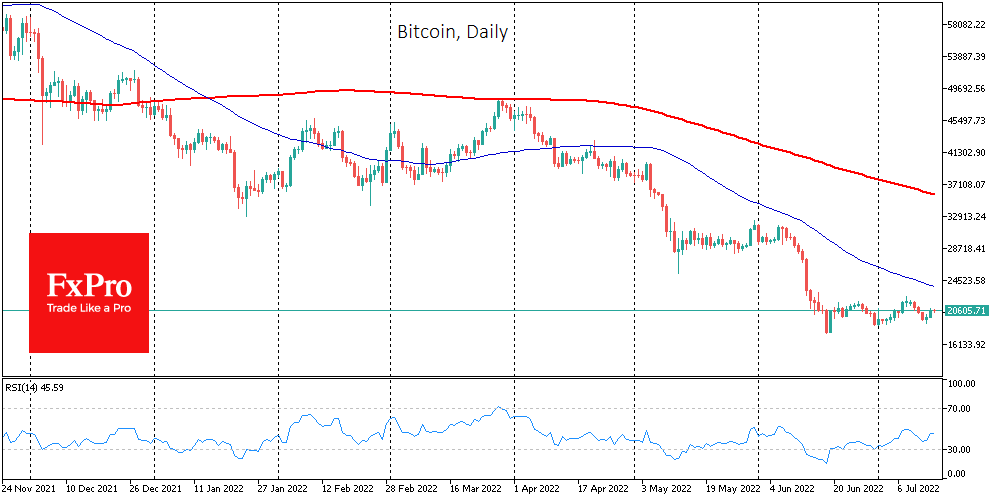
Bitcoin rose 4.9% on Thursday, ending at around $20,700, and retreated 200 at the start of trading on Friday. Ethereum has added 7.3% in the past 24 hours to $1190. Top altcoins gained between 1.7% (Cardano) and 7% (Solana).
According to CoinMarketCap, the total crypto market cap is up 3% overnight to $925B.
Bitcoin was in demand in the US session on Thursday amid a rebound in US stock indices. BTC rose above the $20,000 level and tested three-day highs around $20,900.
Bitcoin’s hash rate fell 27% to 159.41 EH/s due to a shutdown of miners in Texas. The figure was the lowest since February this year. Miners shut down equipment to save power due to the record heat wave.
During June, the cost of mining bitcoin fell from $24K to $13K, which could boost coin sales by miners and become a barrier to BTC growth, JPMorgan said.
According to Thomas Peterffy, CEO of Interactive Brokers, there is a high probability that bitcoin will be outlawed.
The US government could ban cryptocurrencies out of concern that they are being used to finance illegal activities, tax evasion, and the Treasury Department’s inability to monitor transactions involving crypto assets.
Cryptocurrency lender Celsius has filed for “immediate” bankruptcy in the US Bankruptcy Code, Chapter 11.
A federal court in New York has frozen the remaining assets of cryptocurrency hedge fund Three Arrows Capital after the company filed for emergency bankruptcy.
The European Central Bank has decided on the parameters of the future digital euro and intends to issue it in 2023. The success of CBDC will depend on its mass use.
GBP/USD: May GDP Tilts the Narrative
- UK data next week could be make or break for GBP/USD
- 1.16 could prove to be a key psychological level
Better-Than-Expected May GDP
UK monthly GDP rose by a better-than-expected 0.5% m/m in May, according to data released on Wednesday. That number was certainly better than the 0% economists were expecting. In addition, it represents a decent improvement from the revised 0.2% decline in April. As a result, the UK economy may just avoid slipping into quarterly contraction in Q2. Whether this will be enough to solidify a 50 bps rather than a 25 bps hike from the Bank of England when it next meets on 4 August 2022, is an entirely different matter.
Still Loads of Uncertainty
Despite the better-than-expected figure, UK household spending on certain categories of goods and services appeared strained. This suggests a contraction in economic activity in Q3 still on the cards. A more accurate picture of Q2 activity won’t be available until the release of the first full estimate of Q2 GDP on the 12 August 2022, well after the Bank of England meeting. Until then, expect next week’s UK employment data and June CPI data to carry extra weight, both for the Bank of England decision and the immediate fortunes of GBP/USD.
Downtrend Intact
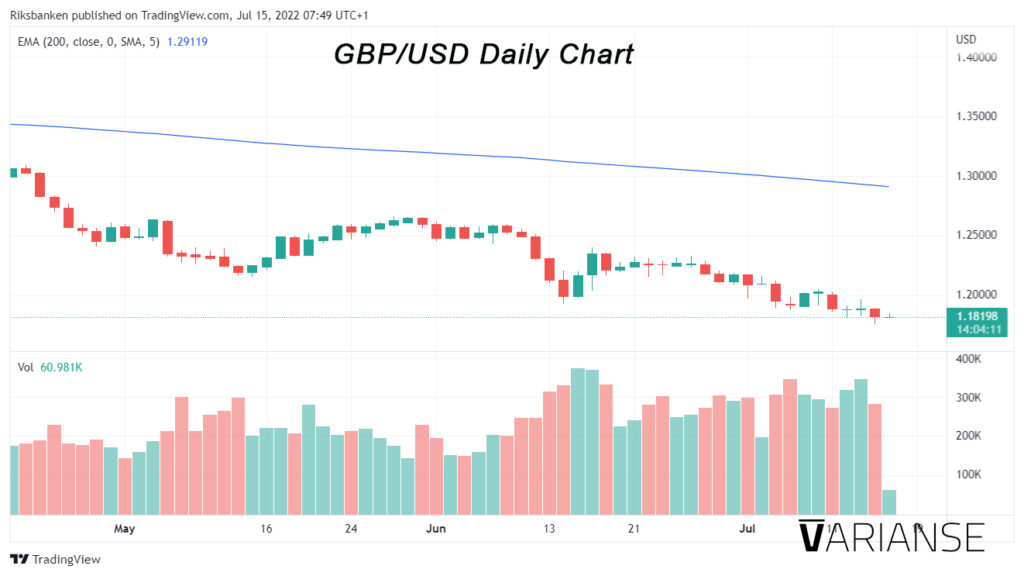
A little over a week ago, when GBP/USD was trading at 1.1895, we suggested picking the bottom for GBP/USD was risky business. Since then the pair established a new low of 1.17603 on 14 June, before retracing some of its losses. Needless to say, the pair is still trading below its 200-day exponential moving average after this most recent look lower, a factor which always leaves me reluctant to be a buyer no matter the forex pair. Likewise, it seems to take some pretty heavy trading volumes just to abate some of the recent declines in price.
Intense Volumes
That said, there does seem to be more buyers jumping in when price does fall, just by the way high volumes under recent price declines don’t seem to provide the same level of price decline as they once did. Selling pressure may be finding a degree of exhaustion as price approaches the 1.16 psychological level, but it is still too early to tell. At the moment, there is no clear sign of total market capitulation yet or any clear sign of reversal. Next week’s economic data could certainly be the catalyst required to change the situation for better or worse.