Sample Category Title
NZ BusinessNZ manufacturing dropped to 49.7, sector remains in struggle street
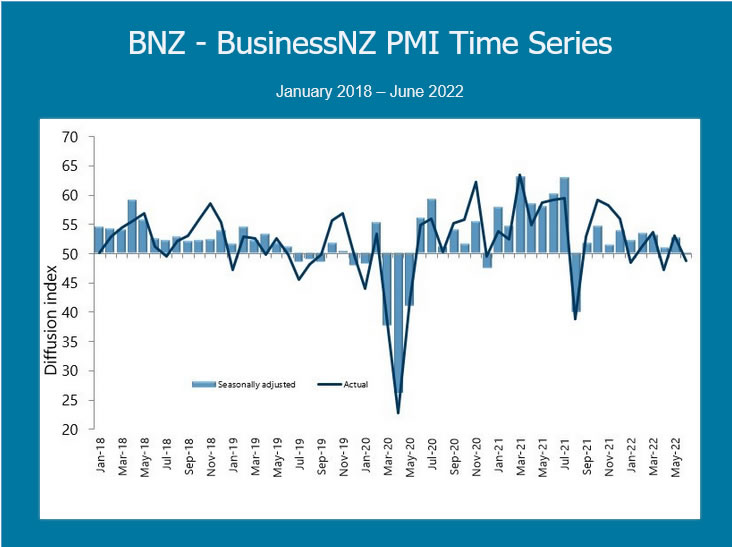
New Zealand BusinessNZ Performance of Manufacturing Index dropped from 52.9 to 49.7 in June. Production dropped from 52.6 to 47.8. Employment dropped from 52.8 to 51.2. New orders dropped fro 52.3 to 47.8. Finished stocks dropped from 52.8 to 50.0. Deliveries dropped from 55.1 to 51.7.
BusinessNZ's Director, Advocacy Catherine Beard said that the drop in activity levels for June highlights the fact that the sector remains in struggle street to get back to long-term activity levels.
"The key sub index values of Production (47.8) and New Orders (47.8) both recorded the same level of contraction, which had a combined negative effect on the overall Index. As mentioned in previous months, a strong and consistent activity level for both these key sub index values will be the only way to push the PMI towards better results."
Fed Bullard: 75bps has a lot of virtue to it
In an interview by Nikkei after US CPI release, St. Louis Fed President James Bullard said rate-setters have "framed" the July FOMC meeting as "50 versus 75". "I think 75 has a lot of virtue to it, because the long run neutral that the committee has, according to the Summary of Economic Projections, is actually about 2.5%," he said.
"If we made this move at this meeting, that would get us all the way till the long run neutral value. And obviously we've got more steps to take in meetings ahead, but we can assess as we go through the rest of this year," he added.
While Bullard has been advocating to get interest rate to 3.5% this year, rate exceeding 4% by the end of this year is "possible". "If data came in, continued to come in, in an adverse way, for the committee, then we could consider doing more, as we go through the fall here. So, I'd say it's a possibility."
Technical Outlook and Review
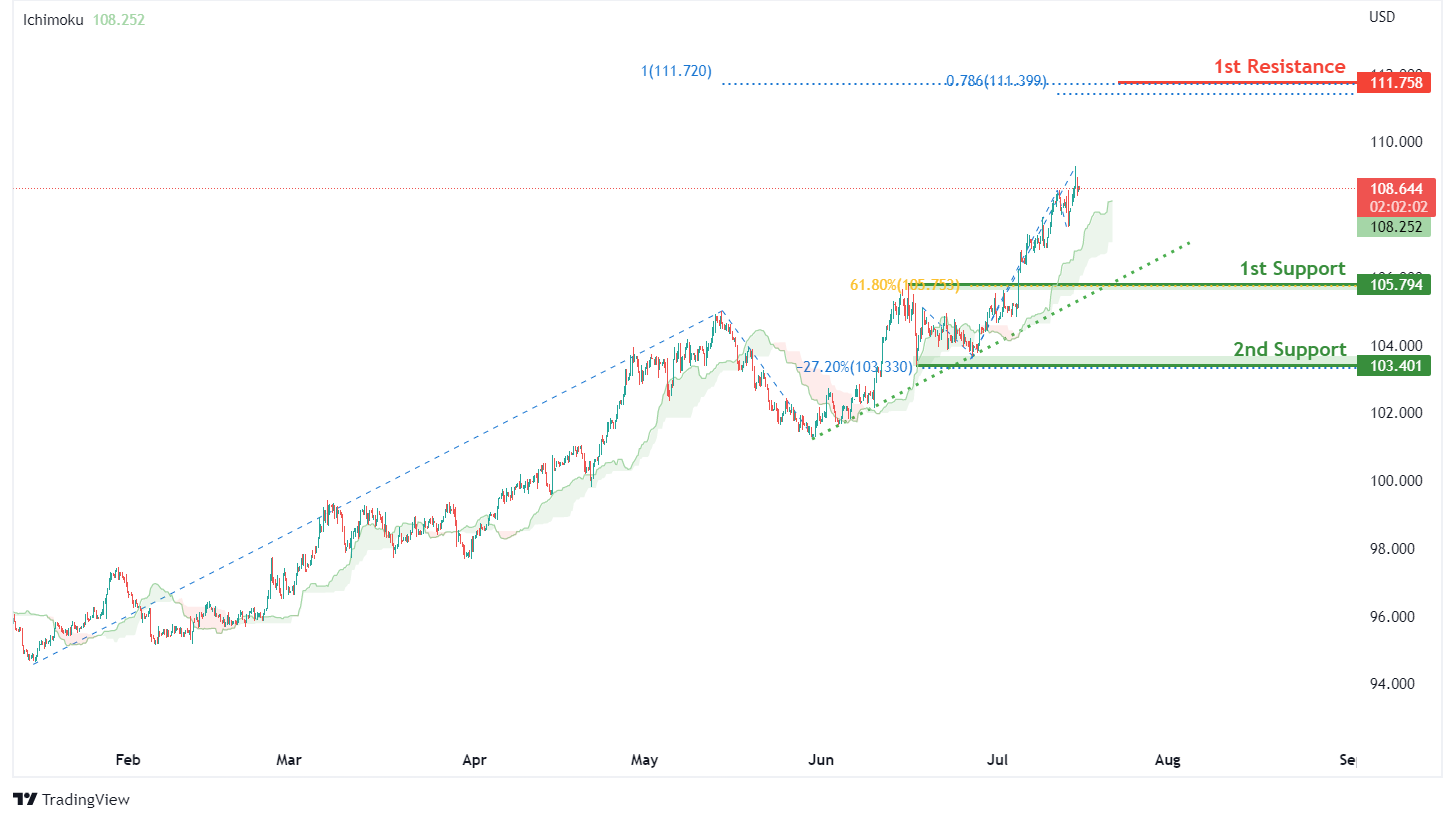
DXY:
On the H4, with prices moving above the ichimoku indicator and along the ascending trendline, we have a bullish bias that prices will drop and rise from 1st support at 105.794 where the pullback support and 61.8% fibonacci retracement are to 1st resistance at 111.758 in line with 100% fibonacci projection and 78.6% fibonacci projection. Alternatively, price may break 1st support structure and drop to 2nd support at 103.401 where the horizontal swing low support and -27.2% fibonacci expansion are.
Areas of consideration:
- H4 time frame, 1st resistance at 111.758
- H4 time frame, 1st support at 105.794
XAU/USD (GOLD):
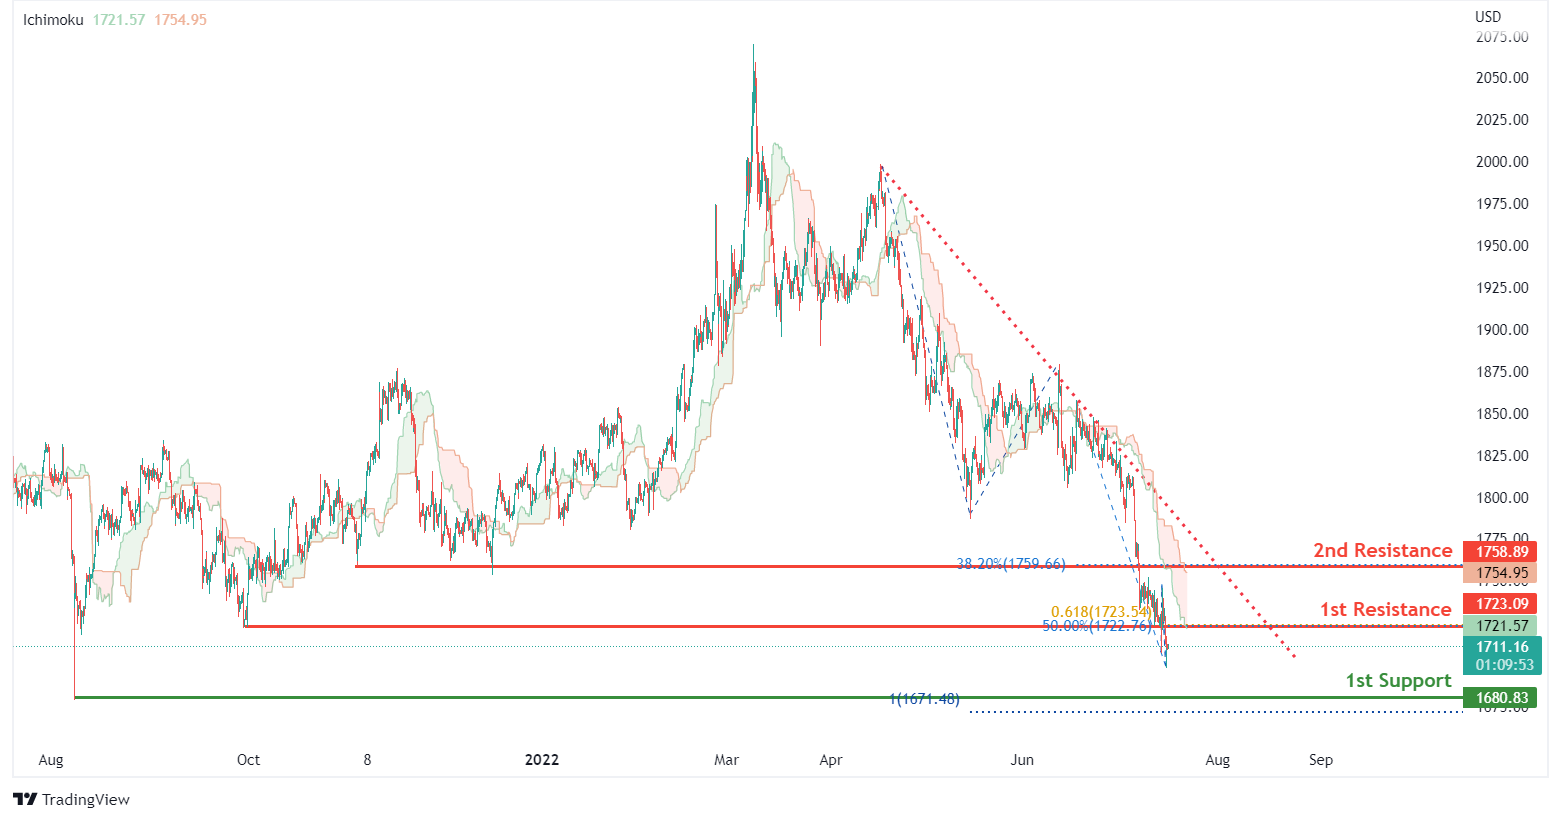
On the H4, with prices moving below the ichimoku indicator and along a descending trendline, we have a bearish bias that prices will rise and drop from our 1st resistance at 1723.09 where the horizontal pullback resistance, 50% fibonacci retracement and 61.8% fibonacci projection are to our 1st support at 1680.83 in line with swing low support and 100% fibonacci projection. Alternatively, price could break 1st resistance structure and rise to our 2nd resistance at 1758.89 in line with overlap resistance and 38.2% fibonacci retracement.
Areas of consideration:
- H4 time frame, 1st Resistance at 1723.09
- H4 time frame, 1st Support at 1680.83
GBP/USD:
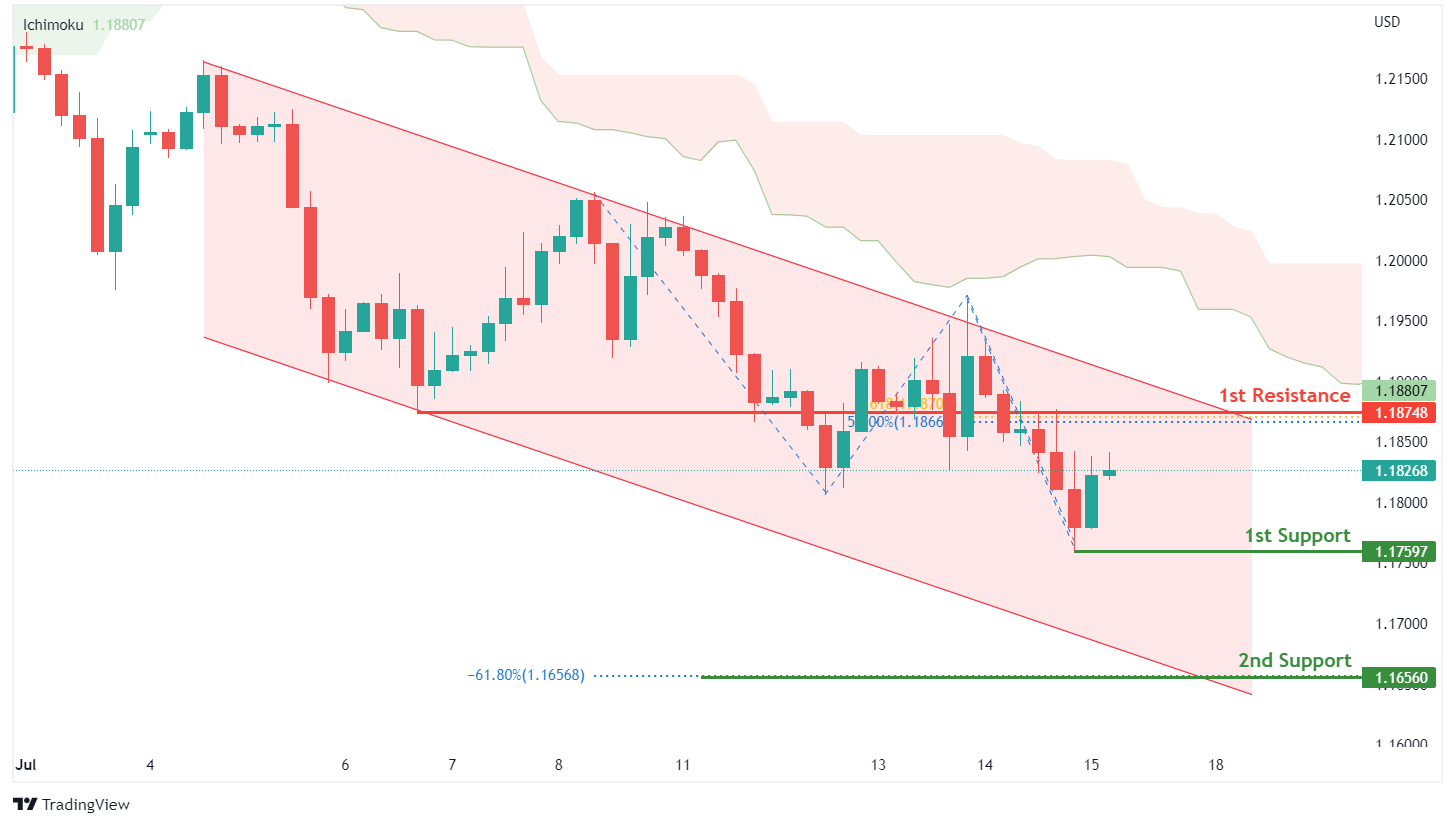
On the H4, with prices moving below the ichimoku indicator and within the descending channel, we have a bearish bias that prices will drop to our 1st support at 1.17597 where the swing low support is. Once we have downside confirmation of price breaking 1st support, we would expect bearish momentum to carry price to 2nd support at 1.16560 where the -61.8% fibonacci expansion is. Alternatively, price could rise to 1st resistance at 1.18748 in line with the pullback resistance, 61.8% fibonacci projection and 50% fibonacci retracement.
Areas of consideration:
- H4 1st resistance at 1.18748
- H4 1st support at 1.17597
USD/CHF:
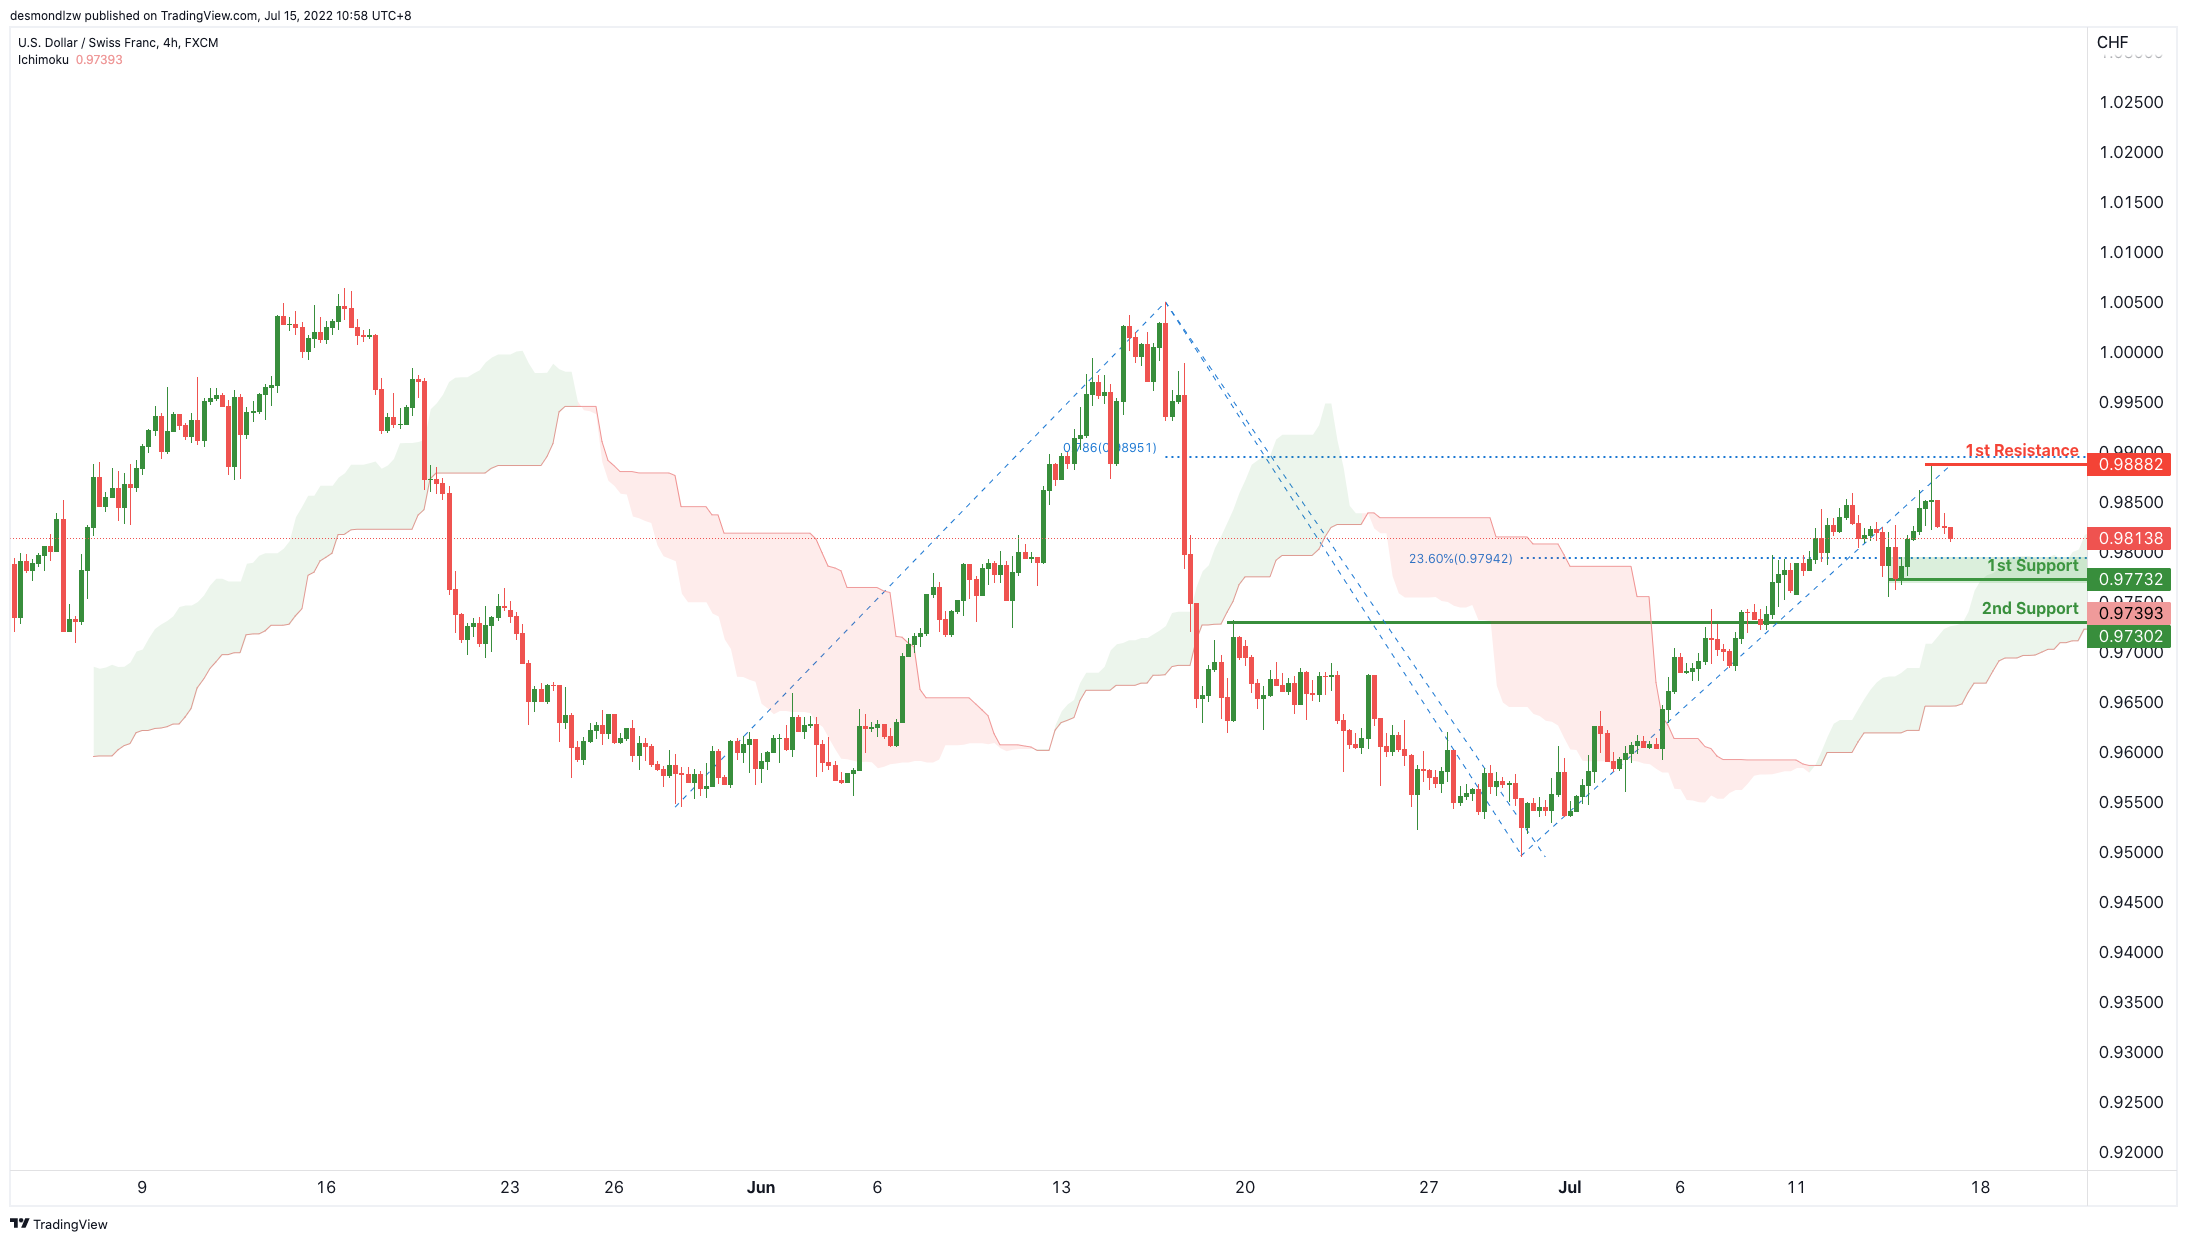
On the H4, with price moving above the ichimoku cloud, we have a bullish bias that price will rise from our 1st support at 0.97732 where the horizontal swing low support is to our 1st resistance at 0.98882 in line with the swing high resistance is. Alternatively, price may not break 1st support and head for 2nd support at 0.97302 where the horizontal pullback support.
Areas of consideration
- 1st support level at 0.97732
- 1st resistance level at 0.98882
EUR/USD :
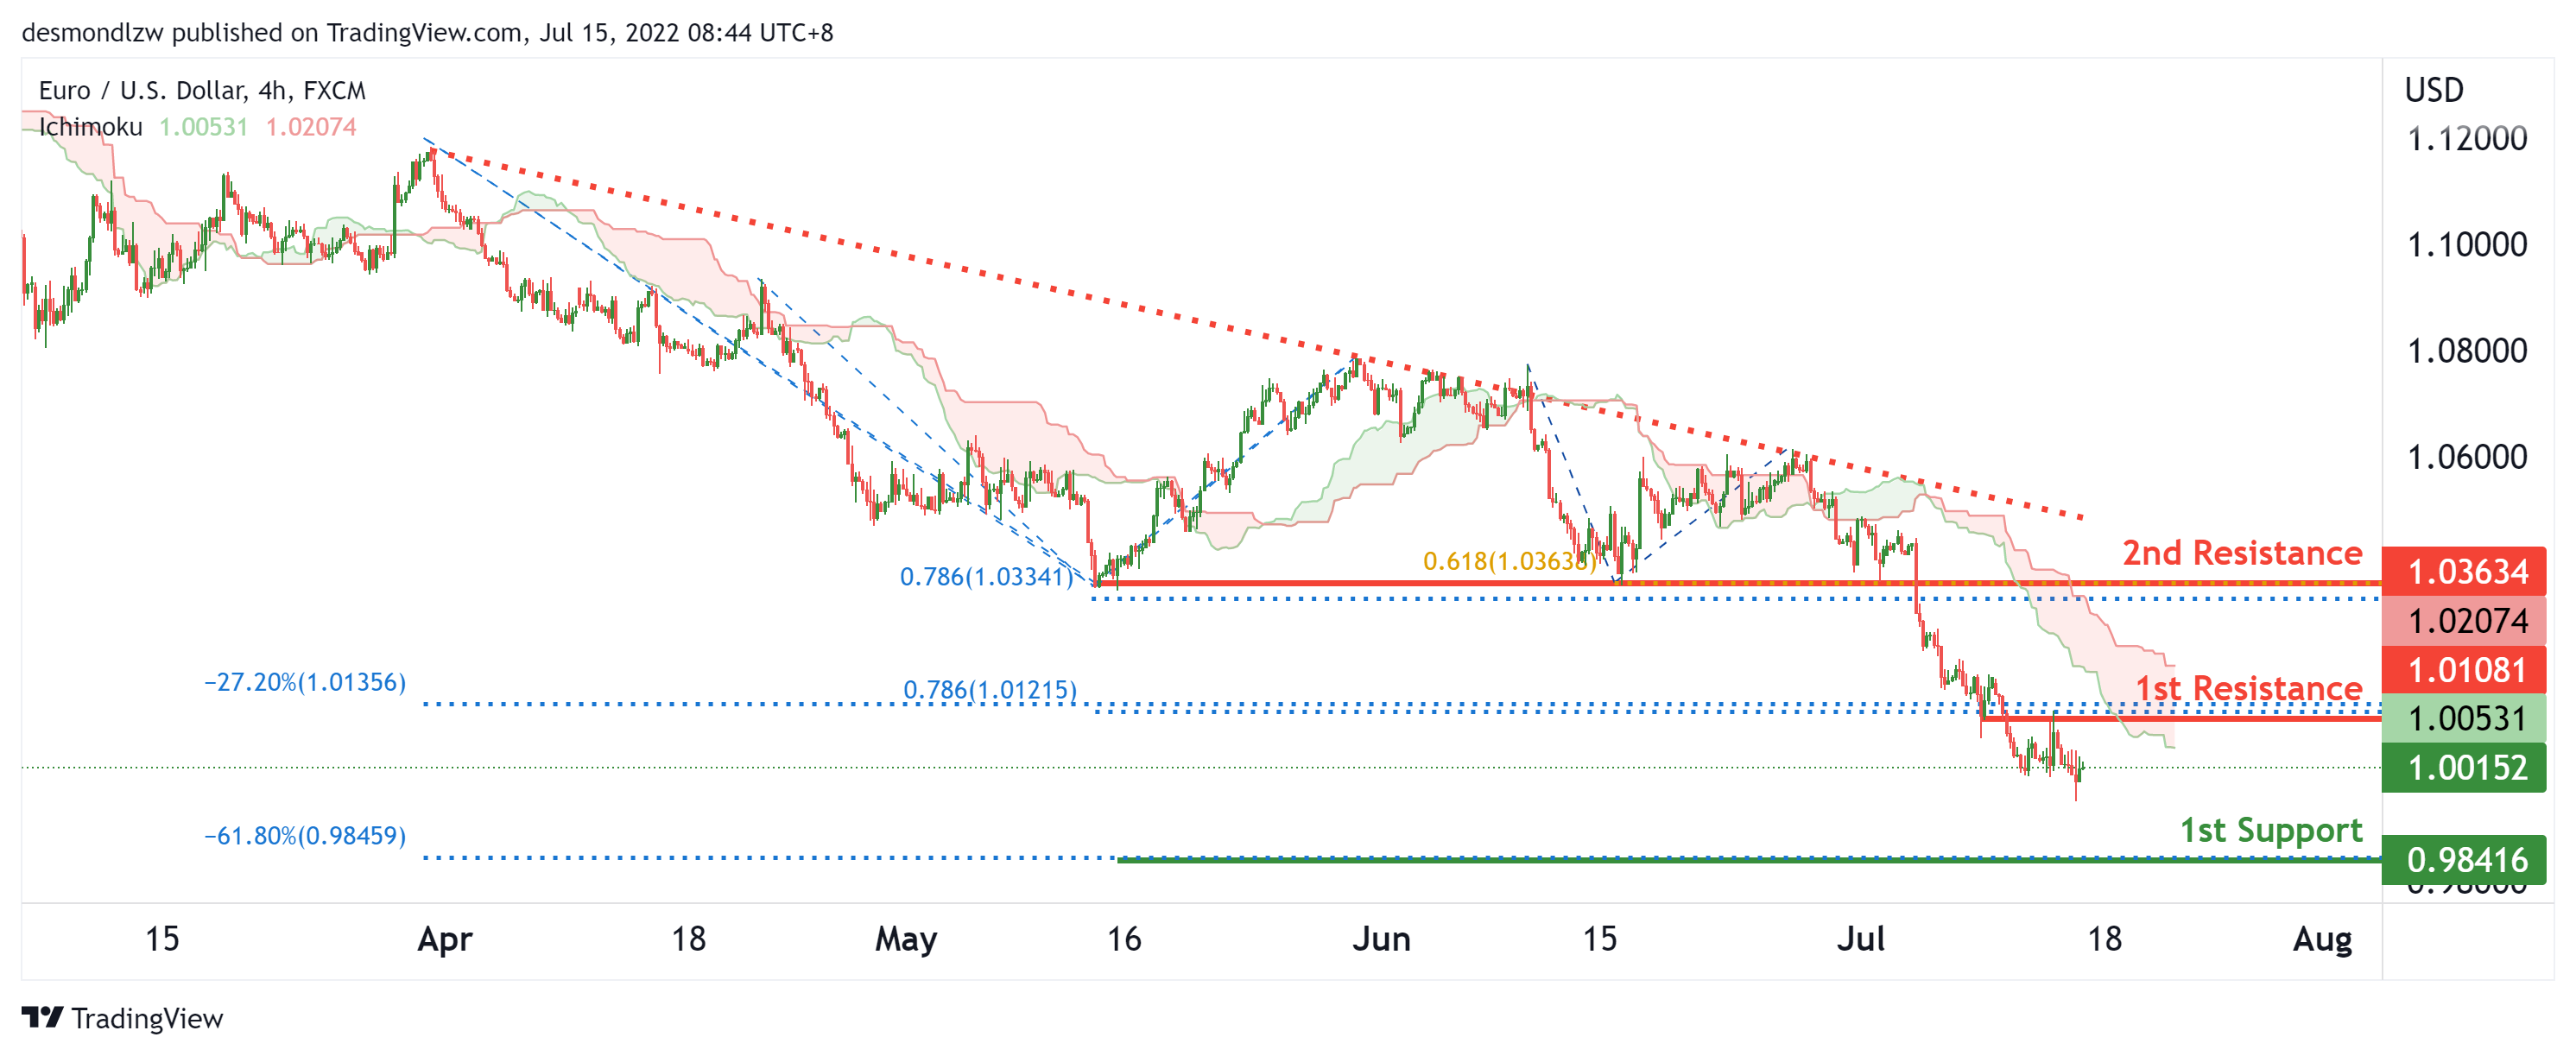
On the H4, with price moving below the ichimoku cloud and in a descending trendline, we have a bearish bias that price will continue to drop from the 1st resistance at 1.01081 at the overlap resistance in line with the 78.6% fibonacci projection and -27.2% fibonacci expansion to the 1st support at 0.98416 in line with the -61.8% fibonacci expansion. Alternatively, price may reverse off the 1st resistance and rise to the 2nd resistance at the pullback resistance at 1.03634 in line with the 61.8% and 78.6% fibonacci projections.
Areas of consideration :
- H4 1st resistance at 1.01081
- H4 1st support at 0.98416
USD/JPY:
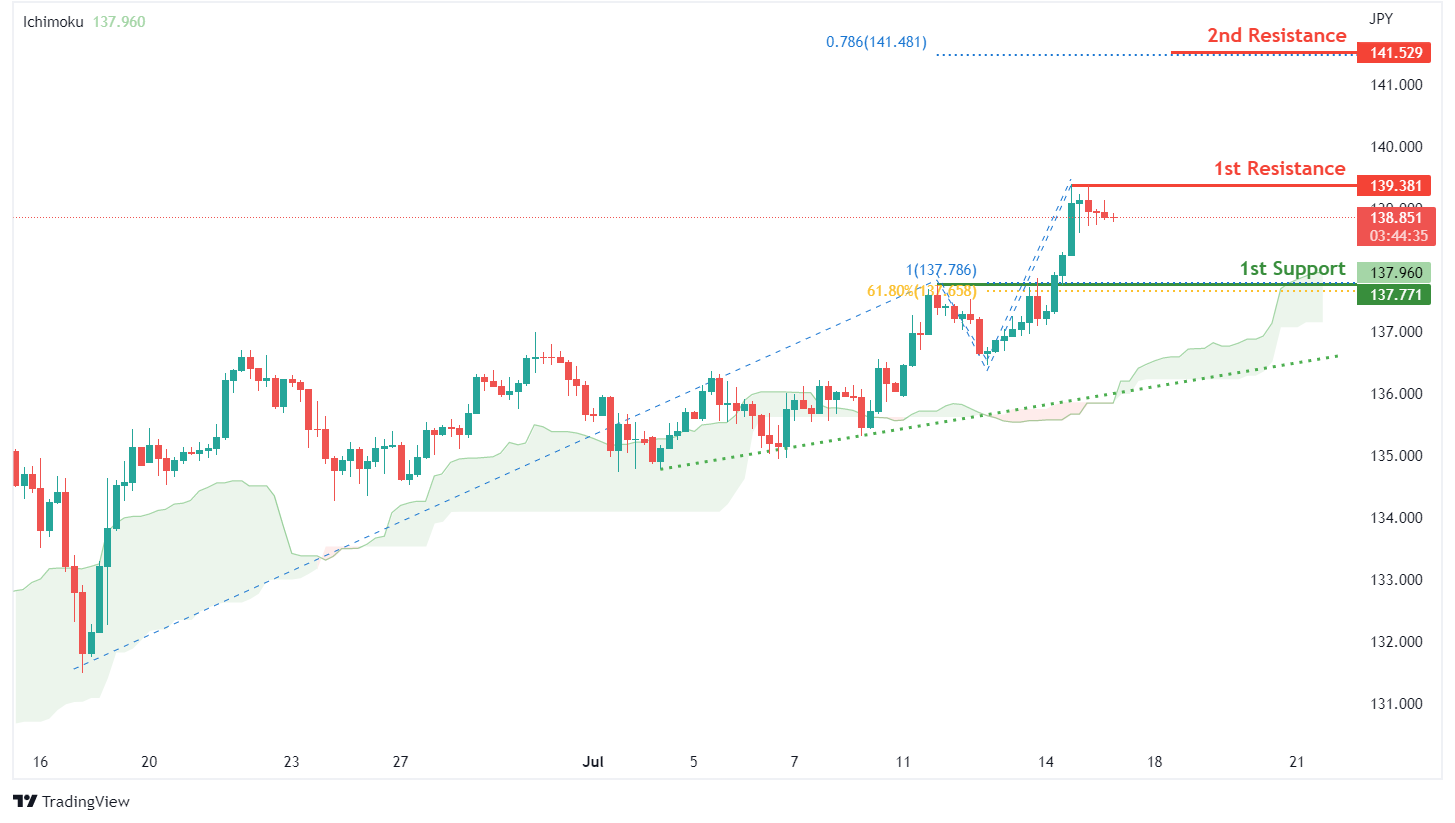
On the H4, with price moving along an ascending trendline and above the ichimoku indicator, we have a bullish bias that price will rise to our 1st resistance at 139.381 where the swing high resistance is. Once there is upside confirmation of price breaking 1st resistance, we would expect bullish momentum to carry price to 2nd resistance at 141.529 in line with 78.6% fibonacci projection. Alternatively, price could drop to 1st support at 137.771 where the pullback support, 61.8% fibonacci retracement and 100% fibonacci projection are.
Areas of consideration:
- H4 time frame, 1st resistance at 139.381
- H4 time frame, 1st support at 137.771
AUD/USD:
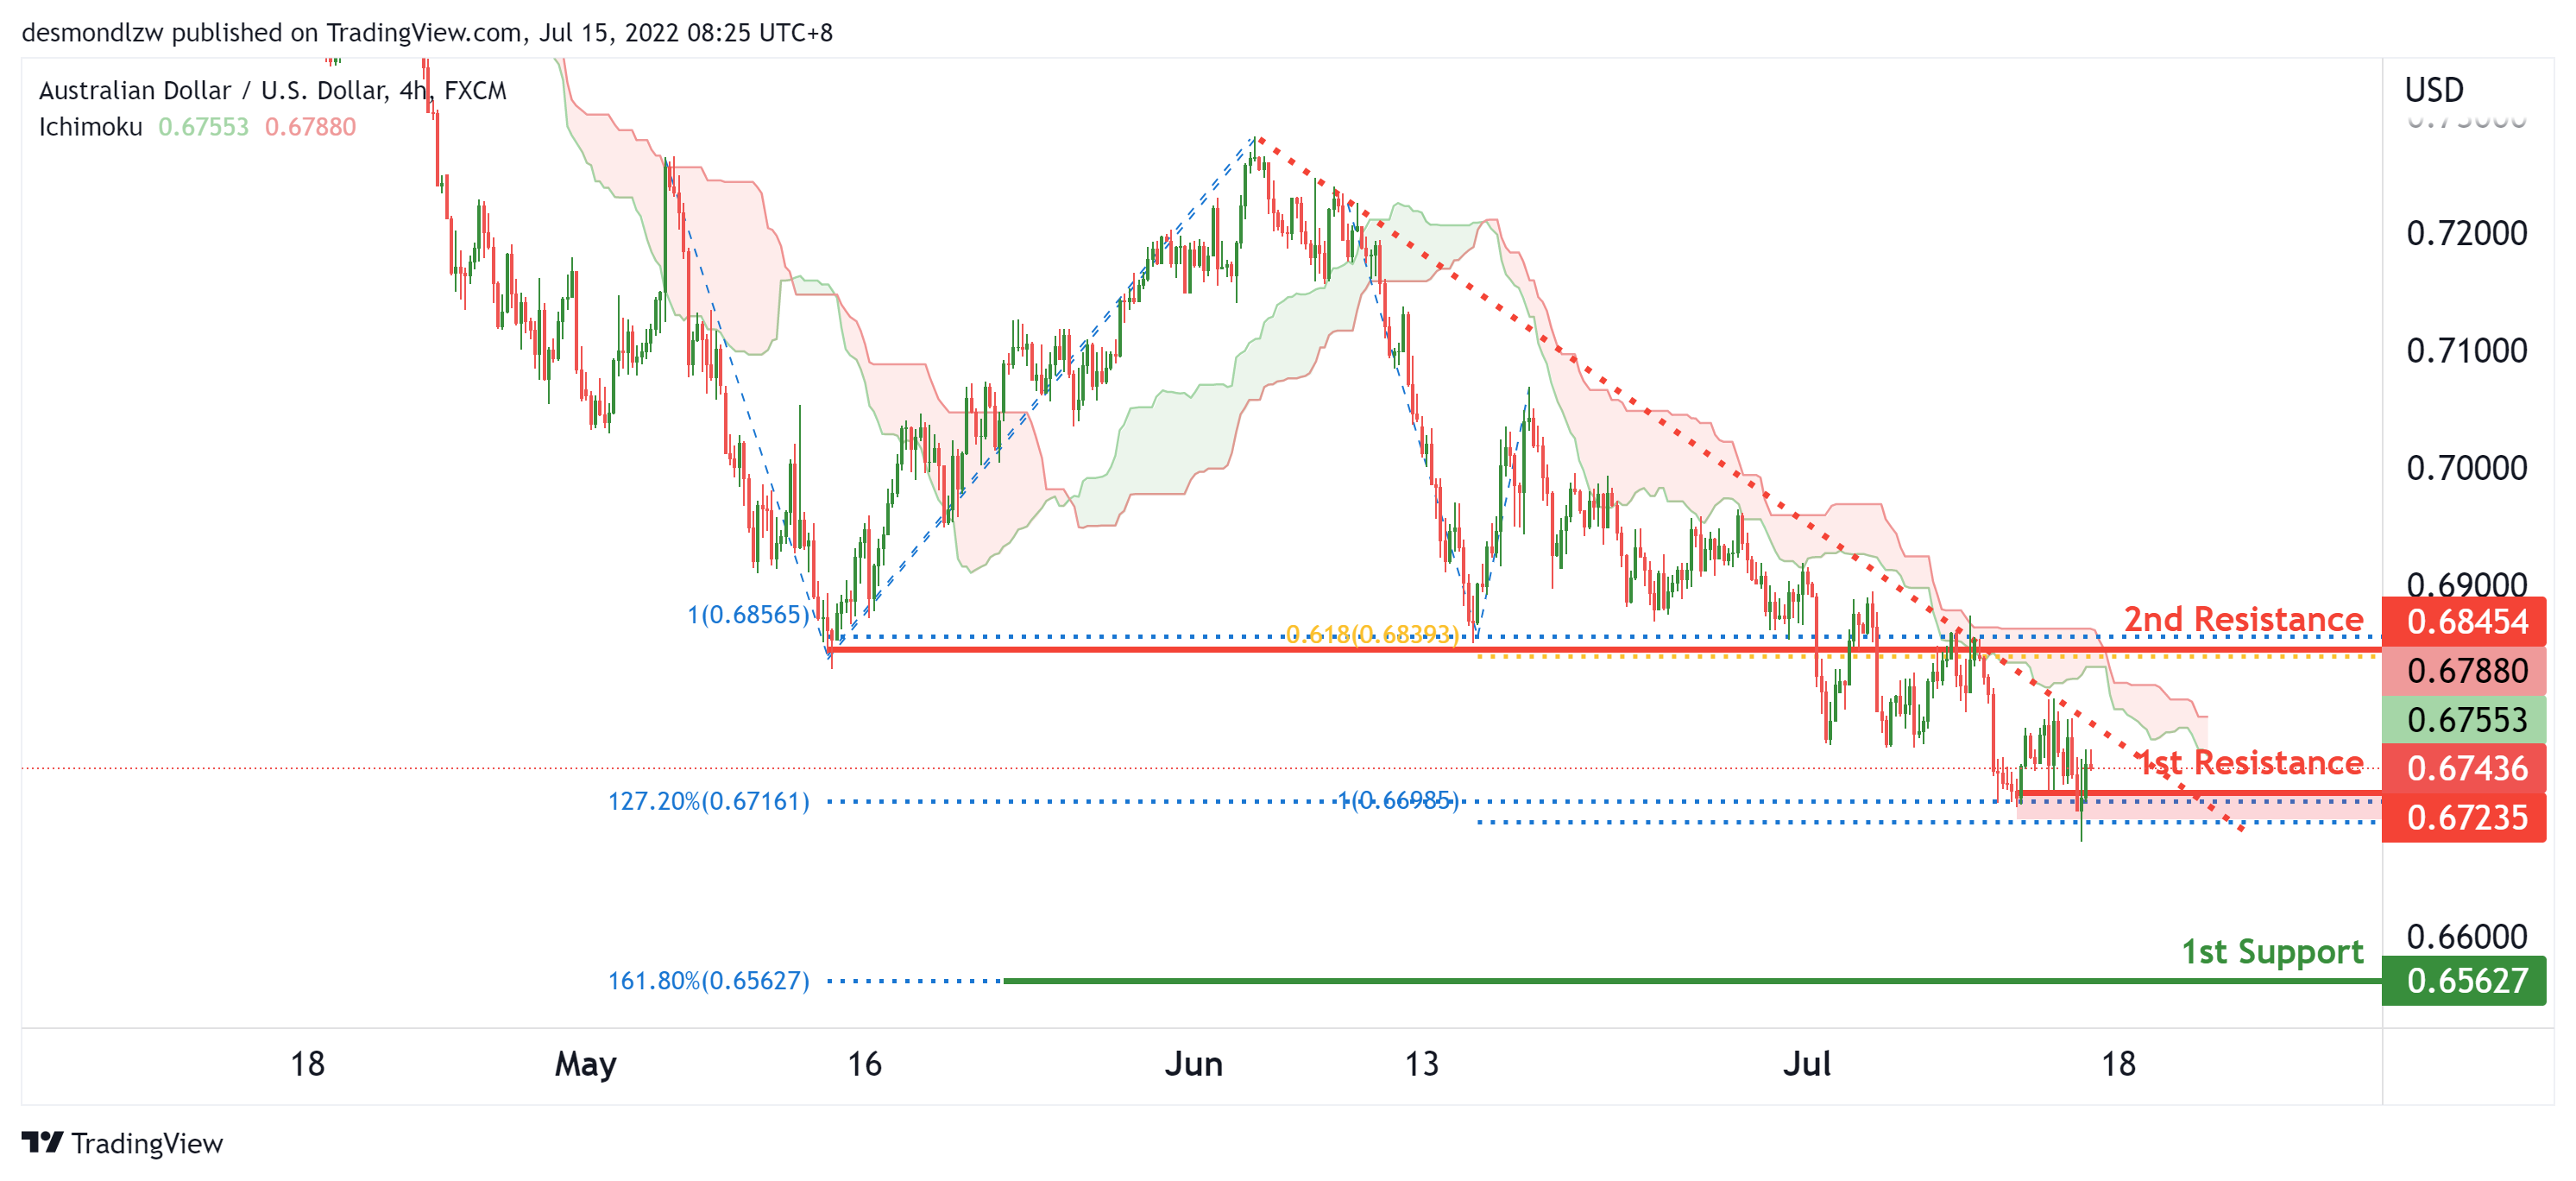
On the H4, with price moving below the ichimoku cloud and in a descending trendline, we have a bearish bias that price will continue to drop from the 1st resistance at 0.67235 in line with the 100% fibonacci projection and 127.2% fibonacci extension to the 1st support at 0.65627 in line with the 161.8% fibonacci extension. Alternatively, price may rise to the 2nd resistance at 0.68454 at the overlap resistance in line with the 61.8% and 100% fibonacci projections.
Areas of consideration
- H4 1st resistance at 0.67235
- H4 1st support at 0.6562
NZD/USD:
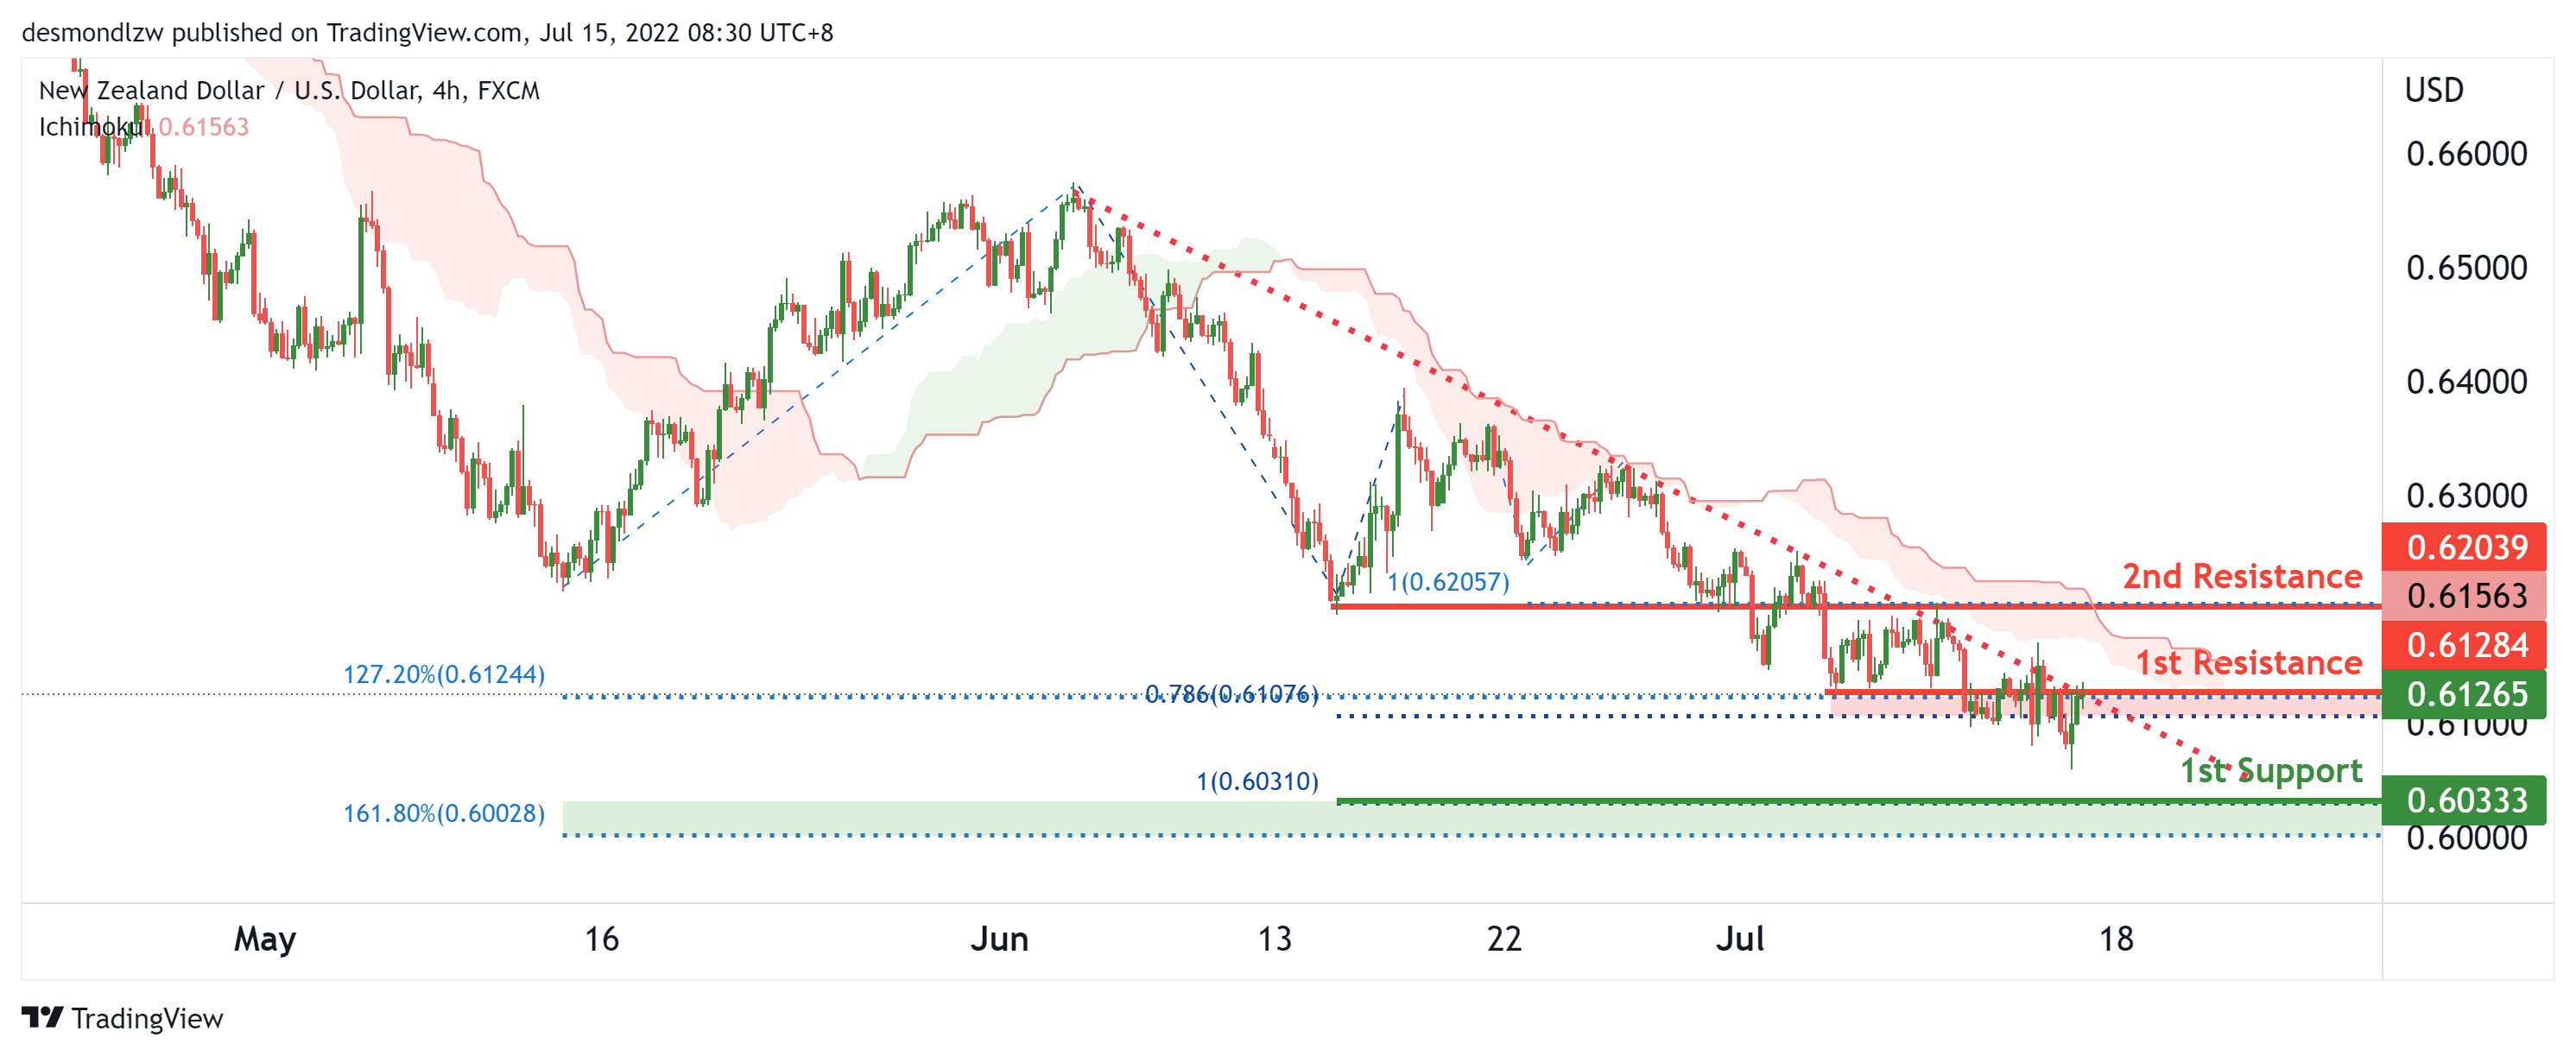
On the H4, with price moving below the ichimoku cloud and in a descending trendline, we have a bearish bias that price will continue to drop from the 1st pullback resistance at 0.61284 in line with the 127.2% fibonacci extension and 78.6% fibonacci projection to the 1st support at 0.60333 in line with the 161.8% fibonacci extension and 100% fibonacci projection. Alternatively, price may reverse off the 1st resistance and rise to the 2nd resistance at 0.62039 in line with the overlap swing high and 100% fibonacci projection.
Areas of consideration:
- H4 time frame, 1st support at 0.60333
- H4 time frame, 1st resistance at 0.61284
USD/CAD:
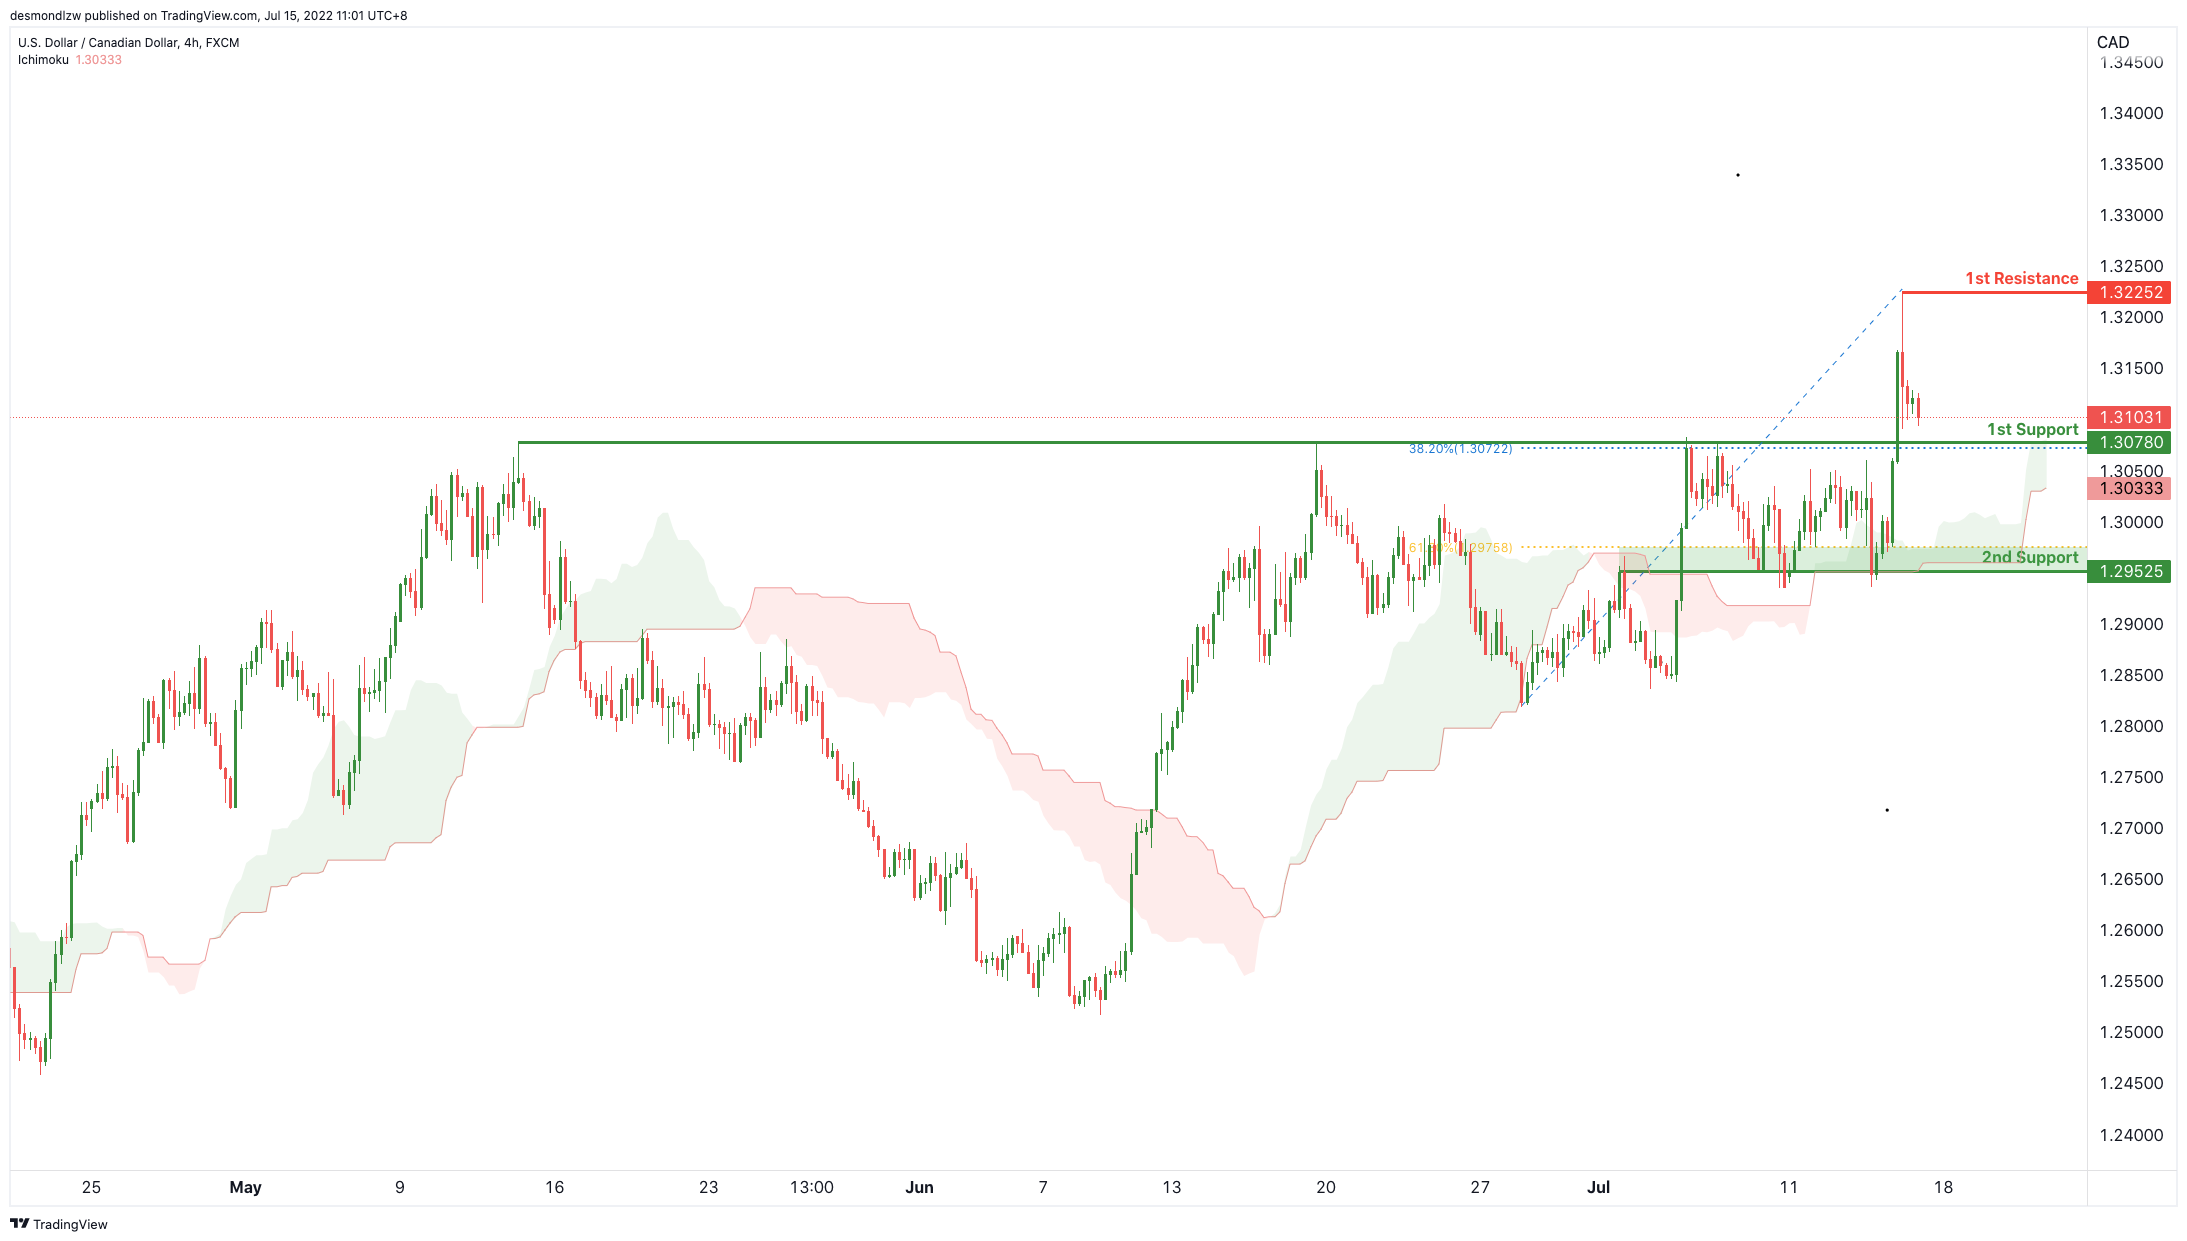
On the H4, with price moving above the ichimoku cloud, we have a bullish bias that price will rise from our 1st support at 1.30780 where the horizontal pullback support and38.2% Fibonacci retracement are to our 1st resistance at 1.32252 in line with the horizontal swing high resistance. Alternatively, price may not break 1st support and head for 2nd support where the horizontal overlap support is
Areas of consideration:
- H4 time frame, 1st resistance at 1.32252
- H4 time frame, 1st support at 1.30780
OIL:
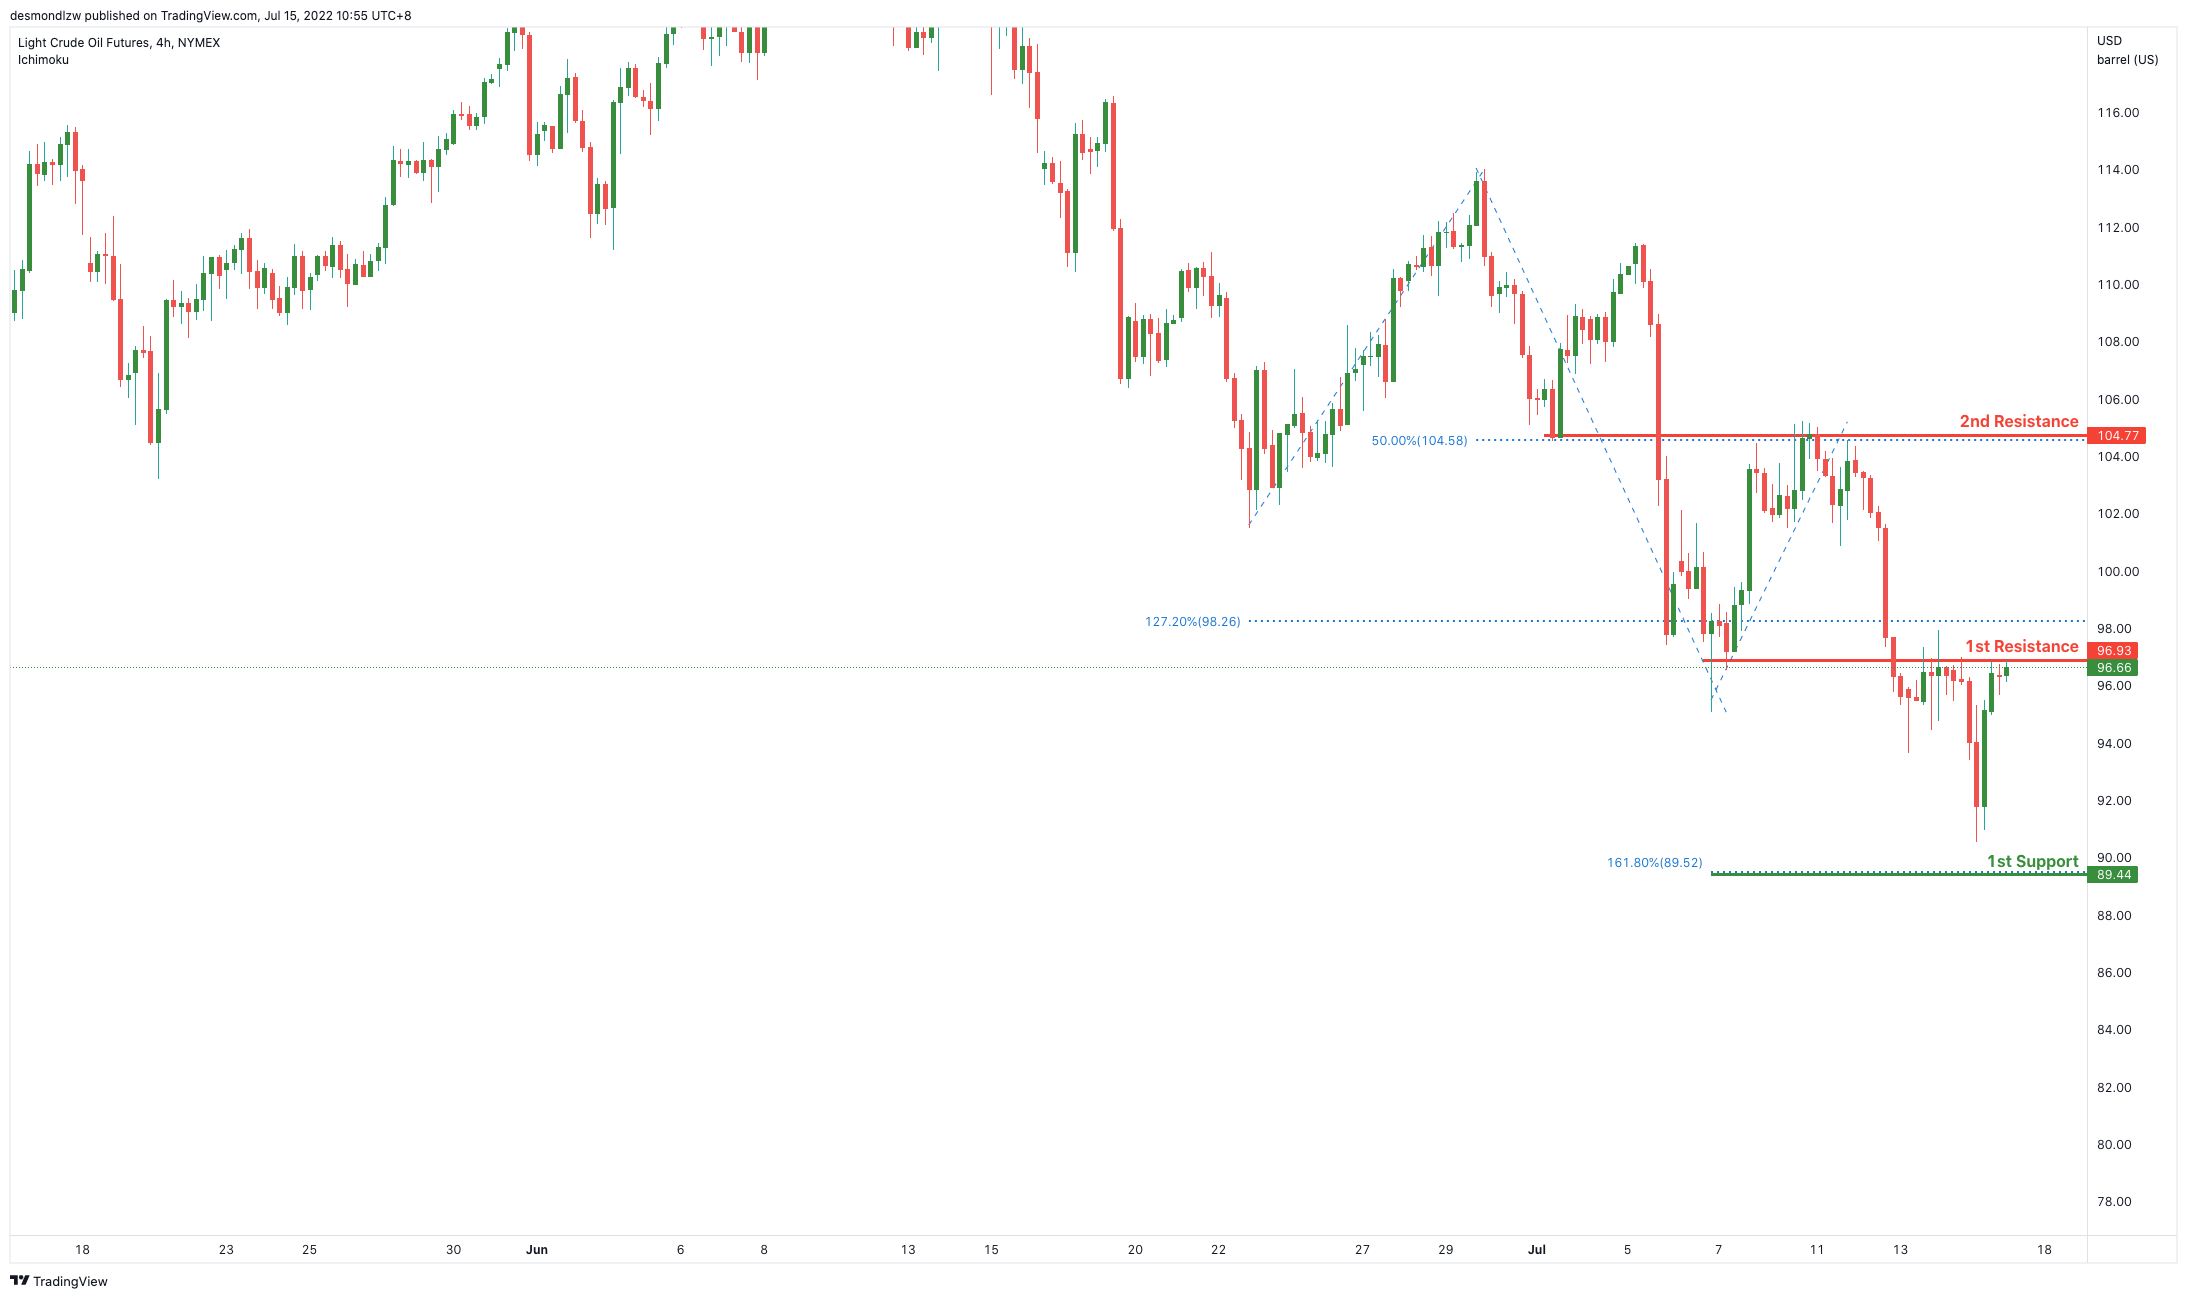
On the H4, with price moving below the ichimoku cloud, we have a bearish bias that price will drop to our 1st support at 89.44 where the 161.8% Fibonacci extension is from our 1st resistance at 96.93 in line with the horizontal pullback resistance and 50% Fibonacci retracement. Alternatively, price may break 1st resistance and head for 2nd resistance at 104.77 where the horizontal pullback resistance and 50% Fibonacci retracement is.
Areas of consideration:
- H4 time frame, 1st resistance of 96.93
- H4 time frame, 1st support of 89.44
Dow Jones Industrial Average:
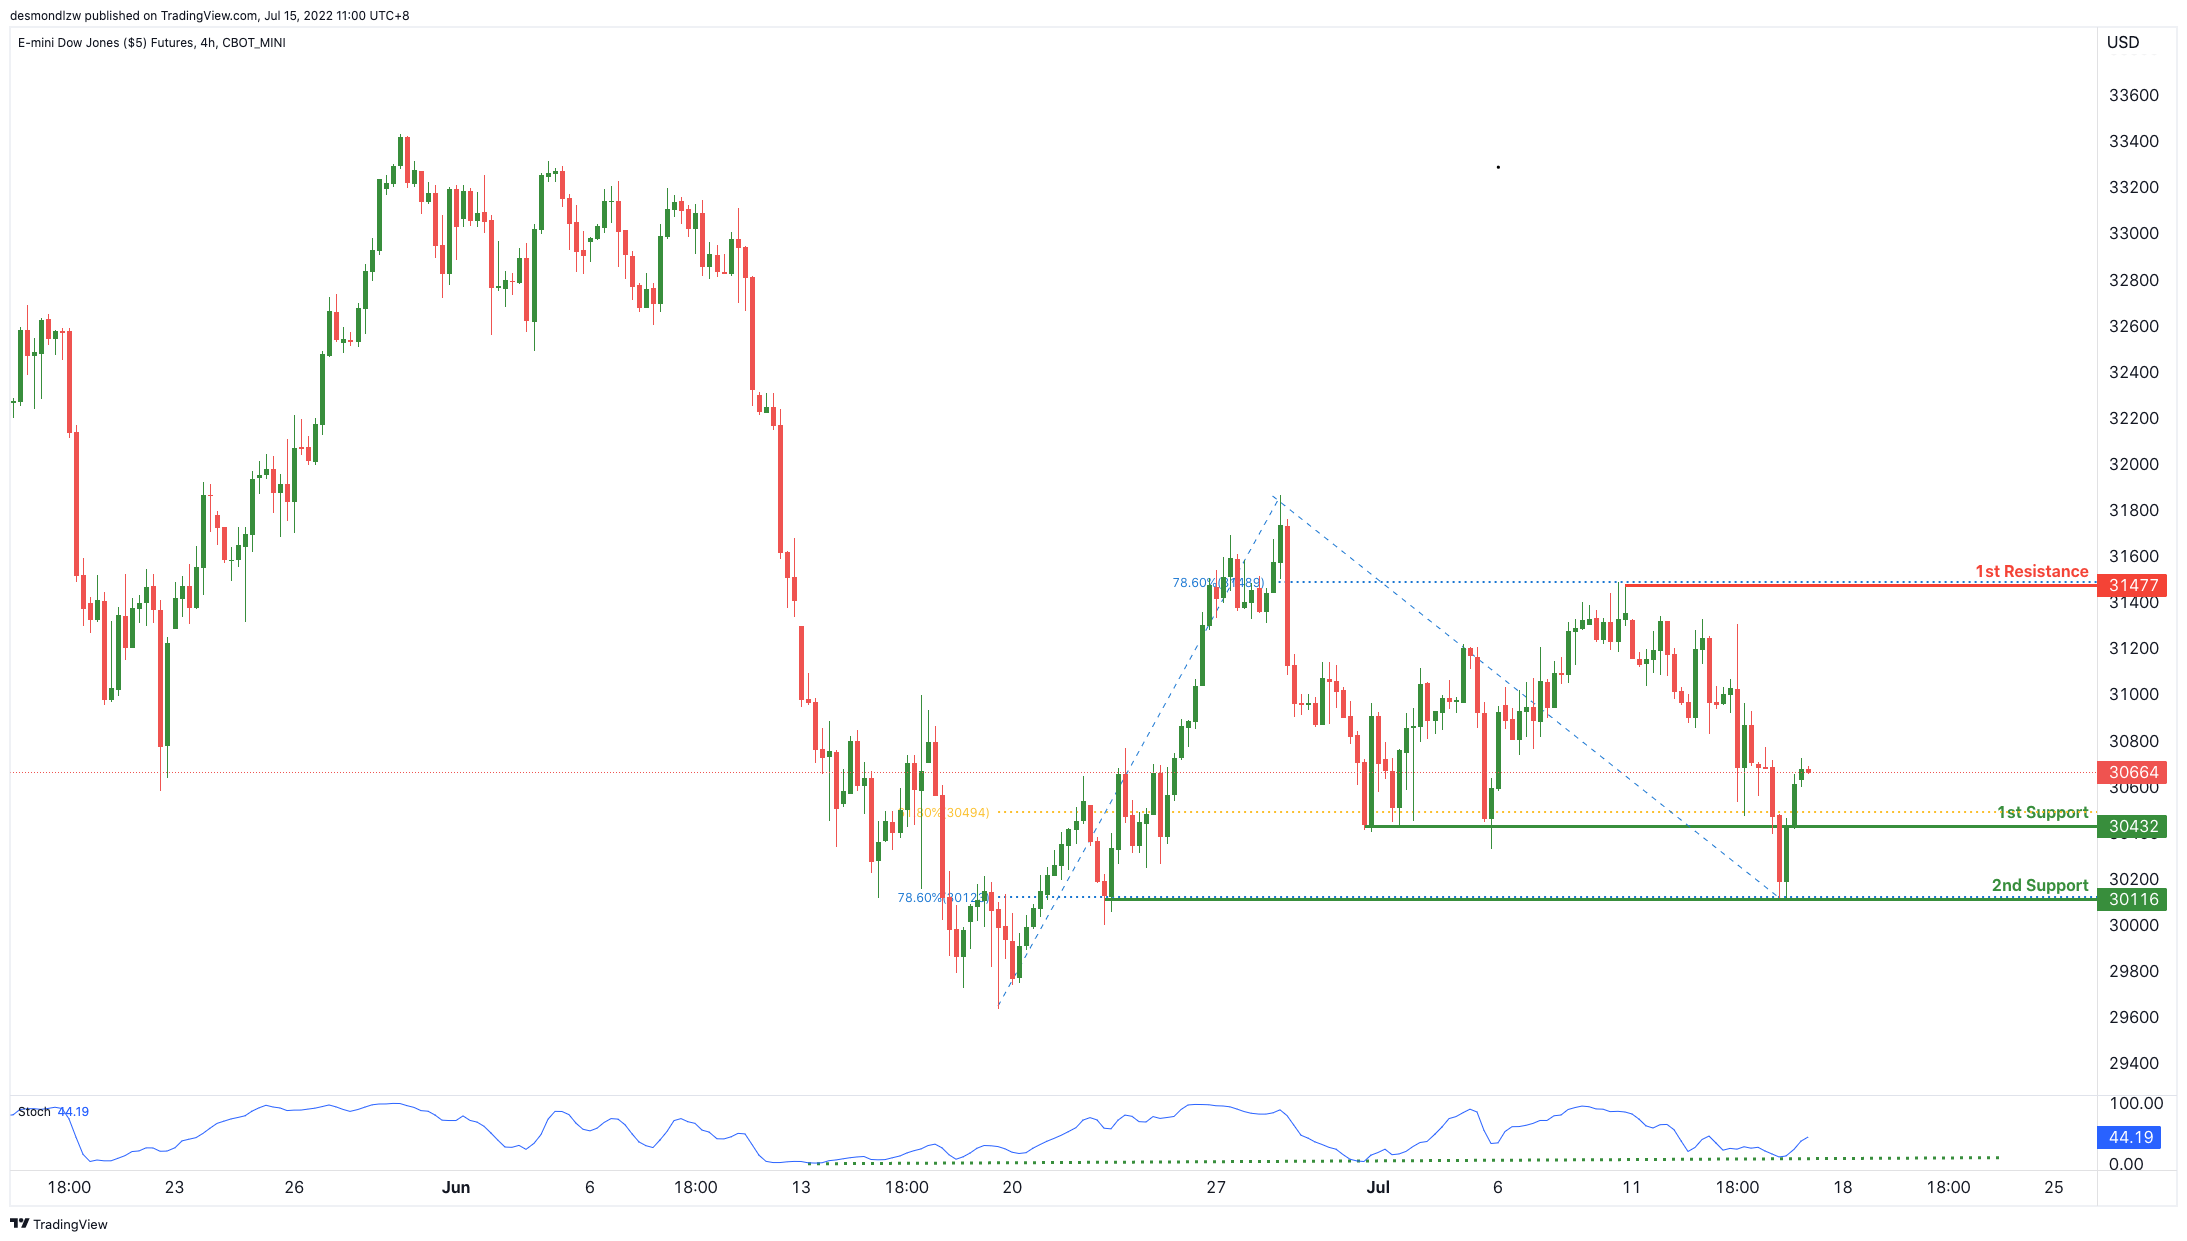
On the H4, with price expected to bounce off the stochastics indicator, we have a bullish bias that price will rise from our 1st support at 30423 where the horizontal pullback support is to our 1st resistance at 31477 in line with the horizontal swing high resistance and 78.6% Fibonacci retracement. Alternatively, price may not break 1st support and head for 2nd support at 30116 where the horizontal swing low support is.
Areas of consideration:
- H4 time frame, 1st resistance of 31477
- H4 time frame, 1st support of 30423
Cliff Notes: Yet Another Hit to Confidence
Key insights from the week that was.
This week’s Australian data highlighted the growing disparity between current activity and confidence.
According to NAB’s latest business survey, while business conditions continue to show strength across the economy, confidence has fallen below its long-run average. Arguably this deterioration stems from the availability and price of labour and other inputs as well as growing uncertainty over the global outlook. The rapid turn in monetary policy is also cause for concern for business, though at the moment the impact on activity is limited given support from the labour market and the full re-opening of the services sector. In the second half of 2022 and into 2023, business conditions are likely to come under greater pressure.
While the Westpac-MI consumer sentiment survey continues to signal confidence in the labour market and the longer-term economic outlook, households’ near-term personal financial outlook is of great concern given historic inflation and rapidly rising interest rates. Highlighting this, underlying the seventh consecutive fall in the headline index to a level only seen during times of significant economic disruption are views on family finances 20ppts below average and an economic view for the year ahead 12pts below average.
Unsurprisingly, the ‘time to buy a dwelling’ index is now 32ppts below average and house price expectations continue to deteriorate. Also of concern for the growth outlook, ‘time to buy a major household item’ is now 30ppts down on its average level – note though this indicator is also picking up the rotation from goods to services as the economy re-opens. After its release, Chief Economist Bill Evans provided a video update on the implications for the economy and RBA of these trends.
At least the labour market outlook should remain an enduring positive, with June’s employment print coming in materially higher than expectation at a strong 88k. The employment outcome also saw the unemployment rate fall 0.4ppts to a 48-year low of 3.5% despite a 0.1ppt rise in participation. Australia’s labour market is clearly in unprecedented territory, with there now being one unemployed person per job vacancy and a record-high employment-to-population ratio. Gains over the remainder of 2022 will depend on how much further participation can rise as well as the outlook for immigration.
Australia’s arrivals and departures data suggests material changes in labour supply through immigration will take time, with a robust increase in arrivals to 737k in June offset by a very strong lift in departures to 885k, reflecting the normalisation of visitor flows as recent short-term visitor arrivals cycle out as departures. This lack of positive net arrivals is also evident in the underlying detail. Travel on a permanent/long-term basis and visa-related travel over recent months has shown as many arrivals as departures.
Turning then to New Zealand. As expected, the RBNZ delivered another 50bp hike at their July meeting, taking the cash rate to 2.50%. Our New Zealand economics team provided a full update on the decision and outlook after the announcement, highlighting in particular that the “RBNZ’s focus remains on the risk of homegrown inflation pressures becoming persistent, with strong demand running up against capacity constraints” and that the team continues to expect another 50bp increase in August, taking the cash rate near the level likely to prove the peak for this cycle.
Moving further afield, inflation and the required response of monetary policy remained front of mind for the US. In June, the headline CPI surprised to the upside again, prices rising 1.3%/9.1%yr. Core inflation was also stronger than expected, 0.7%/5.9%yr. Price pressures are certainly strong and broad based. But, in the detail of the report, there were no new breakout price moves. As supply constraints are worked through and demand remains under pressure from declining real incomes and tighter policy, we expect inflation will moderate back near the FOMC’s target.
In terms of the timing and implications for monetary policy, while July has so far seen a significant decline in the price of oil and food commodities, we expect the FOMC will feel compelled to continue tightening at a rapid rate in July and September – we forecast hikes of 75bps and 50bps. However, by the November and December meetings, when we expect two 25bp hikes to conclude the tightening cycle, declining commodity prices and the (already evident) reduction in price growth for goods ex energy and food should combine to give the FOMC comfort that the inflation threat is passing, allowing an on-hold stance to be adopted at a contractionary level of 3.375% from December.
In our view, the implications for activity of the above outturn for policy are concerning, with economic stagnation or recession to remain a material risk through 2022 and 2023. As we outlined this week, the Atlanta Fed’s nowcast for Q2 GDP currently suggests GDP contracted through the six months to June as the headwinds from declining real incomes, the rapid tightening of financial conditions, and historically-low confidence began to take effect.
In addition to the full impact of these forces being felt in coming quarters, it is also now clear that employment growth is slowing abruptly and nominal wages growth decelerating ahead of inflation. These trends bode ill for the business investment outlook as does the 20-year high for the US dollar. If the FOMC does not progressively shift its view on the risks from inflation to activity, not only is stagnation likely during 2022 and 2023, but potentially also into the medium-term. To combat this risk, we anticipate 125bps of easing from December quarter 2023 to December 2024, leaving the fed funds rate at 2.125%.
Gold Wave Analysis
- Gold broke pivotal support level 1725.00
- Likely to fall to support level 1684.00
Gold recently broke below the pivotal support level 1725.00 (former multi-month support from last September).
The breakout of the support level 1725.00 is aligned with the clear downtrend that can be seen on the daily charts.
Gold can be expected to fall further toward the next support level 1684.00 (former powerful support from August of 2021) – from where gold is likely to correct up.
EURCAD Wave Analysis
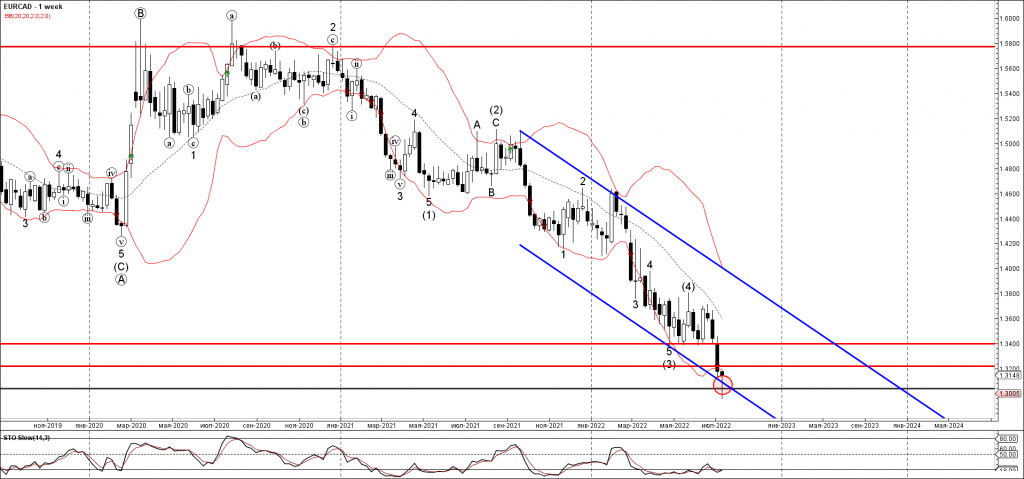
- EURCAD reversed from major support level 1.3020
- Likely to rise to resistance level 1.3200
EURCAD recently reversed up from the major long-term support level 1.3020 (former multi-year low from the middle of 2015), standing outside of the lower weekly Bollinger band.
The upward reversal from the support level 1.3020 is likely to form the weekly Japanese candlesticks reversal pattern Hammer.
Given the oversold weekly Stochastic, EURCAD can be expected to rise further toward the next resistance level 1.3200.
Eco Data 7/15/22
[php_everywhere instance="1"]
Fed Waller supports larger than 75bps hike if retail sales and housing data materially stronger than expected
Fed Governor Christopher Waller said in a speech that as the base case, he supports another 75bps rate hike at the July 26-27 FOMC meeting. This level is "close to neutral", neither stimulates nor restricts demand.
But Waller added, if upcoming retail sales and housing data "come in materially stronger than expected it would make me lean towards a larger hike at the July meeting to the extent it shows demand is not slowing down fast enough to get inflation down."
After July, Waller expects "monetary policy to be restrictive until there has been a sustained reduction in core personal consumption expenditure (PCE) inflation, which excludes food and energy." And, "until I see a significant moderation in core prices, I support further rate hikes," he added.
Oil Outlook Bears Leading the Way
As global economic conditions continue to stroll casually towards deterioration, the market scrambles to reappraise the possibility for a recession. Contributing to the worsening of the economic outlook, is the soaring inflation, with year-on-year US consumer price index, reaching levels once seen before in 1981, marking a four-decade high, which puts increased pressure on the Fed to adopt an even more hawkish stance. Not only that, but the inversion of the yield curve also points out that the market anticipates economic fallout, sooner rather than later, as we observed increased volatility in the bond market around the CPI release. As a consequence, WTI slipped lower yesterday 13th of July, closing the day around the $94 per barrel. In this report we aim to provide a comprehensive analysis on the current economic developments, draw a picture on what could lie ahead and finish off with a technical analysis of WTI.
US Secretary Treasury Yellen, embarked on a new crusade mission towards the far east, attempting to encourage G20 members, to opt-in the price-capping plan on Russian oil. The price cap aims to prevent another global price spike in the energy sector, by allowing the flow of Russian oil towards the west and in parallel restrict the revenues, Russia uses to finance its war operations in Ukraine. Problems arising with the price proposal include, how to enforce the plan, what would the proposed sales price be and whether the other counterparts will subscribe to the idea. Furthermore, another factor outside of western control is whether Russia will agree to sell oil at the “mandated” price to western nations. This highlights the fragmented microcosmic perspective of westerners on the matter, naively assuming that Russia cannot and will not divert their oil exports towards, other non-western nations such as India and China. Without much surprise, the proposed plan triggered President Putin’s reaction, lashing out and threatening the western nations for “catastrophic consequences” for world energy markets, if they impose further sanctions on Moscow. Characteristically, on another note, currently Nord Stream 1 pipeline which supplies natural gas to Europe, is closed for maintenance, but analysts fear the reopening could be delayed as a retaliation tactic, by Russian government.
President Biden is to visit the Saudi Arabian oil mogul royalties, pitching for a production boost this weekend. Even though, it appears Saudi Arabia, the top crude oil producer, currently runs at maximum output capacity according to OPEC, the expected output increases to be discussed at the meeting will take place in the near future. Noteworthy, are the major OPEC players, such as Nigeria and Libya who are facing production and export limitations, failing to deliver promises, due to sociopolitical unrest and operational hurdles respectively. Should the meeting with Biden and Saudis fail to produce any increase in production levels in the near future, that could cause practically the price of oil to rise as it would imply the possible shortage of the supply of the commodity.
Turning our attention towards yesterday’s key economic releases we noticed that the market reaction was rather contradictory, diverging from fundamental market expectations. As an example, the surprise actual YoY CPI rate of 9.1% contrasted with the 8.8% forecast, should have in our assessment, pushed the greenback to higher grounds, a scenario wherein the strong US dollar would weigh down WTI’s price. On the contrary, we saw the dollar closing the day in the reds whilst oil closed in the greens. Moreover, US Crude Oil Inventories release reported surpluses by both the American Petroleum Institute as well as the Energy Information Administration failed to weigh on oil’s price, despite implying a slack in the US oil market. Thus, we maintain a bearish bias outlook for the continuation of WTI’s price action in the short-term horizon.
As to what follows, the Baker Hugh’s oil rig count will be out tomorrow 15th of July, which will shed some light on the demand-side of oil. In the grand scheme of things, we expect oil prices to be affected by supply and demand fundamentals. Should market worries for a possible supply shortage intensify, we may see oil prices getting a boost, while on the flip side should market worries for a possible recession and lockdown measures in China come into play, we may see the demand expectations of oil dropping, thus weigh on oil’s prices.
Technical Analysis
WTI H4
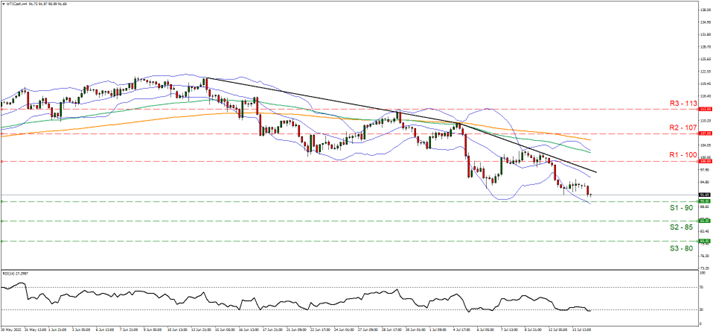
WTI continues to move in a downward trend, as we can observe the lower peaks and lower troughs forming a descending trendline. WTI currently trades around the $91 range aiming for the $90 (S1) having the $100 psychological level as closest resistance (R1). We tend to have a propensity for a continuation towards a downwards motion, as we believe that a breaking through the $90 support (S1) line and $85 support (S2) barrier its within WTI’s reach, in the short-term horizon. Supporting our case, the RSI indicator below our 4-hour chart is nearing the reading of 30. Also, given the fundamentals described above, there could be a substantial possibility for the price to experience volatility and head further down. Should WTI find extensive buy orders along its way, we may see its price action breaking through the descending trendline first, signaling a possible trend reversal, then followed by a break above the $100 psychological resistance (R1) line and moving decisively towards the $107 resistance (R2) hurdle. Should selling interests continue to be seen, we may see its price breaking the $90 (S1) support line, a level not seen since February 2022, and move decisively lower, aiming for the $85 support (S2) level.
Yen Tumbles to 139
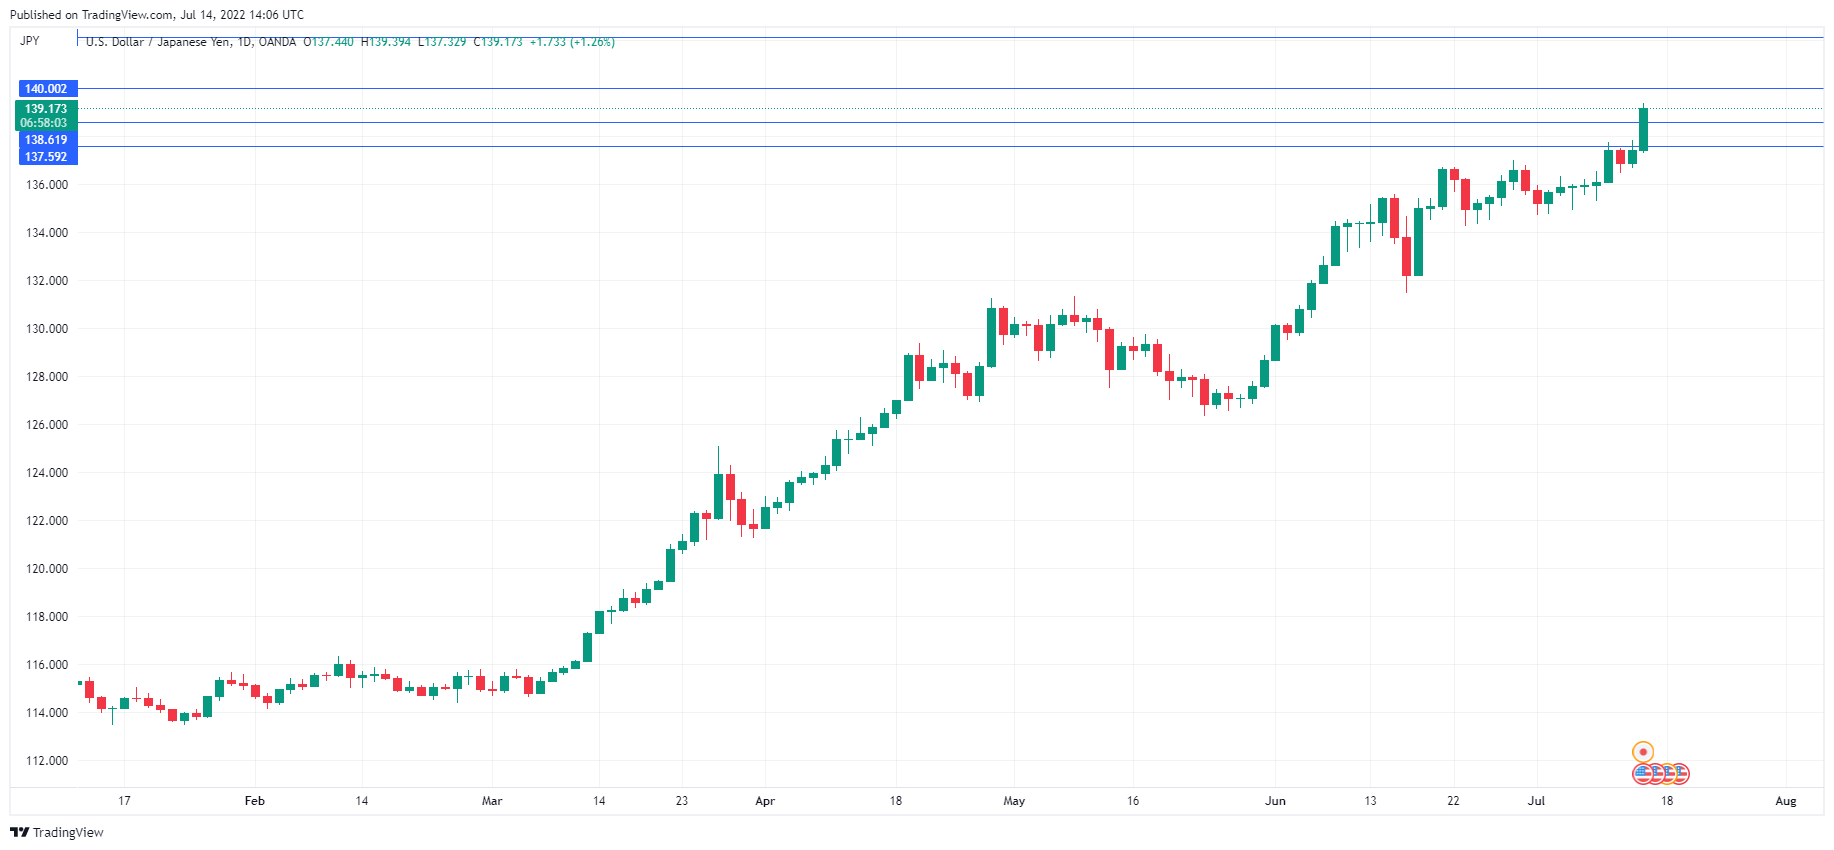
The Japanese yen has been pummeled today by the US dollar. USD/JPY is currently trading at 139.22, up 1.29% on the day.
Is 140 next for the yen?
The US dollar is showing broad strength today, and for the yen that has meant a new 20-year low, as USD/JPY touched 139.39 earlier in the day. The symbolic 140.00 line is within striking distance, and it would certainly be memorable if the yen breaks 140 right after the euro broke below the parity line for the first time since 2000.
There have been a parade of central banks announcing higher rates in the past day, notably the Bank of Canada, which surprised the markets with a massive 100bp increase, and the Bank of Korea, which raised rates by 50bp. This has put the Bank of Japan’s loose policy further out of sync with the global trend of tightening, and this appears to be weighing on the yen.
On Monday, the yen slid around 1%, triggering a response from Japan’s Finance Minister Suzuki, who expressed his concern about the exchange rate at a meeting with US Treasury Secretary Yellen. We have seen this jawboning from Suzuki before, but the likelihood of the Ministry of Finance (MOF) intervening in the currency markets to prop up the ailing yen are remote. We have seen the yen cross the 120 and 130 lines without incident, and there is nothing magical about the 140 level either.
I would note that there are mixed signals emanating from the MOF and the Bank of Japan, which lead me to believe that no intervention is being planned. Governor Kuroda reiterated on Monday that the central bank would take additional monetary easing steps as necessary in order to boost the fragile economy. Kuroda has said on occasion that a weak yen has its advantages, and it seems unlikely that a 140 yen will trigger any change in policy from the BoJ. There are no guarantees, of course, but I would submit that the MoF and BoJ have bigger worries than a weak Japanese yen.
USD/JPY Technical
- USD/JPY has support at 135.82 an 135.06
- There is resistance at the round number of 140.00, followed by 142.14