Sample Category Title
Canadian Dollar Sides Post-BoC
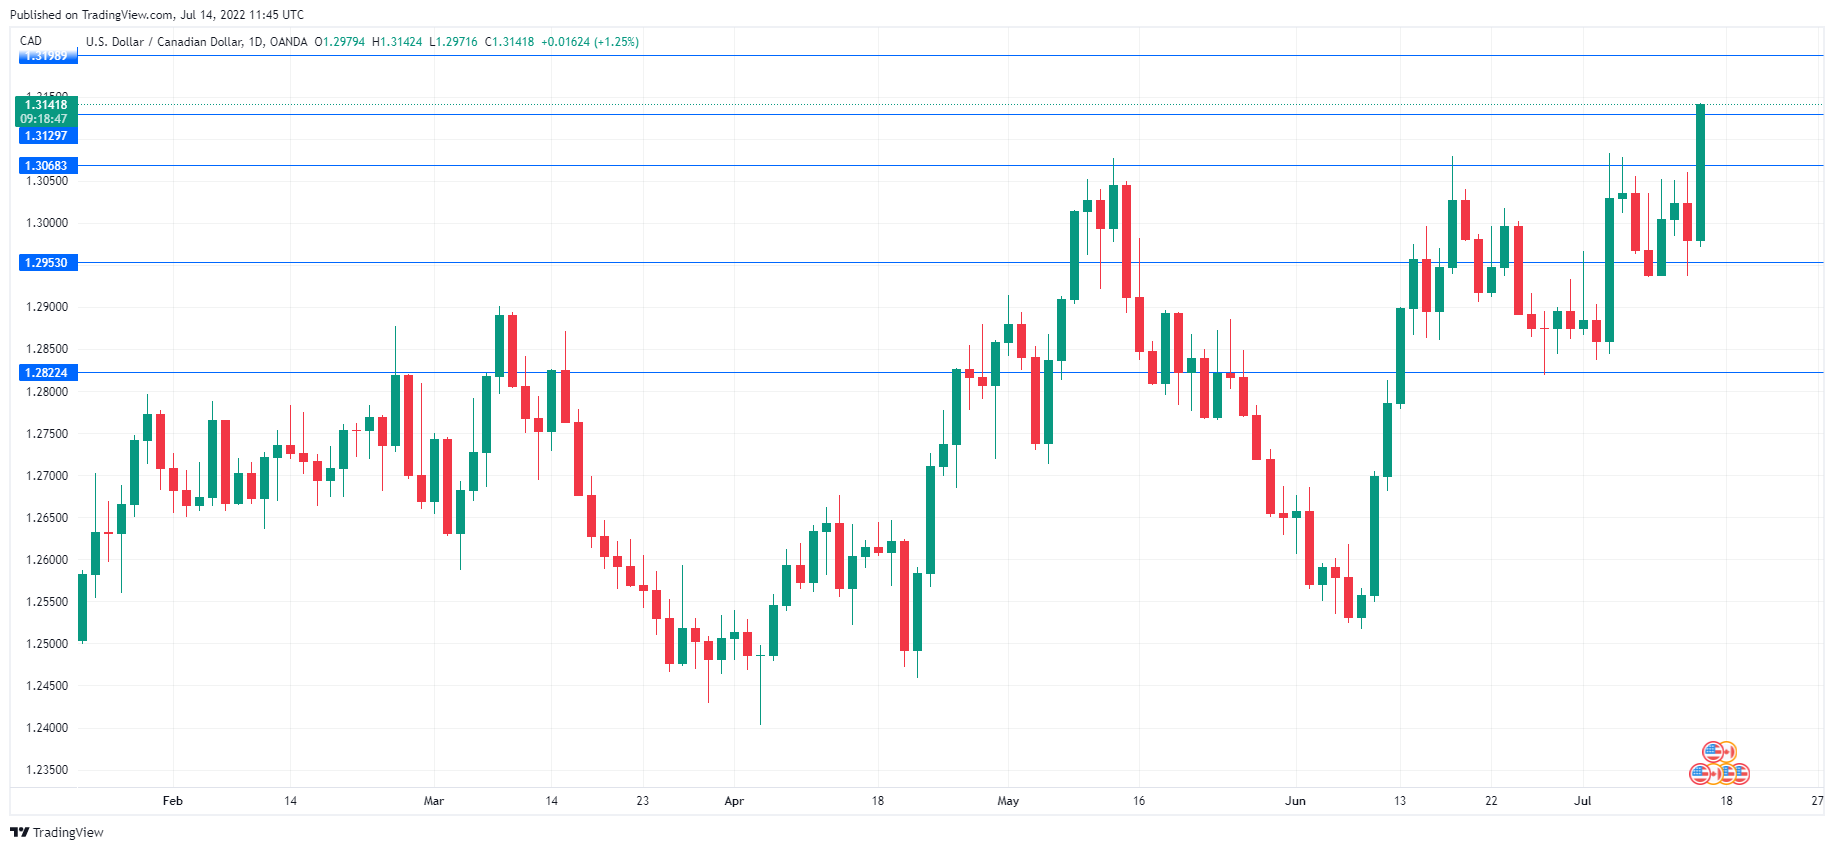
The Canadian dollar has posted sharp losses on Wednesday. In the European session, USD/CAD is trading at 1.3132, up 1.18%.
BoC shocks with 100bp salvo
The Bank of Canada has been in an aggressive mode, but nobody was expecting the massive 100bp hike on Wednesday, the largest rate increase in 24 years. The markets had priced in a 75bp move, and the Canadian dollar responded with modest gains. The cash rate now stands at 2.5%.
The massive increase shows that the BoC is pulling out all the stops in order to curb hot inflation, which has hit 7.7%, a 39-year high. The BoC is well aware that over-tightening could tip the economy into a recession, but this is the price to pay to ensure that inflation does not become entrenched through wage gains and price increases. Consumers and businesses are expecting high inflation to persist, and this can become a self-fulfilling prophesy and lead to even higher inflation.
Along with the huge rate hike, the BoC had some grim news. The central bank raised its inflation forecast, which is expected to hit 8 per cent in the second and third quarters of this year. Growth is forecast to fall to 3.5% this year, down from 4.2% previously.
The Canadian dollar wasn’t able to hold onto yesterday’s gains and has dropped sharply today. Investors remain risk-averse after the US inflation report, as headline CPI jumped to 9.1% YoY, up from 8.8%. Core CPI dropped a notch from 6.0% to 5.9% but this didn’t ease the disappointment that the inflation peak remains as elusive as ever. The inflation report has dramatically elevated the likelihood of a massive 100bp, which according to the CME’s FedWatch stands at 84% – less than a week ago, the likelihood of a 100bp move was a mere 7%.
USD/CAD Technical
- USD/CAD has broken above resistance at 1.3068 and 1.3129. Above, there is resistance at 1.3199
- There is support at 1.2953 and 1.2822
Aussie Shrugs Off Superb Jobs Report
Australian employment sparkles
It has been a week of the good and the bad/ugly from Australian releases. The employment report for June, released earlier today, improved from May and easily beat expectations. The economy created 88.4 thousand jobs, up from 60.6 thousand in May and well above the 30.0 thousand estimate. The unemployment rate dropped to 3.5%, down sharply from 3.9% in May (3.8% exp.). This is good news for the RBA, which is relying on a robust labour market to bear the weight of an aggressive rate policy.
The RBA has raised the cash rate to 1.35%, with more hikes on the way. The relatively low cash rate hasn’t had much effect on soaring inflation, which surged to 5.1% in the first quarter. Australia releases Q2 inflation on July 27th, the same day as the Federal Reserve policy meeting. The RBA has said that inflation could top 7%, which would exacerbate the current cost of living crisis.
Higher inflation has taken a bite out of business and consumer confidence, which headed southward earlier in the week. Westpac Consumer Confidence index for July came in at -3.0%, its ninth decline in 10 months. As well, NAB Business Confidence for June slowed to 1, down from 6 in May. Consumers and companies don’t have much confidence in the economic outlook, and that can translate into decreased spending in a time of uncertainty, which would be bad news for the economy.
Inflation releases tend to grab the headlines, especially with inflation going up and up. However, the RBA is no less concerned with inflation expectations, as inflation will be even harder to curb if consumers and businesses expect inflation to continue to rise and rush to make purchases, thus exacerbating the pressure on prices. Earlier in the week, Melbourne Institute Inflation Expectations remained high at 6.3%, although this was an improvement from the previous reading of 6.7%.
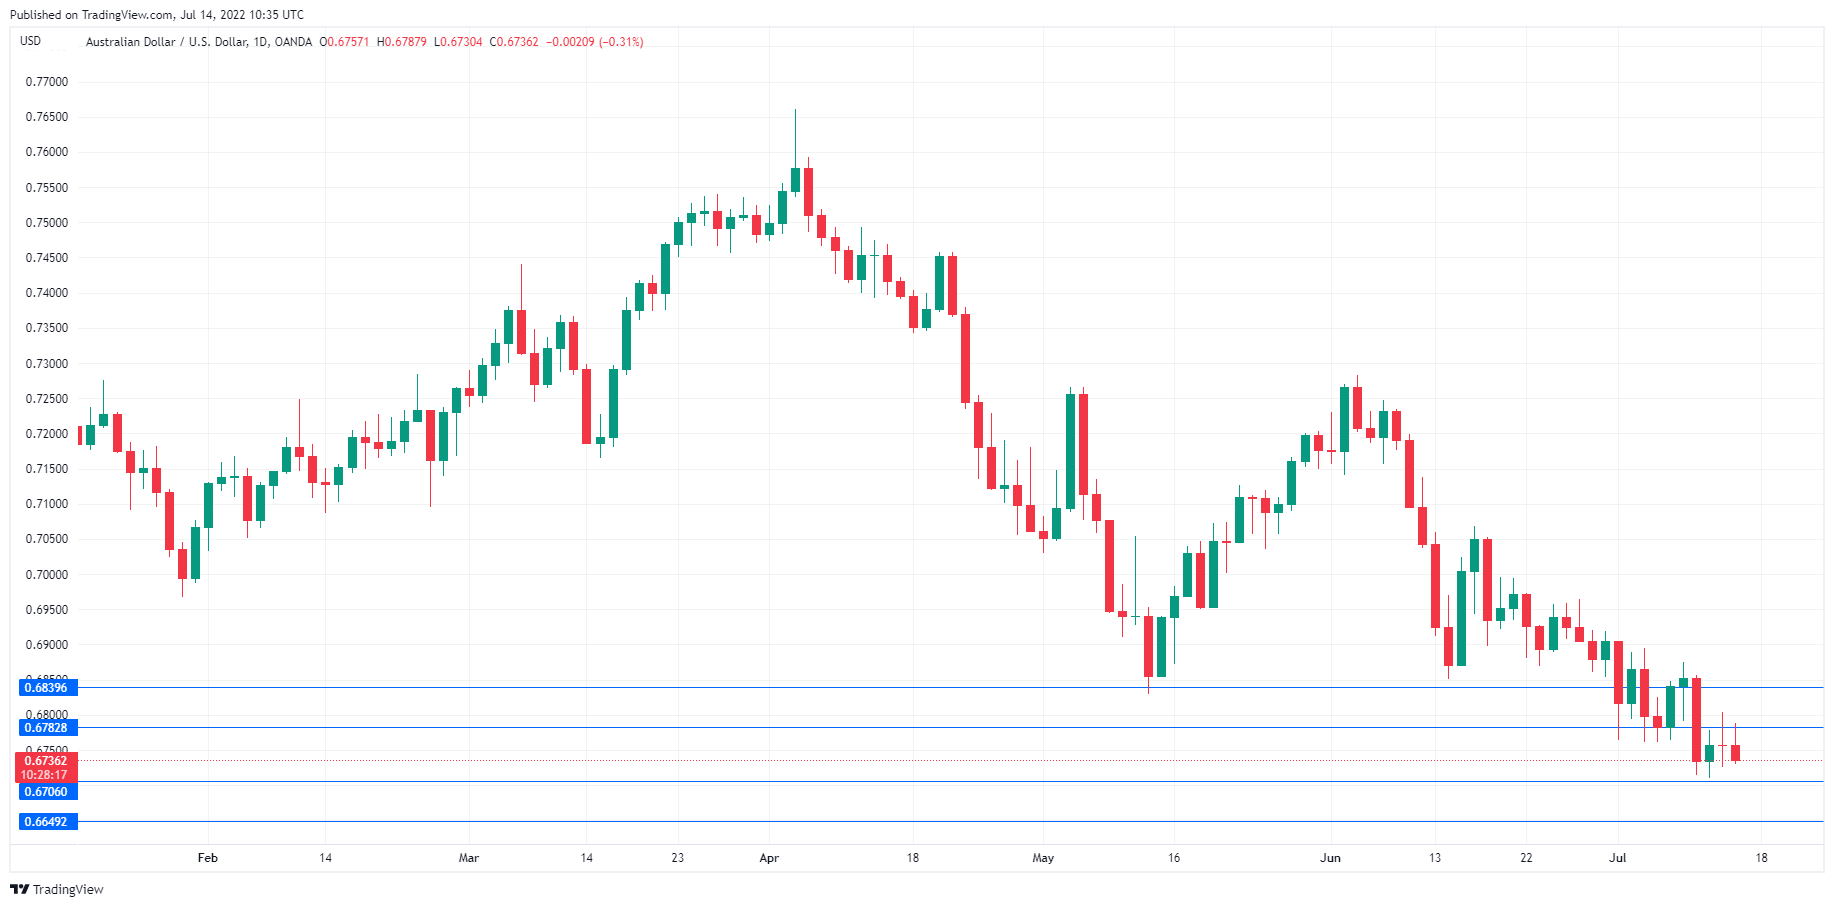
AUD/USD Technical
- There is resistance at 0.6782 and 0.6839
- 0.6706 is a weak support line, followed by 0.6649
Yen is Entering the Turbulence Territory
Yesterday’s US inflation data spurred market expectations that the Fed will raise rates by 100 points at the end of July, although about a month ago, Powell called a 75-point increase abnormal.
The revision in expectations for monetary policy of the US central bank again highlighted the contrast with Japanese monetary policy and triggered a new momentum of yen weakness.
The USDJPY is already up to 139.20 at the time of writing, the highest since September 1998. But even then, almost 24 years ago, it was a turbulence zone, where the pair spent less than three months, making a quick reversal in the backdrop of a flaring financial crisis in Russia. Even earlier, in 1990, the USDJPY spent about half a year above 140, but then the dip below was a recovery of the long-term downward trend.
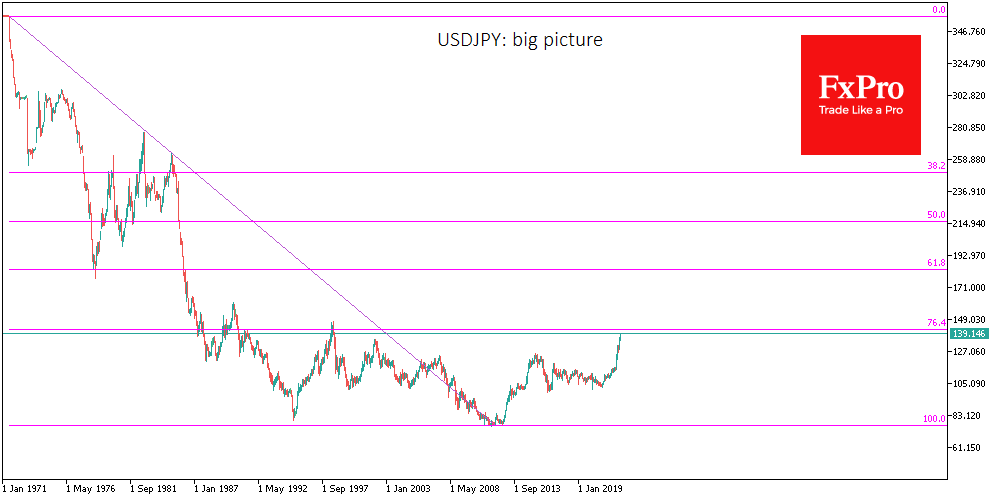
Either way, the 140 area in USDJPY looks like a potential area of turbulence where more volatility is expected. In previous weeks we have heard more verbal interventions from the Bank of Japan and the Ministry of Finance, as well as their joint statement (a rare event).
The new lows in the yen this week and its more than 1.4% fall since the start of the day on Thursday make it necessary to keep events around the Japanese currency on the periphery of attention so as not to miss a possible spike in volatility in one direction or the other.
The yen’s weakening is a legitimate market trend linked to interest rate differential dynamics. But the speculation that the BoJ will not change policy by moving to higher interest rates and that the Ministry of Finance will not be burning through foreign currency for interventions is now embedded in the quotations.
It is to be expected that the market will push the yen down until the Japanese authorities resort to real action rather than words. And the scale of the latter has to be sufficient. It might be an active intervention on the forex market, abandonment of Quantitative and Qualitative Easing, a combination of both, or a public refusal to defend the exchange rate.
Either way, the coming weeks and possibly months will bring increased volatility in the yen, which market participants should be prepared for.
EUR/USD: Rising Pressure on Euro Suggests that Final Break Below Parity is Near
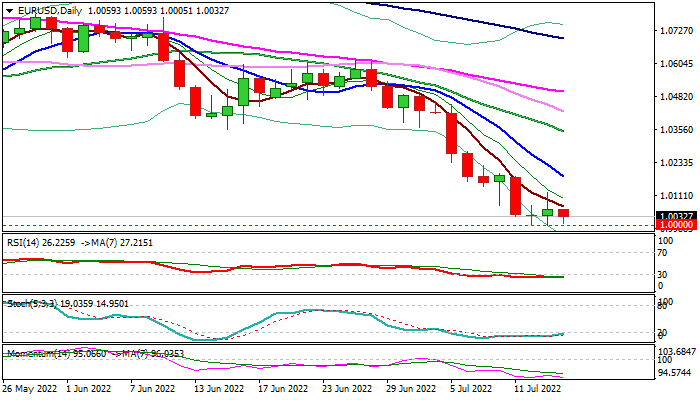
The Euro is hovering just above parity level for the third consecutive day, with this critical support being dented but bears were so far unable to break lower.
Limited upticks show that downside pressure is strong, though headwinds from parity manage to counter the pressure.
The single currency is at the lowest levels in two decades and overall picture is very negative, and its fate is mainly with the situation regarding the energy supplies.
The pair is down around 11% year-to-date and on track for further weakness in current economic and geopolitical conditions that may result in one of the biggest yearly drops in Euro’s history.
Higher than expected US inflation in June sparked speculations that the US Federal Reserve might act even more aggressively in its July policy meeting and opt for 1% rate hike, instead of widely expected 0.75% increase that additionally supports the dollar.
On the other side, the situation in European Union worsened further, according to the latest economic indicators, which signal that bloc’s economy is sliding into recession.
The core problem for the union is the energy supply and soaring prices of gas and oil that fuels inflation and the problem spills all over the economy.
The latest shut of gas supplies through Nordstream 1 pipeline, due to maintenance, undermined the Euro, with growing fears that shutdown may not be temporary, add to negative outlook, highlighting increased risk that the single currency may slump below parity and extend towards next target at 0.9607 (Sep 2002 low), with risk of deeper fall if the situation deteriorates on further rise of gas prices.
The European central bank is in difficult position, facing an important task to combat record-high inflation, which could worsen if the euro weakens further, but on the other side must be cautious as aggressive policy tightening could negatively affect the economic growth.
Res: 1.0070; 1.0121; 1.0180; 1.0221.
Sup: 1.0000; 0.9944; 0.9859; 0.9607.
Bitcoin’s Sudden Resilience to Inflation
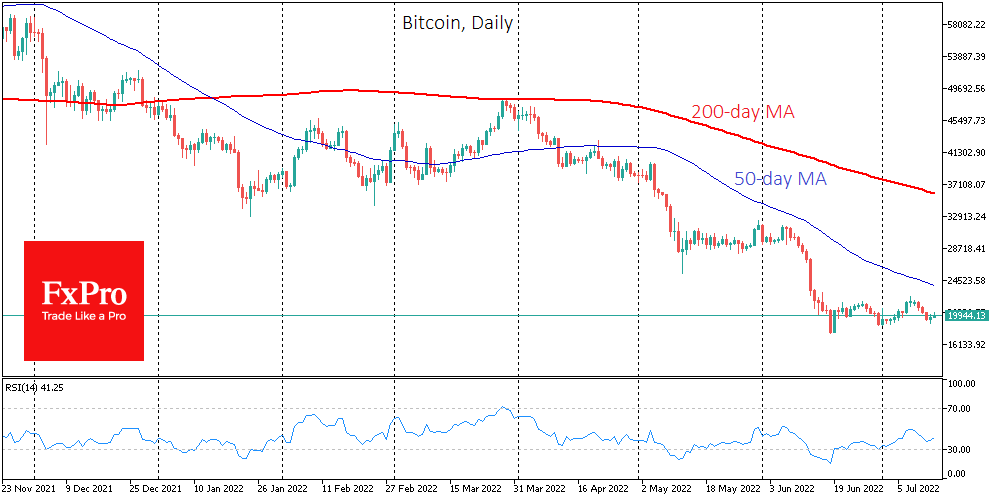
Bitcoin rose 1.1% on Wednesday, ending the day around $19.7K, and was back above $20K on Thursday morning. Ethereum has added 4.3% to $1100 in the past 24 hours. Top altcoins are adding from a modest 0.1% (Dogecoin) to a more notable 3.7% (Solana).
Total crypto market capitalisation, according to ConMarketCap, rose 2.6% overnight to $896bn.
US inflation data came out stronger than expected yesterday, which triggered an impulsive wave of dollar appreciation and a sell-off in risky assets, sending Bitcoin briefly below $19K. However, it is essential to note that the first cryptocurrency found buyers quite quickly on the decline to these levels and has already more than recovered its losses. This is a notable moment, as crypto has often taken on the role of a leading indicator of market sentiment in recent months.
According to KuCoin, cryptocurrencies are popular in Saudi Arabia, with around 3 million residents investing in digital assets.
Bitcoin may continue to fall but will hit another all-time high in the next 24 months, according to CoinShares. At the same time, the rate is not expected to fall below $14,000.
The US Treasury Department has sought public comment on digital assets’ potential benefits and risks. According to President Biden’s executive order, the Treasury is to study the impact of cryptocurrencies on the financial system, economic growth, and national security.
The Bank for International Settlements (BIS) has called for central banks to create “bridges” between the various national digital currencies (CBDC) that would allow tokens to interact with each other.
AUDUSD Wobbles Near 2-year Low
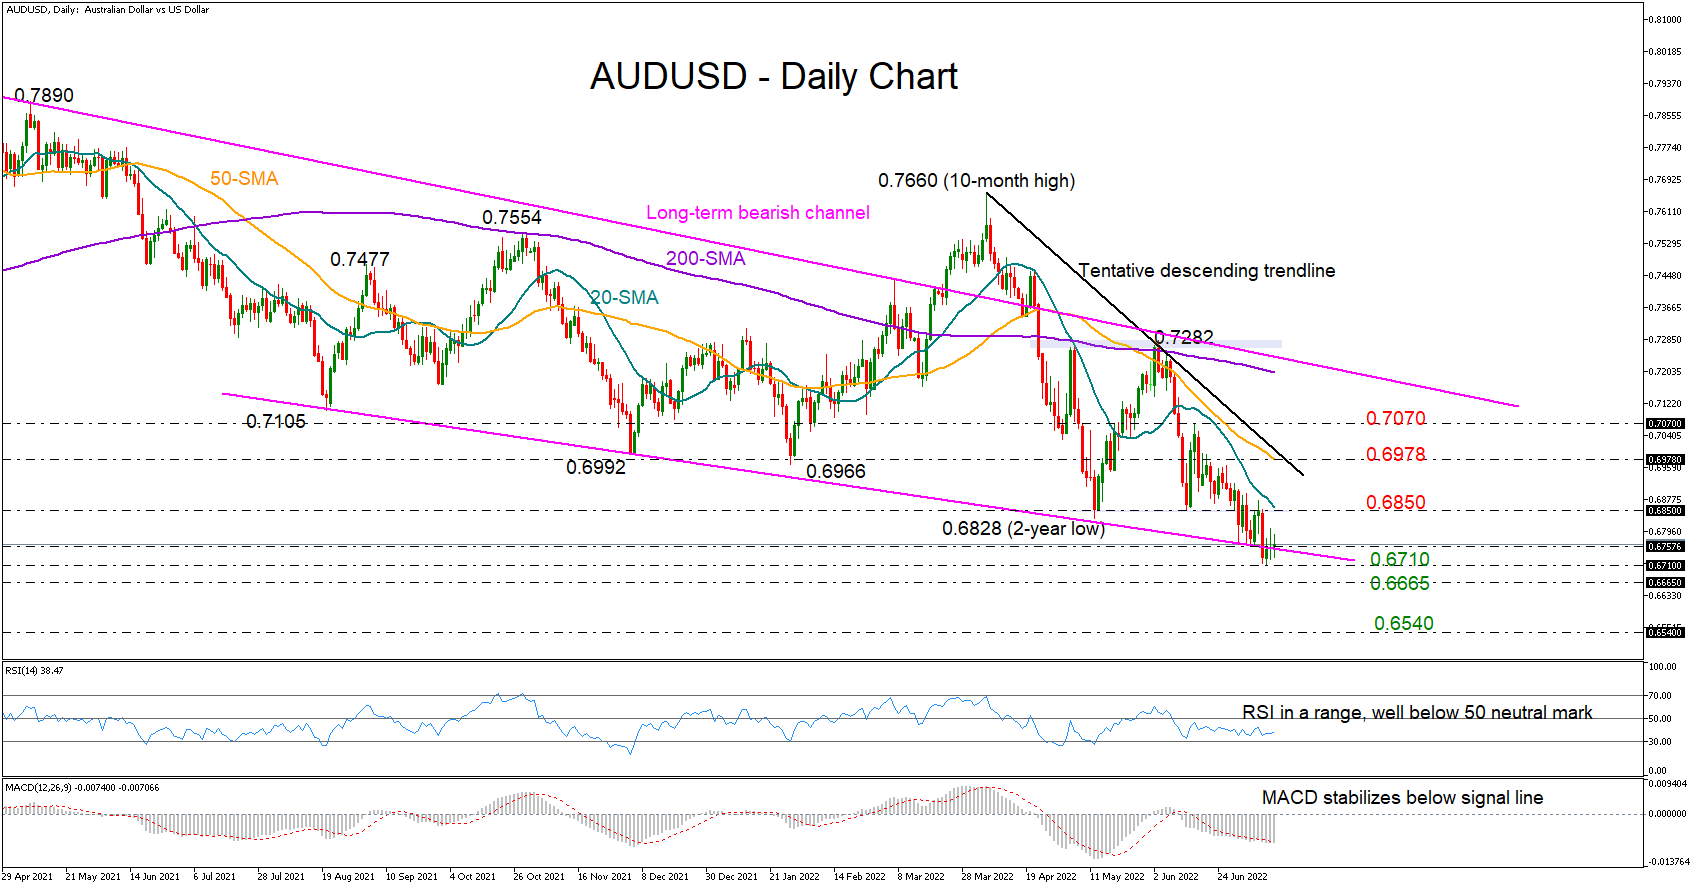
AUDUSD hovered quietly near Wednesday’s closing price of 0.6757 during Thursday’s early European trading hours after negligibly rotating at the two-year low of 0.6710.
The penetrated support line drawn from the August 2021 low of 0.7105 is now acting as resistance around the same region, preventing any increases towards the 20-day simple moving average (SMA) at 0.6850. Even higher, the tentative descending trendline and the 50-day SMA around 0.6978 may also defend the negative trend in the market ahead of the 0.7070 high from June 16.
The technical oscillators are not displaying any bullish appetite either. The RSI keeps moving halfway below its 50 neutral mark while maintaining a flat trajectory, and the MACD is also consolidating its latest bearish wave marginally beneath its red signal line.
If the price retreats below the recent low of 0.6710, the 0.6665 zone, which was a key constraining zone during the August 2019 – May 2020 period, could immediately halt the decline. In case it gives way though, the focus will turn to the 0.6540 territory taken from spring 2020. This is also where the 161.8% Fibonacci extension of the 0.6828 – 0.7282 upleg resides. Another violation at this point could see a continuation towards the 0.6400 handle last seen in May 2020.
In brief, the short-term outlook for AUDUSD is still looking gloomy despite the latest pause in the sell-off. The 0.6710 – 0.6665 territory is now the next test for the bears, while the bulls will need to push harder to raise buying confidence above 0.6978.
Overall, the more than a year negative trend is still well-established below 0.7282.
USD/JPY: Fresh Speculations that Fed May Opt for 1% Rate Hike Lift Dollar
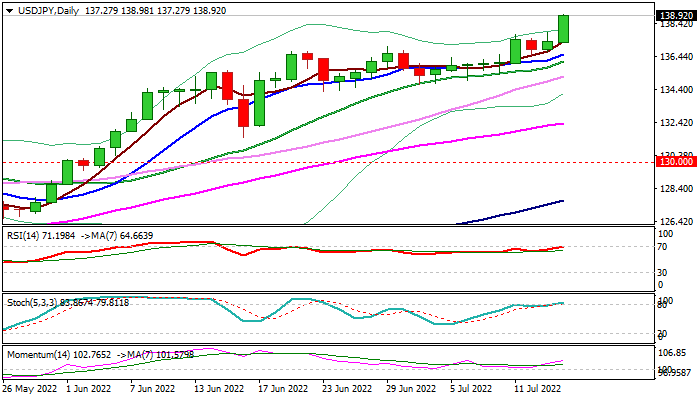
The USDJPY accelerated higher in Asia/early Europe on Thursday, gaining over 1% and hitting new 24-year high, lifted by expectations for another big rate hike by Fed, as well as increased safe-haven demand on growing fears of a recession.
Stronger than expected US inflation figures for June, released on Wednesday, showed inflation hit new highest level in four decades and added to bets for another big hike from the Fed.
Wide expectations for another 0.75% hike in July policy meeting later this month, have been boosted by fresh speculations that the US central bank may opt for even more aggressive approach and raise interest rate by 1%, as skyrocketing inflation is likely to rise further and harm the economy more.
Bullish technical studies on daily chart add to positive outlook, with bulls looking for a break of round-figure 139.00 barrier that would open way towards targets at 139.92/140.00 (Sep 1998 high/psychological).
Headwinds on approach to these levels can be expected as studies are overbought, with dips to offer better buying opportunities. Rising 10/20DMA’s offer solid supports (currently at 136.52/136.10) which should keep the downside protected.
Res: 139.26; 139.92; 140.00; 141.00.
Sup: 138.02; 137.75; 137.27; 136.52.
Daily Technical Analysis
EUR/USD
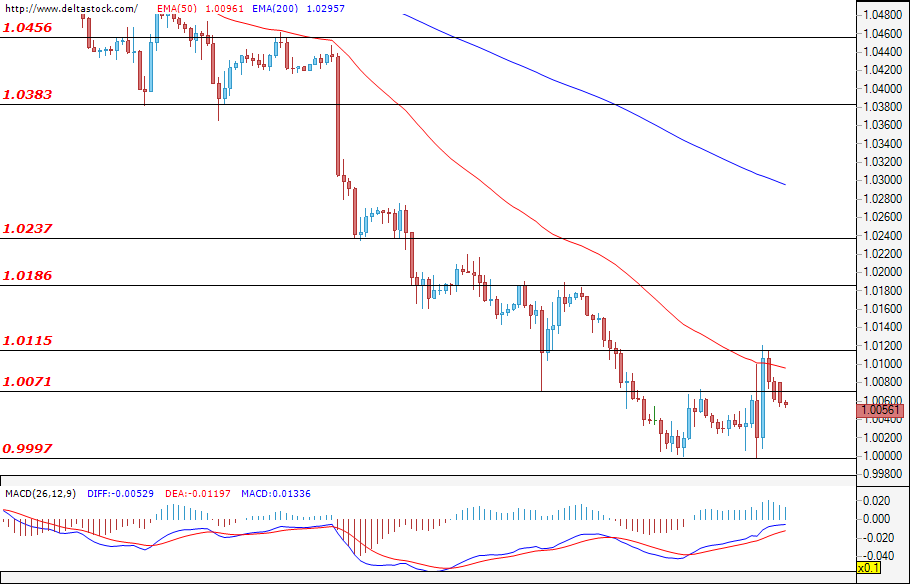
On Wednesday, the day started calmly with low volumes and low volatility even around the opening of the European session. Everyone was looking forward to the June 2022 US inflation data which came out at 13:30 GMT. The macroeconomic calendar showed a sharp rise in inflation by as much as 9.1% compared to June last year, and the reaction did not wait. For the first time in 20 years, for a short time, the single European currency managed to become cheaper than the dollar. However, there the bulls found good prices to buy and we saw that the psychological level at border 1.00 was able to support the euro and it gained price and went up by 120 pips against the greenback. The downward pressure is huge and the probability is high that we will see a cheaper euro than the dollar for a longer period of time. Of course surprises today around the US manufacturing inflation data at 123:30 GMT are not out of the question and a higher correction should not be ruled out.
USD/JPY
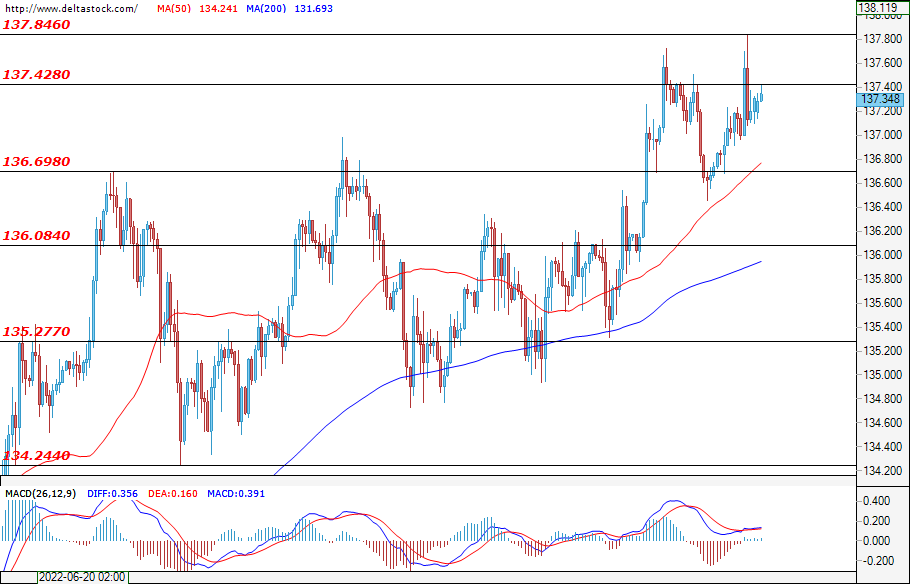
The trend in the Ninja is undeniable and already in the early hours of the day on Wednesday we saw a buyout of the previous correction and an uptrend again. There was no shortage of speculation around the US CPI data, and after reaching a new monthly high of 137.84, we saw a sharp and deep correction, which, however, was again bought by the bulls in the stock market. The market was able to finish the day around the levels 137.34. Today, however, eyes are on the US Manufacturing Inflation data and the expected reaction remains to be seen at 123:30 GMT. The probability of the trend continuing is still high, but deep corrections like the one on Tuesday this week should not be ruled out.
GBP/USD
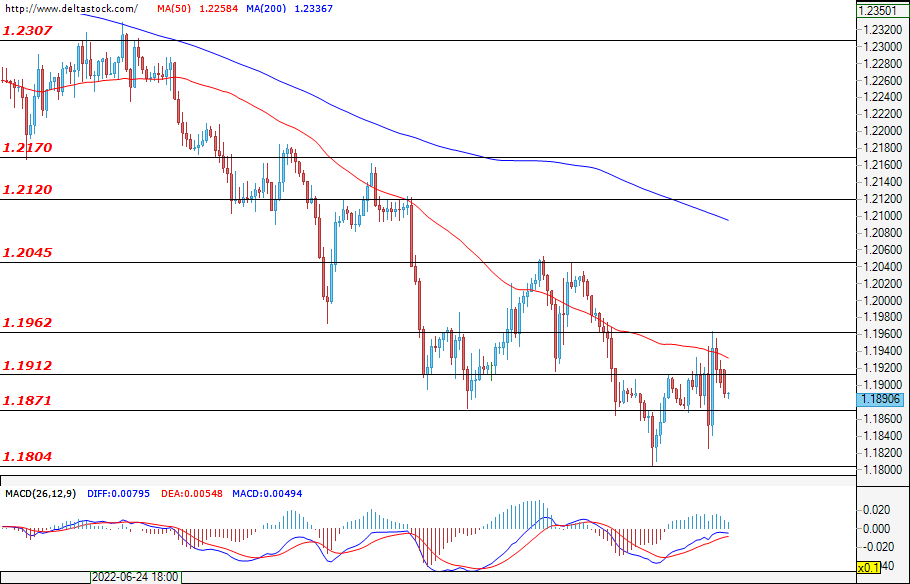
Sterling was not much different from the euro due to the dollar's strength on Wednesday. The day started with low volatility without big swing movements. After the sharp jump in the dollar due to the CPI data from the US, we saw a corresponding drop in the pound, but it failed to reach or break its weekly bottom and the bulls found good prices and managed to push the day to 1.1965. This key level played the role of resistance and Sterling ended the day around 1.1890. Today we will be watching for trader reaction around the US manufacturing inflation data due at 123:30 GMT. A jump in the dollar again is not out of the question, but if we see a negative reaction, the pound could also bounce back in a stronger correction.
EUGERMANY40
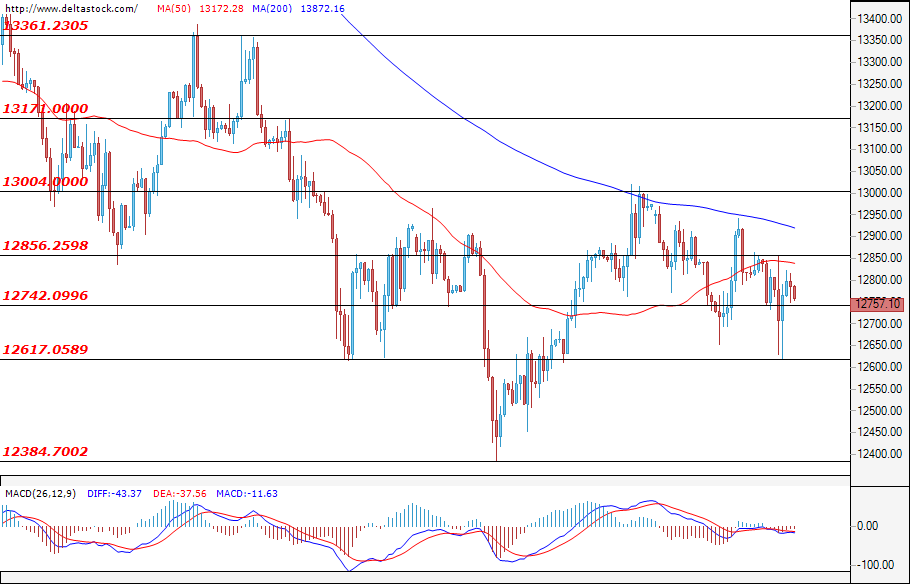
In the early hours of the day, the German index moved calmly, but around the release of the German CPI data at 7:00 GMT we saw a negative reaction and a drop to 12740. There, the bulls briefly launched an attack, but after the strengthening of the dollar around the US CPI data at 13:30 GMT, the negative reaction did not wait and EUGERMANY40 crashed to 12617. However, volatility remained high, a second attack by the bulls, but it failed to hold and the day ended around 12757. Today we will see inflation on wholesale sales in Germany and we can expect a reaction, but mainly eyes will be on PPI data from the US at 15:30 GMT. The probability that the decline will continue is high, but of course a correction and high swings should not be ruled out.
US30
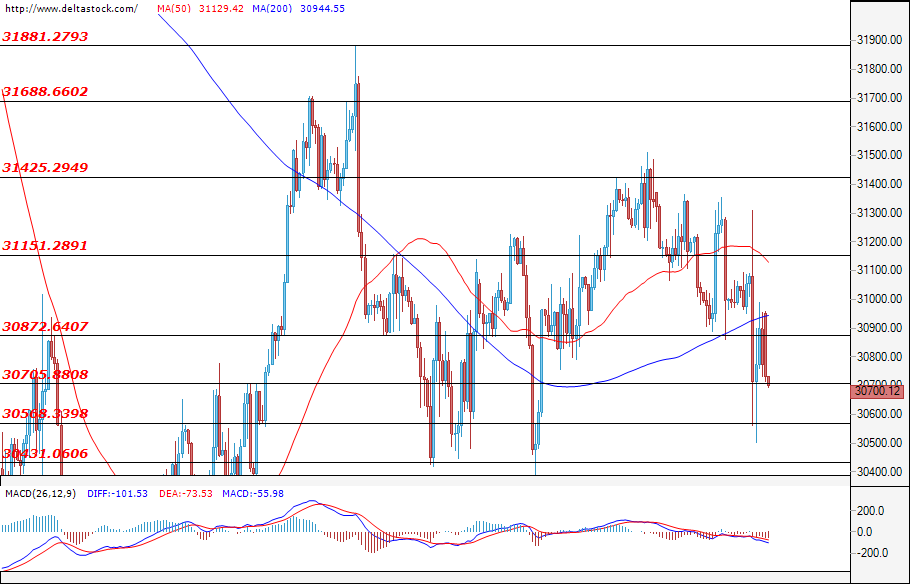
Trading in the blue chip index on Wednesday was quite thin as the European stock market opened. The huge swings, both up and down, came in the first minutes after the release of the 9.1% rise in US inflation. Traders' panic seemed to continue and the US30 hit a new weekly low of 30500, a key level that the bulls used for another attack, but gave up on prices around 31000. The moves failed to hold and the day ended around 30730. The index is directly related to production and today's US manufacturing inflation data at 13:30 GMT is expected to have a very large effect. Volatility has been high recently, wide-ranging ranges are occurring, and the future of the index depends on the reaction to today's information.
GBP/JPY Daily Outlook
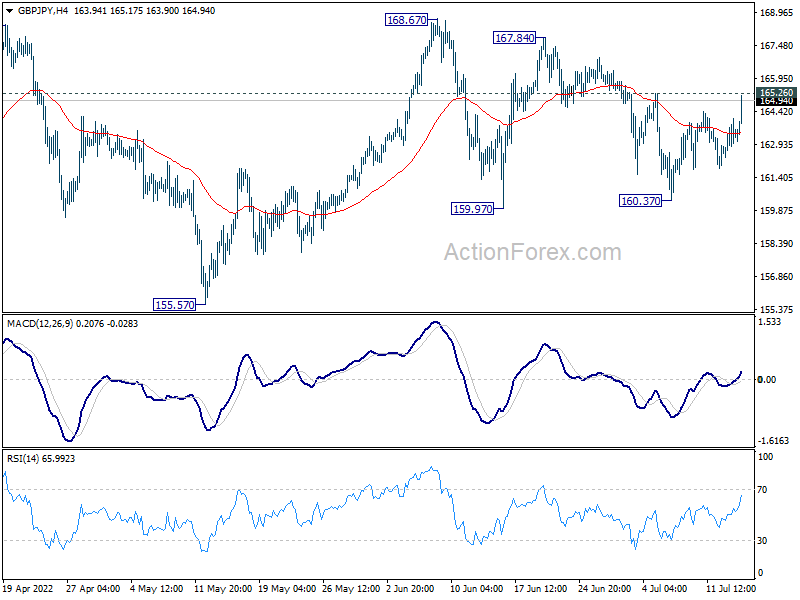
Daily Pivots: (S1) 162.47; (P) 163.30; (R1) 164.23; More...
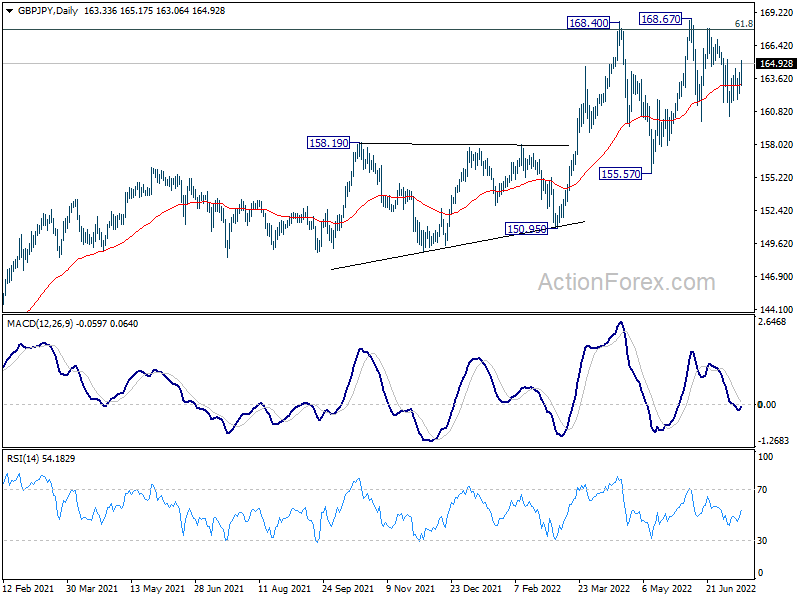
Intraday bias in GBP/JPY remains neutral first. On the upside, firm break of 165.26 minor resistance will argue that corrective pattern from 168.67 has completed. Further rise should be seen to retest 168.67 high next. On the downside, break of 160.37 will bring deeper fall back towards 155.57 support.
In the bigger picture, up trend from 123.94 (2020 low) is still in progress. Sustained break of 61.8% retracement of 195.86 (2015 high) to 122.75 (2016 low) at 167.93 will be a long term bullish signal, and could pave the way back to 195.86 high. This will now remain the favored case as long as 155.57 support holds, even in case of deep pull back.
EUR/JPY Daily Outlook
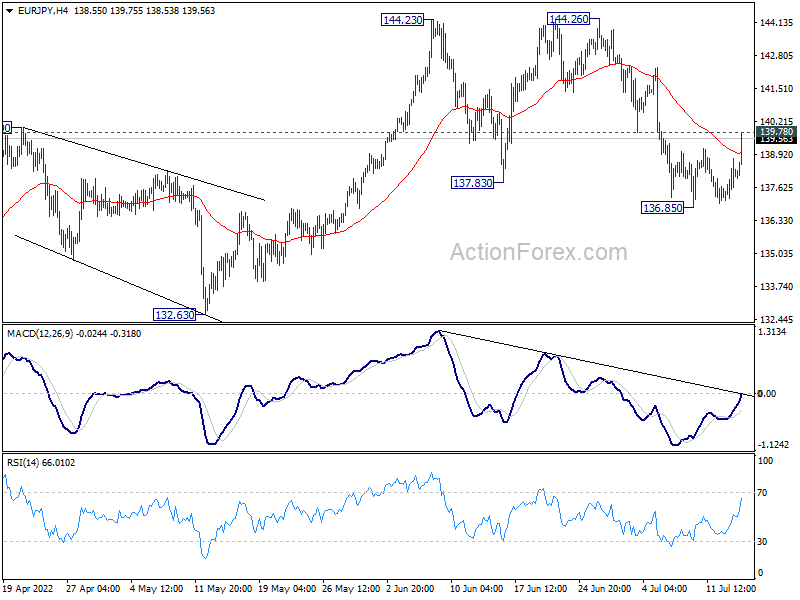
Daily Pivots: (S1) 137.30; (P) 138.05; (R1) 138.97; More....
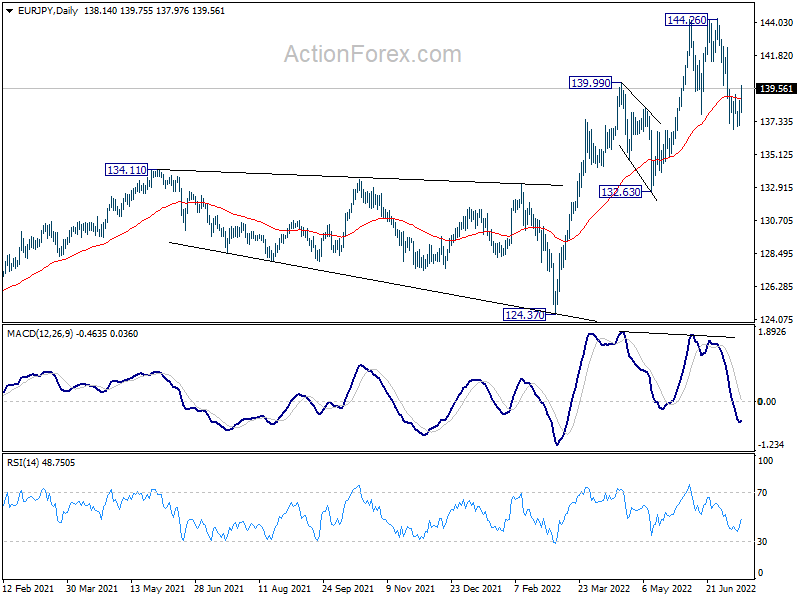
Intraday bias in EUR/JPY stays neutral first. On the upside, firm break of 139.78 minor resistance will argue that pull back from 144.26 has completed at 136.85. Further rally would be seen back to retest 144.26 high. On the downside, though, below 136.85 will resume the fall back to 132.63 support.
In the bigger picture, up trend from 114.42 (2020 low) is seen as the third leg of the pattern from 109.30 (2016 low). Further rally is in favor as long as 134.11 resistance turned support holds, even in case of deep pull back. Firm break of 139.78 will target 149.76 (2015 high. However, sustained break of 134.11 will be a sign of medium term bearish reversal and turn focus to 124.37 support for confirmation.