

Sample Category Title
AUD/USD: Global Correction b Likely to Complete Near 0.645
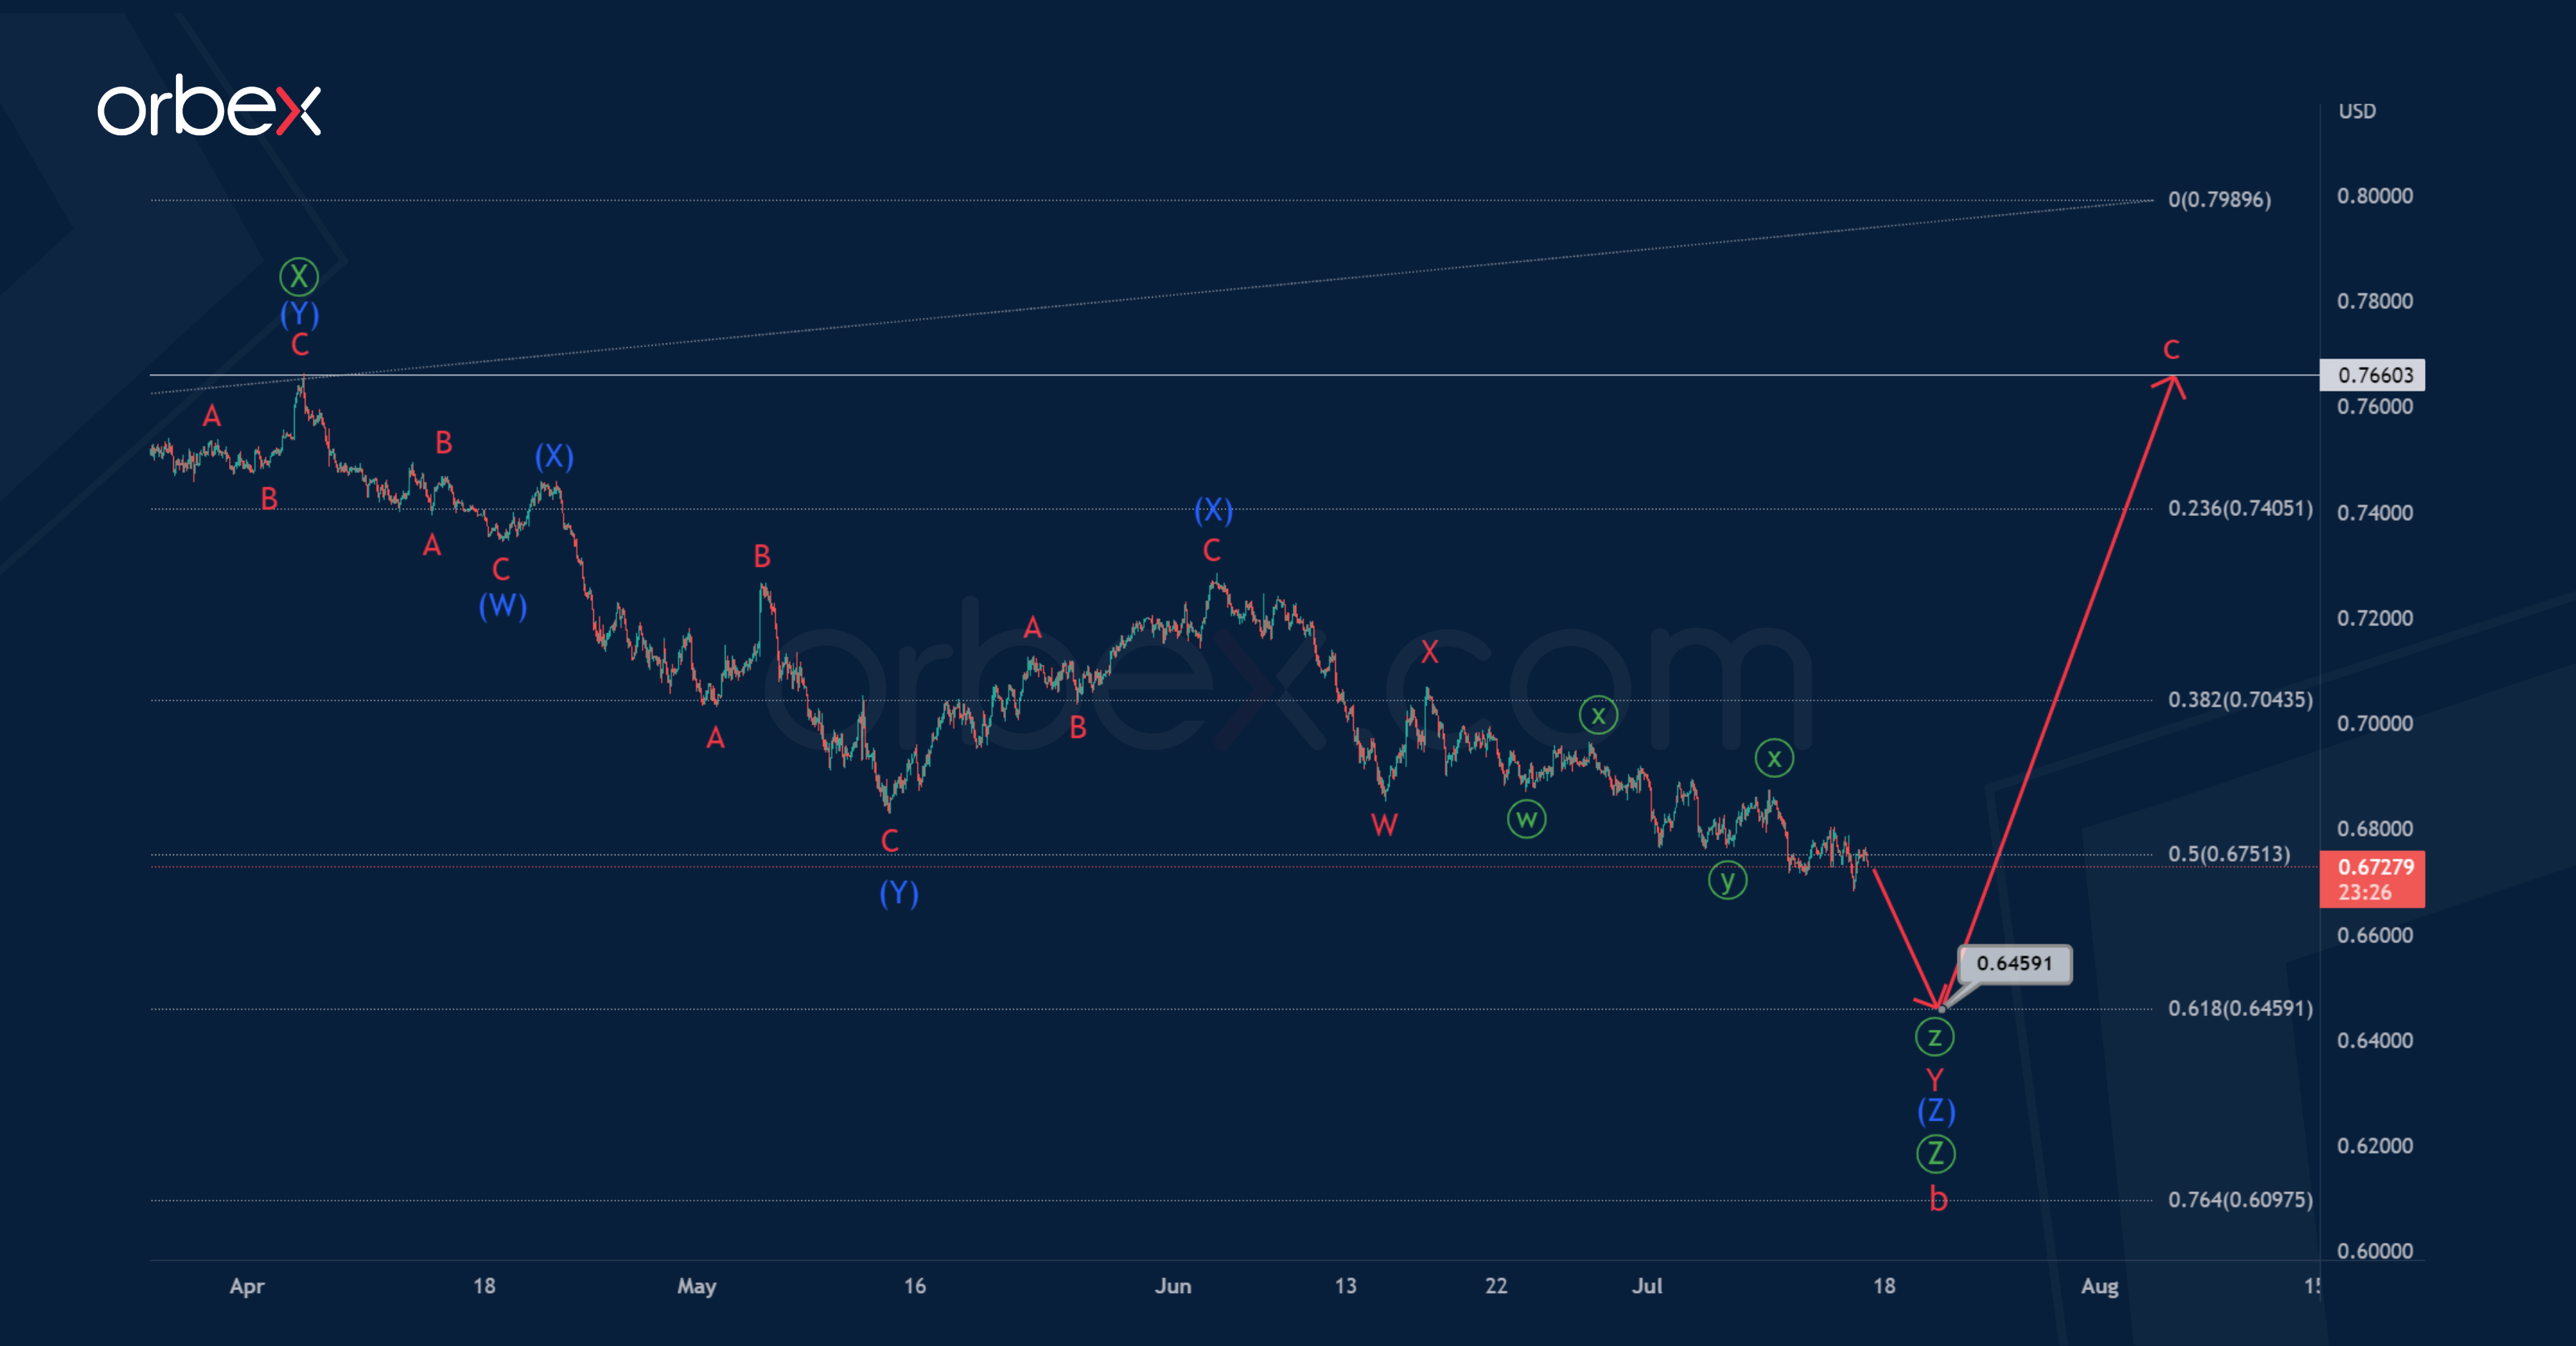
The current structure of the AUDUSD pair suggests the formation of a zigzag a-b-c, which currently includes a bearish correction b. Wave b consists of primary sub-waves Ⓦ-Ⓧ-Ⓨ-Ⓧ-Ⓩ.
The last section of the chart shows the structure of the last primary wave Ⓩ. It seems to be an intermediate triple zigzag (W)-(X)-(Y)-(X)-(Z). To complete this pattern, the final actionary wave (Z) is needed. It seems that the wave (Z) will take the form of a minor double zigzag W-X-Y and may end near 0.645.
At that level, cycle correction b will be at 61.8% along the Fibonacci lines of cycle impulse wave a.
Now let's consider an alternative scenario.
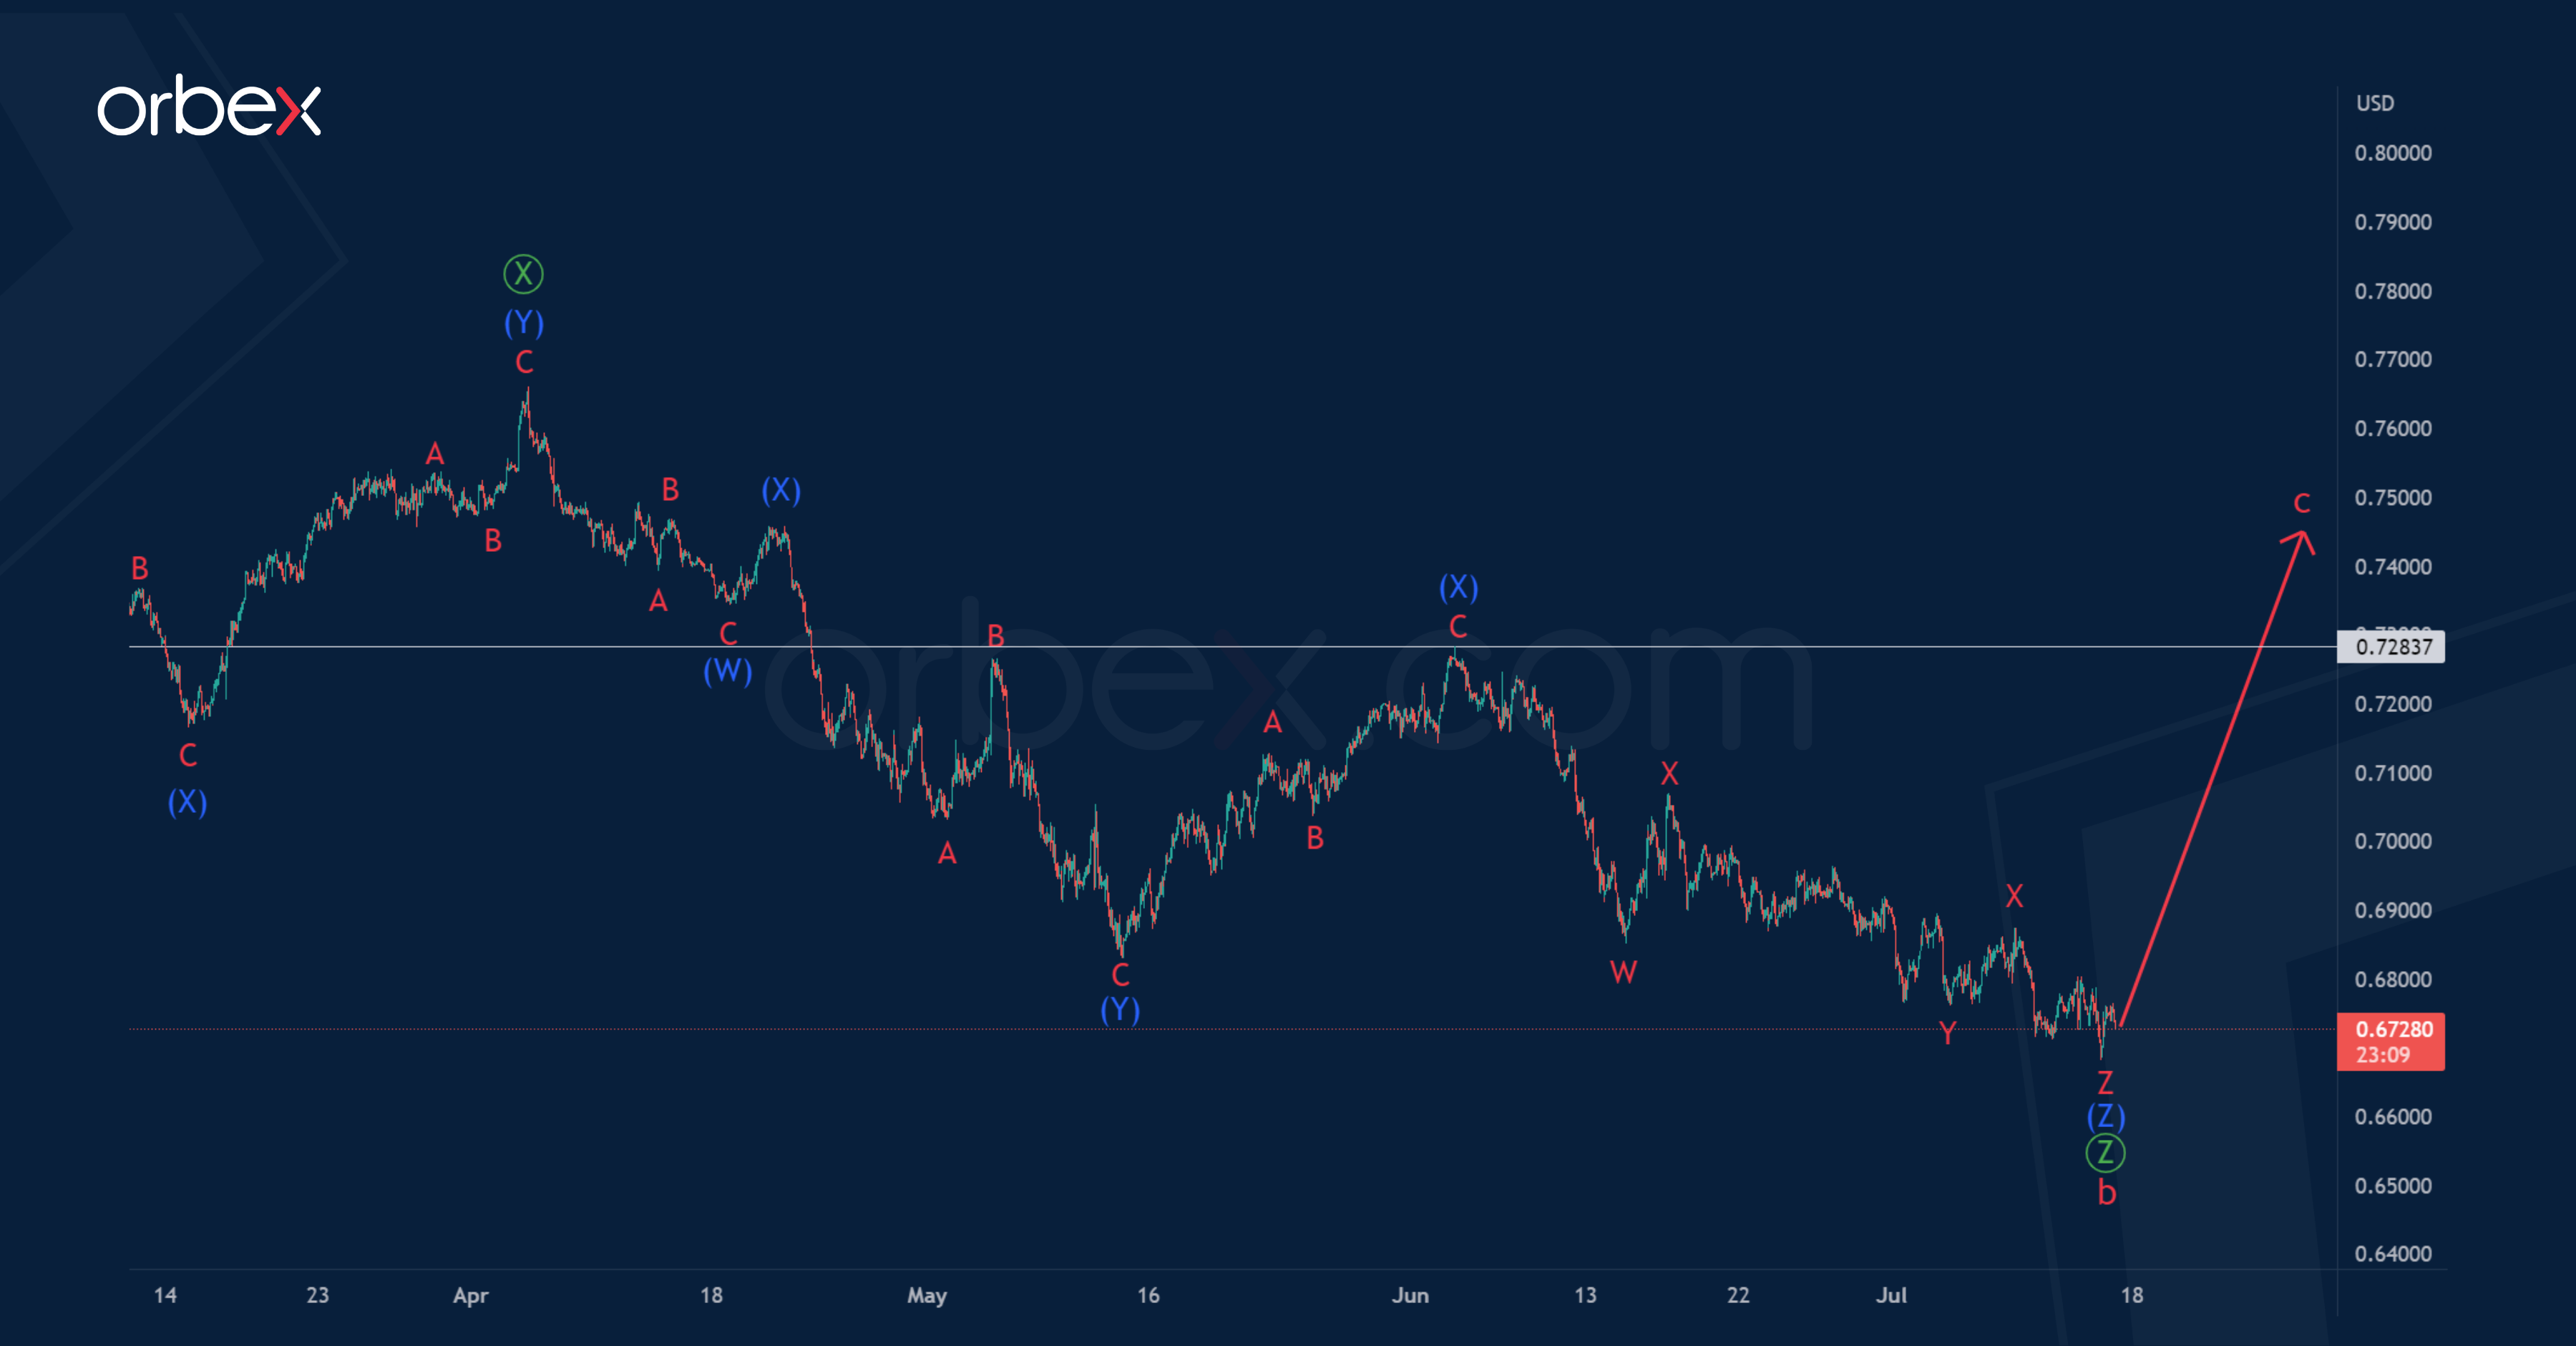
According to this view, the bearish wave Ⓩ of the primary degree, which is part of the cycle correction b, can be fully completed.
The primary wave Ⓩ is a completed triple zigzag (W)-(X)-(Y)-(X)-(Z) of the intermediate degree. Perhaps the market has already turned around and started building the initial part of a new cycle wave c, which can take the form of an impulse, or an ending diagonal.
It is assumed that in the next coming trading weeks, the currency pair may move in an upward direction above the maximum of 0.728, marked by an intermediate reactionary wave (X).
USD/CAD Daily Outlook
Daily Pivots: (S1) 1.2981; (P) 1.3102; (R1) 1.3238; More...
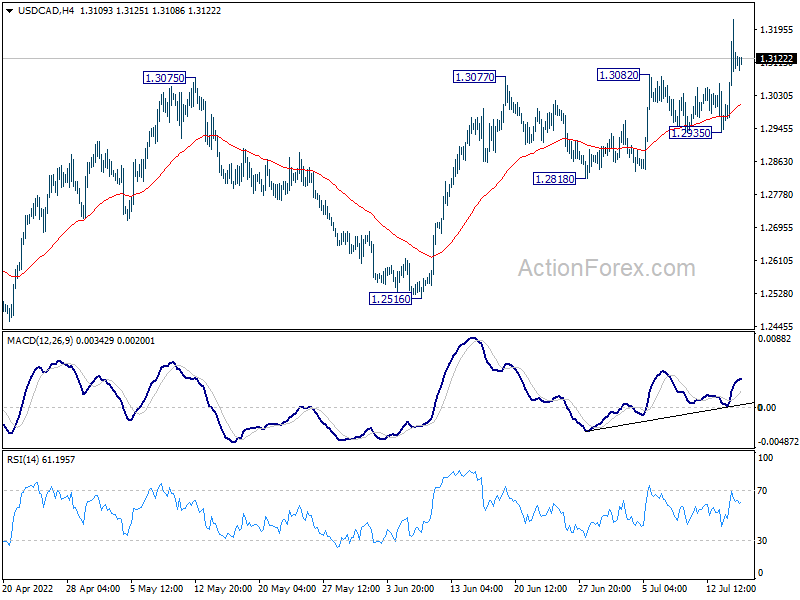
Intraday bias in USD/CAD remains on the upside at this point. Current up trend should target 100% projection of 1.2005 to 1.2947 from 1.2401 at 1.3343. For now, outlook will stay bullish as long as 1.2935 support intact, in case of retreat.
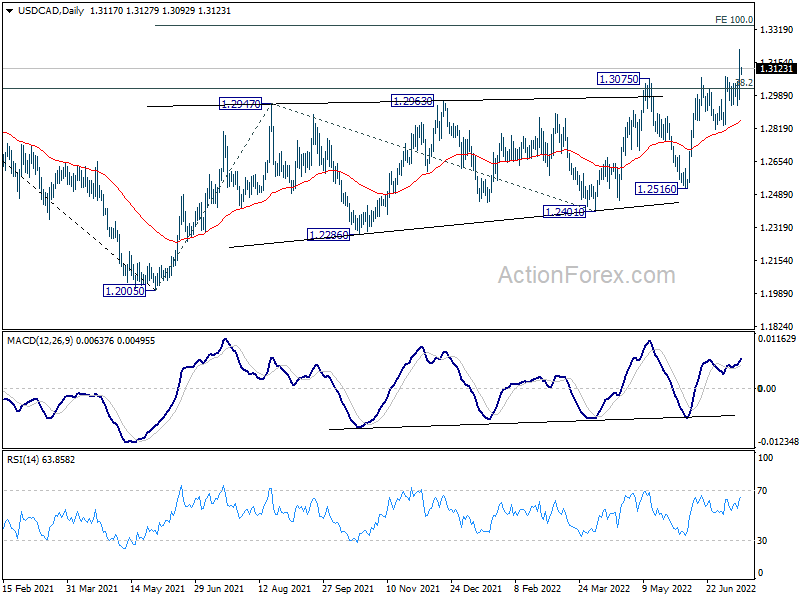
In the bigger picture, the firm break of 38.2% retracement of 1.4667 (2020 high) to 1.2005 (2021 low) at 1.3022 should confirm that down trend from 1.4667 has completed after defending 1.2061 long term cluster support. Further rise should be seen to 61.8% retracement at 1.3650 next. This will now remain the favored case as long as 1.2516 support holds.
AUD/USD Daily Report
Daily Pivots: (S1) 0.6691; (P) 0.6739; (R1) 0.6797; More...
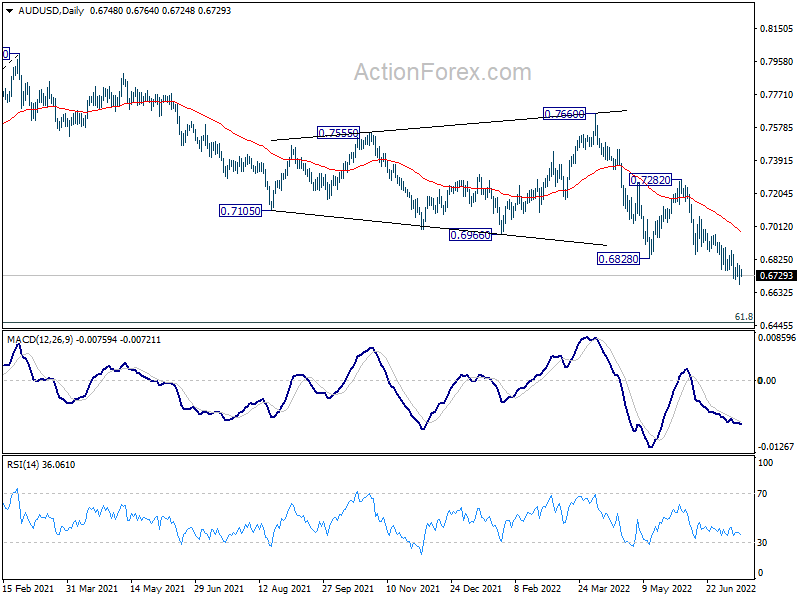
Further decline is expected in AUD/USD with 0.6873 resistance intact. Current down trend from 0.8006 should target next fibonacci level at 0.6461. On the upside, break of 0.6873 minor resistance will turn bias back to the upside for stronger rebound instead.
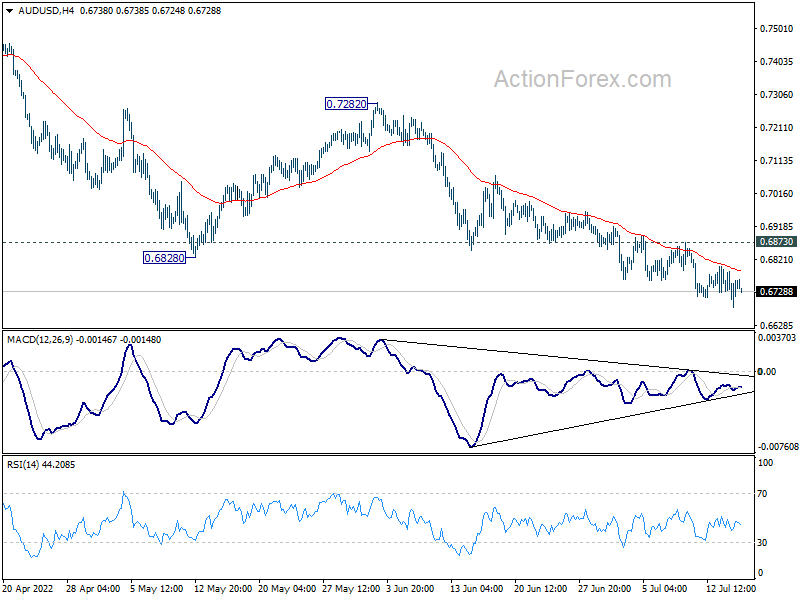
In the bigger picture, price actions from 0.8006 could still be a corrective pattern to rise from 0.5506 (2020 low). But current downside acceleration is raising the chance that it's a bearish impulsive move. In either case, outlook will remain bearish as long as 0.7282 resistance holds. Next target is 61.8% retracement of 0.5506 to 0.8006 at 0.6461.
USD/JPY Daily Outlook
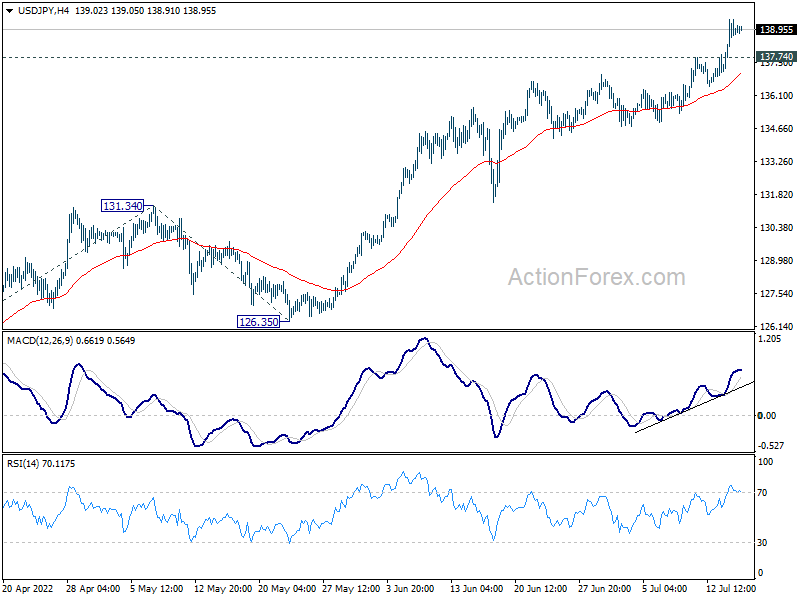
Daily Pivots: (S1) 137.70; (P) 138.54; (R1) 139.81; More...
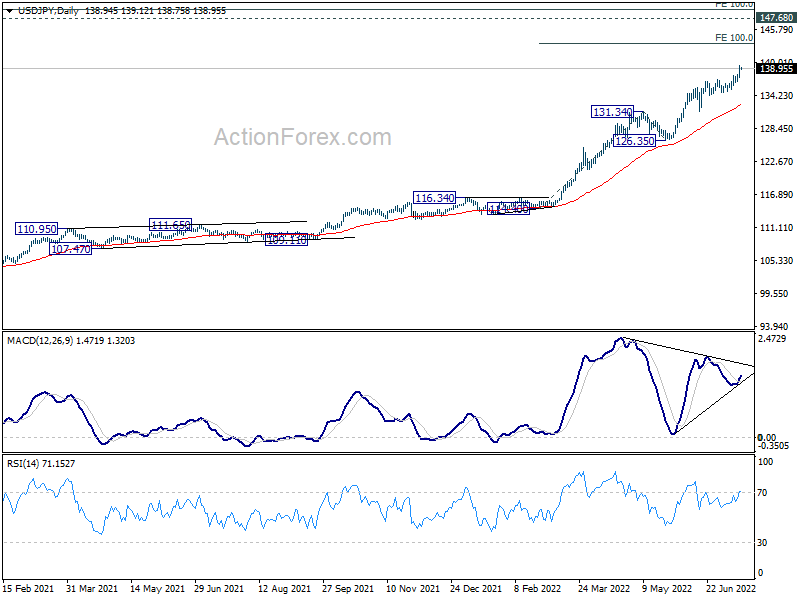
Intraday bias in USD/JPY stays on the upside at this point. Current up trend should target 100% projection of 114.40 to 131.34 from 126.35 at 143.29. On the downside, below 137.74 minor support will turn intraday bias neutral and bring consolidations first, before staging another rally.
In the bigger picture, current rally is seen as part of the long term up trend from 75.56 (2011 low). Next target is 100% projection of 75.56 (2011 low) to 125.85 (2015 high) from 98.97 at 149.26, which is close to 147.68 (1998 high). This will remain the favored case as long as 126.35 support holds.
USD/CHF Daily Outlook
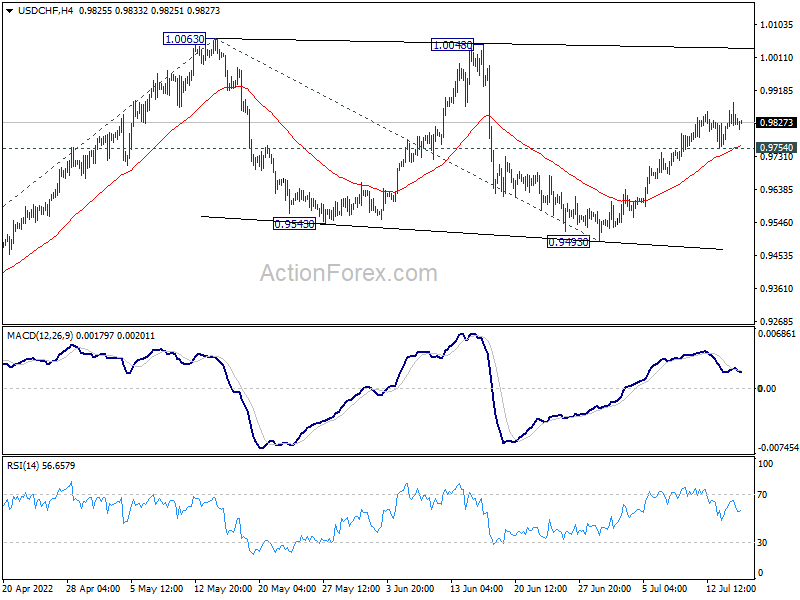
Daily Pivots: (S1) 0.9783; (P) 0.9834; (R1) 0.9891; More...
Further rise is expected in USD/CHF as long as 0.9754 minor support holds. Rise from 0.9493 should target 1.0063 high. Decisive break there will resume larger up trend. On the downside, break of 0.9754 will dampen the bullish view and turn bias neutral again first.
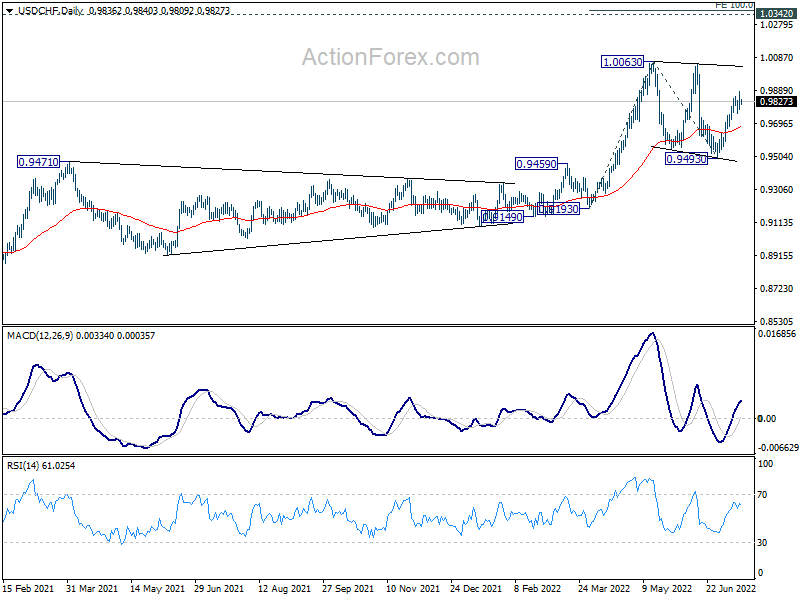
In the bigger picture, medium term up trend from 0.8756 (2021 low) is still in progress. Next target is 1.0342 (2016 high). Sustained break there will resume long term up trend from 0.7065 (2011 low). This will remain the favored case as long as 0.9471 resistance turned support holds.
GBP/USD Daily Outlook
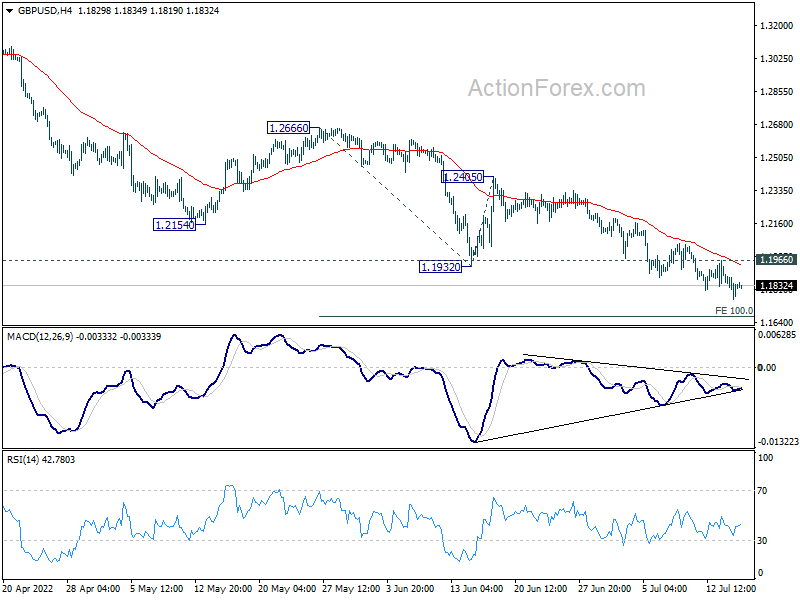
Daily Pivots: (S1) 1.1759; (P) 1.1828; (R1) 1.1828; More...
Intraday bias in GBP/USD stays on the downside at this point. Current down trend is in progress for 100% projection of 1.2666 to 1.1932 from 1.2405 at 1.1671. Decisive break there will target a test on 1.1409 long term support. On the upside, above 1.1966 minor resistance will turn intraday bias to the upside for stronger rebound.
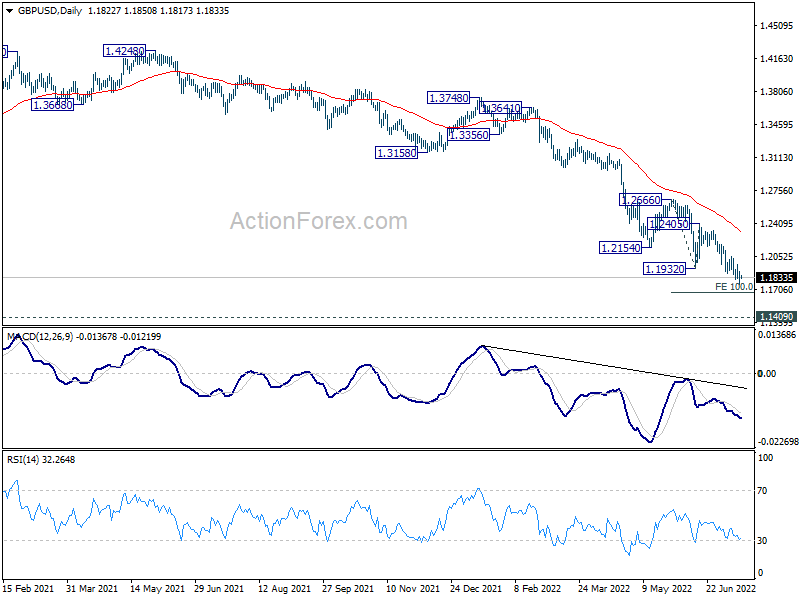
In the bigger picture, fall from 1.4248 (2018 high) could be a leg inside the pattern from 1.1409 (2020 low), or resuming the longer term down trend. Deeper decline is expected as long as 1.2666 resistance holds. Next target is 1.1409 low. However, firm break of 1.2666 will bring stronger rise back to 55 week EMA (now at 1.3065).
EUR/USD Daily Outlook
Daily Pivots: (S1) 0.9960; (P) 1.0013; (R1) 1.0074; More...
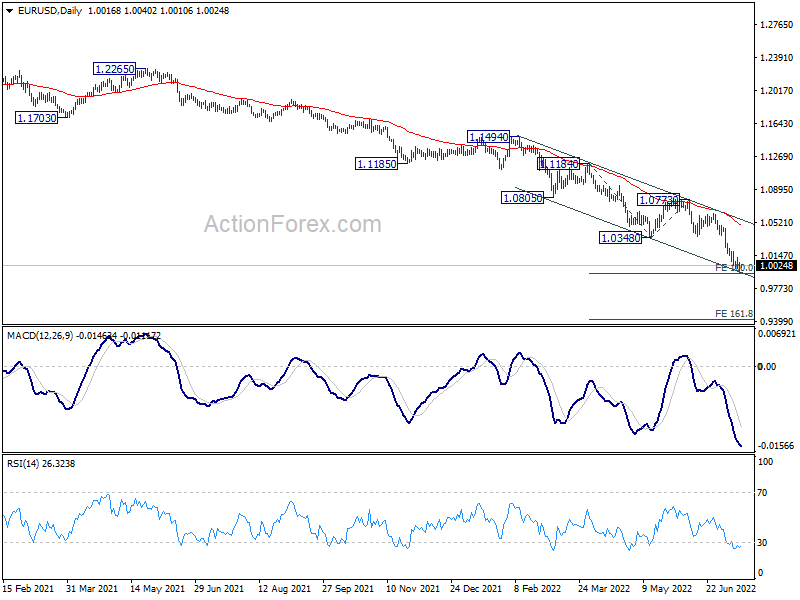
EUR/USD continues to lose downside momentum as seen in 4 hour MACD. But further decline is still expected with 1.0121 minor resistance intact. Sustained break of 100% projection of 1.1184 to 1.0348 from 1.0773 at 0.9937 could prompt downside acceleration to 161.8% projection at 0.9420. Nevertheless, break of 1.0121 will indicate short term bottoming, and turn bias back to the upside for rebound, towards 1.0348 support turned resistance.
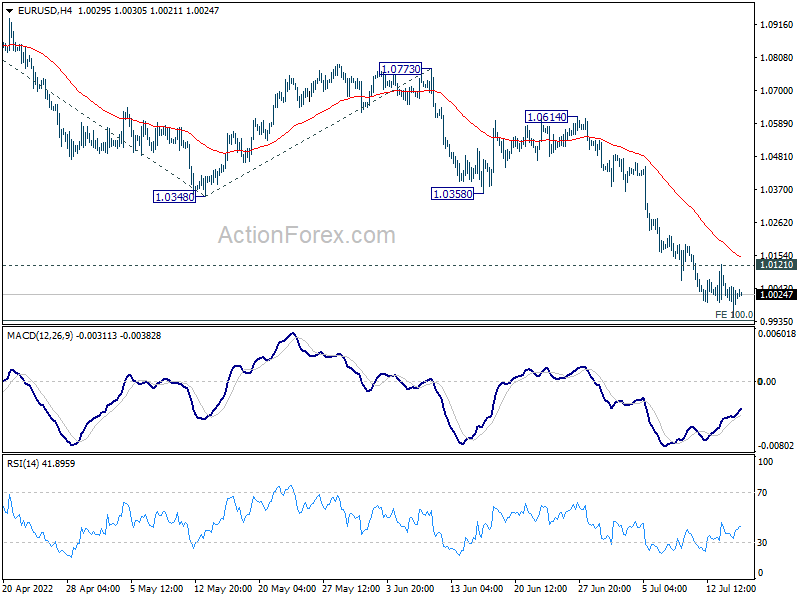
In the bigger picture, down trend from 1.6039 (2008 high) is still in progress. Next target is 100% projection of 1.3993 to 1.0339 from 1.2348 at 0.8694. In any case, outlook will stay bearish as long as 1.0773 resistance holds, in case of rebound.
Gold Breached 1700, EUR/USD Still Defending Parity
Dollar is staying is the strongest one for the week, as talks of a 100bps hike at the July FOMC meeting heat up. But upside momentum in the greenback hasn't been really too convincing, except versus Yen. EUR/USD is still trying hard to defend parity for now. Yen, on the other hand, is staying broadly pressured on expectation of divergence in BoJ's policy to other peers. Commodity currencies are mixed, with Aussie slightly weaker.
Technically, a major focus remains on whether EUR/USD could eventually defend parity. We'd maintain that the level is 100% projection of 1.1184 to 1.0348 from 1.0773 at 0.9937. As long as this projection level holds, there is still prospect of a near term rebound. However, sustained break there could prompt further downside acceleration to 161.8% projection at 0.9420. This should be decided in the next few days.
In Asia, at the time of writing, Nikkei is up 0.64%. Hong Kong HSI is down -1.32%. China Shanghai SSE is down -0.28%. Singapore Strait Times is up 0.34%. Japan 10-year JGB yield is down -0.0002 at 0.235. Overnight DOW dropped -0.46%. S&P 500 dropped -0.30%. NASDAQ rose 0.03%. 10-year yield rose 0.056 to 2.960.
Gold breaches 1700, close to critical support
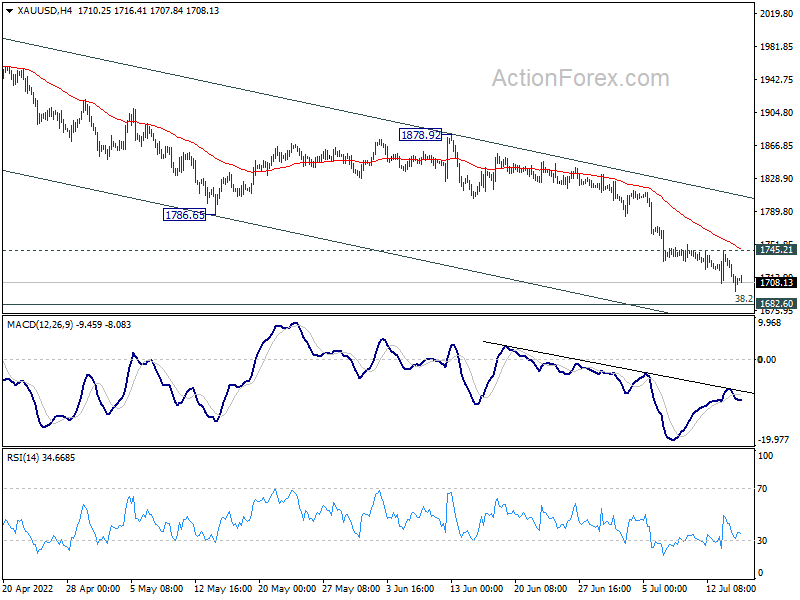
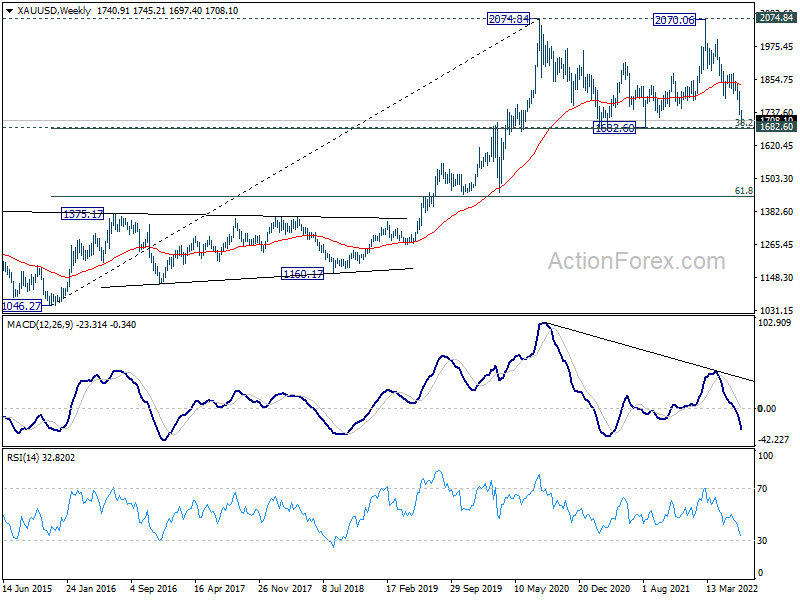
Gold's down trend continued this week and breached 1700 handle overnight. Further fall is still in favor but Gold is now close to a critical support zone.
Whole pattern from 2074.84 (2020 high) is seen as a three wave consolidation pattern, with fall from 2070.06 as the third leg. Strong support is expected around 1682.60, with 38.2% retracement of 1046.27 to 2074.84 at 1681.92, to complete the pattern. Break of 1745.21 minor resistance will now be a sign of short term bottoming and bring stronger rise back to 1786.65/1878.92 resistance zone.
However, sustained break of 1682.60 will complete a double top reversal pattern (2074.84, 2070.06), and could prompt deeper decline to 61.8% retracement at 1439.18.
Fed Bullard: 75bps has a lot of virtue to it
In an interview by Nikkei after US CPI release, St. Louis Fed President James Bullard said rate-setters have "framed" the July FOMC meeting as "50 versus 75". "I think 75 has a lot of virtue to it, because the long run neutral that the committee has, according to the Summary of Economic Projections, is actually about 2.5%," he said.
"If we made this move at this meeting, that would get us all the way till the long run neutral value. And obviously we've got more steps to take in meetings ahead, but we can assess as we go through the rest of this year," he added.
While Bullard has been advocating to get interest rate to 3.5% this year, rate exceeding 4% by the end of this year is "possible". "If data came in, continued to come in, in an adverse way, for the committee, then we could consider doing more, as we go through the fall here. So, I'd say it's a possibility."
NZ BusinessNZ manufacturing dropped to 49.7, sector remains in struggle street
New Zealand BusinessNZ Performance of Manufacturing Index dropped from 52.9 to 49.7 in June. Production dropped from 52.6 to 47.8. Employment dropped from 52.8 to 51.2. New orders dropped fro 52.3 to 47.8. Finished stocks dropped from 52.8 to 50.0. Deliveries dropped from 55.1 to 51.7.
BusinessNZ's Director, Advocacy Catherine Beard said that the drop in activity levels for June highlights the fact that the sector remains in struggle street to get back to long-term activity levels.
"The key sub index values of Production (47.8) and New Orders (47.8) both recorded the same level of contraction, which had a combined negative effect on the overall Index. As mentioned in previous months, a strong and consistent activity level for both these key sub index values will be the only way to push the PMI towards better results."
China GDP grew only 0.4% yoy in Q2, but Jun data improved
China GDP grew only 0.4% yoy in Q2, missing even the expectation of 1.0% yoy. For June, industrial production rose 3.9% yoy, below expectation of 4.3% yoy/. Nevertheless, retail sales rose 3.1% yoy, above expectation of 0.4% yoy. Fixed asset investment rose 6.1% ytd yoy, versus expectation of 6.0%.
"Domestically, the impact of the epidemic is lingering," NBS spokesman Fu Linghui said. "Economic growth is still much lower than its potential, as the fear of Covid outbreaks continues to hurt consumer and corporate sentiment... Even accounting for June's strength, the data are consistent with negative year-on-year growth last quarter," he added.
Looking ahead
Eurozone trade balance will be released in European session. Later in the day, US retail sales, empire state manufacturing index, import price, industrial production, U of Michigan consumer sentiment and business inventories will be released.
EUR/USD Daily Outlook
Daily Pivots: (S1) 0.9960; (P) 1.0013; (R1) 1.0074; More...
EUR/USD continues to lose downside momentum as seen in 4 hour MACD. But further decline is still expected with 1.0121 minor resistance intact. Sustained break of 100% projection of 1.1184 to 1.0348 from 1.0773 at 0.9937 could prompt downside acceleration to 161.8% projection at 0.9420. Nevertheless, break of 1.0121 will indicate short term bottoming, and turn bias back to the upside for rebound, towards 1.0348 support turned resistance.
In the bigger picture, down trend from 1.6039 (2008 high) is still in progress. Next target is 100% projection of 1.3993 to 1.0339 from 1.2348 at 0.8694. In any case, outlook will stay bearish as long as 1.0773 resistance holds, in case of rebound.
Economic Indicators Update
| GMT | Ccy | Events | Actual | Forecast | Previous | Revised |
|---|---|---|---|---|---|---|
| 22:30 | NZD | Business NZ PMI Jun | 49.7 | 52.9 | ||
| 02:00 | CNY | GDP Y/Y Q2 | 0.40% | 1.00% | 4.80% | |
| 02:00 | CNY | Retail Sales Y/Y Jun | 3.10% | 0.40% | -6.70% | |
| 02:00 | CNY | Industrial Production Y/Y Jun | 3.90% | 4.30% | 0.70% | |
| 02:00 | CNY | Fixed Asset Investment YTD Y/Y Jun | 6.10% | 6.00% | 6.20% | |
| 04:30 | JPY | Tertiary Industry Index M/M May | 0.80% | 4.30% | 0.70% | |
| 09:00 | EUR | Eurozone Trade Balance (EUR) May | -26.3B | -31.7B | ||
| 12:30 | CAD | Wholesale Sales M/M May | 0.20% | -0.50% | ||
| 12:30 | USD | Retail Sales M/M Jun | 0.80% | -0.30% | ||
| 12:30 | USD | Retail Sales ex Autos M/M Jun | 0.60% | 0.50% | ||
| 12:30 | USD | Empire State Manufacturing Index Jul | -3.8 | -1.2 | ||
| 12:30 | USD | Import Price Index M/M Jun | 0.70% | 0.60% | ||
| 13:15 | USD | Industrial Production M/M Jun | 0.20% | 0.20% | ||
| 13:15 | USD | Capacity Utilization Jun | 79.20% | 79.00% | ||
| 14:00 | USD | Michigan Consumer Sentiment Index Jul P | 49 | 50 | ||
| 14:00 | USD | Business Inventories May | 1.10% | 1.20% |
Gold breaches 1700, close to critical support
Gold's down trend continued this week and breached 1700 handle overnight. Further fall is still in favor but Gold is now close to a critical support zone.
Whole pattern from 2074.84 (2020 high) is seen as a three wave consolidation pattern, with fall from 2070.06 as the third leg. Strong support is expected around 1682.60, with 38.2% retracement of 1046.27 to 2074.84 at 1681.92, to complete the pattern. Break of 1745.21 minor resistance will now be a sign of short term bottoming and bring stronger rise back to 1786.65/1878.92 resistance zone.
However, sustained break of 1682.60 will complete a double top reversal pattern (2074.84, 2070.06), and could prompt deeper decline to 61.8% retracement at 1439.18.
China GDP grew only 0.4% yoy in Q2, but Jun data improved
China GDP grew only 0.4% yoy in Q2, missing even the expectation of 1.0% yoy. For June, industrial production rose 3.9% yoy, below expectation of 4.3% yoy. Nevertheless, retail sales rose 3.1% yoy, above expectation of 0.4% yoy. Fixed asset investment rose 6.1% ytd yoy, versus expectation of 6.0%.
"Domestically, the impact of the epidemic is lingering," NBS spokesman Fu Linghui said. "Economic growth is still much lower than its potential, as the fear of Covid outbreaks continues to hurt consumer and corporate sentiment... Even accounting for June's strength, the data are consistent with negative year-on-year growth last quarter," he added.