Sample Category Title
Crude Oil price peak is behind us
Oil lost more than 10% in just over 24 hours, starting to decline late in the day on Monday. WTI crude fell to $91.30 as it sold off. Having lied on the way down stop orders, oil at one point fell below the 200-day moving average.
Oil has not traded consistently below this level since November 2020, throughout the last bull market. Notably, Biden’s election victory was the start of a rally across a wide range of risk assets from the Nasdaq100 and crypto to oil and other commodities. However, equities and cryptocurrencies have already zeroed in on that rise, while black gold is now around 150% more expensive than it was at the start of the active upcycle.
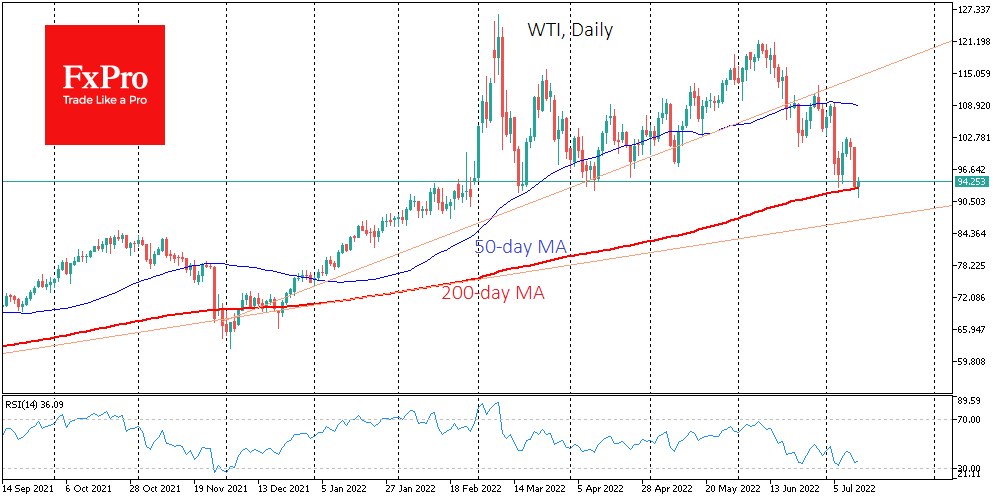
However, we remain of the opinion that the tide in oil has already turned. Since June 9, i.e. for more than a month, we have seen a downtrend in oil prices with a succession of lower local lows and higher highs.
During this time, the short-term, most violent bullish momentum has been reversed. At the same time, the speed of the fall is only gaining momentum. In July, two more than 10% declines have already occurred within 24 hours.
It looks like we only see the start of a decline in oil. Geopolitics, rapid demand after lockdowns and underinvestment in production have made the rally in oil sharper than in many other commodities. But now, we see consumption growth stagnating or even going down in some cases. Meanwhile, the leading producers (US, Saudi Arabia) are ramping up and promising to ramp up production soon.
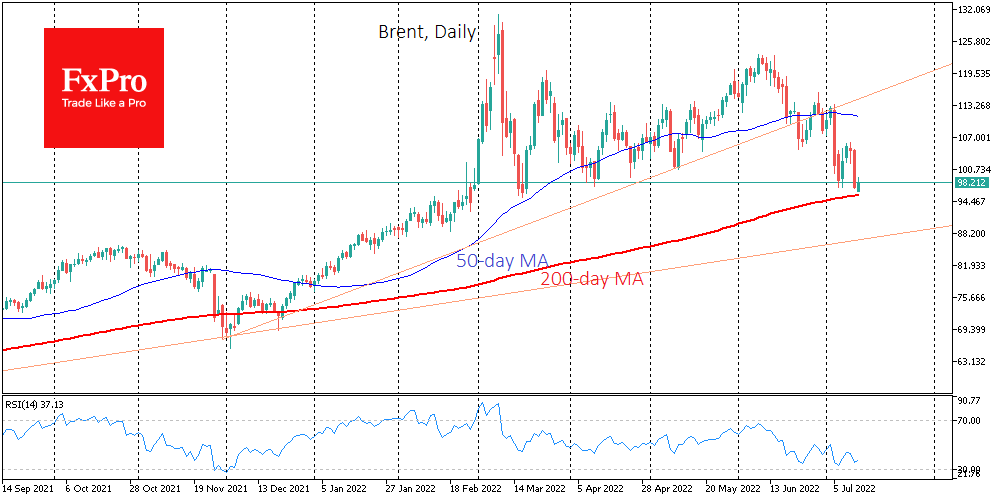
All this leads us to believe that the commodity super-cycle did not take place and turned out to be sharp, but not for long. And the road ahead for oil is downhill. The closest meaningful stop on that downward path for energy prices looks to be $83 for WTI and $85 for Brent.
UK Economy Revives, Helping Pound to Rise Against Euro
A new package of UK macro statistics showed some recovery and exceeded expectations, supporting pound buying, although it did not help the stock market.
The monthly economic growth is estimated at 0.5% in May after a decline of 0.2% in April and +0.1% in March. And this is significantly better than the 0.1% expected.
Manufacturing showed an impressive jump, adding 1.4% for May – the best growth in 14 months.
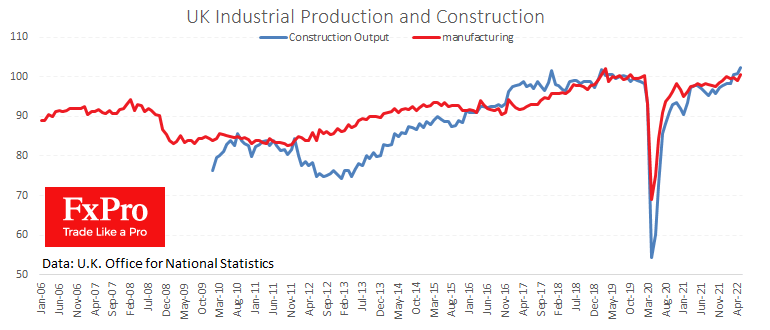
The service sector grew by 0.4% m/m, contrary to expectations of a 0.1% increase.
Equally surprising was the construction sector, where workloads grew by 1.5% mom and 4.8% YoY, coming out of the lockdown pit, renewed historical highs.
The foreign trade deficit of 21.4B was higher than the expected 19.8B, but this widening came at the expense of faster growth in imports, although exports also added impressively. The UK’s trade deficit was 24% of trade turnover. These are historically high figures but a marked improvement on the record 30% in January.
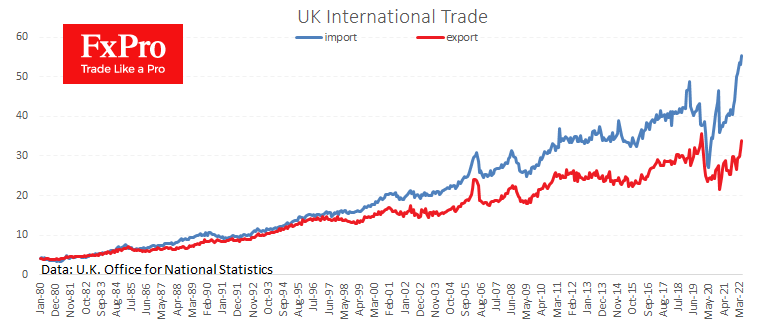
Much of the credit for the recovery can be attributed to a weaker pound, which has boosted export competitiveness and increased construction activity. The latter can be attributed to the tailwinds from historically low-interest rates, while there are questions about whether the housing boom will continue.
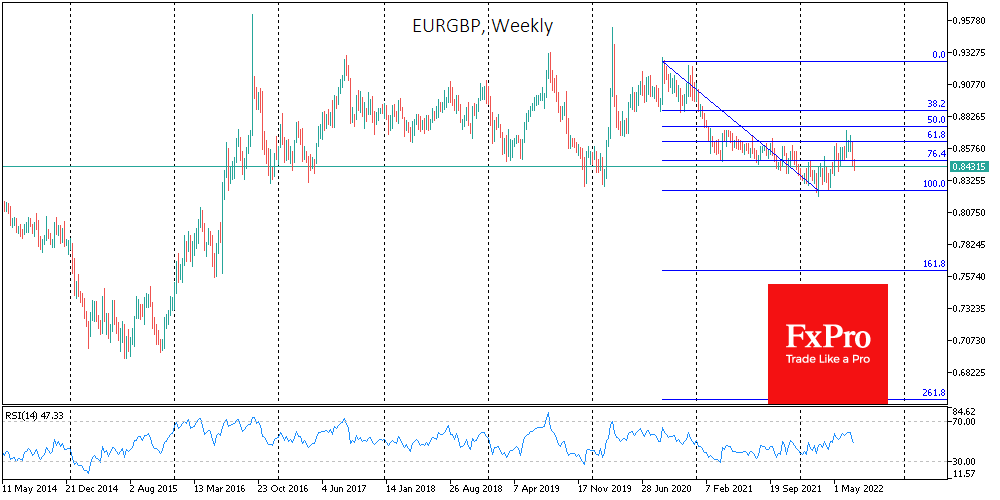
A positive batch of data will likely provide the pound only a temporary respite in its decline against the dollar and spur gains against the euro. The EURGBP pair seems to have completed its corrective rebound after a long decline between September 2020 and March 2022. By the end of the year, the pair may fall to the last six years area near 0.8250. In the event of further problems in the Eurozone, the EURGBP could lose support and move towards 0.75, which has not been since the Brexit referendum.
US: Higher Gasoline Prices Keep Inflation Red Hot in June
Consumer price inflation rose by 1.3% month-over-month (m/m) in June – a modest acceleration from the 1.0% m/m recorded the month prior. On a year-over-year basis, inflation accelerated by 0.5 percentage points (pp) from May, rising to 9.1%.
Energy prices were again a sizeable contributor to the monthly gain – rising 7.5% m/m – as both gasoline (11.2% m/m) and energy services (3.5% m/m) were up on the month. Food prices (1.0% m/m) were also higher in June and are now up over 10.4% on a year-ago basis.
Core inflation (excludes food and energy) rose 0.7% m/m – slightly faster than the 0.6% m/m gain seen in May. On a year-over-year (y/y) basis, core inflation edged lower by 0.2pp compared to the month prior, rising by 5.9% y/y.
Price growth across service categories remained relatively broad-based, rising 0.7% m/m. Shelter costs (0.6% m/m) matched May's gain, while transportation (2.1% m/m) and medical (0.7% m/m) services both accelerated last month. After two consecutive months of double-digit gains, airfares (-1.8% m/m) retreated modestly on the month.
Core goods prices – includes all goods except food & energy – also accelerated in June, rising by 0.8% m/m compared to 0.7% m/m in May. Gains were seen across all sub-categories, though were led by used (1.6% m/m) and new (0.7% m/m) vehicle prices as well as apparel (0.8% m/m).
Key Implications
Another month, another new multi-decade high for inflation. With fuel prices surging by 11% in June and gains in food prices showing incredible persistence through the first half of the year, a further acceleration in the headline measure was inevitable.
While core inflation has shown a clear sign of rolling over – with the year-over-year measure having now decelerated in each of the last three consecutive months – policymakers will find little solace here as the deceleration is entirely due to base effects. Even with consumer demand for goods having clearly slowed in recent months, core goods prices have continued to accelerate in both May and June. Unless we see a meaningful slowdown on this front over the coming months, the base effects will soon become less relevant and core inflation will remain elevated.
Following this morning's release, the inversion in the yield curve widened further, with the 10Y-2Y spread now at about negative 15 basis points. With inflation showing no immediate signs of cooling, the Federal Reserve will not be dissuaded by growing recession fears and will continue aggressively tighten rates through the remainder of the year. We expect the FOMC to push ahead with another 75 basis point rate hike at its next meeting on July 27th.
EUR/USD Mid-Day Outlook
Daily Pivots: (S1) 1.0000; (P) 1.0037; (R1) 1.0074; More...
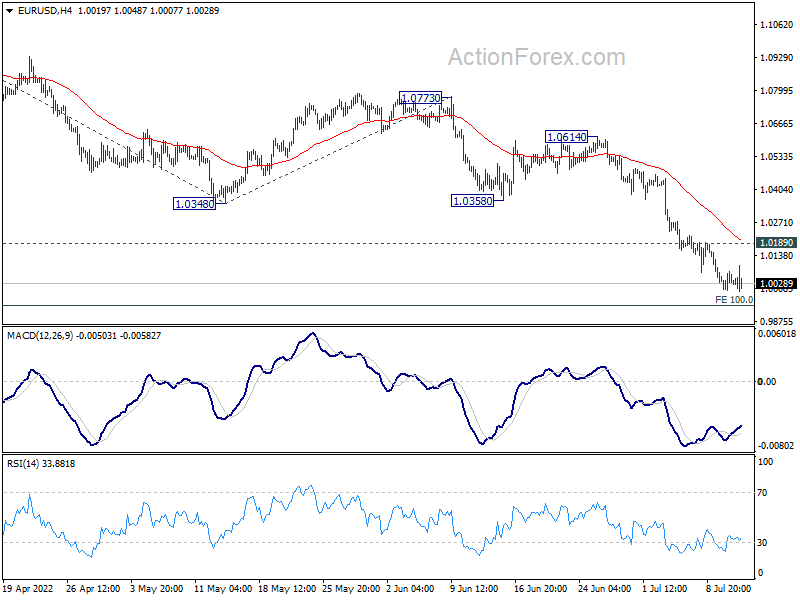
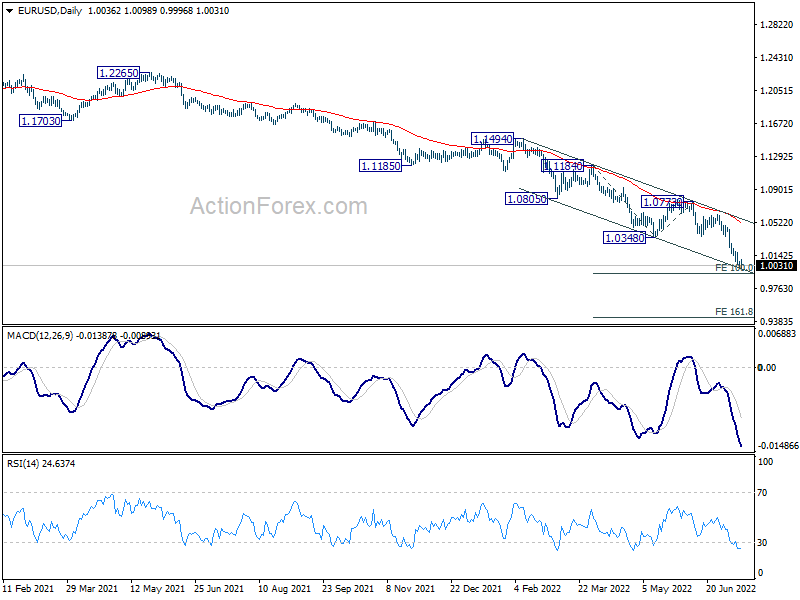
No change in EUR/USD's outlook and further decline is expected with 1.0189 minor resistance intact. Current down trend should target 100% projection of 1.1184 to 1.0348 from 1.0773 at 0.9937. Firm break there could prompt downside acceleration to 161.8% projection at 0.9420. On the upside, break of 1.0189 minor resistance will turn bias back to the upside for stronger rebound.
In the bigger picture, down trend from 1.6039 (2008 high) is still in progress. Next target is 100% projection of 1.3993 to 1.0339 from 1.2348 at 0.8694. In any case, outlook will stay bearish as long as 1.0773 resistance holds, in case of rebound.
GBP/USD Mid-Day Outlook
Daily Pivots: (S1) 1.1827; (P) 1.1932; (R1) 1.1998; More...
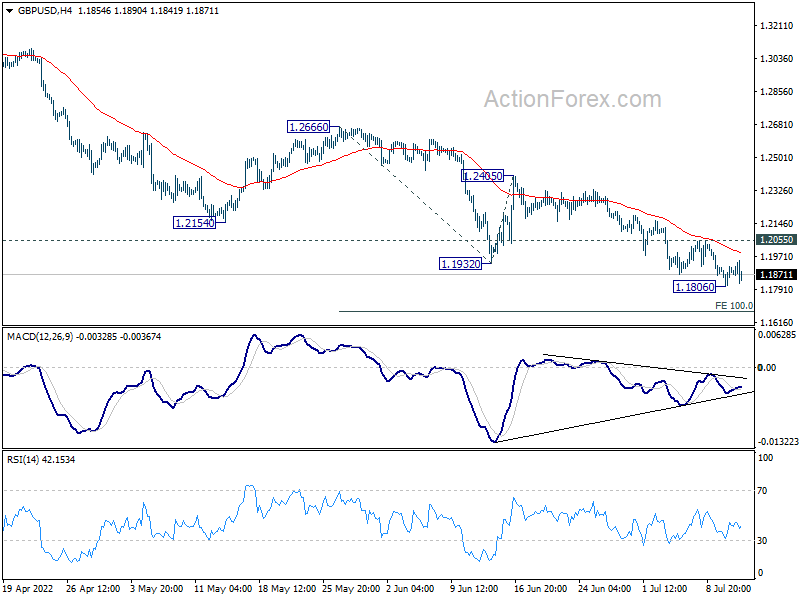
Intraday bias in GBP/USD stays neutral for consolidation above 1.1806 temporary low. But further fall is expected with 1.2055 resistance intact. Break of 1.1806 will resume larger down trend to 100% projection of 1.2666 to 1.1932 from 1.2405 at 1.1671. Decisive break there will target a test on 1.1409 long term support. On the upside, above 1.2055 minor resistance will now indicate short term bottoming, and turn bias to the upside for stronger rebound.
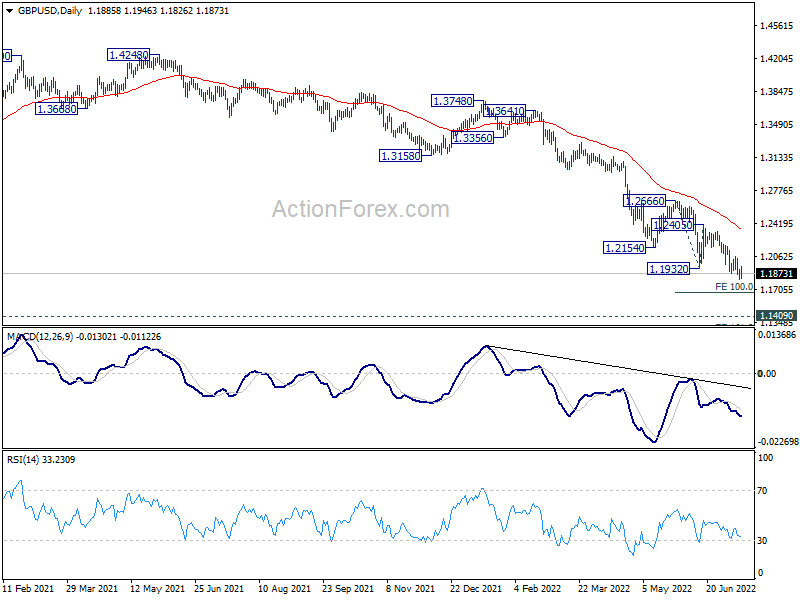
In the bigger picture, fall from 1.4248 (2018 high) could be a leg inside the pattern from 1.1409 (2020 low), or resuming the longer term down trend. Deeper decline is expected as long as 1.2666 resistance holds. Next target is 1.1409 low. However, firm break of 1.2666 will bring stronger rise back to 55 week EMA (now at 1.3065).
USD/CHF Mid-Day Outlook
Daily Pivots: (S1) 0.9794; (P) 0.9827; (R1) 0.9849; More...
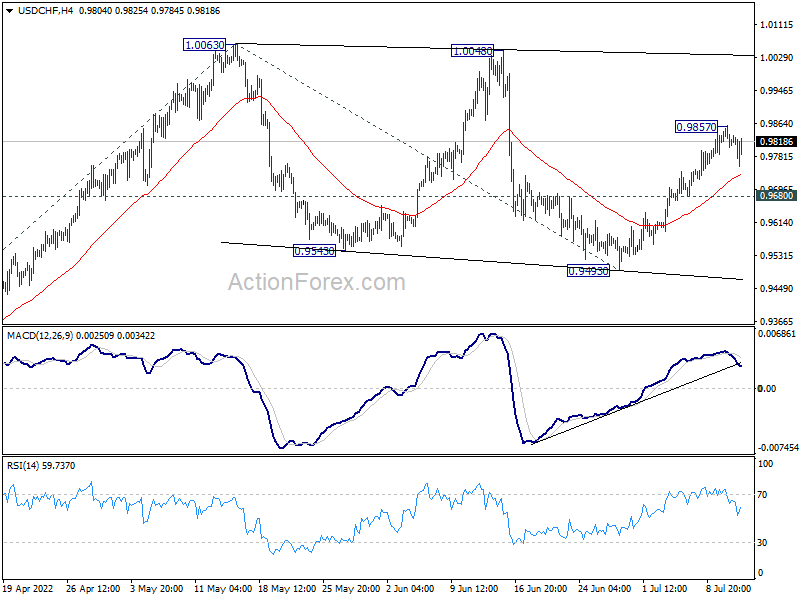
Intraday bias in USD/CHF is turned neutral first, but further rise is expected as long as 0.9680 minor support holds. . Consolidation pattern from 1.0063 should have completed with three waves down to 0.9493 already. Further rise would be seen to retest 1.0063 high first. Decisive break there will resume larger up trend. On the downside, break of 0.9670 minor support will dampen this bullish view and bias back to the downside for 0.9493 support instead.
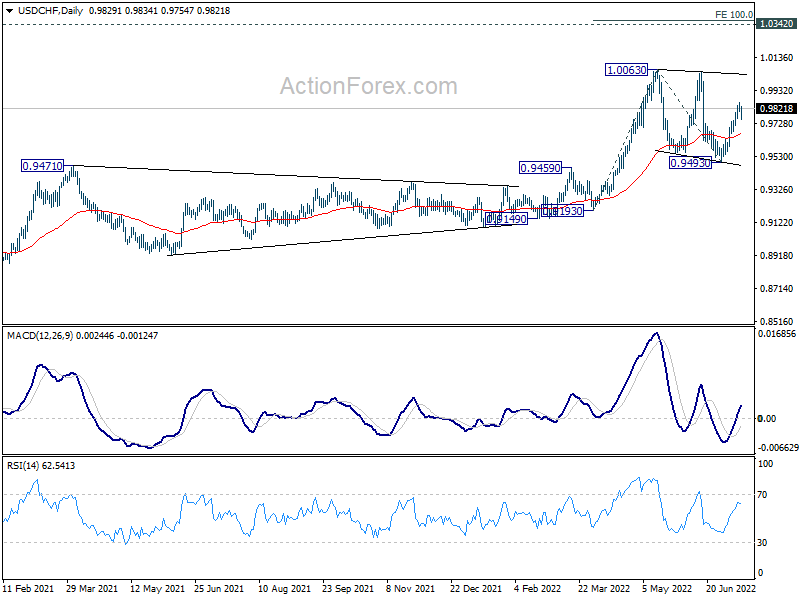
In the bigger picture, medium term up trend from 0.8756 (2021 low) is still in progress. Next target is 1.0342 (2016 high). Sustained break there will resume long term up trend from 0.7065 (2011 low). This will remain the favored case as long as 0.9471 resistance turned support holds.
Dollar Rises as CPI Hits Another Four-Decade High
Dollar rises in early US session after data shows that headline consumer inflation accelerated once again in June, to the highest level since 1981. Yen is currently the worst performing one on rise in US and European benchmark yields. But there is prospect for recovery in Yen, except versus Dollar, if risk off sentiment intensifies. Kiwi is also on the softer side despite RBNZ rate hike earlier today. Euro is under performing Sterling and Swiss Franc. Canadian Dollar is resilient for now and the next move will depend on BoC rate decision.
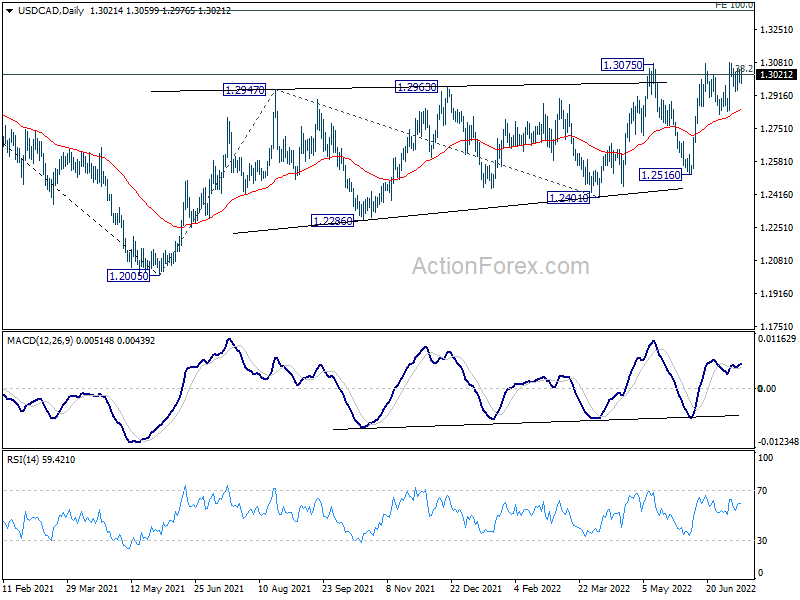
Technically, USD/CAD will be a focus for the rest of the session. Sustained break of 1.3075 resistance will extend larger up trend to 100% projection of 1.2005 to 1.2947 from 1.2401 at 1.3343. If that happens, it would be the final piece to confirm Dollar's underlying momentum. But, break of 1.2818 near term support will raise the chance of another rejection by 1.3075.
In Europe, at the time of writing, FTSE is down -1.30%. DAX is down -1.87%. CAC is down -1.70%. Germany 10-year yield is up 0.0796 at 1.209. Earlier in Asia, Nikkei rose 0.54%. Hong Kong HSI dropped -0.22%. China Shanghai SSE rose 0.09%. Singapore Strait Times dropped -0.54%. Japan 10-year JGB yield dropped -0.0061 to 0.238.
US CPI accelerated again to 9.1% yoy in Jun, energy up 41.6% yoy, food up 10.4% yoy
US CPI rose 1.3% mom in June, above expectation of 1.0% mom. CPI core rose 0.7% mom, also above expectation of 0.5% mom. Energy index rose 7.5% mom, contributed nearly half of the all items increase. Gasoline index rose 11.2% mom. Food index rose 1.0% mom.
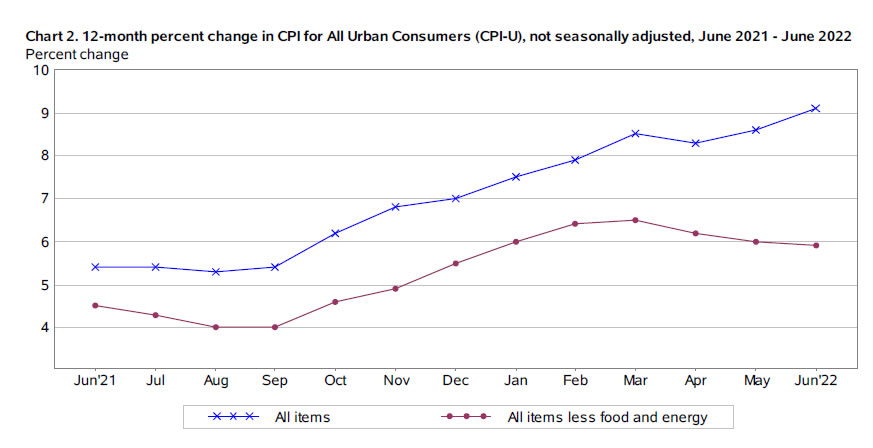
For the 12-month period, CPI accelerated from 8.6% yoy to 9.1% yoy, above expectation of 8.7% yoy. That's the highest level since November 1981. CPI core (all items less food and energy) slowed slightly from 6.0% yoy to 5.9% yoy, above expectation of 5.7% yoy. Energy index rose 41.6% yoy, highest since April 1980. Food index rose 10.4% yoy, highest since February 1981.
Eurozone industrial production rose 0.8%, mom in May, EU up 0.6% mom
Eurozone industrial production rose 0.8% mom in May, well above expectation of 0.2% mom. Production of non-durable consumer goods rose by 2.7%, capital goods by 2.5% and durable consumer goods by 1.4%, while production of intermediate goods remained unchanged and production of energy fell by -3.3%.
EU industrial production rose 0.6% mom. Among Member States for which data are available, the highest monthly increases were registered in Ireland (+13.9%), Greece (+2.6%) and Czechia (+2.4%). The largest decreases were observed in Lithuania (-7.6%), the Netherlands (-3.3%) and Luxembourg (-2.9%).
UK GDP grew 0.5% mom in May, much better than expectations
UK GDP grew 0.5% mom in May, much better than expectation of 0.0%. Services rose 0.4% mom. Production rose 0.9% mom. Construction also rose 1.5% mom. Monthly GDP is estimated to be 1.7% above its pre-pandemic levels in February 2020. In the three months to May, GDP grew 0.4%. Annual growth in monthly GDP was 3.5% yoy.
Also published, industrial production was up 0.9% mom, 1.4% yoy, versus expectation of 0.0% mom, 1.7% yoy. Manufacturing production was up 1.4% mom, 2.3% yoy, versus expectation of 0.1% mom, 0.3% yoy. Goods trade deficit was little changed at GBP -21.4B, versus expectation of GBP -18.3B.
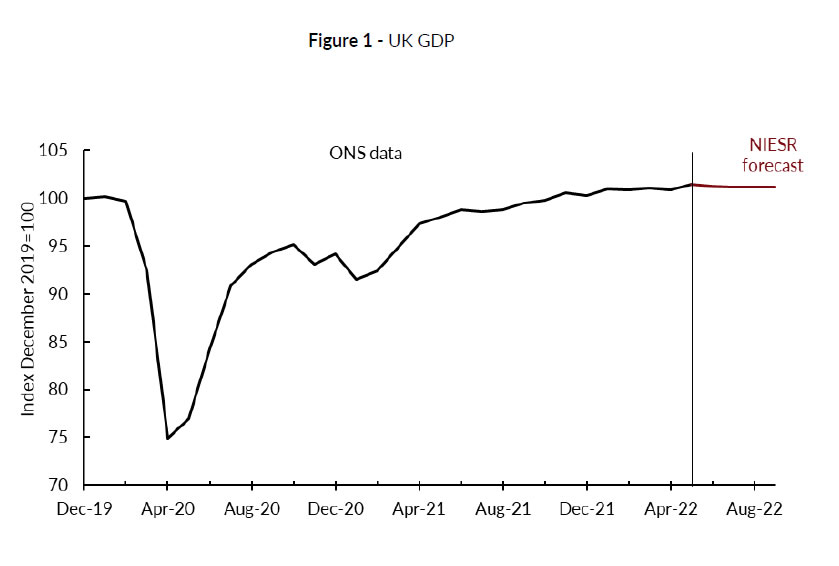
NIESR forecasts 0.2% growth in UK GDP in Q2
After data showing 0.5% mom GDP growth in UK, NIESR now forecasts 0.2% mom growth in June. For whole of Q2, growth would then be 0.2%. It still forecast a contraction of -0.1% in GDP Q3, with growth likely to slow further as inflation drags on consumer demand.
Rory Macqueen, Principal Economist, NIESR: "If April activity was more encouraging than the headline figure suggested – with strong consumer-facing services dragged down by the reduction in vaccinations – the opposite may be true of May. Headline growth of 0.5 per cent owed much to rising GP visits, while sectors like hospitality, retail and the arts all contracted, suggesting that rising prices may have eaten into discretionary household consumption.
" More encouragingly, manufacturing had its joint strongest month since November 2020, and construction recorded a seventh consecutive month of expansion. With plenty of room for revisions, it looks like touch and go as to whether the UK economy entered recession in the second quarter."
RBNZ lifts OCR by 50bps to 2.5%, maintains approach of brisk rate hikes
RBNZ raised Official Cash Rate by 50bps to 2.50% as widely expected. The central bank also indicated that it will follow the projected path to raise interest to nearing 3.5% by the end of 2022, and then around 4% in mid-2023.
"The Committee is comfortable that the projected path of the OCR outlined in the recent May Monetary Policy Statement remains broadly consistent with achieving its primary inflation and employment objectives - without causing unnecessary instability in output, interest rates and the exchange rate," RBNZ said in the statement.
Also, as noted in the summary records of meeting, "The Committee agreed to maintain its approach of briskly lifting the OCR until it is confident that monetary conditions are sufficient to constrain inflation expectations and bring consumer price inflation to within the target range."
USD/JPY Mid-Day Outlook
Daily Pivots: (S1) 136.39; (P) 136.96; (R1) 137.44; More...
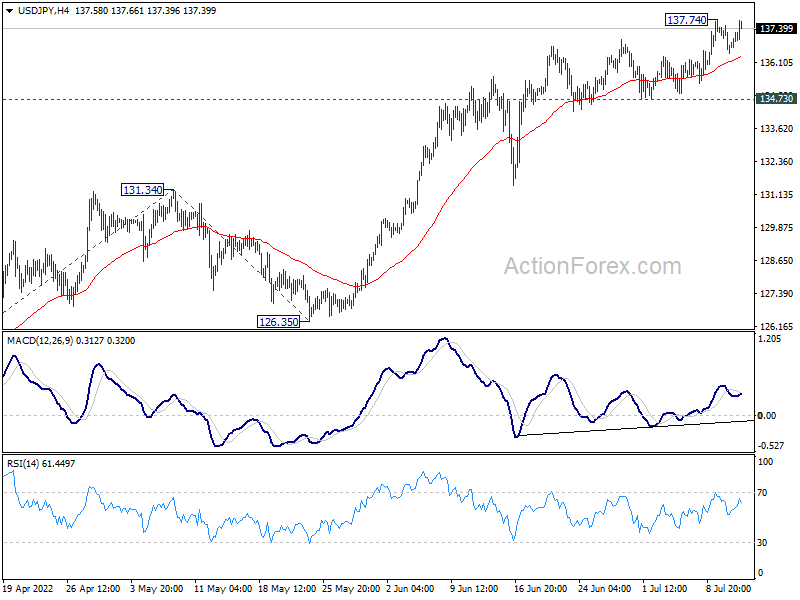
USD/JPY rises in early US session but stays below 137.73 temporary top. Intraday bias remains neutral first. In case of another retreat, downside should be contained by 134.73 support to bring rebound. Firm break of 137.74 will resume larger up trend to 100% projection of 114.40 to 131.34 from 126.35 at 143.29.
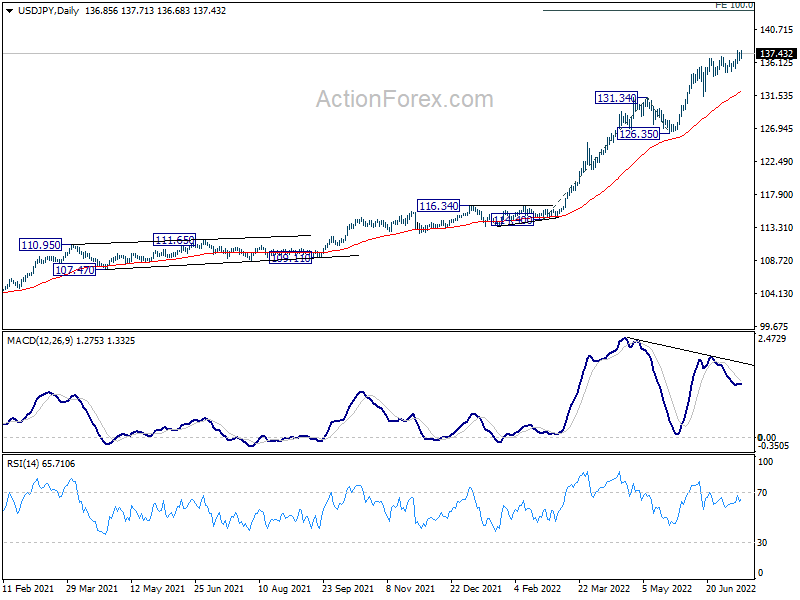
In the bigger picture, current rally is seen as part of the long term up trend from 75.56 (2011 low). Next target is 100% projection of 75.56 (2011 low) to 125.85 (2015 high) from 98.97 at 149.26, which is close to 147.68 (1998 high). This will remain the favored case as long as 126.35 support holds.
Economic Indicators Update
| GMT | Ccy | Events | Actual | Forecast | Previous | Revised |
|---|---|---|---|---|---|---|
| 02:00 | NZD | RBNZ Interest Rate Decision | 2.50% | 2.50% | 2.00% | |
| 06:00 | GBP | GDP M/M May | 0.50% | 0.00% | -0.30% | |
| 06:00 | GBP | Index of Services 3M/3M May | 0.10% | 0.20% | 0.00% | 0.20% |
| 06:00 | GBP | Industrial Production M/M May | 0.90% | 0.00% | -0.60% | -0.10% |
| 06:00 | GBP | Industrial Production Y/Y May | 1.40% | 1.70% | 0.70% | 1.60% |
| 06:00 | GBP | Manufacturing Production M/M May | 1.40% | 0.10% | -1.00% | -0.60% |
| 06:00 | GBP | Manufacturing Production Y/Y May | 2.30% | 0.30% | 0.50% | 1.30% |
| 06:00 | GBP | Goods Trade Balance (GBP) May | -21.4B | -18.3B | -20.9B | -21.5B |
| 06:00 | EUR | Germany CPI M/M Jun F | 0.10% | 0.10% | 0.10% | |
| 06:00 | EUR | Germany CPI Y/Y Jun F | 7.60% | 7.60% | 7.60% | |
| 09:00 | EUR | Eurozone Industrial Production M/M May | 0.80% | 0.20% | 0.40% | |
| 11:00 | GBP | NIESR GDP Estimate (3M) Jun | 0.20% | -0.10% | 0.40% | |
| 12:30 | USD | CPI M/M Jun | 1.30% | 1.00% | 1.00% | |
| 12:30 | USD | CPI Y/Y Jun | 9.10% | 8.70% | 8.60% | |
| 12:30 | USD | CPI Core M/M Jun | 0.70% | 0.50% | 0.60% | |
| 12:30 | USD | CPI Core Y/Y Jun | 5.90% | 5.70% | 6.00% | |
| 14:00 | CAD | BoC Interest Rate Decision | 2.25% | 1.50% | ||
| 14:30 | USD | Crude Oil Inventories | -1.5M | 8.2M | ||
| 18:00 | USD | Fed's Beige Book |
USD/JPY Mid-Day Outlook
Daily Pivots: (S1) 136.39; (P) 136.96; (R1) 137.44; More...
USD/JPY rises in early US session but stays below 137.73 temporary top. Intraday bias remains neutral first. In case of another retreat, downside should be contained by 134.73 support to bring rebound. Firm break of 137.74 will resume larger up trend to 100% projection of 114.40 to 131.34 from 126.35 at 143.29.
In the bigger picture, current rally is seen as part of the long term up trend from 75.56 (2011 low). Next target is 100% projection of 75.56 (2011 low) to 125.85 (2015 high) from 98.97 at 149.26, which is close to 147.68 (1998 high). This will remain the favored case as long as 126.35 support holds.
US CPI accelerated again to 9.1% yoy in Jun, energy up 41.6% yoy, food up 10.4% yoy
US CPI rose 1.3% mom in June, above expectation of 1.0% mom. CPI core rose 0.7% mom, also above expectation of 0.5% mom. Energy index rose 7.5% mom, contributed nearly half of the all items increase. Gasoline index rose 11.2% mom. Food index rose 1.0% mom.
For the 12-month period, CPI accelerated from 8.6% yoy to 9.1% yoy, above expectation of 8.7% yoy. That's the highest level since November 1981. CPI core (all items less food and energy) slowed slightly from 6.0% yoy to 5.9% yoy, above expectation of 5.7% yoy. Energy index rose 41.6% yoy, highest since April 1980. Food index rose 10.4% yoy, highest since February 1981.
NIESR forecasts 0.2% growth in UK GDP in Q2
After data showing 0.5% mom GDP growth in UK, NIESR now forecasts 0.2% mom growth in June. For whole of Q2, growth would then be 0.2%. It still forecast a contraction of -0.1% in GDP Q3, with growth likely to slow further as inflation drags on consumer demand.
Rory Macqueen, Principal Economist, NIESR:
"If April activity was more encouraging than the headline figure suggested – with strong consumer-facing services dragged down by the reduction in vaccinations – the opposite may be true of May. Headline growth of 0.5 per cent owed much to rising GP visits, while sectors like hospitality, retail and the arts all contracted, suggesting that rising prices may have eaten into discretionary household consumption.
" More encouragingly, manufacturing had its joint strongest month since November 2020, and construction recorded a seventh consecutive month of expansion. With plenty of room for revisions, it looks like touch and go as to whether the UK economy entered recession in the second quarter."