Sample Category Title
USOIL Fails to Rebound
WTI crude tumbles as traders grow wary of a slowdown in demand. A bearish MA cross on the daily chart indicates a deterioration in sentiment after the price failed to hold above the psychological level of 100.00. The latest rebound has come under pressure at 105.00 and struggled to consolidate its gains above 98.00. A bearish breakout attracts more momentum sellers and may trigger a new round of sell-off towards 91.00. An oversold RSI may lead the bears to take profit but 99.00 could see offers from trend followers.
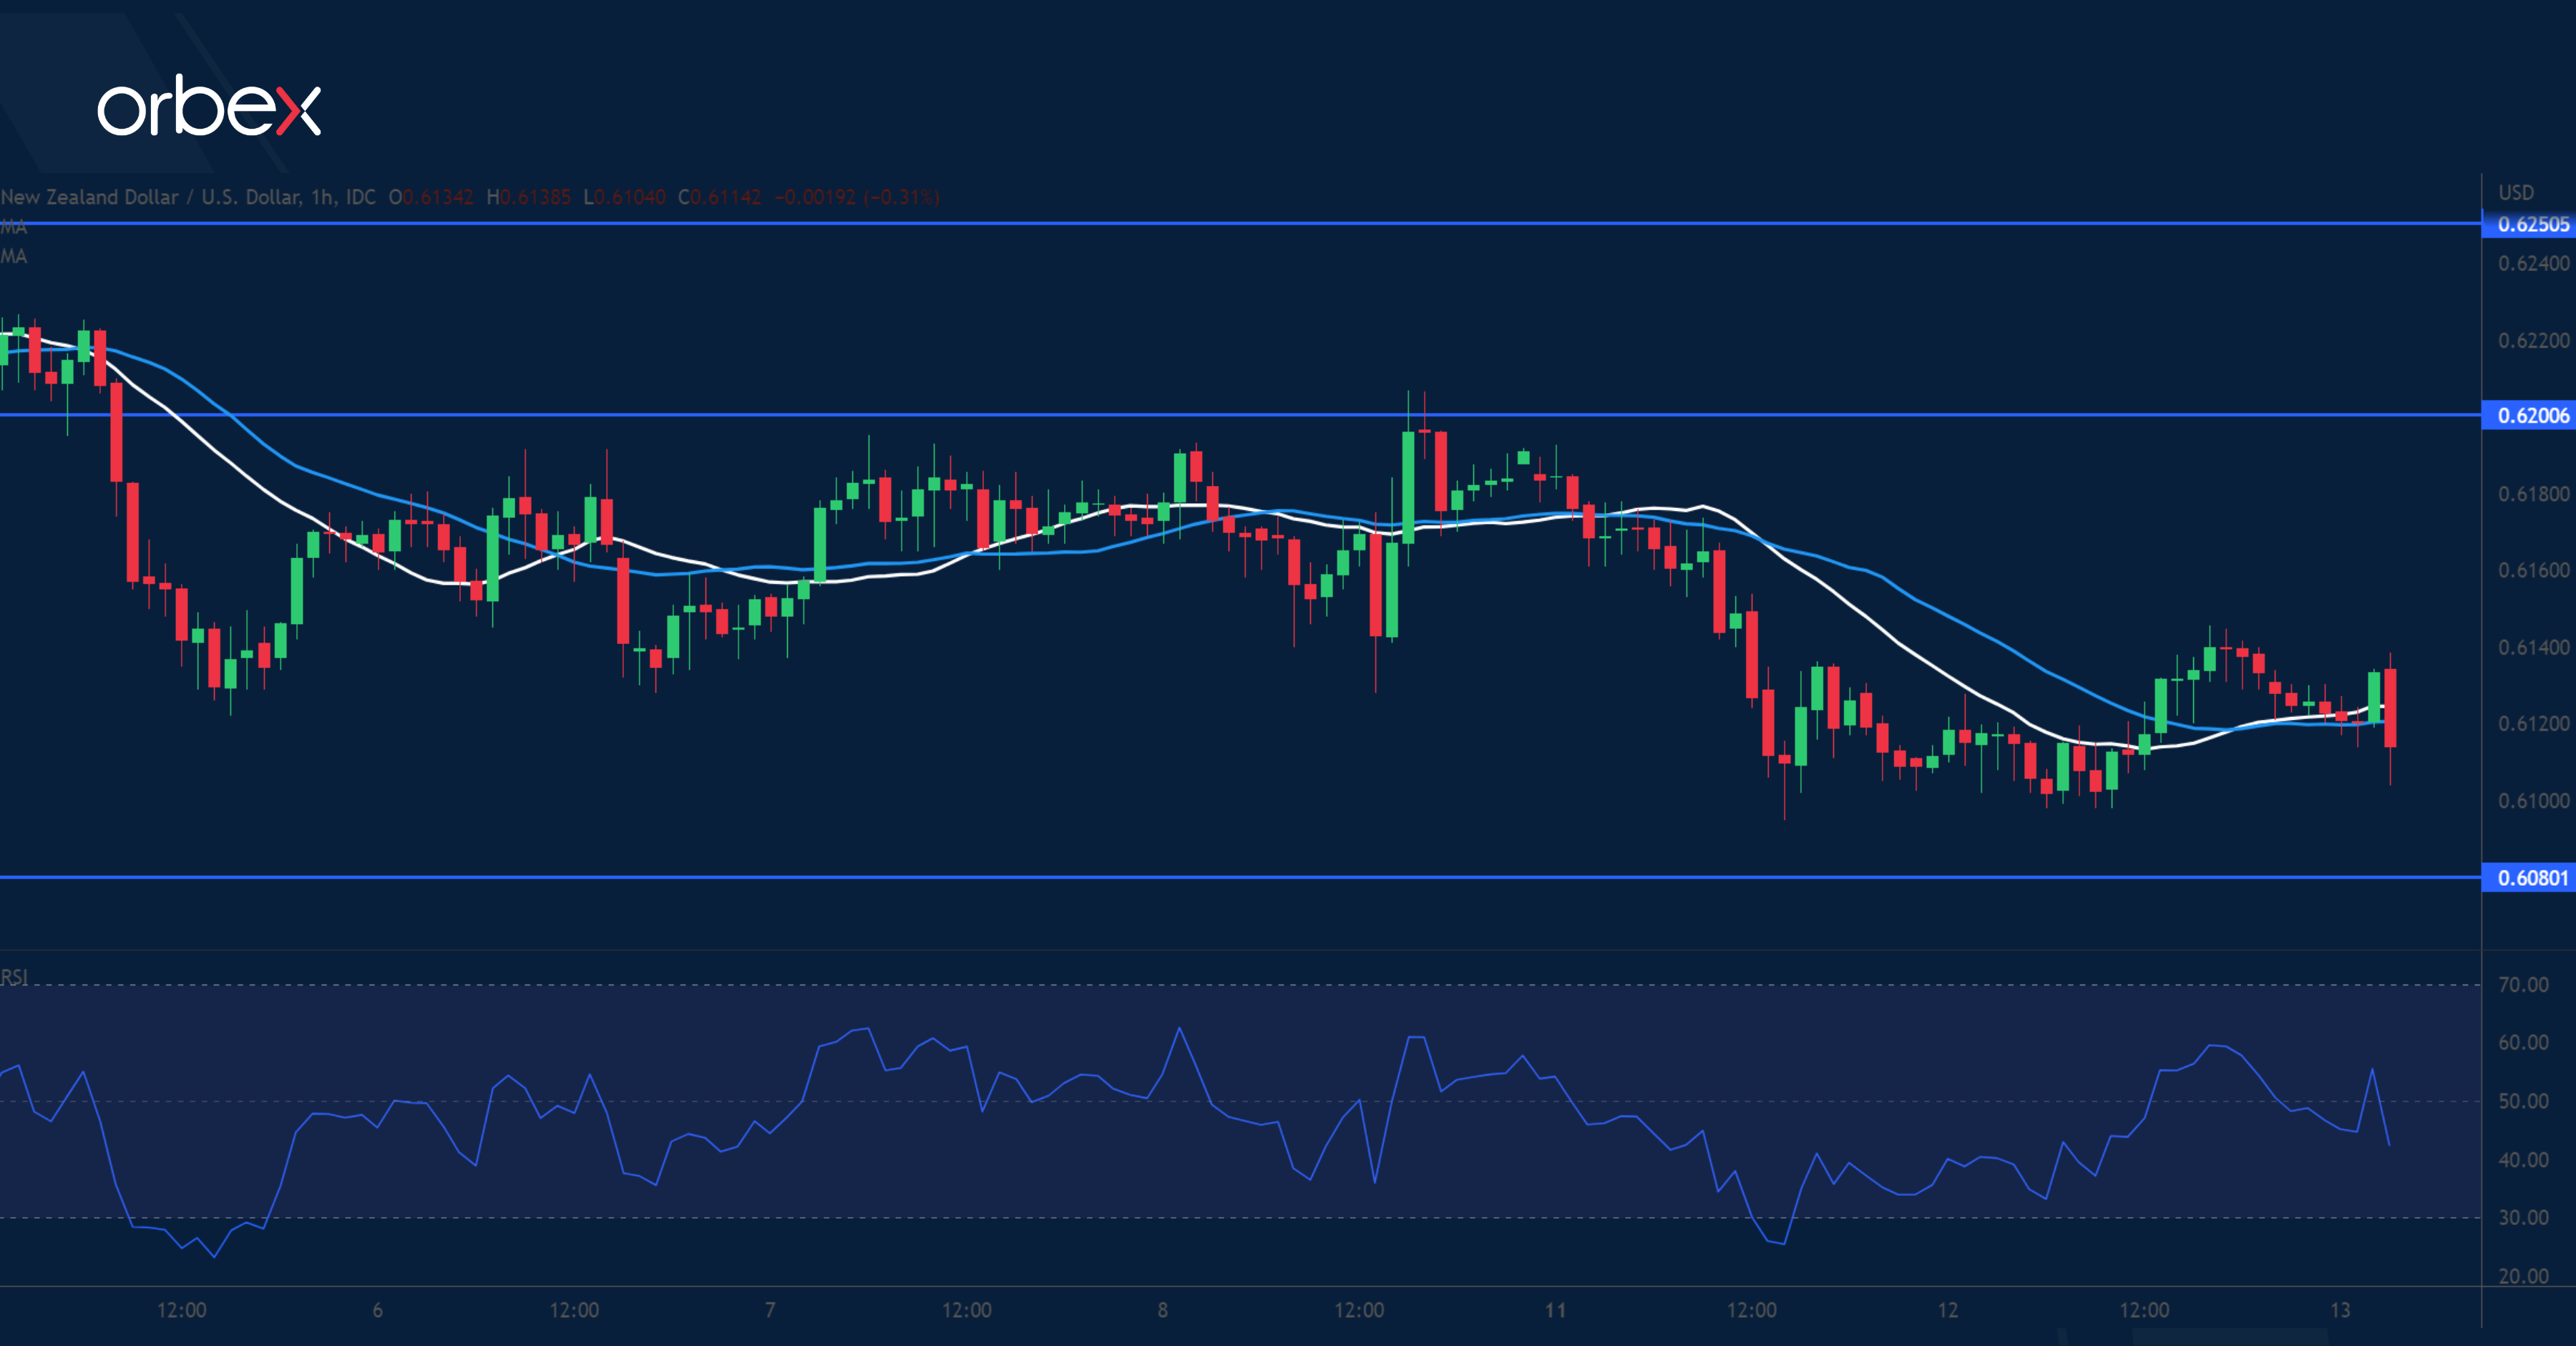
NZD/USD Tests Support
The New Zealand dollar consolidates as the RBNZ raises its interest rates by 50 basis points. The struggle to clear the supply area around 0.6200 suggests that the sell side still has a firm grip on the direction. The RSI dipped again into the oversold zone and prompted short-term sellers to take some chips off the table. 0.6080 is the next support and its breach could bring the kiwi to the psychological level of 0.6000. On the upside, the bulls will need to lift resistance at 0.6200 before they could turn the mood around.
Bitcoin Dipped into a Flat
Bitcoin was down 5% on Tuesday, ending it at around $19,400 and remaining near that level by the start of European trading. Ethereum has lost 3.3% in the last 24 hours to $1055. Altcoins from the top 10 fell from 1% (BNB) to 4.2% (Cardano).
Total cryptocurrency market capitalisation, according to CoinMarketCap, sank 2.1% to $870bn overnight. The Cryptocurrency Fear and Greed Index lost 1 point to 15.
Bitcoin fell the most since Tuesday’s beginning of the month amid a stock indices decline. BTC fell below $20,000 and tested eight-day lows below $19,300. On weekly timeframes, Bitcoin remains pinned to the oversold RSI area and under the 200-week moving average. While indicating that the market has gone too far and too fast during the recent sell-off, this disposition does not yet show signs of a rebound.
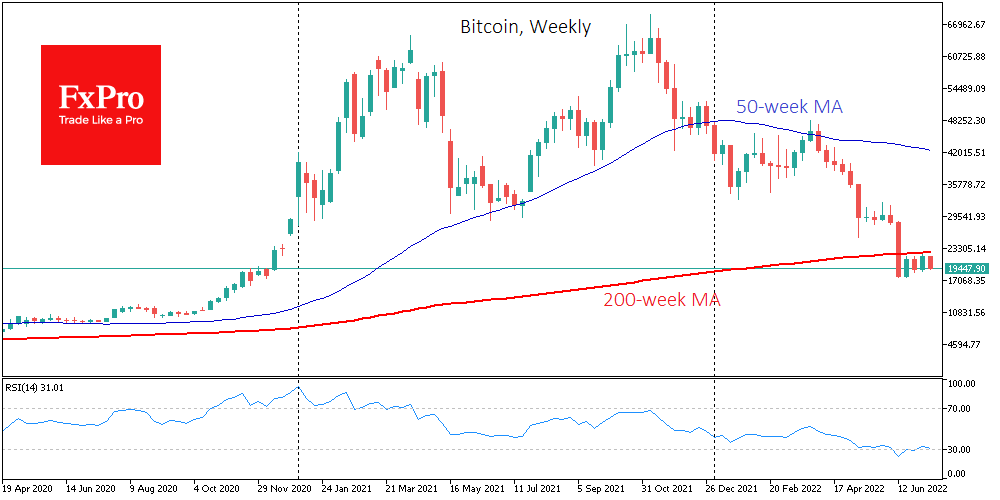
The bear markets of bitcoin and other risky assets of the past teach us that a sell-off is usually followed by a prolonged sideways move but not a V-shaped rebound. Moreover, a final reversal is often preceded by a power failure – a capitulation that makes assets ridiculously cheap, which we have yet to see.
According to CoinShares, institutional investors have shown little interest in crypto. Capital inflows into crypto funds last week amounted to $15 million, with about half of the funds coming into Ethereum products, with inflows into ETH rising for the third week. Inflows into funds that allow shorts on bitcoin fell to $6.3 million from $51 million a week earlier.
The market has yet to form a bold ‘bottom’. Cryptocurrencies could soon face severe problems as they lack catalysts for growth in the face of widespread adversity, according to CoinShares.
Daily Technical Analysis
EUR/USD
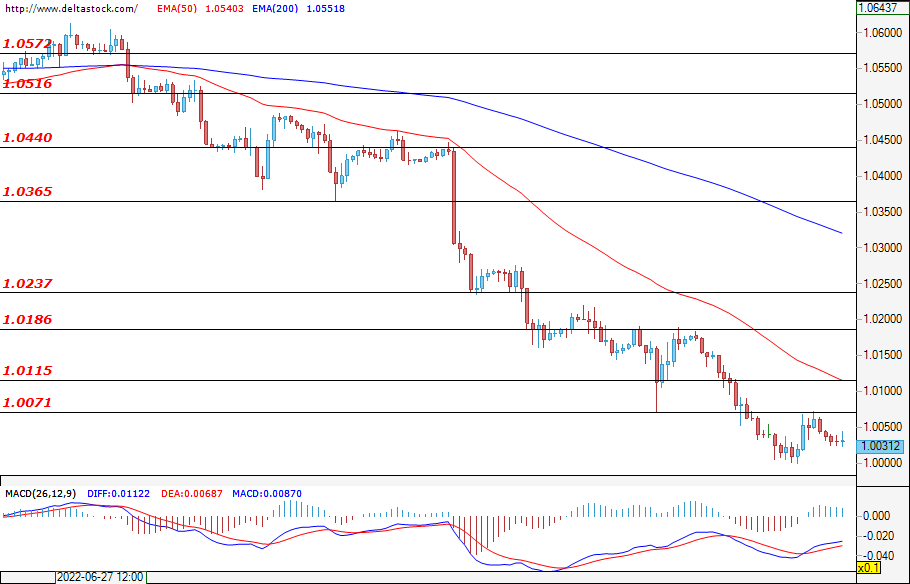
After the single European currency reached parity with the U.S. dollar during yesterday's trading session, we witnessed a slight recovery and a test of the first resistance zone at 1.0071. The bulls have not been able to impose themselves on the market and to breach the mentioned level, and at the time of writing, we are seeing a consolidation below the resistance zone. Sentiments for the moment remain rather negative – for a test of the psychological level at 1.0000. The more interesting economic news today, which could have an impact on the volatility of the currency pair, is the release of the U.S. consumer price index data (12:30 GMT).
USD/JPY
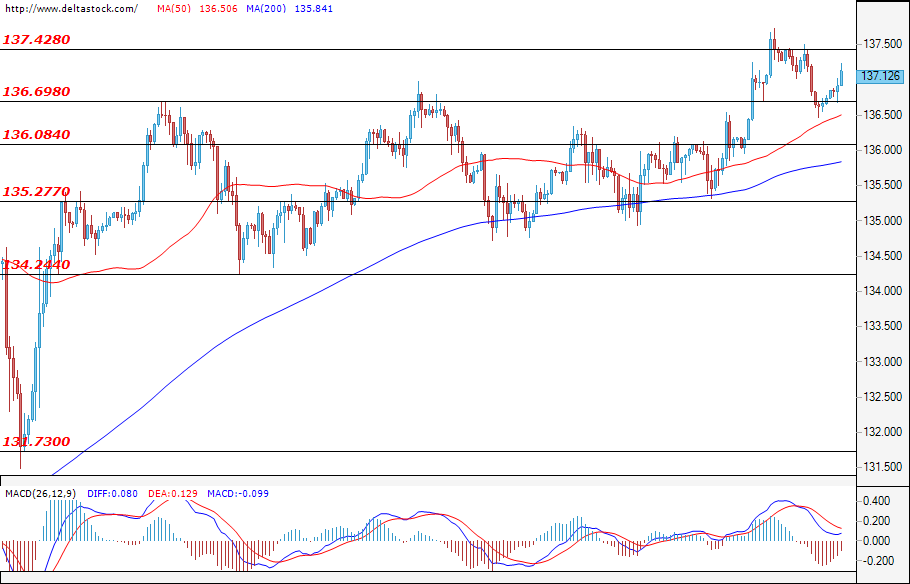
The resistance zone at 137.42 was not overcome in the past trading session, but as it stands, the most likely scenario is for another attack by the bulls. The bearish sentiments for the Japanese yen remain in place, with the possibility of a negative correction and a possible test of the first significant support area at 136.70, with the aim of finding better market entry levels. A possible deepening of the sell-off for the U.S. dollar could lead the trade towards a range move between 134.24 – 136.70.
GBP/USD
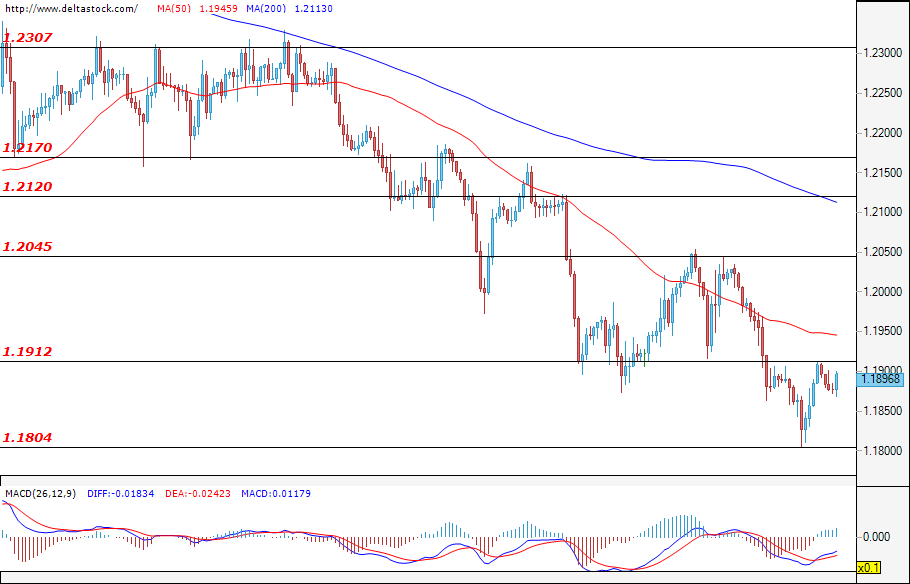
After the bears failed to breach the support zone at 1.1800 at the beginning of yesterday's trading session, a slight recovery and a test of the zone at 1.1900 followed. The bulls failed to gather enough momentum to break through the mentioned resistance, but the most likely scenario is for another test of this level. A successful breach could take the trade towards the next significant resistance area at 1.2045. Today, the announcement of the UK's GDP data will be in focus for investors, with a possible rise in volatility for the currency pair following suit.
EUGERMANY40
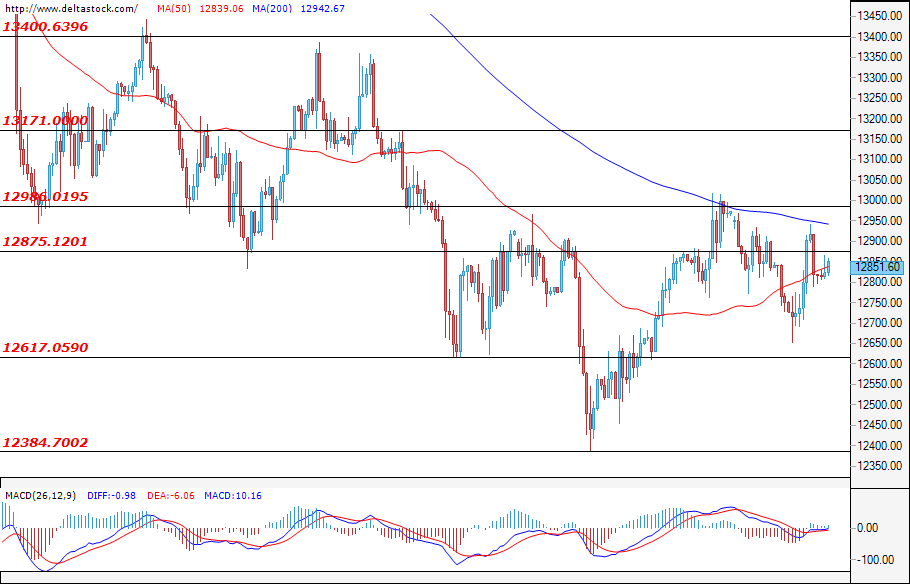
The situation from yesterday's trading session has not changed much, with the German index facing a test of the resistance zone at 12875 after the bears failed to test the support zone at 12617. The momentum gathered by the bulls could help them to overcome the mentioned resistance. In such an optimistic scenario, we could expect further appreciation towards the next significant level at around 13000. Data on the inflation levels in Germany (today; 06:00 GMT) could have an impact on the volatility of the index.
US30
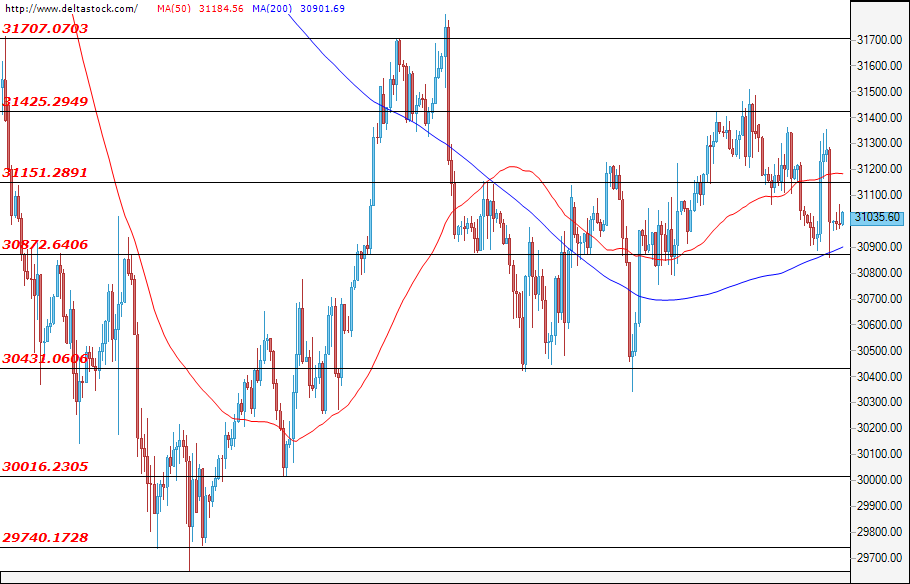
During yesterday's trading session, the U.S. blue-chip stock index failed to breach the support at 30872, and at the time of writing, we are observing a consolidation at around 31000. We may see a recovery and a test of the significant resistance area at around 31400, but the overall sentiment coming from the higher time frames remains negative. The high volatility from the past session will also continue today, with the news mentioned in the EUR/USD analysis taking the main credit.
Crude Oil Forming Another Wedge – Elliott Wave Analysis
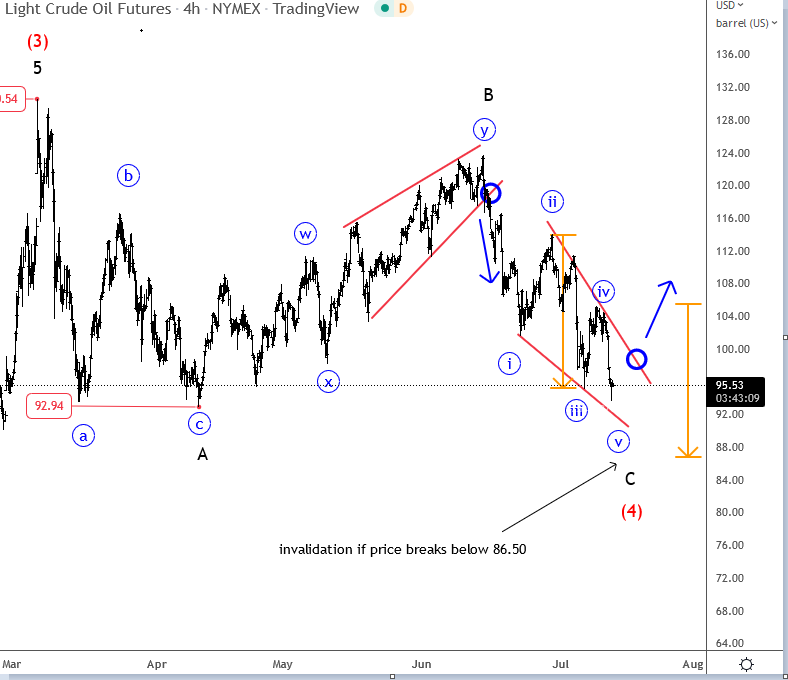
Crude oil is coming nicely down in the 4-hour chart after we spotted a wedge pattern within wave (Y) of B. So, we are now tracking wave C of a higher degree countertrend price action. We are talking about wave (4) that can be a flat rather than a triangle after recent break to a new intraday low. In fact, drop from 124 can be now counted in five waves, but it's seen as an ending diagonal. That's a reversal pattern that suggests that weakness can be limited. If we respect the price action and the wedge into 124.00, then confirmation for a turning point should be the same; a broken upper line that can put bulls in play (blue circle). Be patient here!
Big picture
Crude oil is bullish when looking on monthly and daily charts, but we can see it now in a higher degree corrective slow down, which can be wave four within an uptrend. There is a chance for a 2008 high retest before the market finally slows down.
EUR/USD Remains in Danger of Breaking Below Parity
Markets
Core bond yields in Europe closed at or slightly below key support levels yesterday. For Germany’s 10y reference (-11.4 bps, 1.13%), this meant the 1.12%/1.15% area. Other changes ranged from -8.7 bps to 13.1 bps, flattening the curve. European swap yields lost between 8.4 bps and 12.5 bps with the 10y having finished below 1.99% (23.6% retracement of the March 2020 – June 2022 uptrend). US Treasuries underperformed, paring some gains after a mediocre US 10y auction that tailed and produced the weakest demand since 2020. A US CPI report (officially due today) showing that inflation reached 10.2% in June also weighed on bonds. The Bureau of Labor Statistics later dismissed the release as a forgery but it nevertheless put markets on edge. US bond yields inched 1.3 bps to 3.8 bps lower with the belly of the curve outperforming wings. FX markets were constantly eyeballing EUR/USD. The pair tested parity in European dealings after which technical return action higher kicked in. The combination eventually ended the day almost unchanged at 1.0037. The trade-weighted DXY rose a bit further beyond 108 though off intraday highs. EUR/GBP finished flat at 0.844. Japan’s yen and the Swiss franc remained the better bid ones with (equity) sentiment still fragile. European stocks were able to ditch the red for a close in the green (0.44%) but Wall Street ended about 1% lower (Nasdaq). Brent oil closed without triple digits for the first time since April.Asian markets were served a double central bank meeting (see headlines below). Stocks are digesting it well, rising in most cases somewhere between 0.2-1.5%. Currency markets are inconclusive. GBP, CAD (ahead of a super-sized 75 bps hike?!) and AUD slightly outperform peers, JPY lags. EUR/USD sticks around 1.003. Core bonds trade sideways in the run-up to the (real) CPI release. Consensus is for a further rise in the June headline figure from 8.6% to 8.8% via a strong 1.1% m/m increase. Core inflation should ease further from 6% to 5.7% (0.5% m/m). Persistently high inflation and a bold Fed is what kept US real yields - contrary to Europe - afloat in recent weeks. But given the current growth mindset in markets, we think it’ll take a major upward surprise to rekindle the upward momentum for markets to price in even more Fed action than they currently do. It may however put a more solid bottom below US yields than in Europe, bringing another round of UST underperformance. We therefore don’t expect the dollar to backtrack anytime soon either. EUR/USD remains in danger of breaking below parity with next references at 0.96 and 0.823. A bounce back north of 1.035 is needed to call off the immediate downside alert but as long as the energy/natural gas story is running, we consider this unlikely. Sterling this morning profits from a batch of better-than-expected industrial data. EUR/GBP edges lower towards 0.842, the lowest level since mid-May.
News Headlines
The Bank of Korea as expected to stepped up the pace of its rate hikes from 25 bps to 50 bps, bringing its policy rate (7-day repo rate) to 2.25%. At 6.0% Y/Y in June (core 4.4%), inflation remains well above the 2% target. The BOK forecasted that CPI will remain high at 6%+ (core 4%+) for some time and run substantially above the May forecast of 4.5% for the year overall. But growth will probably stay below the 2.7% forecast. BOK governor Rhee Chang-yuong said at the news conference that it is likely to be appropriate to return to a pace of 25 bps rate hikes going forward. The market view for the policy rate to reach 2.75%/3.0% by the end of the year was ‘reasonable’. The Korean won this morning trades slightly stronger at USD/KR 1304, but remains close to yesterday’s cycle low of 1316.
AUD/USD Daily Report
Daily Pivots: (S1) 0.6720; (P) 0.6749; (R1) 0.6788; More...
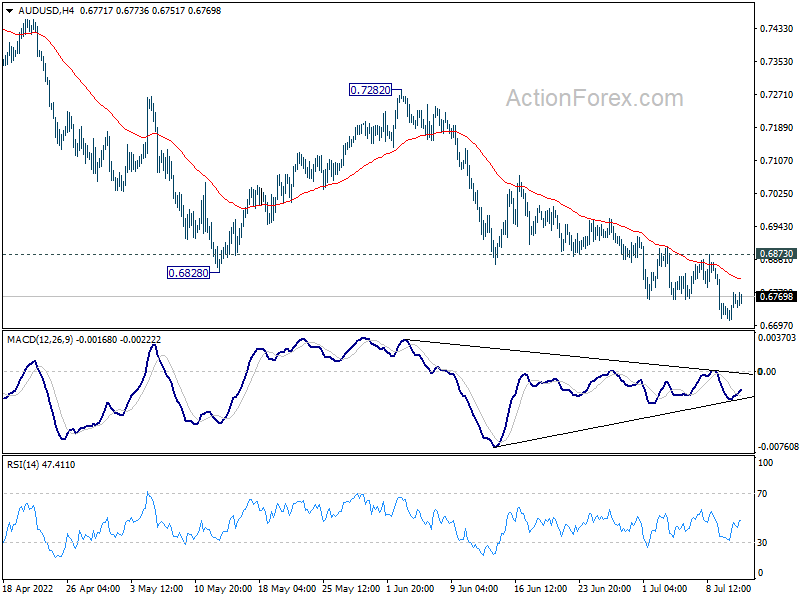
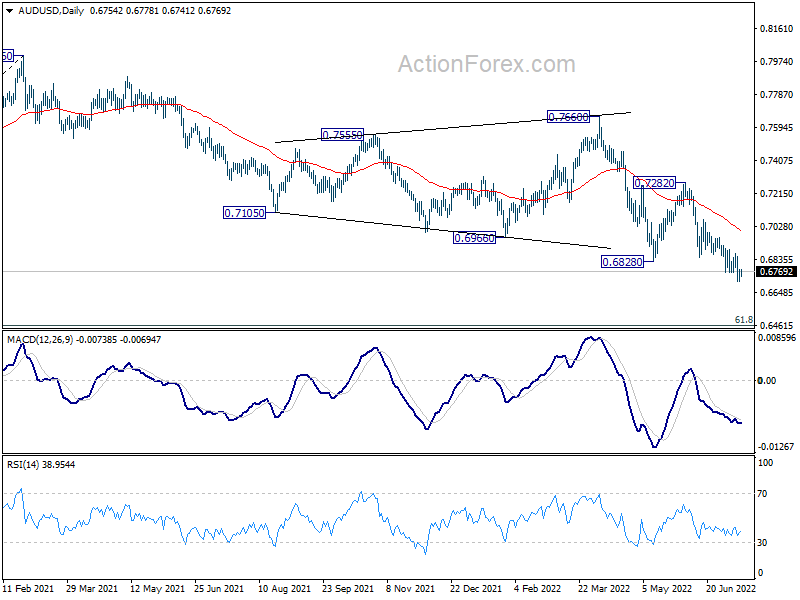
Further decline is expected in AUD/USD with 0.6873 resistance intact. Current down trend from 0.8006 should target next fibonacci level at 0.6461. On the upside, break of 0.6873 minor resistance will turn bias neutral and bring consolidations first. But outlook will remains bearish as long as 0.7282 resistance holds, in case of rebound.
In the bigger picture, price actions from 0.8006 could still be a corrective pattern to rise from 0.5506 (2020 low). But current downside acceleration is raising the chance that it's a bearish impulsive move. In either case, outlook will remain bearish as long as 0.7282 resistance holds. Next target is 61.8% retracement of 0.5506 to 0.8006 at 0.6461.
USD/CAD Daily Outlook
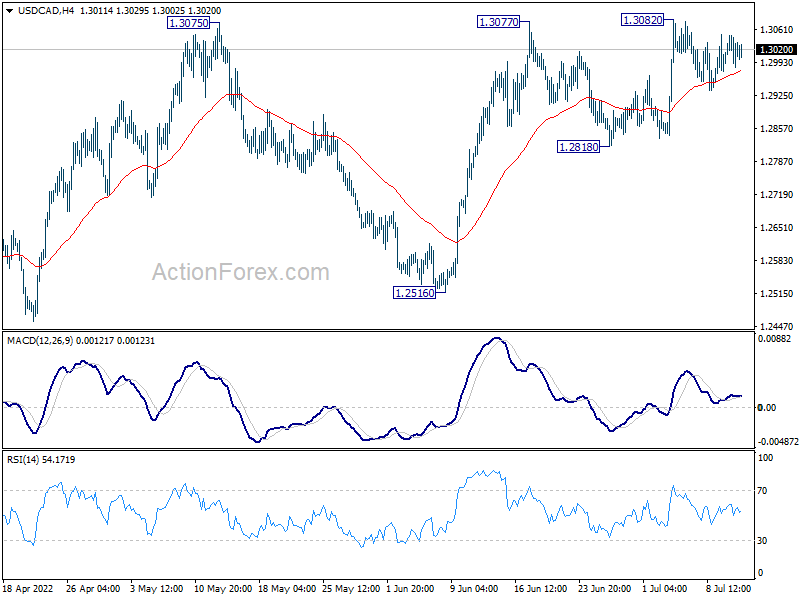
Daily Pivots: (S1) 1.2988; (P) 1.3019; (R1) 1.3055; More...
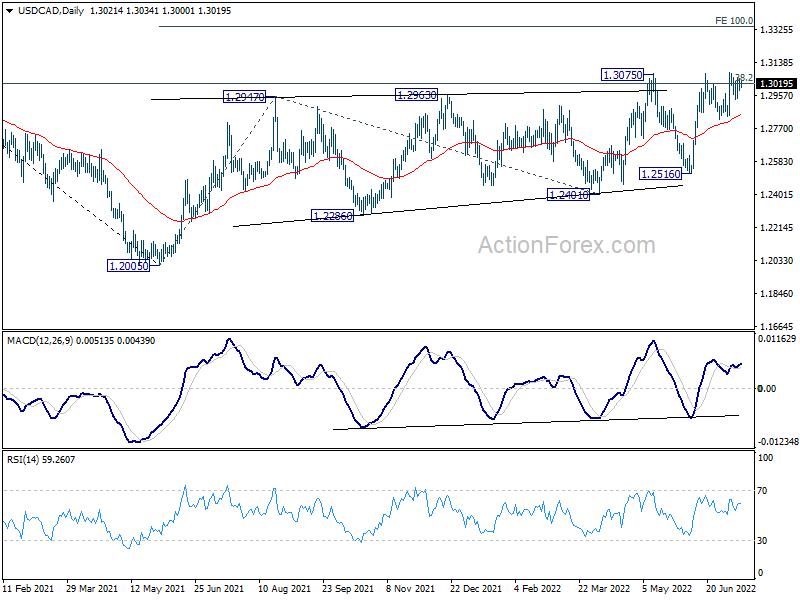
Intraday bias in USD/CAD remains neutral for the moment. Further rise is mildly in favor with 1.2818 support intact. On the upside, break of 1.3082 and sustained trading above 1.3022 fibonacci level will carry larger bullish implications, and bring up trend resumption. Next target is 100% projection of 1.2005 to 1.2947 from 1.2401 at 1.3343. On the downside, break of 1.2818 minor support will bring deeper fall back to 1.2516 support instead.
In the bigger picture, focus stays on 38.2% retracement of 1.4667 (2020 high) to 1.2005 (2021 low) at 1.3022. Sustained break there should confirm that the down trend from 1.4667 has completed after defending 1.2061 long term cluster support. Further rise would then be seen towards 61.8% retracement at 1.3650. However, rejection by 1.3022 will maintain medium term bearishness.
EUR/USD Daily Outlook
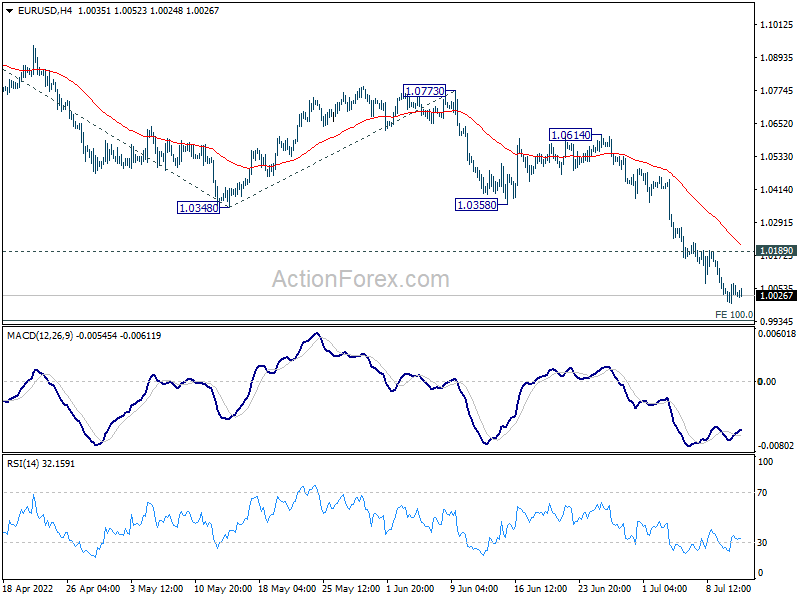
Daily Pivots: (S1) 1.0000; (P) 1.0037; (R1) 1.0074; More...
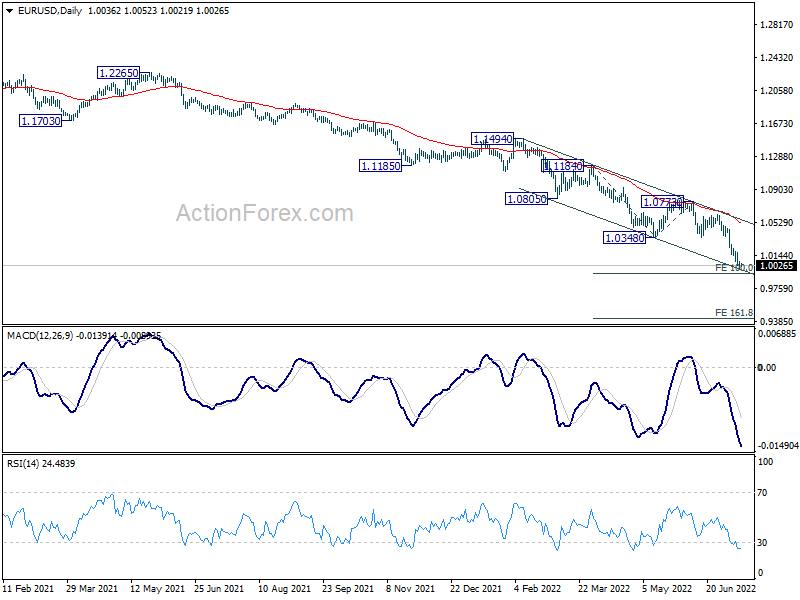
Further decline is expected in EUR/USD with 1.0189 minor resistance intact. Current down trend should target 100% projection of 1.1184 to 1.0348 from 1.0773 at 0.9937. Firm break there could prompt downside acceleration to 161.8% projection at 0.9420. On the upside, break of 1.0189 minor resistance will turn bias back to the upside for stronger rebound.
In the bigger picture, down trend from 1.6039 (2008 high) is still in progress. Next target is 100% projection of 1.3993 to 1.0339 from 1.2348 at 0.8694. In any case, outlook will stay bearish as long as 1.0773 resistance holds, in case of rebound.
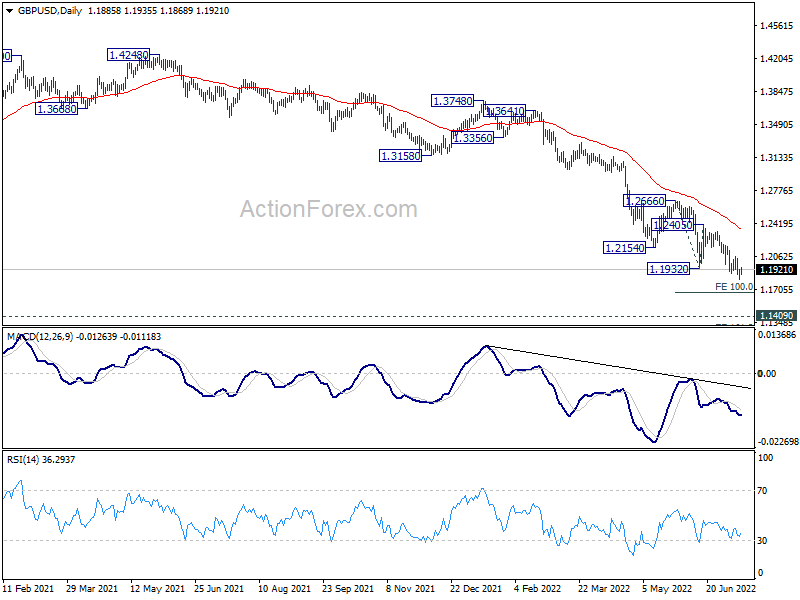
GBP/USD Daily Outlook
Daily Pivots: (S1) 1.1827; (P) 1.1932; (R1) 1.1998; More...
Intraday bias in GBP/USD is turned neutral again with current recovery. But further fall is expected with 1.2055 resistance intact. Break of 1.1806 will resume larger down trend to 100% projection of 1.2666 to 1.1932 from 1.2405 at 1.1671. Decisive break there will target a test on 1.1409 long term support. On the upside, above 1.2055 minor resistance will now indicate short term bottoming, and turn bias to the upside for stronger rebound.
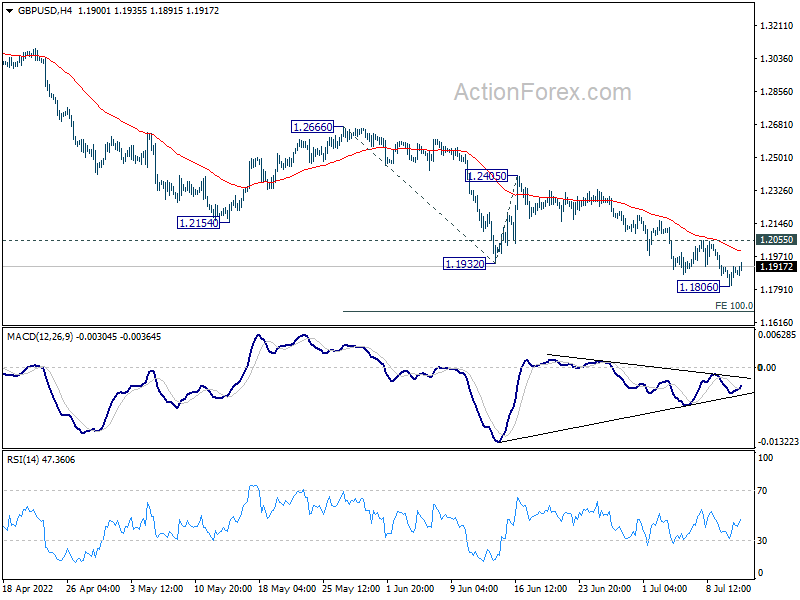
In the bigger picture, fall from 1.4248 (2018 high) could be a leg inside the pattern from 1.1409 (2020 low), or resuming the longer term down trend. Deeper decline is expected as long as 1.2666 resistance holds. Next target is 1.1409 low. However, firm break of 1.2666 will bring stronger rise back to 55 week EMA (now at 1.3065).