Sample Category Title
Canadian Dollar Eyes BoC, US Inflation
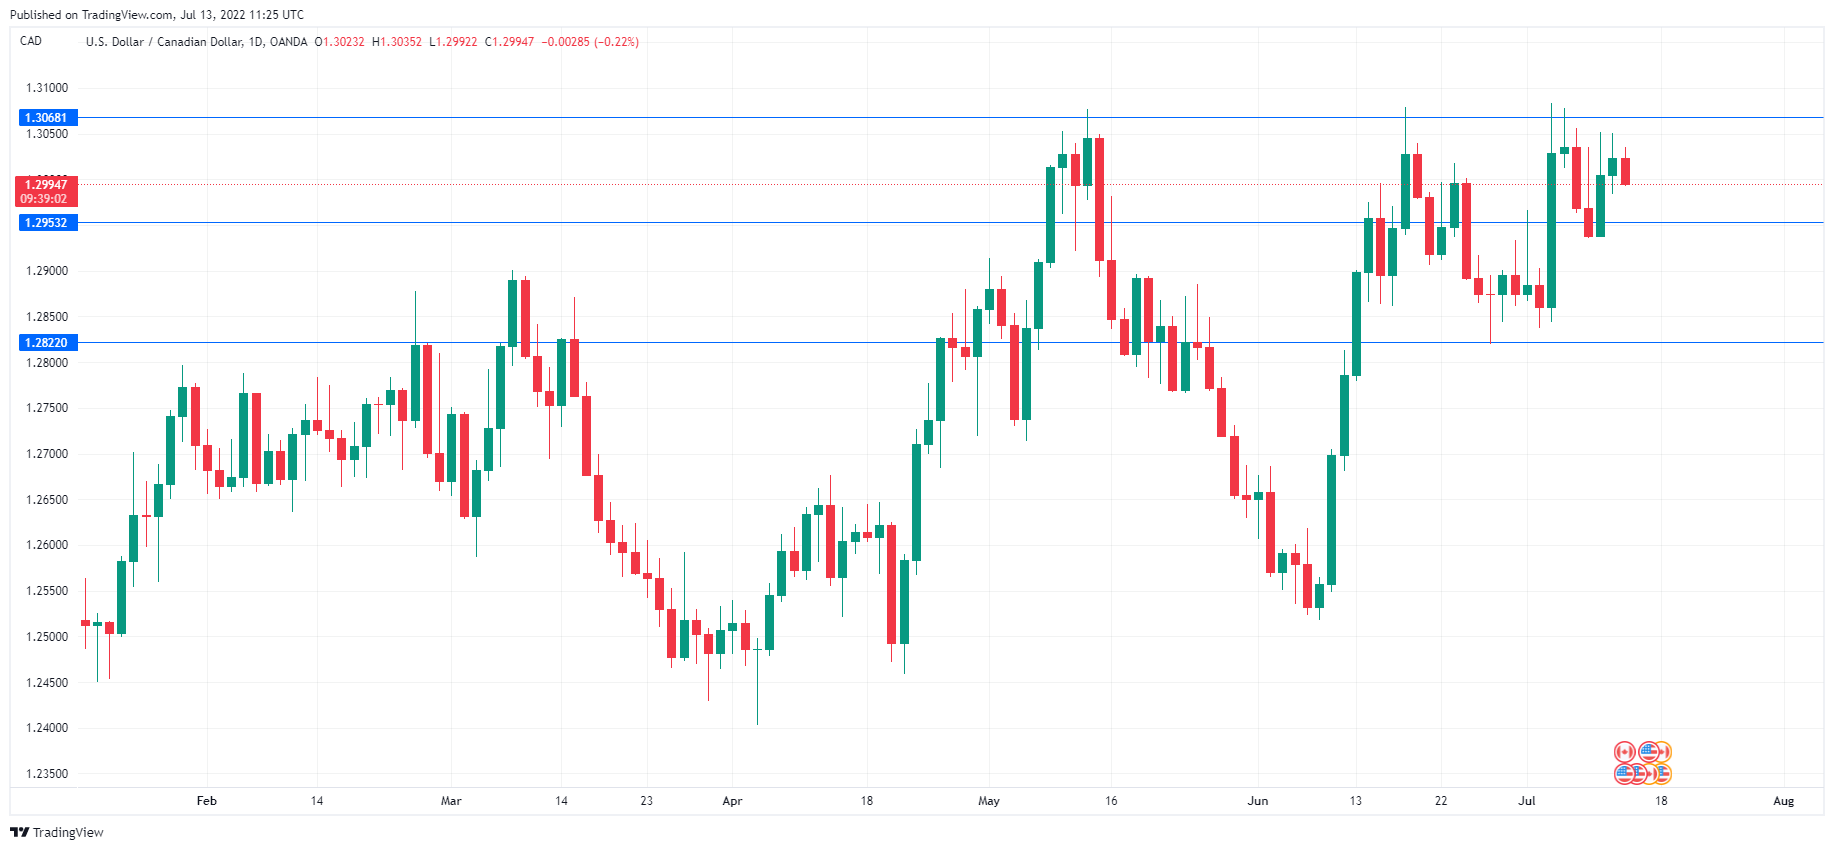
USD/CAD is trading quietly at the 130.00 line, with a busy day ahead. The Bank of Canada holds its rate meeting and the US posts the June inflation report.
Bank of Canada could deliver 75bp salvo
The Bank of Canada is expected to press the pedal to the gas later today, with the markets expecting a supersize 75bp hike. This would bring the cash rate to 2.25%. Similar to the Fed, the BoC is showing that it can be aggressive with its rate policy as it pulls out all the steps to curb enemy number one, which is runaway inflation. In May, Canada’s inflation rate rose to 7.7%, a four-decade high. Inflationary pressures have been broad-based, raising fears of inflation expectations becoming unanchored.
A massive 75bp move by the BoC should give a boost to the Canadian dollar, but the gains could be modest if the market has fully priced in the move. As well, today’s US inflation report could affect the direction of USD/CAD in the North American session.
In the US, the June inflation report is being eagerly anticipated by the financial markets. Headline inflation is expected to rise to 8.8% YoY, up from 8.6% in May. Core CPI is expected to ease to 5.8%, down from 6.0%. If the numbers are higher than expected, market reaction will be negative and the dollar should get a boost. Conversely, if inflation is lower than expected, it will raise hopes that inflation has peaked, raising risk sentiment and likely pushing the dollar lower.
The inflation report could play an important role in Fed decision-making ahead of the July 27th rate meeting. The Fed is widely expected to hike by 75bp at the meeting, but could consider a smaller hike if inflation is weaker than expected, which would make the US dollar less attractive to investors.
USD/CAD Technical
USD/CAD has support at 1.2953 and 1.2822
There is resistance at 1.3068 and 1.3199
NZ Dollar Yawns after Reserve Bank’s Hike
RBNZ delivers 50bp hike
As advertised, the Reserve Bank of New Zealand raised rates by 0.50%, bringing the cash rate to 2.50%. The New Zealand dollar responded with a mere shrug, indicative of the move being priced in by the markets. It wasn’t all that long ago that a 50bp increase was labeled as “massive” and “super-sized”, but now such moves from central banks barely raise an eyebrow, as was the case with the RBNZ decision. With central banks raising rates fast and furiously in order to curb runaway inflation, large rate hikes have become the norm.
The RBNZ has been in an aggressive mode with its rate-hiking cycle, and there is more to come. In May, the central bank forecast a rate peak of around 4% by the end of the year, and market pricing appears to be in sync with this assessment. The Fed is also raising rates aggressively, but higher rates from the RBNZ should prevent a widening of the rate differential and support NZD/USD.
The tightening cycle is yet to bring a peak in inflation, but there are unmistakable signs that New Zealand’s economy is slowing down. Business and consumer confidence indicators point to a weakening in confidence, which could translate into lower spending in the private sector. Homeowners are paying higher mortgage rates due to the rise in rates, which has dampened the housing market.
The US releases the June inflation report later today. The data follows on the heels of a surprisingly strong non-farm payrolls report, which could signal a further acceleration in inflation. If headline CPI remains close to 9.0% YoY, and core CPI around 6%, that would cement a 75bp salvo from the Fed in late July, which would be bullish for the US dollar. Conversely, an easing in inflation would increase the chances of a 50bp move and weigh on the greenback.
NZD/USD Technical
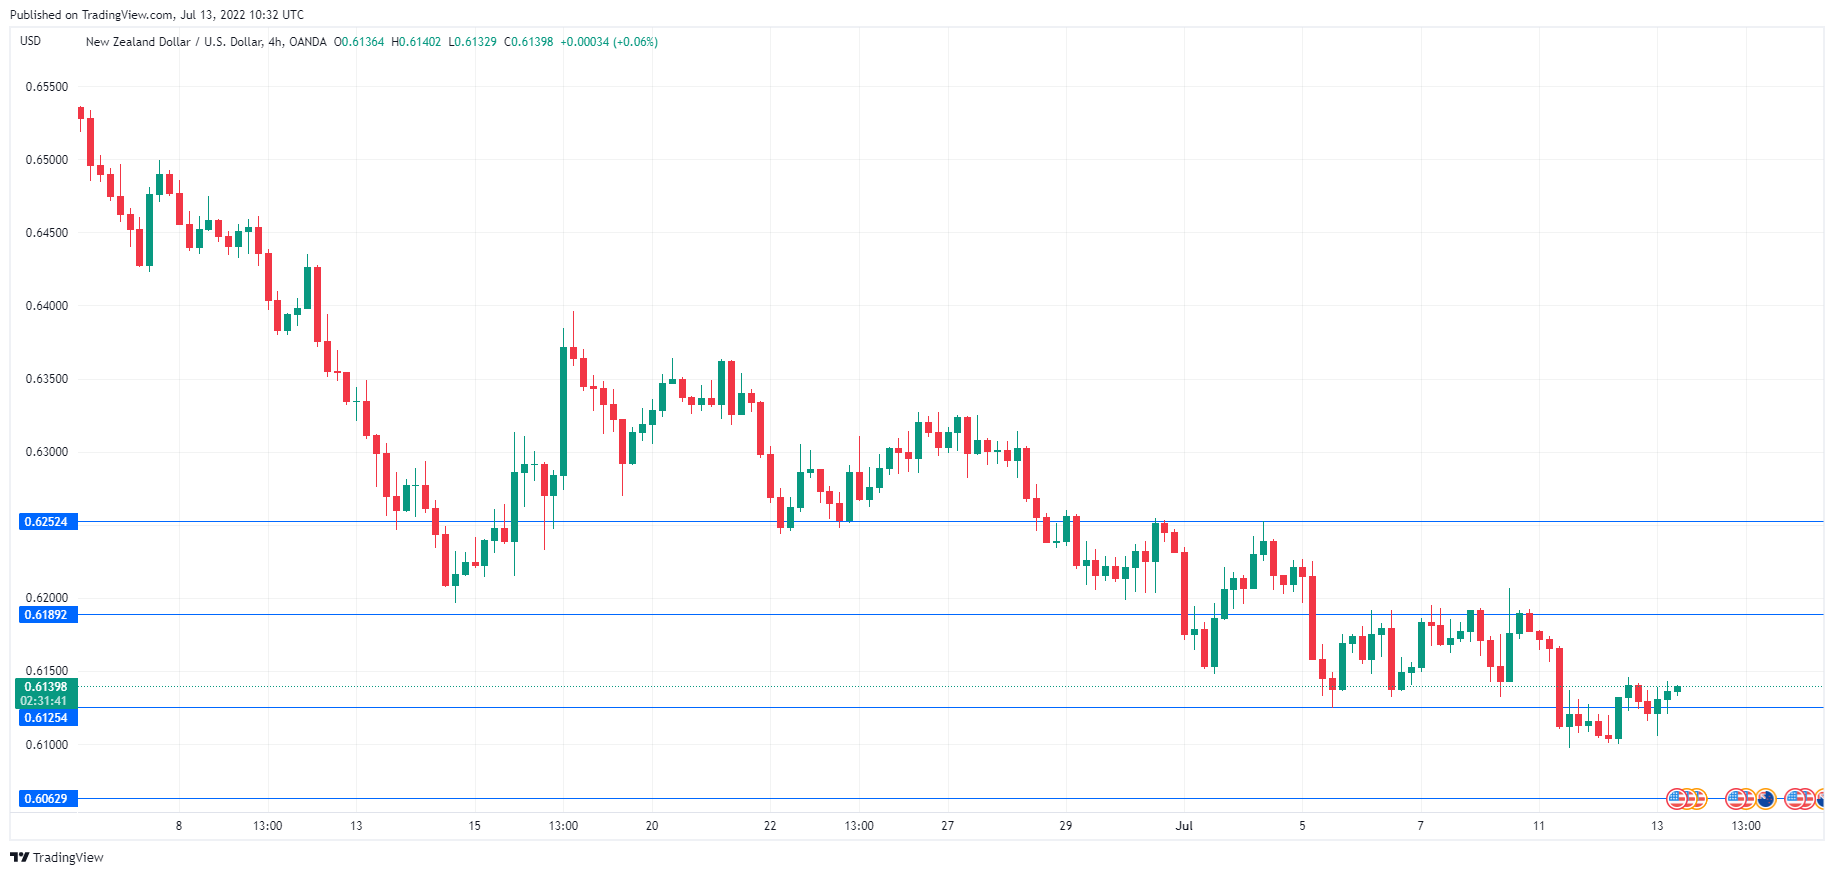
- 0.6125 is a weak support level, followed by 0.6062
- There is resistance at 0.6189 and 0.6252
EURUSD: Life after Parity
Recently, for the first time in two decades, the euro reached parity with the US dollar. Now bulls try so hard to prevent it again, however, it seems like not the end.
What is happening?
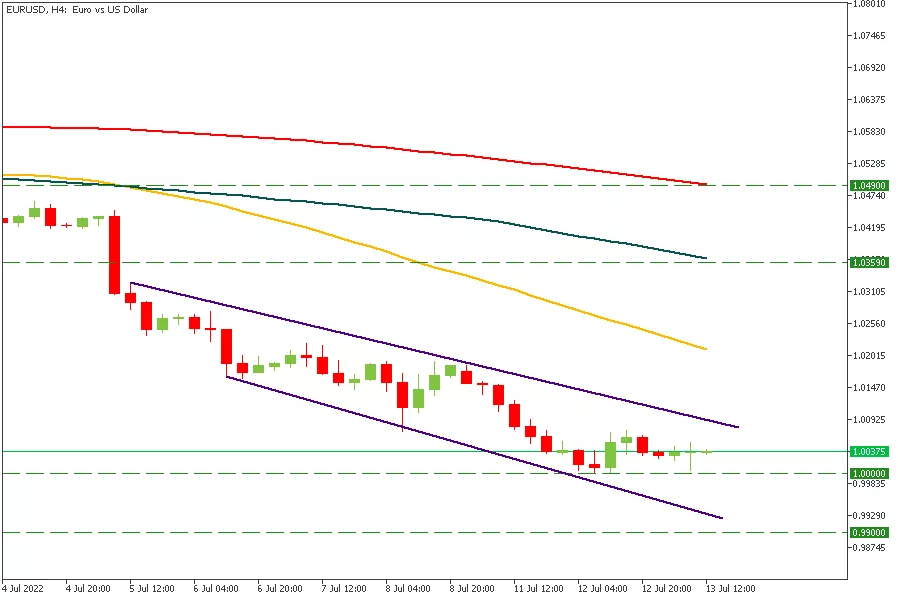
The major currency fell to a one-for-one rate with the US dollar. After that, on Tuesday, EURUSD made a last-ditch effort to prevent the parity again. At the moment, the EUR bounced from the 1.0000 support level and recovered up to 1.00415. However, this boundary could quickly collapse if new concerns about natural gas supplies from Russia or signs of a relatively tighter Fed policy led to a decline in the euro.
It looks like many traders believe that Tuesday's price action is an isolated case of such barrier defense. However, If the level does break, there is a chance that it could drop significantly further. The next long-term target for the currency could be around 90 US cents if the Nord Stream 1 gas pipeline doesn’t resume operation.
How is situation in Eurozone now?
The energy crisis is a huge problem for Europe now. Moreover, there are talks about the chance of recession for Eurozone. A weaker euro exacerbates inflationary pressures in Europe, making imports, especially key commodities, more expensive. And, unlike in the past, a weaker euro isn’t expected to provide much stimulus to the bloc's producers, making exports more attractive abroad. This week, Germany reported its first trade deficit since 1991. Exports from the industrial heartland of Europe declined in May, despite the weakness of the euro.
However, Governing Council member Francois Villeroy De Galhau insisted that it’s not the weak EUR, it’s the strong USD. In fact, he’s got the point. The Fed’s hawking policy made the USD grow every week against other assets, for example, USDJPY isn’t a save-haven anymore and the gold is under $1800.
Future possible ways
Due to the fact that the price is still really close to the 1.0000 level, any economic data releases, related to either the USD or the EUR, and geopolitical news, connected to commodities, can drop EURUSD even lower. The nearest event is US CPI on July 13 can push the USD up, so it’s going to be a real challenge for the EUR.
The major currency pair may reach the December 2002 low near 0.9860. EURUSD has limited downside potential, but a corrective pullback is likely to reverse the bearish trend. We’ll keep an eye on this pair, as it brings pretty unusual options to trade.
Dollar Index: Dollar Could Rally Further if US Inflation Meets Forecasts
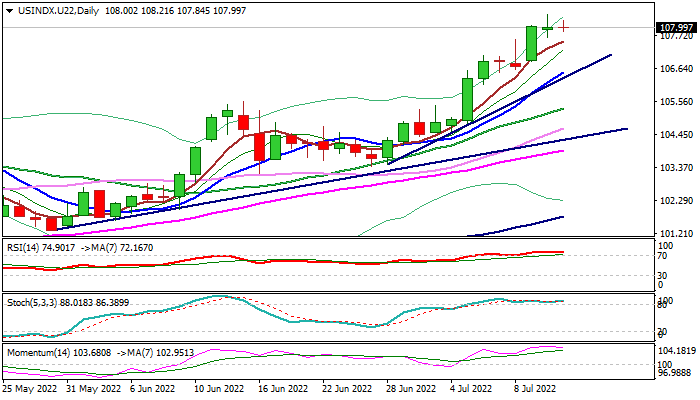
The dollar maintains firm tone and holding near new 20-year high at 108.40 in European trading on Wednesday, with narrow ranges signaling quiet mode ahead today’s key event – release of US June inflation data.
US consumer prices are expected to rise to 8.8% in June from 8.6% previous month, signaling that Fed’s prior kikes are yet to be effective, but add to expectations for another big rate hike this month that would offer fresh boost to the greenback.
Technical studies on daily chart are firmly bullish but overbought that add to signals of consolidation / correction, which could be materialized on lower than expected CPI numbers.
Otherwise, June inflation at or above forecast would continue to provide lift to the greenback, with Euro’s break below parity level to provide additional support for extension towards Oct 2002 high at 108.74 and Sep 2002 peak at 109.67 that would expose psychological 110 level.
Supports at 106.70/50 (bull-trendline / rising 10DMA / Fibo 38.2% of 103.49/108.40) should ideally contain dips and keep bulls intact.
Res: 108.40; 108.74; 109.67; 110.00
Sup: 107.65; 107.34; 106.50; 105.94
Gold Looks for Fresh Signals from US Inflation Data
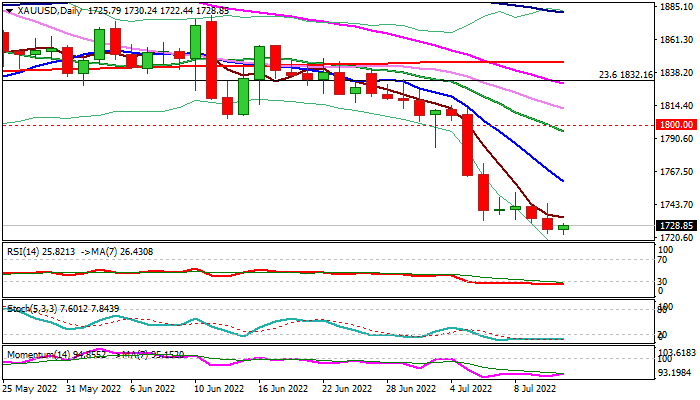
Spot gold is holding near 10-month low and within a narrow range, as traders await release of US inflation figures for June for fresh signals.
The yellow metal is in a steep downtrend from 2022 peak at $2070, posted in March, despite soaring inflation, as recent swift rate hikes made the greenback more attractive instead of zero-yield gold, seen as a hedge against inflation.
Bears eye key supports at $1680 zone (Mar-Aug 2021 higher base / Fibo 38.2% of $1046/$2074 ascend), violation of which would generate reversal signal of larger 2015/2020 uptrend, on completion of a double-top pattern, as well as monthly bull-trap above $2000 barrier.
Today’s data could be crucial for gold, with inflation at forecasted 8.8% in June from 8.6% in May or possibly above expectations would fuel hopes for another Fed’s 0.75% hike in July meeting that would further inflate dollar and increase pressure on metal.
On the other side, gold may benefit from signals that inflation has peaked (June figure below forecast) that would probably deflate Fed’s strong hawkish stance and lift metal’s price.
Bearish scenario sees increased risk of attack at key $1680 support zone that would open way for extension towards $1652 (200WMA) and $1595 (30MMA).
Conversely, gold may bounce on inflation surprise, with violation of initial resistance at $1760 (falling 10DMA) to unmask psychological $1800 barrier, reinforced by falling 20DMA.
Res: 1744; 1752; 1760; 1786
Sup: 1725; 1700; 1680; 1652
GBP/USD Pair is Now Correcting Losses from the $1.2010 Low
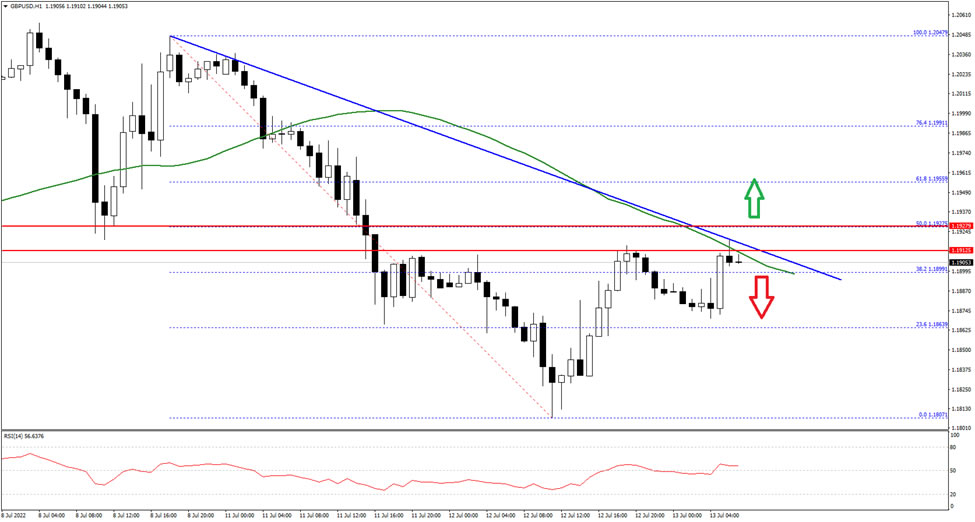
The British Pound started a fresh decline from the 1.2050 resistance against the US Dollar. The GBP/USD pair traded below the 1.20100 support zone to enter a bearish zone.
The pair even declined below 1.1920 and the 50 hourly simple moving average. A low was formed near 1.1807 and the pair is now correcting losses. It climbed above the 1.1880 resistance level.
The first major resistance sits near the 1.1920 zone and a connecting bearish trend line on the hourly chart. If there is a clear upside break above the 1.1920 resistance, the pair could rise steadily towards the 1.2000 level in the near term.
On the downside, an initial support is near 1.1850 on FXOpen. The main support is forming near the 1.1800 level. A break below the 1.1800 support could even push the pair below the 1.1750 support.
Eurozone industrial production rose 0.8%, mom in May, EU up 0.6% mom
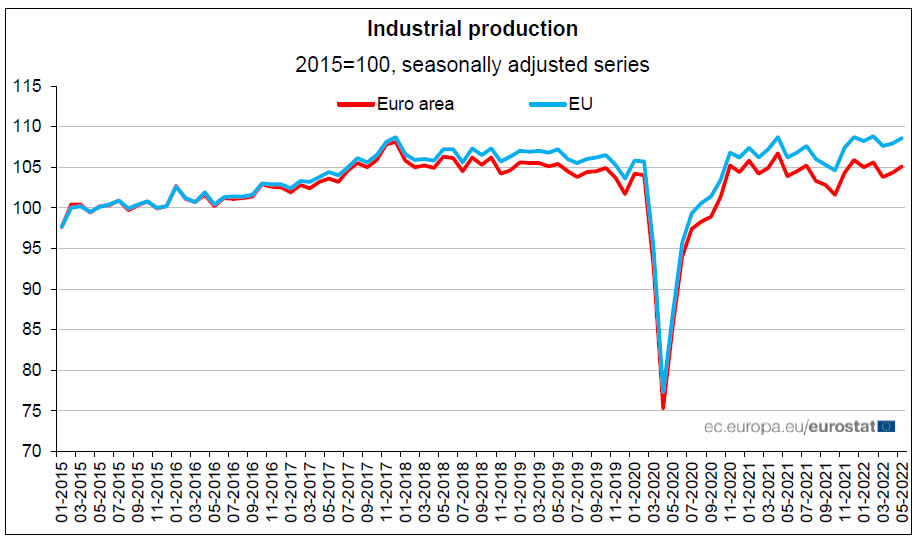
Eurozone industrial production rose 0.8% mom in May, well above expectation of 0.2% mom. Production of non-durable consumer goods rose by 2.7%, capital goods by 2.5% and durable consumer goods by 1.4%, while production of intermediate goods remained unchanged and production of energy fell by -3.3%.
EU industrial production rose 0.6% mom. Among Member States for which data are available, the highest monthly increases were registered in Ireland (+13.9%), Greece (+2.6%) and Czechia (+2.4%). The largest decreases were observed in Lithuania (-7.6%), the Netherlands (-3.3%) and Luxembourg (-2.9%).
NZDUSD Fails to Post Lower Low Below 26-month Bottom
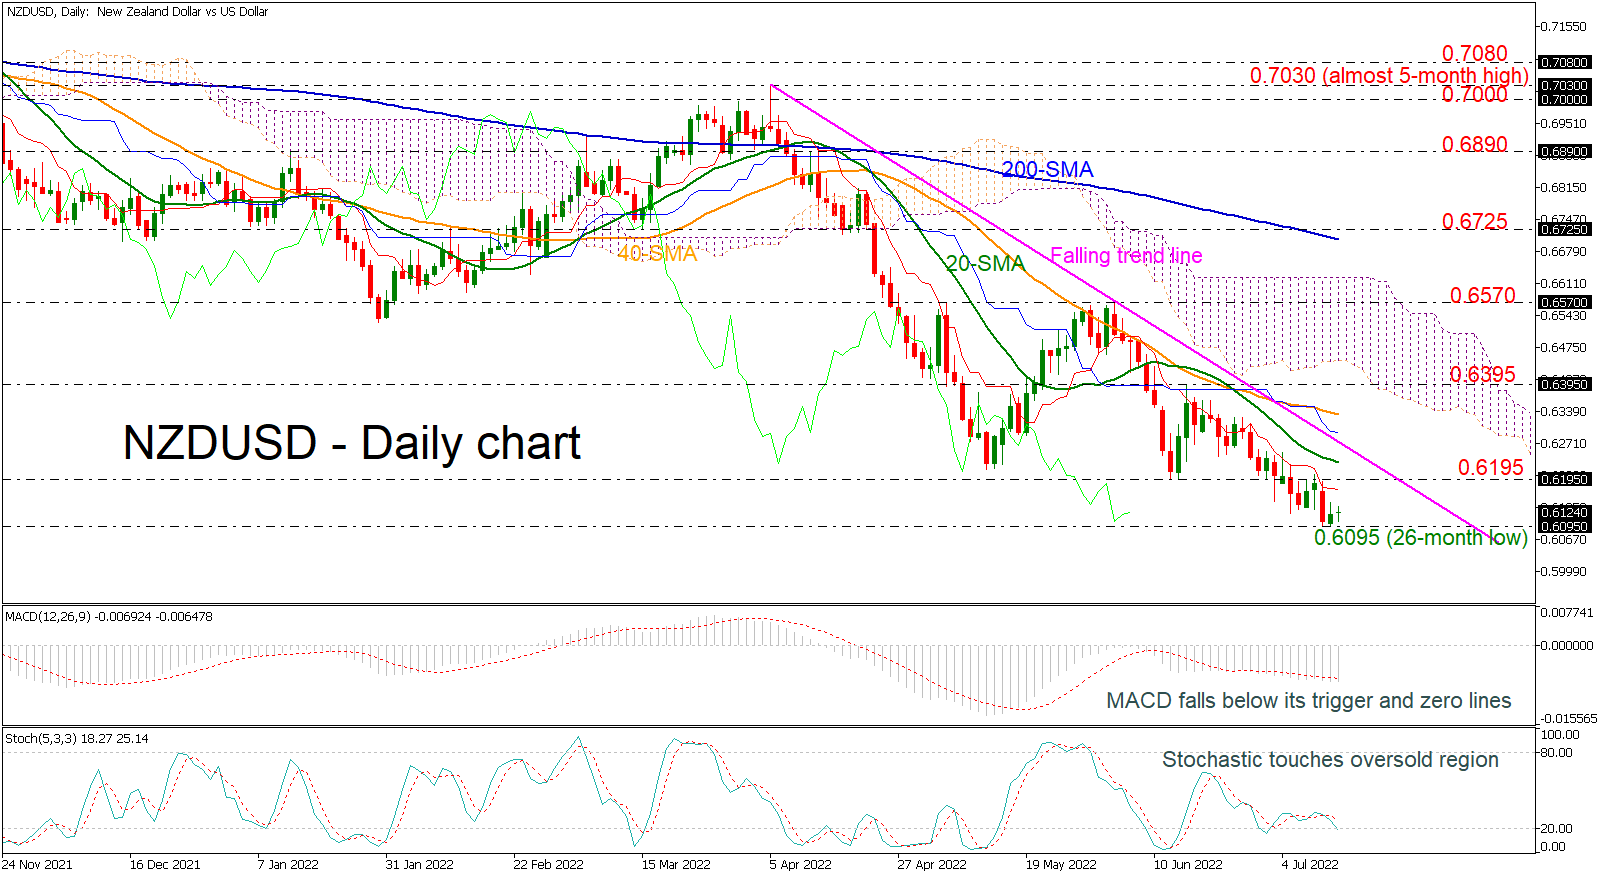
NZDUSD is trading around the vicinity of 0.6095, that being the 26-month low as the pair failed on its third attempt third attempt to breach this level.
Looking to the short-term oscillators, the MACD and the stochastic are promoting negative momentum. The MACD is strengthening below its trigger and zero lines, while the stochastic posted a bearish cross within its %K and %D lines near the oversold territory.
Should buyers drive above the 0.6195 resistance, they could encounter initial strengthened resistance from the 20-day simple moving average (SMA) at 0.6230 and the medium-term descending trend line around 0.6265. A step above may meet further constrictions from the 40-day SMA at 0.6335 and the 0.6395 resistance, which stands near the Ichimoku cloud.
Otherwise, if sellers take control, initial support could come from the 0.6095 barrier ahead of the 0.5920 trough, taken from the low in May 2020.
All in all, the medium-term timeframe is sustaining a bearish mode for now. However, a break above the downtrend line may open the way for a bullish correction.
USDJPY Finds a Foothold ahead of US CPI Inflation
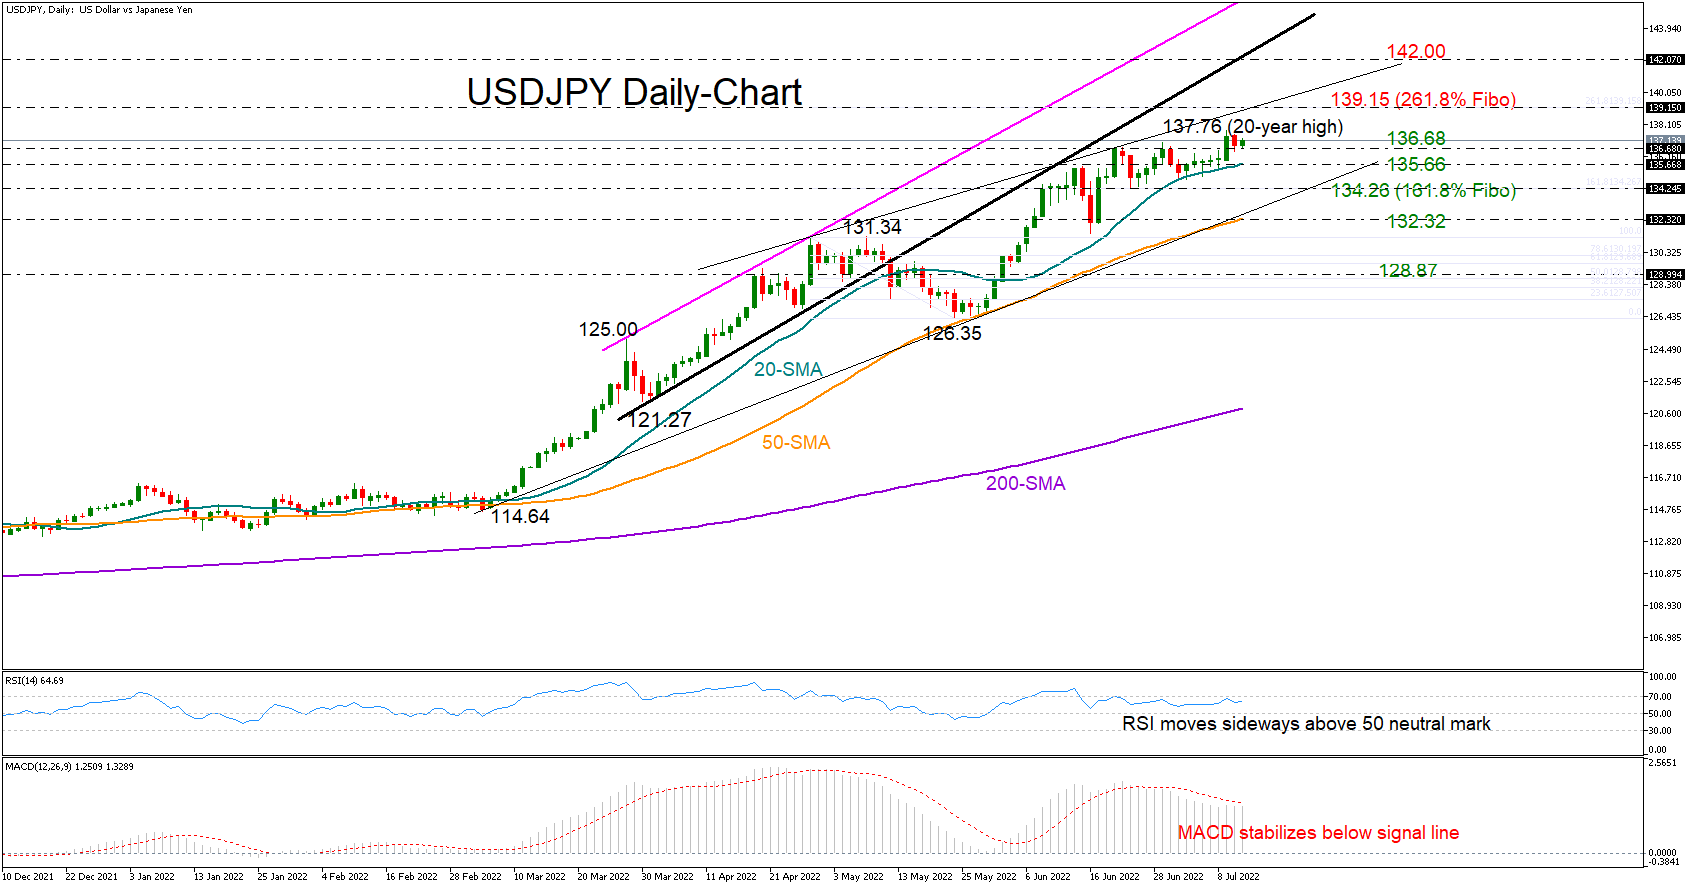
USDJPY geared a bit down after its latest bullish attempt halted at a new 20-year high of 137.76 on Monday.
The good news is that the nearby 136.68 region has immediately switched from resistance to support ahead of the US CPI data due today at 12:30 GMT, buffering downside forces for the second consecutive day. If it stands firm, the price may re-activate its upward trajectory to print a new higher high, likely around 139.15, which is the 261.8% Fibonacci extension of the 131.34 – 126.35 bearish correction. Moving higher, the next obstacle could pop up near 142.00, where the broken support trendline drawn from 121.27 is placed, while beyond that, the way will clear towards the resistance line seen at 147.00.
The bad news is that the momentum indicators are still lacking a clear direction, feeding skepticism about buyers’ dominance. Specifically, the RSI has been oscillating sideways well above its 50 neutral mark since mid-June, while the MACD has barely gained ground over the past week, remaining mostly stable below its red signal line.
Nevertheless, sellers still have some work to do before they claim victory. First, they will need to pierce below the 20-day simple moving average at 135.66 and then close below the 134.26 support zone. If that turns out to be the case, the bearish action could pick up steam towards the tentative ascending trendline at 133.00 and the 50-day SMA at 132.32. Even lower, the decline may initially rest near 128.87 before speeding towards May’s low of 126.35.
Summing up, although upside pressures are currently looking dim, USDJPY could still improve its outlook in the coming sessions if the 136.68 base proves solid.
UK 100 Awaits Breakout
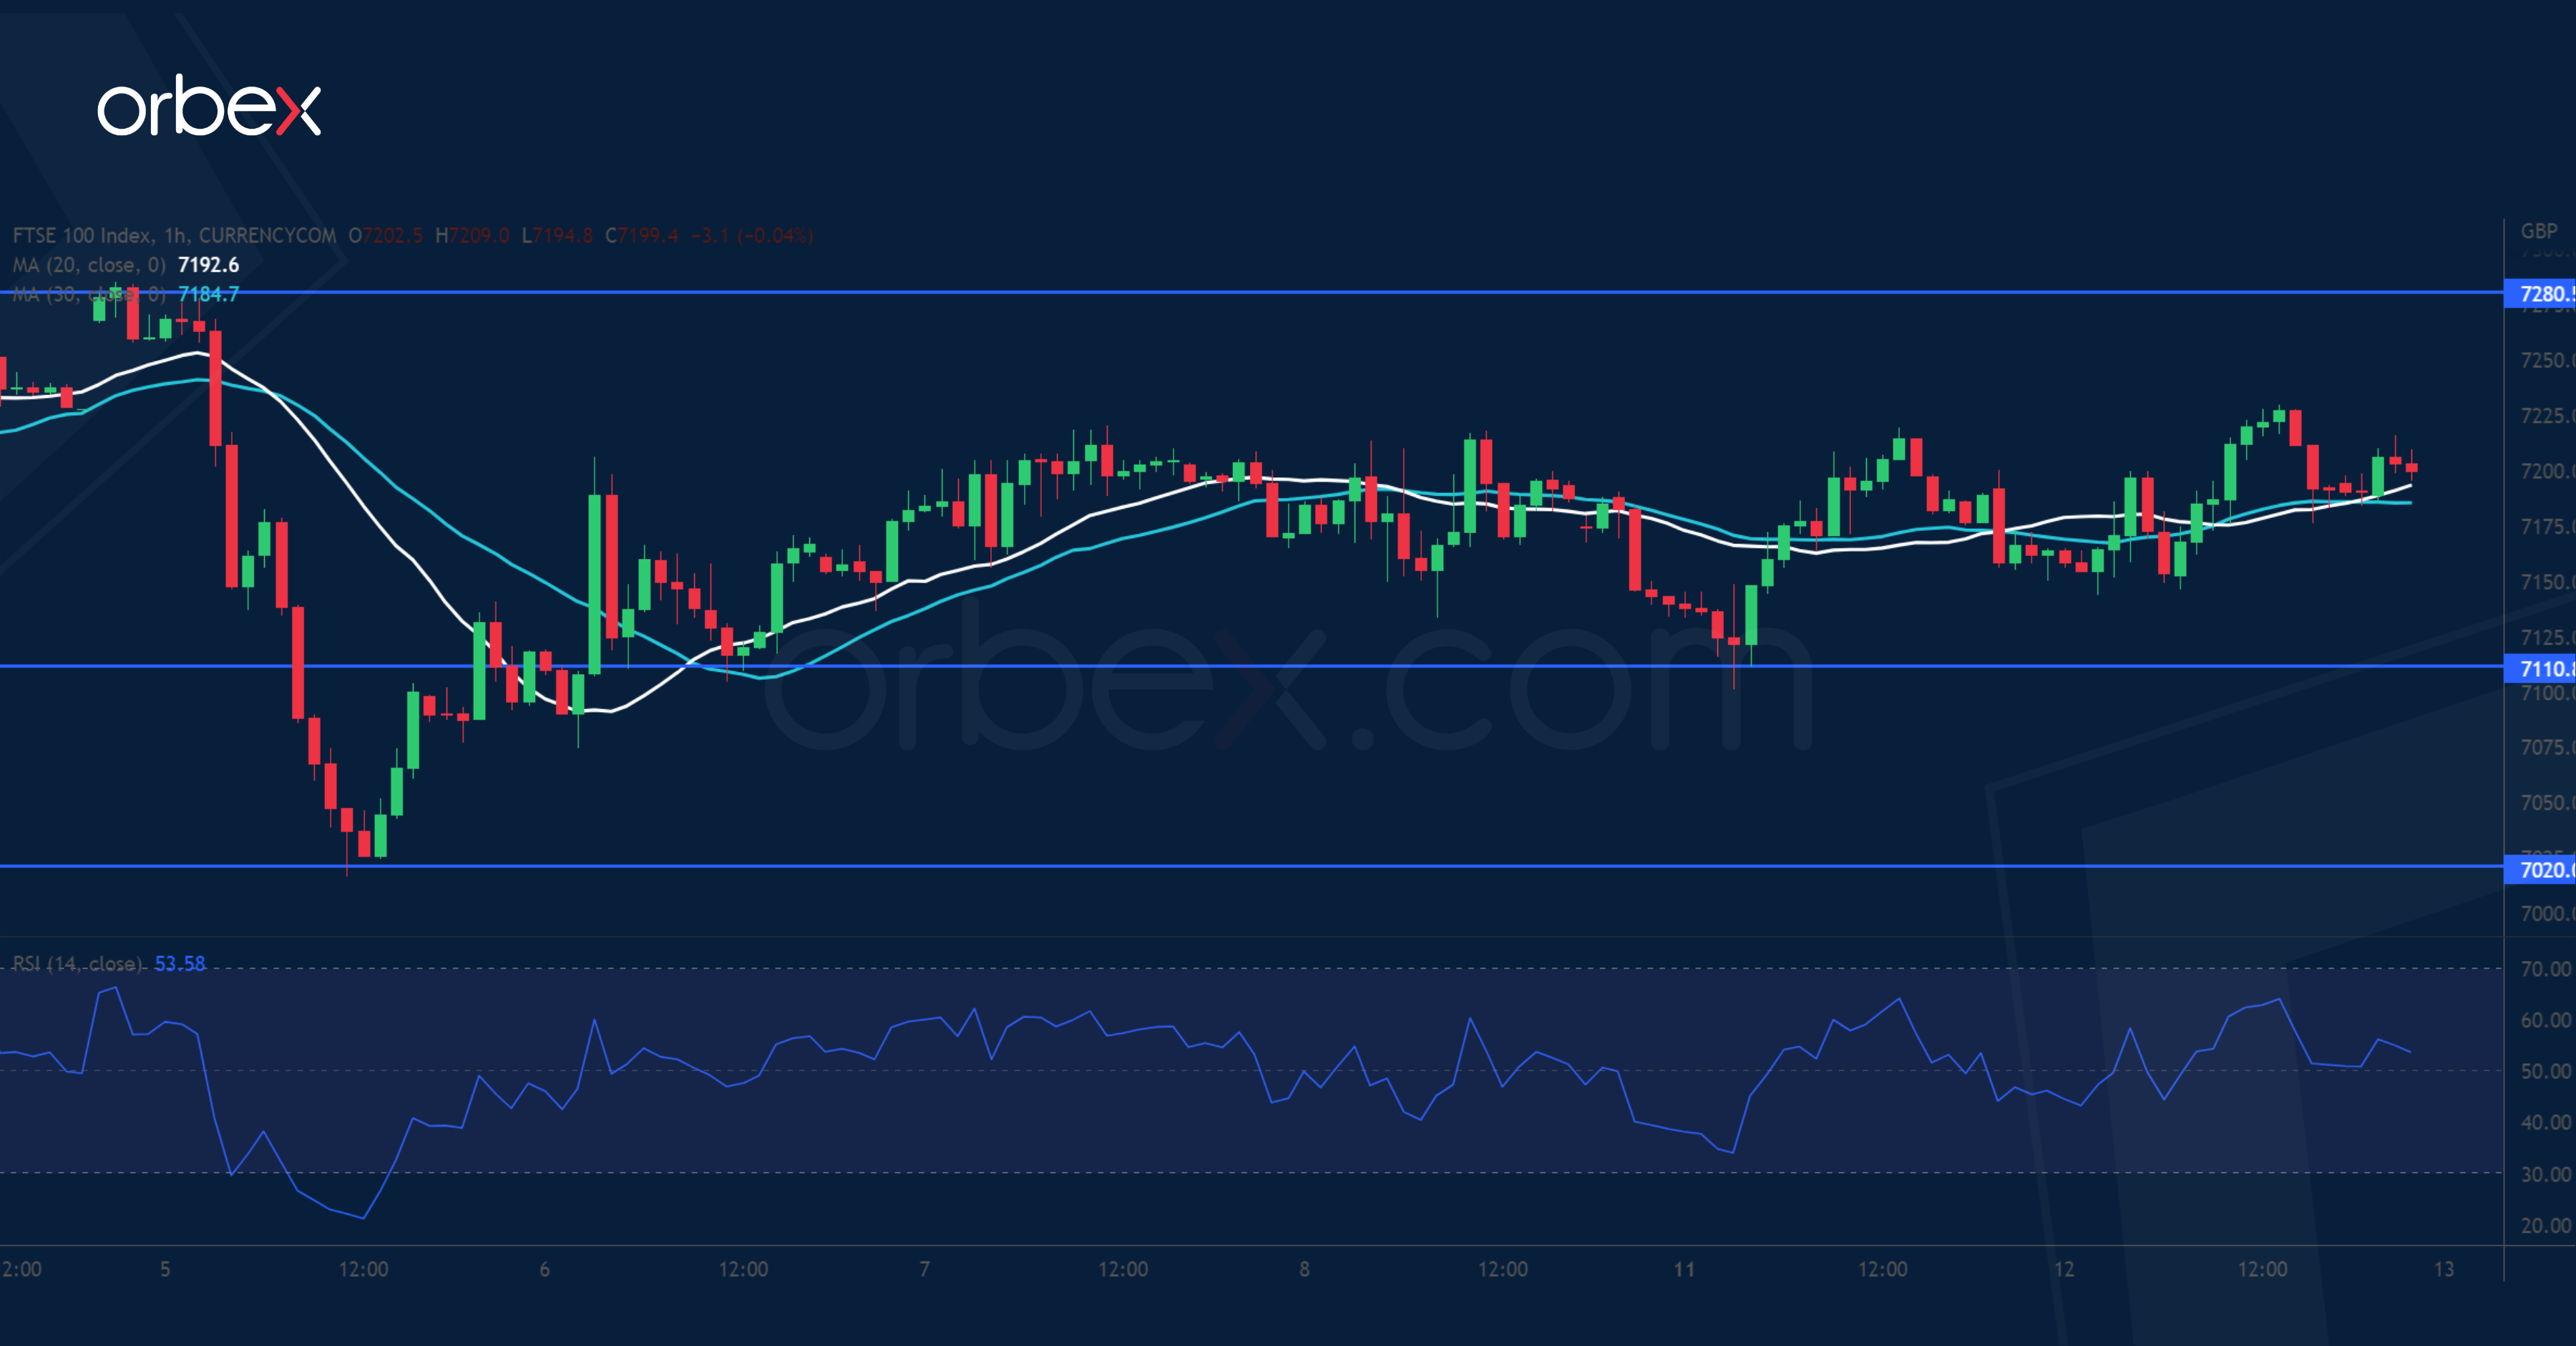
The FTSE 100 weakens as investors remain sensitive to a global downturn. The price action is in a narrowing range between 7020 and 7280 as the bulls strive to hold onto the recent bounce. The upper boundary coincides with the 30-day moving average, making it a key resistance to lift before a sustained recovery could happen. Otherwise, the path of least resistance would be down with 7110 as the first support. A break below 7020 would invalidate the rebound and deepen the correction to March’s low at 6800.