Sample Category Title
The “R” Word
The “R” word is being used more and more as recessionary winds start blowing more loudly through economic data and the price actions across the asset class spectrum. On Friday, US manufacturing and industrial production data were soft. That follows weaker US retail spending and housing market data previously. Even oil prices cracked under the weight of recession noise. A classic case perhaps, of high prices being the best cure for high prices?
US yields eased lower in response as well, but not by much. The US Dollar remained firm while US equities had a mixed session. The Dow Jones edged lower while the S&P 500 edged higher, but the Nasdaq jumped by over 1.40%. One could argue that a recession in the US means less tightening, a boon for the interest-rate-sensitive Nasdaq. But as I mentioned last week, there were a galactic amount of options expiries on US equity markets on Friday, so take the price action with a grain of salt. A US holiday today will keep volumes thin.
In China today, iron ore, steel rebar and coal futures have all plummeted as local markets join the US ones in pricing in a slowdown. Chest thumping over the weekend by China around the Taiwan Strait, and legislation allowing Russian-style “special operations” won’t be giving regional Asia much comfort either.
You can choose from an extensive drop-down menu of recessionary drivers. Rising inflation and interest rates in the developed world, the Ukraine-Russia war and ensuing commodity disruption, the covid-19 slowdown in China, and the list goes on. It is clear that sentiment is turning though and given the appalling track record of forecasting these past couple of years, the more central banks say, “soft landing,” the more nervous markets become, and rightly so.
Unfortunately, with all your monetary bullets fired and stagflation at your doorstep, as a central bank you don’t have any pleasant choices. Do nothing, and inflation continues to rise, but growth may not; expect protests on the streets. Hike rates to dampen inflation but with growth already slowing or falling, you know how the story ends. The best I see it is that the recession, when it arrives, is short and sharp and, at least in much of the developed world, it's starting from a relatively high base.
Asset price volatility is an inevitable consequence as the street tries to price in the next direction of travel. Currency markets are saying the Fed won’t blink on rates. Bond markets are saying that to, although is US 1-years drop back below 3.0%, then perhaps they are wavering. Gold doesn’t seem to care. Oil is cracking like a refining spread, but has yet to reach my longer-term support lines, although we’re not far away. It would be ironic if falling energy prices from a recession torpedoed the funding for Vladimir Putin’s war machine.
Nowhere has been more frantic than the crypto space which endured some emotional volatility over the weekend as expected. Bitcoin fell 15-odd per cent on Saturday as support at $20,000.00 cracked, finishing 7.50% lower for the day at $18,955.00. It rallied yesterday by 8.40% to $20,550.00, only to fall 3.50% this morning after another Solend Labs, which allows you to lend or borrow in something called Solana, granted itself emergency powers to take over a (very) large account to manage its exposure. The more the merde hits the fan in the DeFi space, the less decentralised it seems to be becoming as reality bites. I can’t help but think of George Orwell’s Animal Farm. “All animals are created equal, but some are more equal than others.”
That said, the price action on Saturday looked very much like forced margin stop-outs triggered by the failure of the $20,000.00 support level. Yesterday’s price action suggests that as well. I don’t rule out a rally by cryptos this week as enough lambs appear to have been silenced for now. Equity markets in the real world may also have had the herd thinned enough temporarily.
Leaving central bank-induced speculative exuberance-based digital Ponzi schemes behind, for now, the week is somewhat thin on tier one data. China has left its One and Five-year Loan Prime Rates unchanged today and may have added fire to the local market commodity price falls. Markets appear disappointed that no stimulus crumbs were thrown to the markets, even a 5 or 10 basis point trim of the 5-year LPR. I still contend that China’s biggest short-term threat is more covid-19 lockdowns. I’ll say it till I’m blue in the face, China is unlikely to be “one and done,” and the virus only has to get lucky once under covid-zero.
Elsewhere in the Asia-Pacific, tomorrow's Reserve Bank Of Australia Minutes is released tomorrow, with markets picking over the carcass searching for any clues on the direction of RBA interest rate policy. How high, and for how long, will rates move higher? Friday’s Japan Inflation Rate will have more interest than any time over the last 20 years I expect as the Bank of Japan defied the word and maintained super-easy monetary policy last Friday.
We received a swath of PMI data from across the globe on Thursday. The US calendar sees New Home Sales tomorrow and Existing Home Sales on Friday. Both have downside risks and may add to the recessionary noise. The week’s highlight is likely to be testimony from Fed Chairman Jerome Powell on Wednesday and Thursday. But we also have a plethora of Fed speakers throughout the week as well. With a dearth of tier-1 data, Fed speakers are likely to drive intraday volatility, although it wouldn’t surprise me that after last week’s bonfire, risk assets in general consolidated higher this week. Either way, we can expect plenty of intraday noise, but ultimately directionless volatility this week in my opinion.
Asian equities start the week lower
Asian markets are off to a weak start as the recessionary fears sweeping the US on Friday, continue to weigh on sentiment in Asia. For once Asian markets are not moving in lockstep with the US ones, and I put that down to the distortions of options expiries on Wall Street on Friday. The S&P 500 closed up just 0.22% on Friday, but the Nasdaq leapt 1.43% higher, while the Dow Jones edged 0.16% lower after soft US Manufacturing and Industrial Production data. In Asia, US futures are rising, although with it being a US holiday today, I am not placing too much emphasis on the price action. S&P futures are 0.17% higher, Nasdaq futures are 0.50% higher, while Dow futures are unchanged.
Another outperformer is China, which is well and truly bucking the trend in Asia today. Mainland China markets have reversed sharply higher after China left its 1 and 5-year LPRs unchanged, a counterintuitive move. News that Shenzhen has apparently locked some neighbourhoods in virus curbs should also be a headwind. Nevertheless, the Shanghai Composite is now unchanged, but the CSI 300 has risen by 0.65%, with Hong Kong’s Hang Seng edging 0.15% higher. The price action looks to be “buy at worst” and “smoothing.”
Over in Japan, the Nikkei 225 has fallen by 1.0%, with South Korea’s Kospi slumping by 2.20% today. Taipei is 1.10%, with Singapore remaining unchanged. Kuala Lumpur has lost 1.25%, while Jakarta id 0.90% lower, and Bangkok and Manila have eased by 0.10%. In Australia, falling China resource prices have pushed the ASX 200 down by 0.45%, with the All Ordinaries losing 0.65%.
After such a torrid week last week, a corrective bounce by equity markets cannot be ruled out this week. However, that may have to wait for another 24 hours as US markets are closed today. With nothing on the calendar of note today, European markets may take some solace from lower energy and commodity prices, although European natural gas supplies are tighter than ever as Russian flows reduce.
For US markets, the plethora of Fed speakers this week, including a double-header from Jerome Powell, are likely to drive intraday volatility in the absence of many tier-1 data releases.
US Dollar remains firm but choppy
The US Dollar held onto its intraday gains on Friday, as US bond inflows seemed to support it as investors preferred safety over risk into the weekend and today's US holiday. With the weekend being relatively uneventful, the US Dollar has eased in Asia, but overall continues a pattern of choppy range trading. The dollar index rose 0.82% to 104.65 on Friday, thanks mostly to a weak yen. In Asia, it has eased 0.26% to 104.38. The dollar index has support at 1.0350 with resistance now distant at 1.0570.
EUR/USD eased by 0.56% to 1.0495 on Friday in another 100-point session, climbing by 0.31% to 1.0525 in Asia as weekend hedges are taken off. Dutch natural gas futures prices remain elevated, so the single currency is not receiving much of a boost from last Friday’s oil retreat. It has initial resistance at 1.0600, with challenging resistance at 1.0650. Support is at 1.0450 and 1.0400 now although I note that EUR/USD has based twice at 1.0350. That leaves the door open slightly to a corrective recovery this week.
Sterling has another awful day as its economic picture darkens, falling by 1.10% to 1.2215 on Friday, edging 0.22% higher to 1.2240 in Asia. GBP/USD has initial resistance at 1.2400 and 1.2500, with support at 1.2200 and then 1.1950.
USD/JPY powered higher on Friday as the Bank of Japan left monetary policy unchanged and continues to heavily intervene to cap ultra-low JGB yields. With Japan's inflation only expected to hit 2.50% this Friday, I can’t really blame them, but with the US, Switzerland, the United Kingdom, et al hiking, the interest rate differential continues to power USD/JPY higher. USD/JPY leapt 2.10% higher to 135.00 on Friday, with last week's 131.50 low a distant memory and a bargain for somebody. Having probed 135.45 today, USD/JPY has eased back to 134.85 this morning, as commodity prices fell. It is likely to be only a respite though as unless US yields move sharply lower this week. USD/JPY has resistance at 135.60with support distant at 132.20.
Swings in investor sentiment continue to generate all the two-way volatility in the Australian and New Zealand Dollars. AUD/USD fell 1.60% on Friday to 0.6935 before rising to 0.6955 in Asia. NZD/USD fell 0.80% to 0.6315 on Friday before rising to 0.6330 in Asia. A US holiday is dampening volumes but both Australasians have traced out bottoming patterns on the charts. As long as 0.6850 and 0.6200 hold respectively, further gains to 0.7150 and 0.6450 cannot be ruled out.
On a 24-hour basis, Asian currencies are mostly unchanged today after the losses on Friday, and were mostly unwound this morning. The main reason has been a rally by China’s CNY and CNH after the PBOC left both the 1 and 5-year LPRs unchanged. USD/CNY has fallen 0.60% to 6.6760, while USD/CNH has fallen by 0.50% to 6.6745, dragging USD/Asia lower. Although the KRW, INR, MYR, THB, and IDR look the most vulnerable and remain near last week’s lows, a US holiday today should mean range-trading continues into Wednesday.
Oil slumps on recession fears
Oil prices plummeted on Friday as increasing recession fears after soft US Manufacturing and Industrial Production data saw a mess sell-off in futures markets. Brent crude fell by 5.0% to $113.15 a barrel, but WTI plummeted by 6.0% to $110.00 a barrel. In Asia Brent has edged 0.25% lower to $112.85, while WTI has fallen by 0.75% to $109.20 a barrel.
Looking at the price action, I am undecided whether Friday’s capitulation is the start of a repricing of oil lower as the world economy slows dramatically in the months ahead, or whether it was a capitulation of extended speculative long positioning in the futures markets. Chinese Customs reported record oil imports for May this morning, suggesting demand remains as strong as ever. That remains so around the world, and the squeeze on refined products like diesel and gasoline remain as tight as ever.
Friday’s falls have bought my six-month support lines back into focus. On Brent crude, that is at $107.00 a barrel today, just below its 100-day moving average (DMA) at $107.95. Ahead of this, it has support at $112.00, with resistance at $114.25 and $116.00 a barrel. WTIs six-month support line is at $106.00 a barrel, just ahead of its 100-DMA at 105.00. It has interim support at $108.25, and resistance at $112.50 a barrel.
Of the two, WTI looks the more vulnerable, having fallen further and closed closer to its multi-month support zone. If the US cuts federal fuel taxes, that could be enough to tip the scales lower. It is hard to see either contract moving lower than $100.00 a barrel given the state of the physical market. From a technical perspective though, I would ideally like to see one or both contracts tracing out a couple of daily closes below the support lines mentioned and the 100-DMAs, before reassessing my longer-term bullish outlook.
Gold range continues
It was another wax on, wax off day for gold on Friday as it retraced Thursday’s gains and fell by 0.88% to $1840.00 an ounce on US Dollar strength. In Asia, it has gained slightly by 0.25% to $1845.00 an ounce.
Despite the noise of the past week, it remains anchored in the middle of its one-month range. The overnight price action shows that the inverse correlation to the US Dollar is as strong as ever
Gold has resistance at $1860.00 and $1880.00, the latter appearing an insurmountable obstacle for now. Support is at $1805.00 and then $1780.00 an ounce. Failure of the latter sets in motion a much deeper correction, while I would need to see a couple of daily closes above $1900.00 to get excited about the upside.
GBP/USD Daily Outlook
Daily Pivots: (S1) 1.2141; (P) 1.2254; (R1) 1.2335; More...
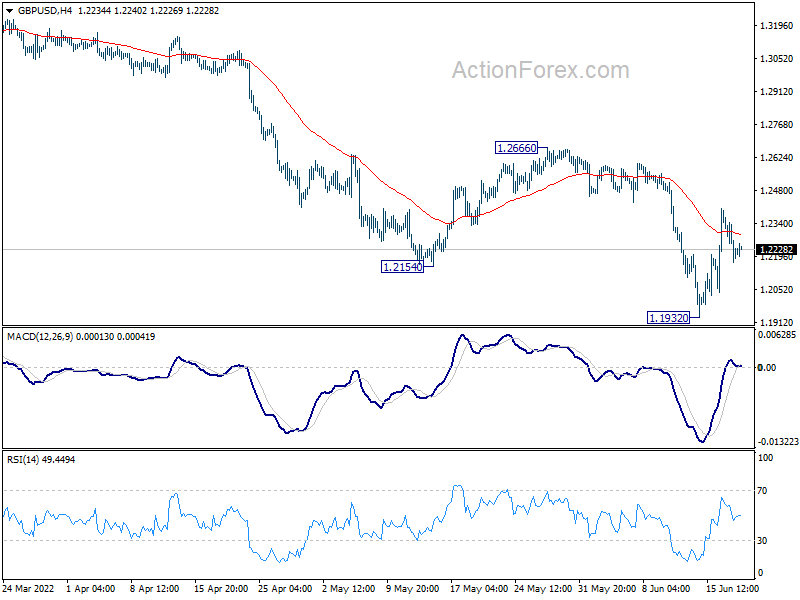
Intraday bias in GBP/USD stays neutral as consolidations continues. But outlook stays bearish as long as 1.2666 resistance holds. On the downside, break of 1.1932 will resume larger down trend from 1.4248. However, firm break of 1.2666 will suggest medium term bottoming and bring stronger rebound back towards 1.3158 support turned resistance.
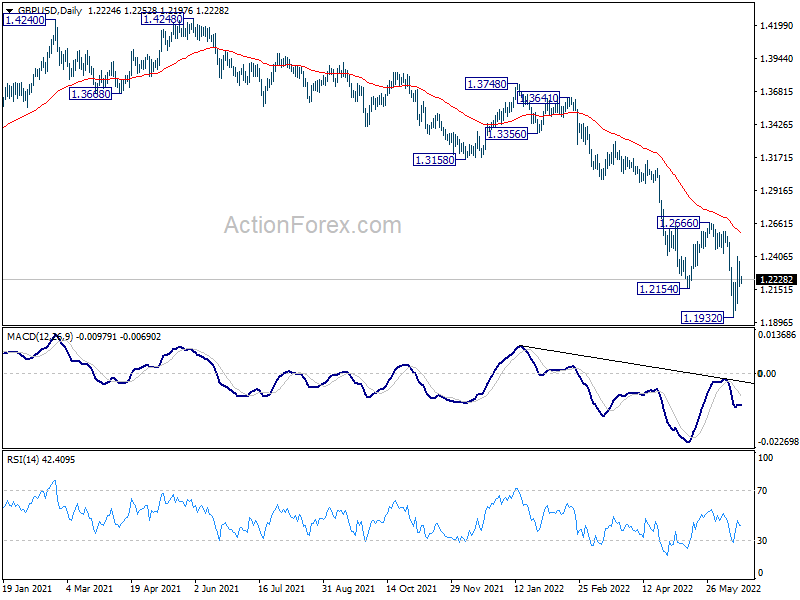
In the bigger picture, fall from 1.4248 (2018 high) could be a leg inside the pattern from 1.1409 (2020 low), or resuming the longer term down trend. Deeper decline is expected as long as 1.2666 resistance holds. Next target is 1.1409 low. However, firm break of 1.2666 will bring stronger rise back to 55 week EMA (now at 1.3175).
Bitcoin Breaks 20k, Sterling Awaits UK Data
Overall markets are rather steady in Asian session today. Even the free falling crytocurrencies are stabilizing slightly. Major Asian indexes, except Nikkei, are treading water. Dollar and Yen are softening slightly with Sterling. Aussie and Euro and mildly higher. But most major pairs and crosses are just stuck inside Friday's range. Sterling would be a focus this week with a string of economic data featured, including CPI, retail sales, and PMIs.
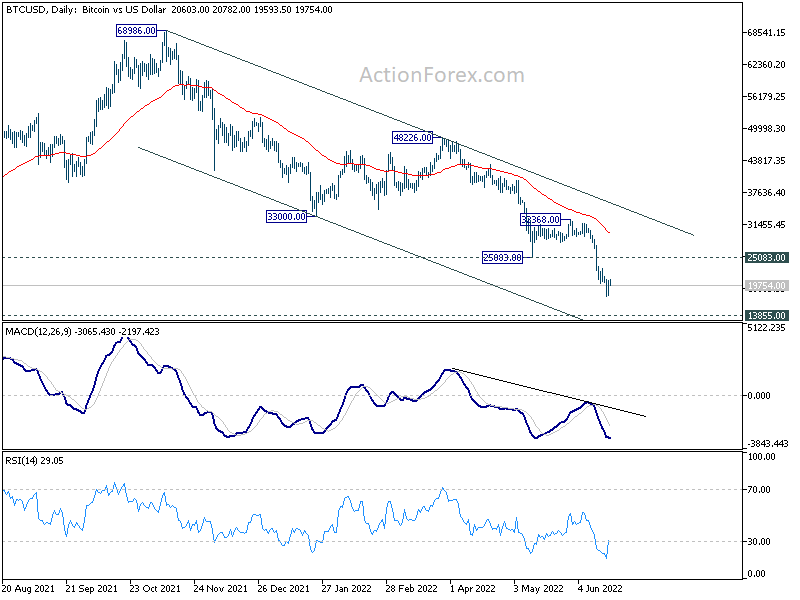
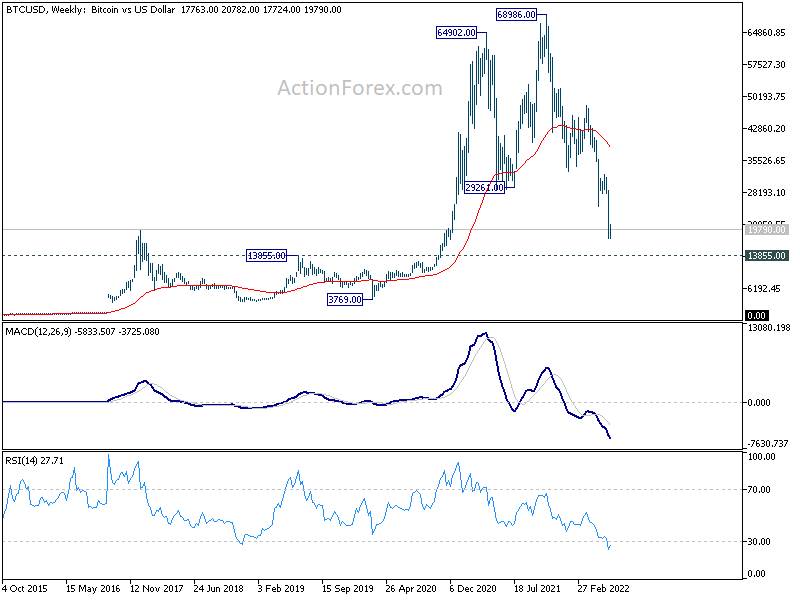
Technically, Bitcoin broke through 20k handle over the weekend and stays below. It could now be heading back to pre pandemic high at 13855. In any case, firm break above 25083 resistance turned support is needed to be the first sign of bottoming. But even so, upside potential should be limited below 32368 resistance.
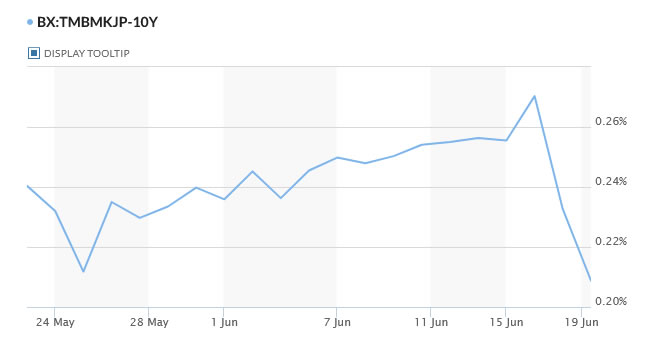
In Asia, at the time of writing, Nikkei is down -1.11%. Hong Kong HSI is down -0.30%. China Shanghai SSE is down -0.20%. Singapore Strait Times is up 0.08%. 10-year JGB yield is down -0.0263 at 0.206.
Fed Waller: Fed is all in on re-establishing price stability
Fed Governor Christopher Waller said in a speech over the weekend that "if the data comes in as I expect, I will support a similar-sized move at our July meeting," referring to the 75bps hike at the June meeting. He added, "the Fed is 'all in' on re-establishing price stability."
"It should not have been a surprise that the policy rate would rise fast in 2022. Rate hikes would need to be larger and more frequent, relative to the 2015-2018 tightening pace, to get back to neutral."
"Looking back, should the Committee have signaled a steeper rate path once the liftoff criteria had been met? Perhaps another lesson is that giving forward guidance about liftoff should also include forward guidance about the possible path of the policy rate after liftoff."
10-yr JGB yield back below 0.21% after massive BoJ purchases
BoJ offered to purchase unlimited amounts of 5- and 10-year JGBs today. That's part of the central bank's move to cap 10-year yield at 0.25%, after doubling down on maintaining this position and the overall ultra loose policy stance last Friday. Just last week, BoJ bought JPY 10.9T yen of government bonds, the most on record according to data compiled by Bloomberg.
BoJ's move seems to be working well finally with 10-year JGB yield now down below 0.21% handle, after breaking above 0.27% last week.
New Zealand BusinessNZ services rose to 55.2, back above average
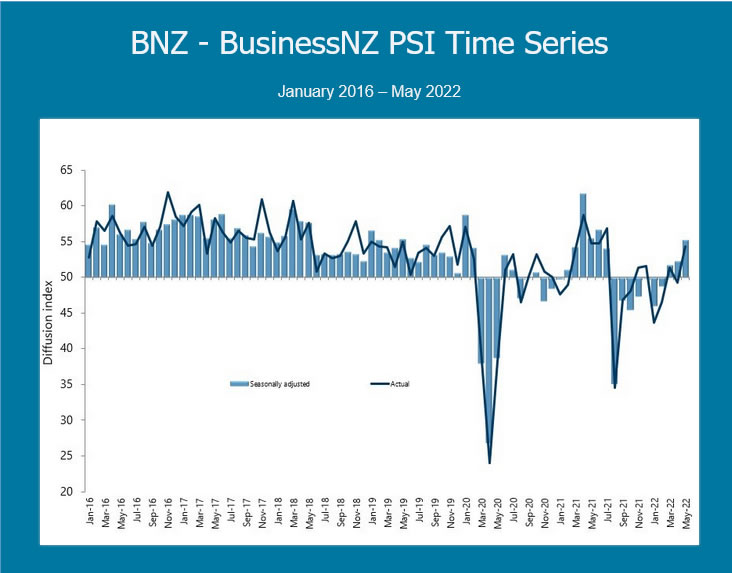
New Zealand BusinessNZ Performance of Services Index rose from 52.2 to 55.2 in May. Activity/sales rose sharply from 53.3 to 59.6. But employment dropped from 51.0 to 48.5. New orders/business rose from 55.2 to 62.0. Stocks/inventories ticked down from 55.0 to 54.6. Supplier deliveries rose from 40.5 to 45.0.
BNZ Senior Economist Doug Steel said that "while the improvement was far from universal across components, reflecting many ongoing challenges across segments of the service sector, the overall outcome was the first above average result since the outbreak of Delta in August last year."
UK CPI, retail sales, consumer confidence and PMIs highlights the week
UK data this week carry some weight, including CPI, consumer confidence and retail sales. For now, recession risks look higher than other major economies. The key lies in the dynamics between inflation and consumption. That's the key to how far BoE's tightening could continue. On the business side, PMIs will also be watched.
Other data to be watched include Eurozone PMIs, Germany Ifo, Canada CPI and retail sales; Australia PMIs; Japan PMIs and CPI, New Zealand consumer sentiment.
On central banks front, Fed Chair Jerome Powell will deliver his semi-annual testimony to Congress. No change in tune is expected, not that soon after last week's FOMC press conference. RBA and BoJ will release meeting minutes while ECB will publish monthly economic bulletin.
Here are some highlights for the week:
- Monday: New Zealand BusinessNZ services index; Germany PPI.
- Tuesday: New Zealand Westpac consumer sentiment; RBA minutes; Swiss Trade balance; Eurozone current account; Canada retail sales, new housing price index; US existing home sales.
- Wednesday: New Zealand trade balance; BoJ minutes; UK CPI, PPI; Canada CPI; Eurozone consumer confidence.
- Thursday: Australia PMIs; Japan PMI manufacturing; Eurozone PMIs, ECB monthly bulletin; UK PMIs; US jobless claims, PMIs.
- Friday: Japan CPI, SPPI; UK Gfk consumer confidence, retail sales; Germany Ifo; US new home sales.
GBP/USD Daily Outlook
Daily Pivots: (S1) 1.2141; (P) 1.2254; (R1) 1.2335; More...
Intraday bias in GBP/USD stays neutral as consolidations continues. But outlook stays bearish as long as 1.2666 resistance holds. On the downside, break of 1.1932 will resume larger down trend from 1.4248. However, firm break of 1.2666 will suggest medium term bottoming and bring stronger rebound back towards 1.3158 support turned resistance.
In the bigger picture, fall from 1.4248 (2018 high) could be a leg inside the pattern from 1.1409 (2020 low), or resuming the longer term down trend. Deeper decline is expected as long as 1.2666 resistance holds. Next target is 1.1409 low. However, firm break of 1.2666 will bring stronger rise back to 55 week EMA (now at 1.3175).
Economic Indicators Update
| GMT | Ccy | Events | Actual | Forecast | Previous | Revised |
|---|---|---|---|---|---|---|
| 22:30 | NZD | Business NZ PSI May | 55.2 | 51.4 | 52.2 | |
| 06:00 | EUR | Germany PPI M/M May | 1.50% | 2.80% | ||
| 06:00 | EUR | Germany PPI Y/Y May | 33.50% | 33.50% |
10-yr JGB yield back below 0.21% after massive BoJ purchases
BoJ offered to purchase unlimited amounts of 5- and 10-year JGBs today. That's part of the central bank's move to cap 10-year yield at 0.25%, after doubling down on maintaining this position and the overall ultra loose policy stance last Friday. Just last week, BoJ bought JPY 10.9T yen of government bonds, the most on record according to data compiled by Bloomberg.
BoJ's move seems to be working well finally with 10-year JGB yield now down below 0.21% handle, after breaking above 0.27% later week.
New Zealand BusinessNZ services rose to 55.2, back above average
New Zealand BusinessNZ Performance of Services Index rose from 52.2 to 55.2 in May. Activity/sales rose sharply from 53.3 to 59.6. But employment dropped from 51.0 to 48.5. New orders/business rose from 55.2 to 62.0. Stocks/inventories ticked down from 55.0 to 54.6. Supplier deliveries rose from 40.5 to 45.0.
BNZ Senior Economist Doug Steel said that "while the improvement was far from universal across components, reflecting many ongoing challenges across segments of the service sector, the overall outcome was the first above average result since the outbreak of Delta in August last year."
Fed Waller: Fed is all in on re-establishing price stability
Fed Governor Christopher Waller said in a speech over the weekend that "if the data comes in as I expect, I will support a similar-sized move at our July meeting," referring to the 75bps hike at the June meeting. He added, "the Fed is 'all in' on re-establishing price stability."
"It should not have been a surprise that the policy rate would rise fast in 2022. Rate hikes would need to be larger and more frequent, relative to the 2015-2018 tightening pace, to get back to neutral."
"Looking back, should the Committee have signaled a steeper rate path once the liftoff criteria had been met? Perhaps another lesson is that giving forward guidance about liftoff should also include forward guidance about the possible path of the policy rate after liftoff."
Technical Outlook and Review
DXY:
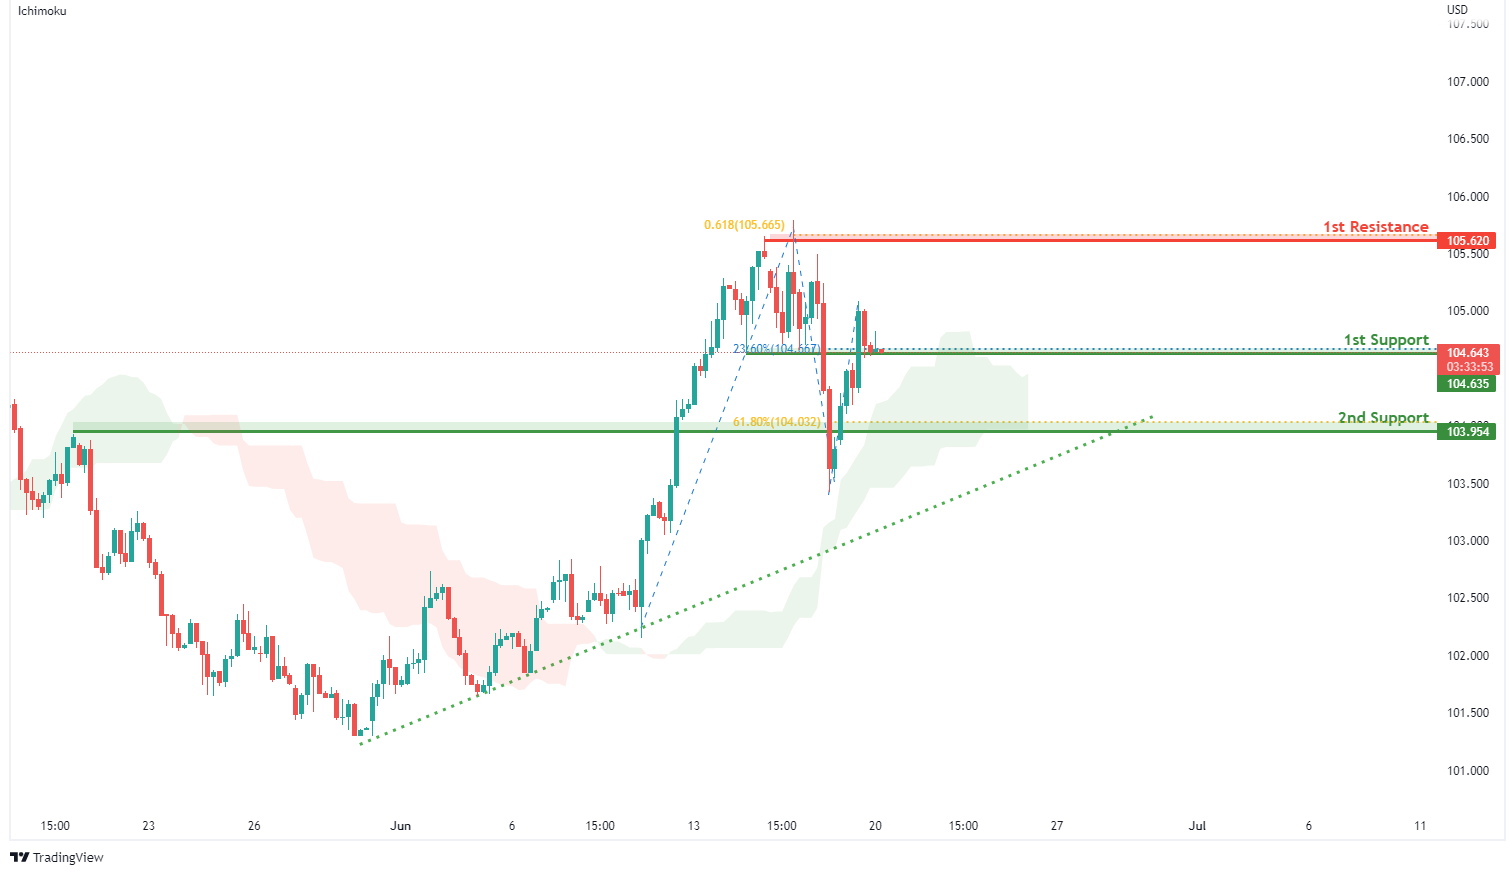
On the H4, with prices moving above the ichimoku indicator and along the ascending trendline, we have a bullish bias that price will rise to our 1st resistance at 105.620 where the 61.8% fibonacci projection and swing high resistance are from our 1st support at 104.635 in line with the horizontal pullback support and 23.6% fibonacci retracement. Alternatively, price may break 1st support structure and head for 2nd support at 103.954 where the horizontal pullback support and 61.8% fibonacci retracement.
Areas of consideration:
- H4 time frame, 1st resistance at 105.620
- H4 time frame, 1st support at 104.635
XAU/USD (GOLD):
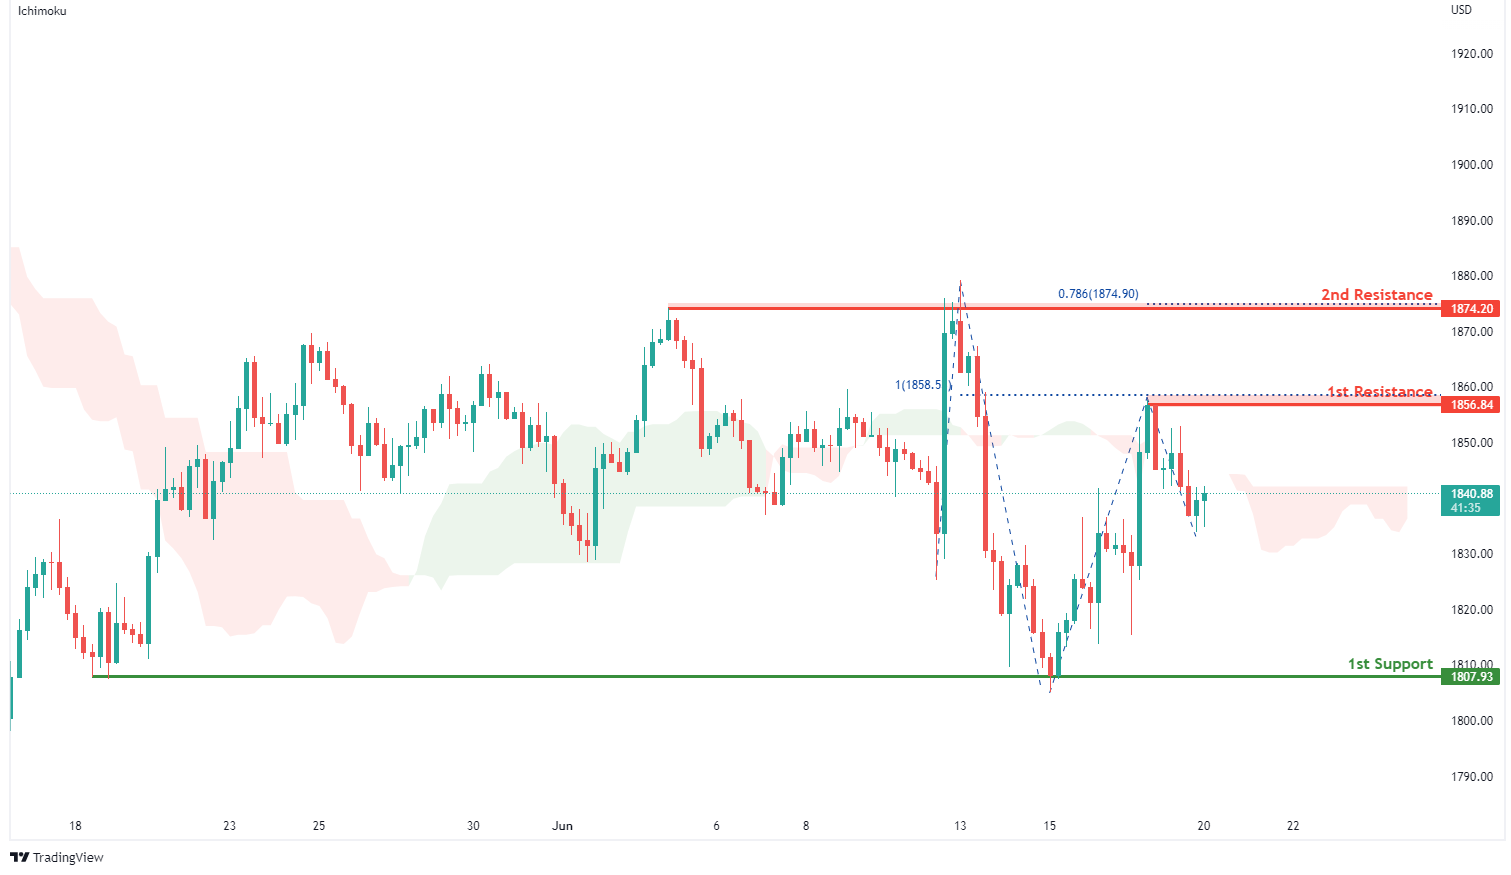
On the H4, with prices moving below the ichimoku indicator, we have a bearish bias that prices will drop from our 1st resistance at 1856.84 where the horizontal swing high resistance and 100% fibonacci projection are to our 1st support at 1807.93 in line with swing low support. Alternatively, price may break 1st resistance structure and head for 2nd resistance at 1874.20 in line with swing high resistance and 78.6% fibonacci projection.
Areas of consideration:
- H4 time frame, 1st Resistance at 1856.84
- H4 time frame, 1st Support at 1807.93
GBP/USD:
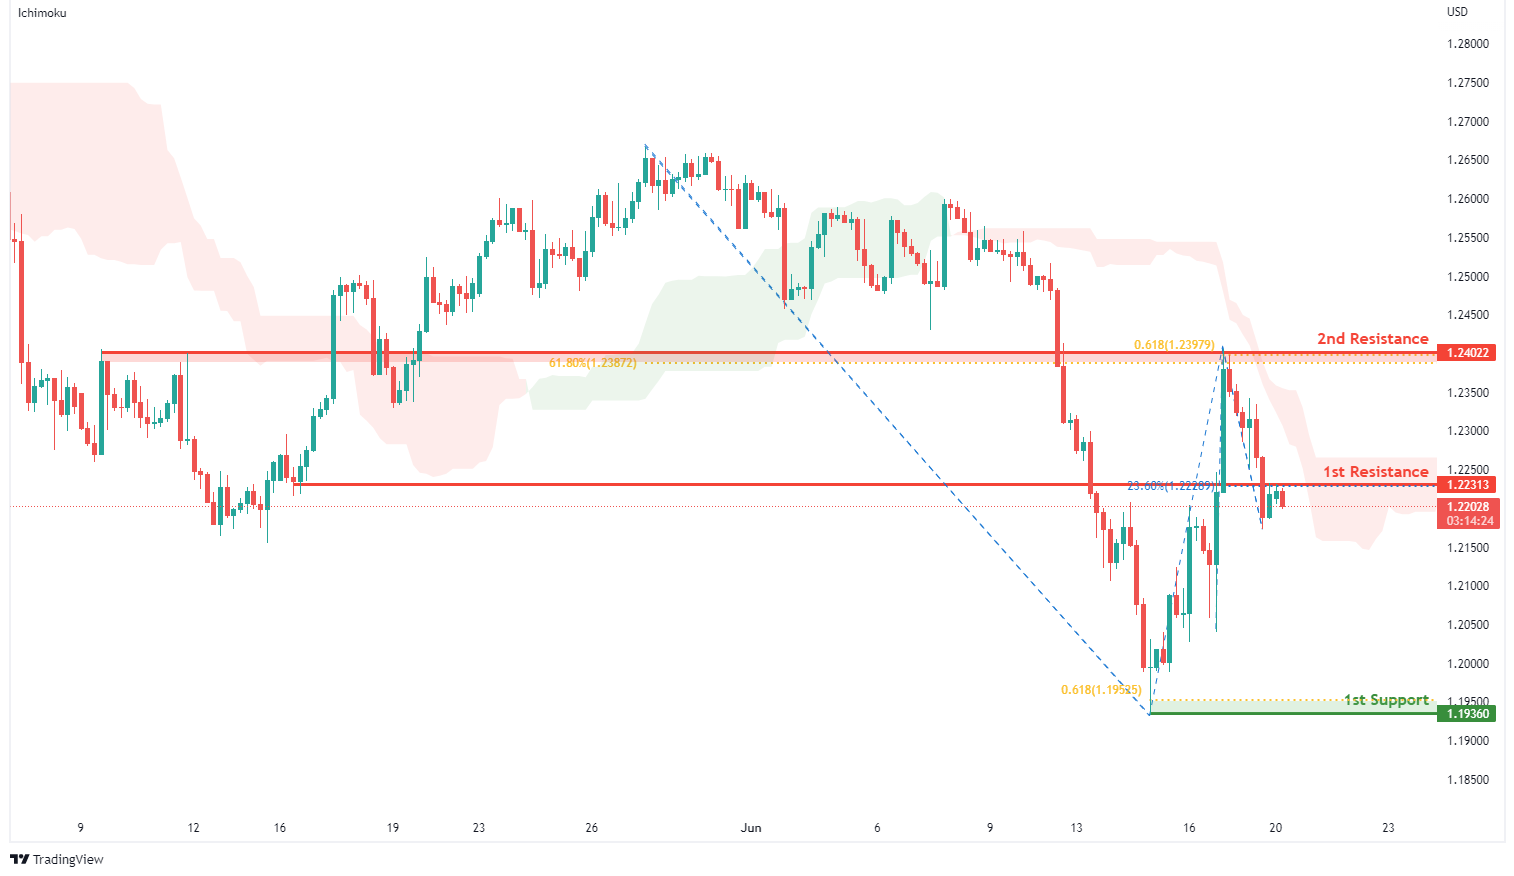
On the H4, with prices moving below the ichimoku indicator, we have a bearish bias that price will drop from our 1st resistance at 1.22313 where the horizontal overlap resistance and 23.6% fibonacci retracement are to our 1st support at 1.19360 in line with the 61.8% fibonacci projection and swing low support. Alternatively, price may break 1st resistance structure and head for 2nd resistance at 1.24022 where the horizontal overlap resistance, 61.8% fibonacci projection and 61.8% fibonacci retracement are.
Areas of consideration:
- H4 1st resistance at 1.22313
- H4 1st support at 1.19360
USD/CHF:
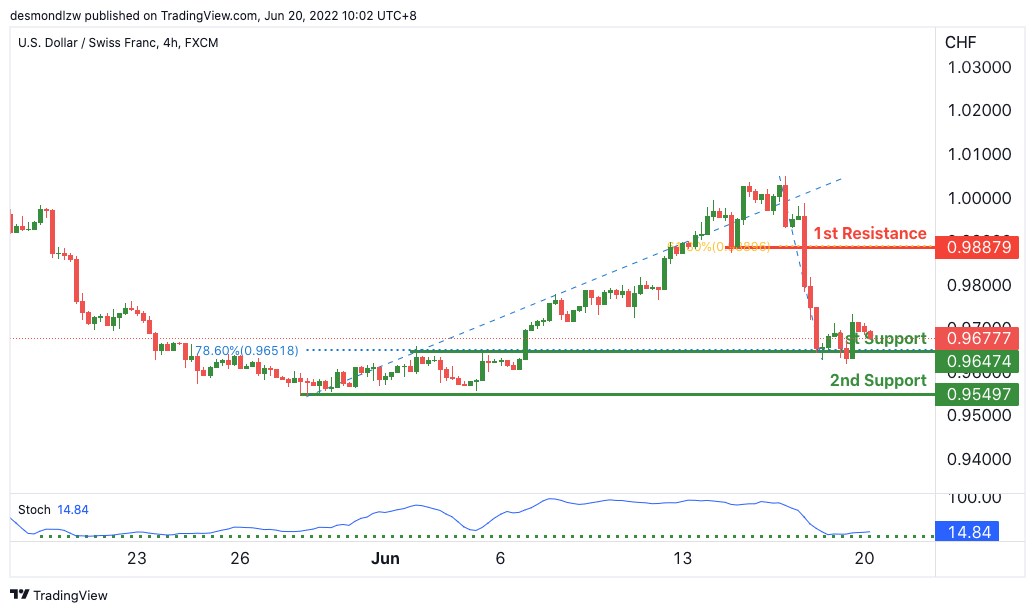
On the H4, with price expected to bounce off the stochastics indicator, we have a bullish bias that price will rise from our 1st support at 0.96474 where the horizontal pullback support and 78.6% Fibonacci retracement is to our 1st resistance at 0.98879 in line with the horizontal pullback resistance and 61.8% Fibonacci retracement. Alternatively, price may break structure and head for 2nd support where the horizontal swing low support is.
Areas of consideration
- 1st support level at 0.96474
- 1st resistance level at 0.98879
EUR/USD :
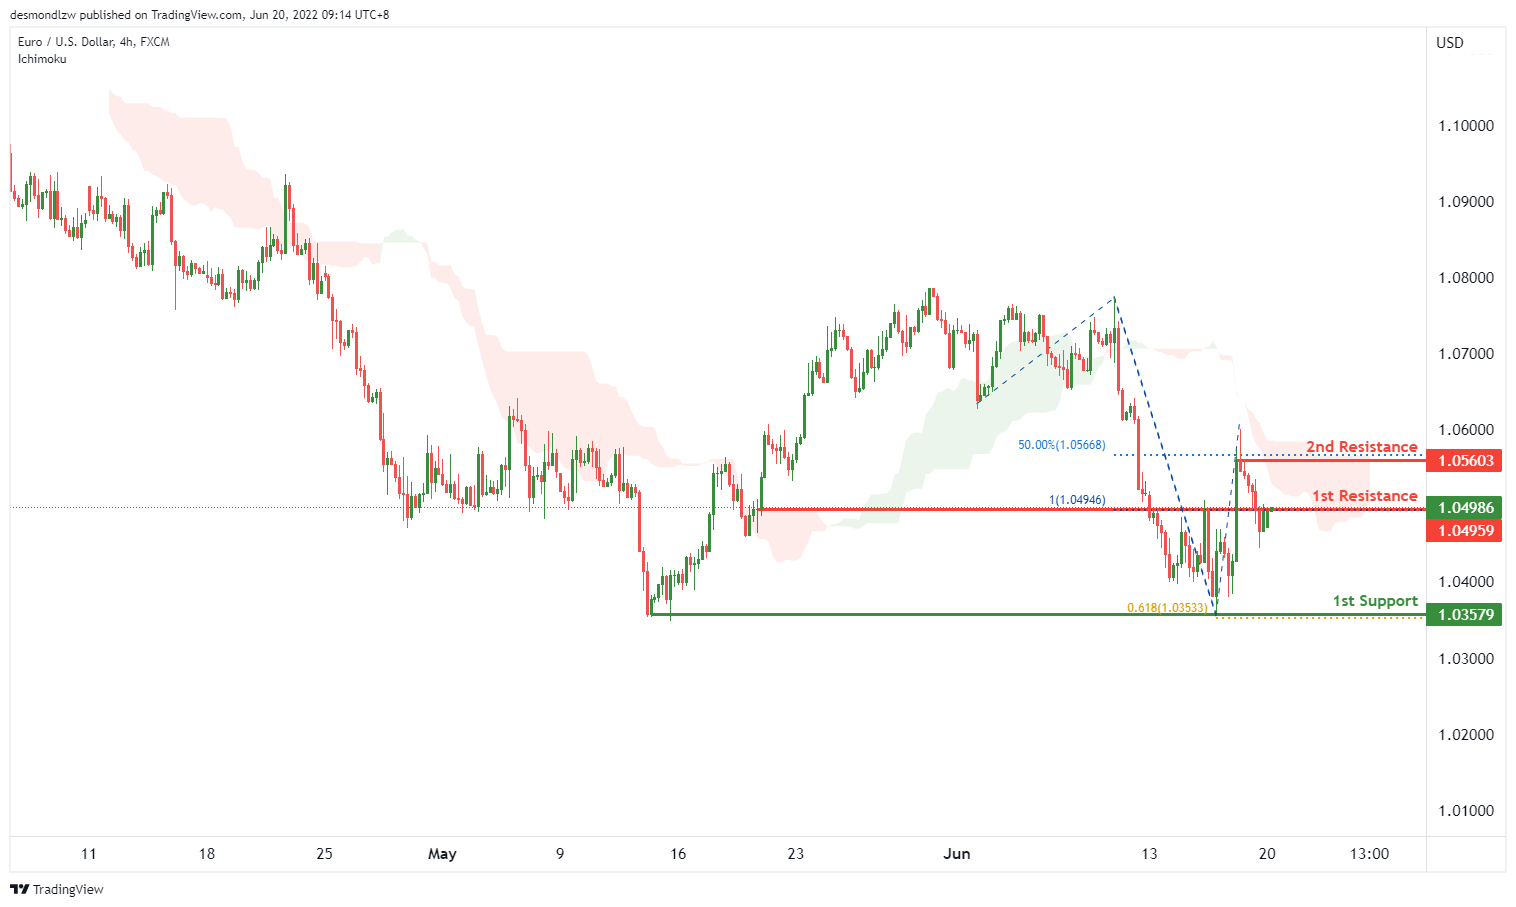
On the H4, with price moving below the ichimoku cloud, we have a bearish bias that price will continue to drop from the 1st resistance at 1.04959 in line with the 100% fibonacci projection and pullback resistance to the 1st support at 1.03579 in line with the 61.89% fibonacci projection and horizontal swing low. Alternatively price may reverse off the 1st resistance and rise to the 2nd resistance at 1.05603 in line with the swing high and 50% fibonacci retracement.
Areas of consideration :
- H4 1st resistance at 1.04959
- H4 1st support at 1.03579
USD/JPY:
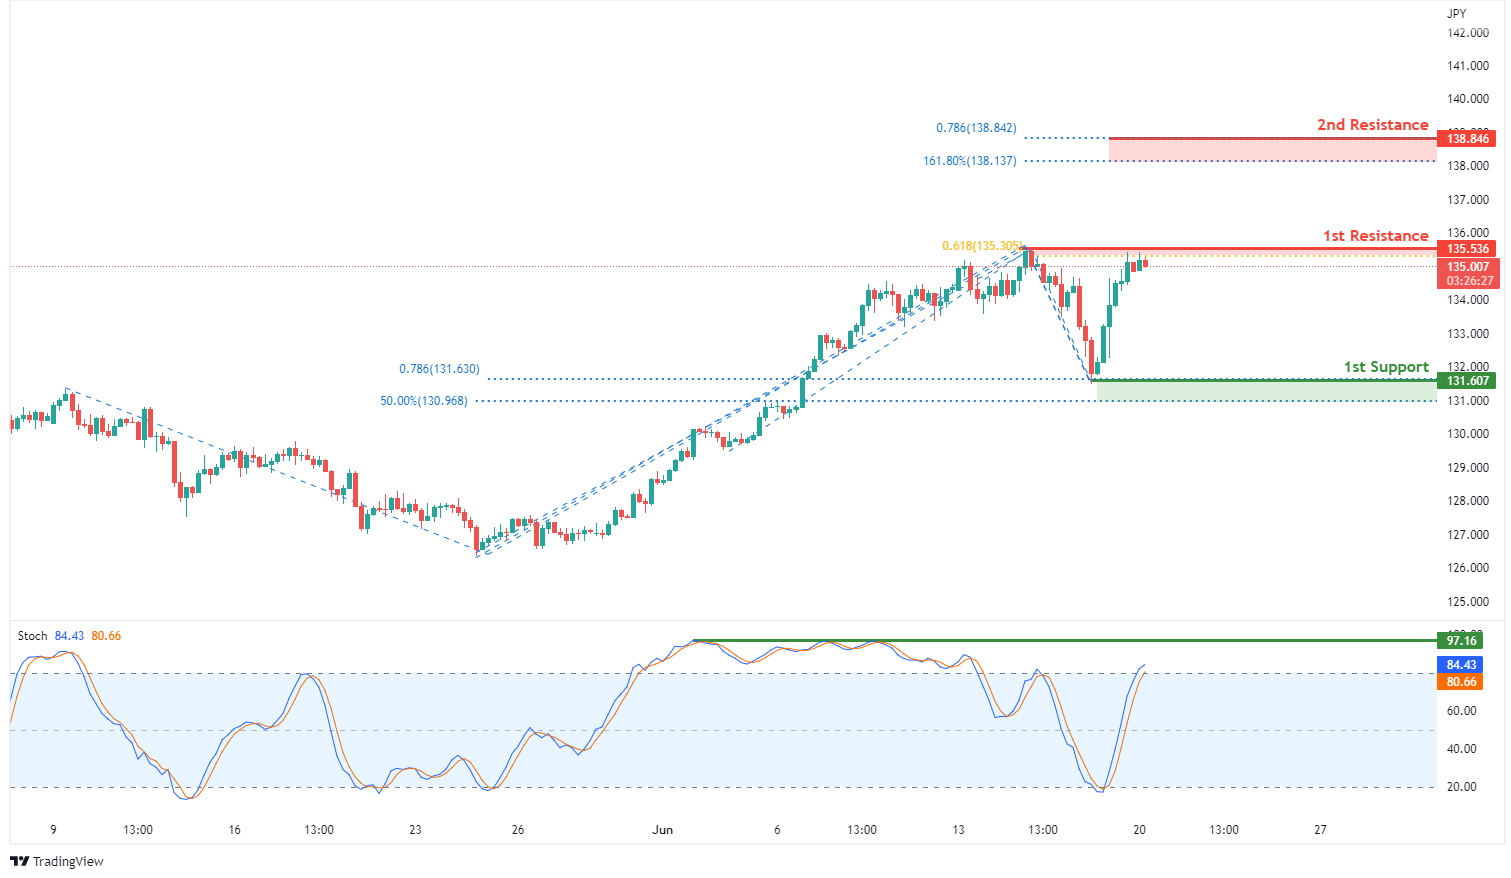
On the H4, with price approaching and expected to reverse off stochastic indicator, we have a bearish bias that price will drop from our 1st resistance at 135.536 in line with the swing high resistance and 61.8% fibonacci projection to our 1st support at 131.607 in line with the swing low support,78.6% fibonacci projection and 50% fibonacci retracement . Alternatively, price may break 1st resistance structure and head for 2nd resistance at 138.846 where the 161.8% fibonacci extension and 78.6% fibonacci projection are.
Areas of consideration:
- H4 time frame, 1st resistance at 135.536
- H4 time frame, 1st support at 131.607
AUD/USD:
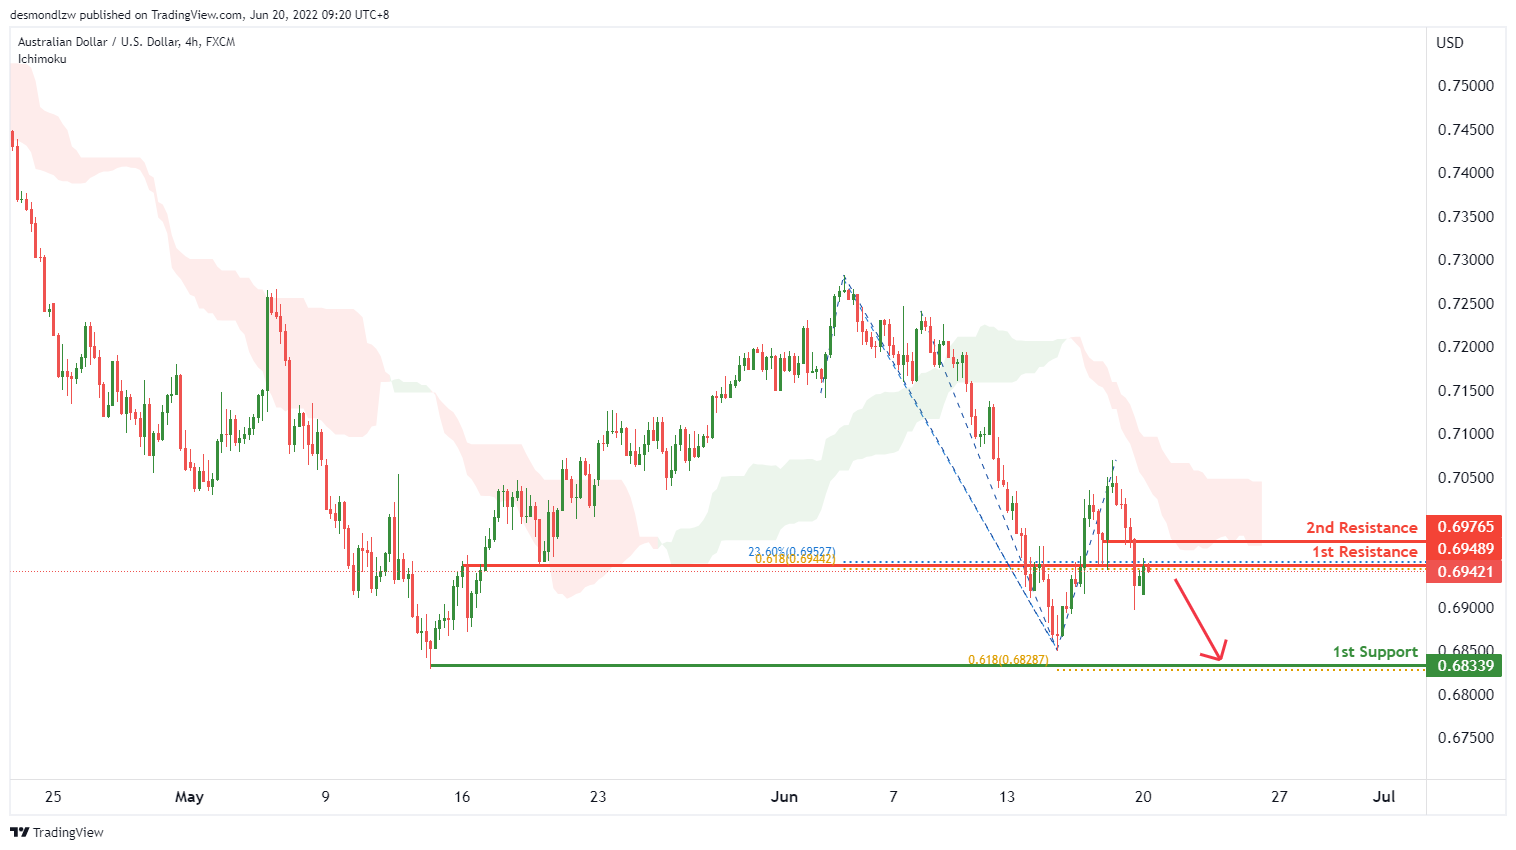
On the H4, with price moving below the ichimoku cloud, we have a bearish bias that price will continue to drop from the 1st overlap resistance at 0.69489 in line with the 61.8% fibonacci projection and 23.6% fibonacci retracement to the 1st support at 0.68339 in line with the 61.8% fibonacci projection and horizontal swing low. Alternatively price may reverse off the 1st resistance and rise to the 2nd resistance at 0.69765 in line with the pullback resistanc
Areas of consideration
- H4 1st resistance at 0.69489
- H4 1st support at 0.6833
NZD/USD:
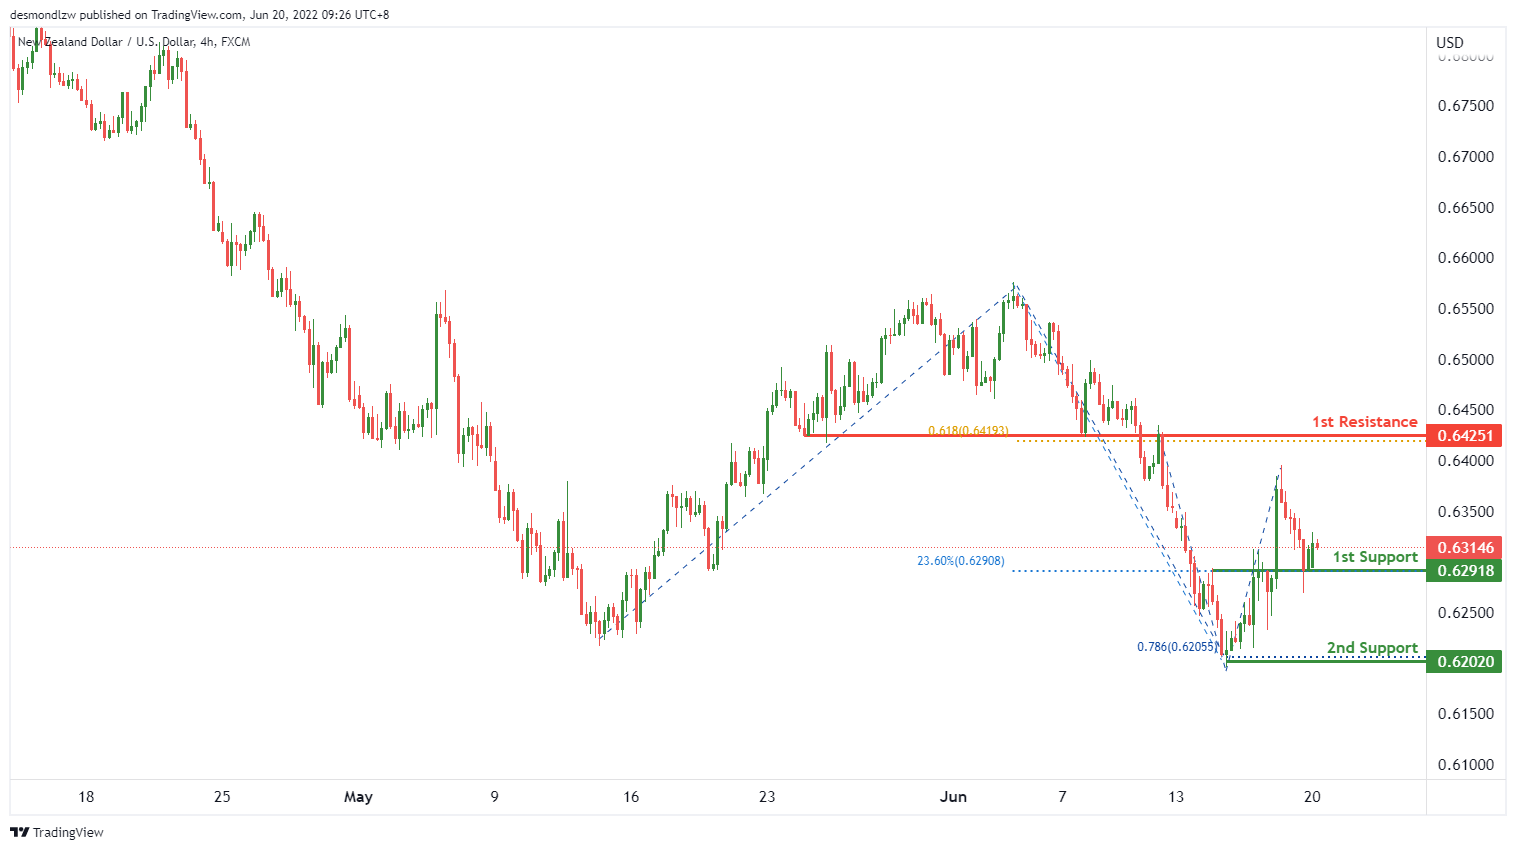
On the H4, we have a bullish bias that price will continue to rise from the 1st overlap support at 0.62918 in line with the 23.6% fibonacci retracement to the 1st resistance at 0.62451 in line with the 61.8% fibonacci projection at the overlap resistance. Alternatively, price may drop form the 1st support to 2nd support at 0.62020 in line with 78.6% fibonacci projection and horizontal swing low.
Areas of consideration:
- H4 time frame, 1st support at 0.62918
- H4 time frame, 1st resistance at 0.62451
USD/CAD:
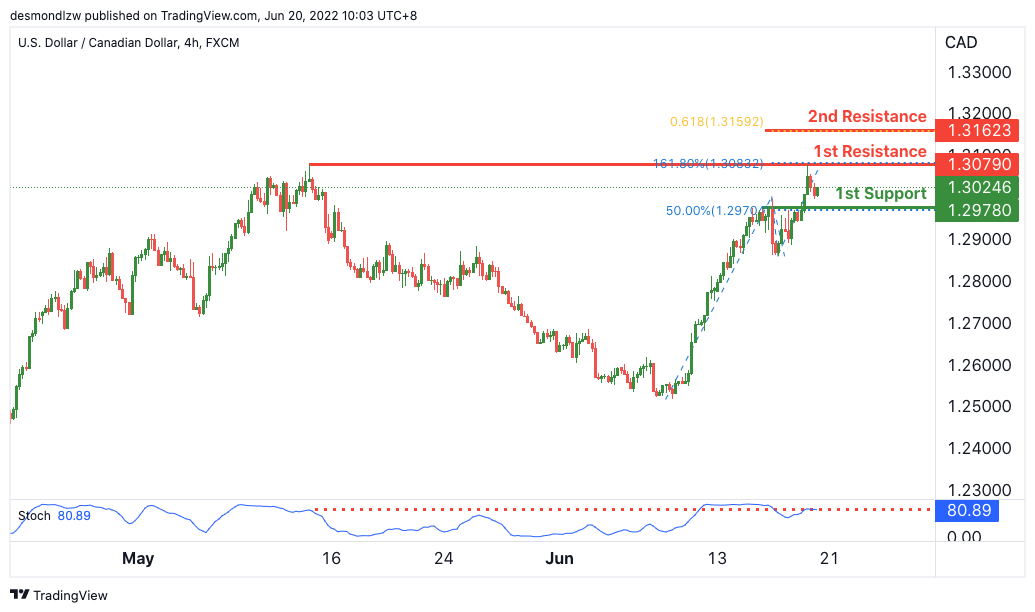
On the H4, with price expected to reverse off the stochastics indicator, we have a bearish bias that price will rise from our 1st resistance where the horizontal swing high resistance and 161.8% Fibonacci projection is to our 1st support at 1.29780 in line with the horizontal pullback support and 50% Fibonacci retracement. Alternatively, price may head for 2nd resistance where the 61.8% Fibonacci projection is.
Areas of consideration:
- H4 time frame, 1st resistance at 1.30780
- H4 time frame, 1st support at 1.29780
OIL:
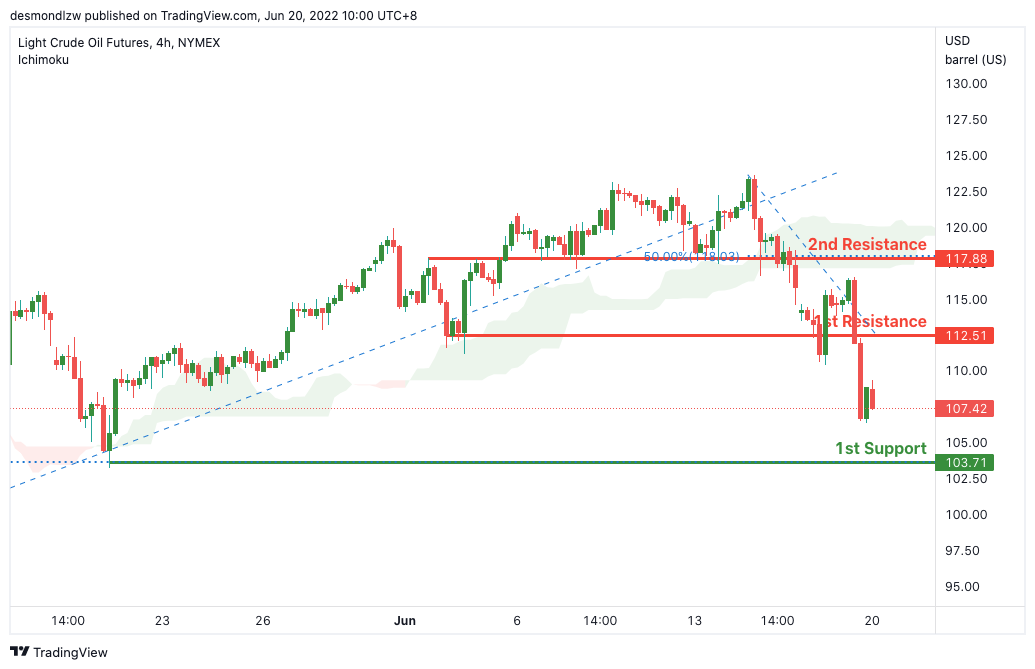
On the H4, with price moving below the ichimoku cloud, we have a bearish bias that price will rise from our 1st resistance at 112.51 where the horizontal swing low support is to our 1st resistance at 103.71 in line with the horizontal swing low support. Alternatively, price may head for 2nd resistance where the horizontal pullback resistance and 50% Fibonacci retracement is. Take note that we are waiting for the break of 1st resistance to confirm the bearish continuation.
Areas of consideration:
- H4 time frame, 1st resistance of 112.51
- H4 time frame, 1st support of 103.71
Dow Jones Industrial Average:
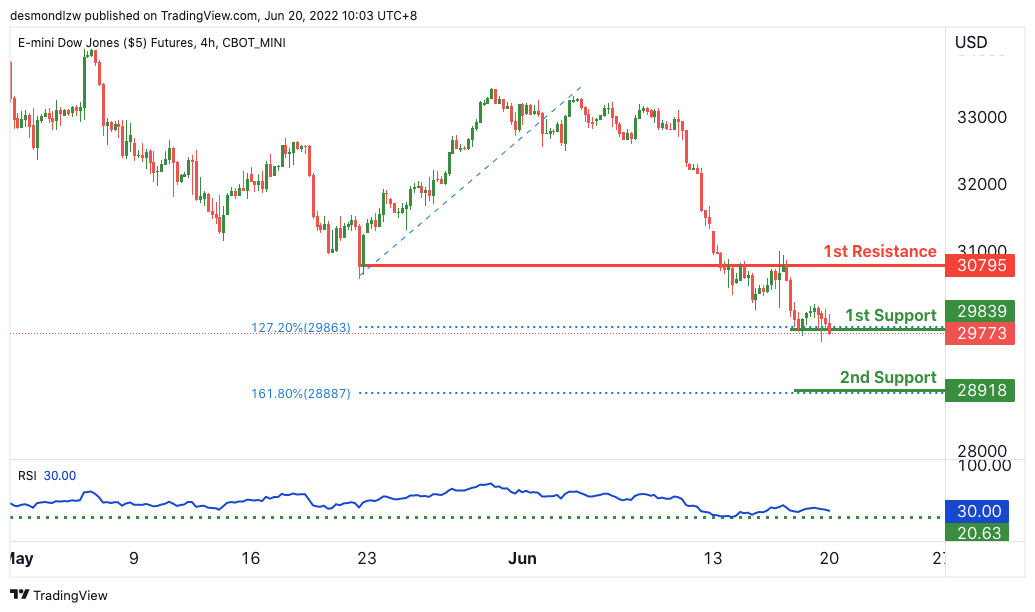
On the H4, with price expected to bounce off the stochastics indicator, we have a bullish bias that price will rise from our 1st support at 29839 where the 127.2% Fibonacci extension is to our 1st resistance at 30795 in line with the horizontal pullback support. Alternatively, price may break structure and head for 2nd support where the 161.8% Fibonacci extension is.
Areas of consideration :
- H4 time frame, 1st resistance at 30795
- H4 time frame, 1st support at 29839
Eco Data 6/20/22
[php_everywhere instance="1"]
Forex and Cryptocurrency Forecast
EUR/USD: Fed FOMC Meeting Results
Last week's events were based on Friday, June 10, when US inflation statistics were released, which amounted to 8.6% against the expected 8.3%. Having learned these disturbing data, market participants began to include in dollar quotes the possibility of raising the interest rate by 0.75% instead of the previously predicted 0.5%. Some hotheads even talked about its increase by 1.0% straight away. As a result, the FOMC (Federal Open Market Committee) at its meeting on Wednesday, June 15, raised the key rate to 1.75%, that is, by 0.75%.
According to Fed Chairman Jerome Powell, this was the most aggressive round of monetary tightening since 1994. Moreover, the US Central Bank, despite the threat of a recession, intends to follow the chosen course further, raising the rate by another 50 or 75 basis points at the next meeting.
Following the FOMC meeting, the inflation estimates for 2022 were revised from 3.4% to 5.2%, and the forecast for the key rate was raised from 1.9% to 3.4%. At the same time, Jerome Powell hopes that this will not be a shock to the economy, given the strength of the consumer sector and the US labor market. True, despite the optimism of the head of the Fed, the expected rate of economic growth for 2022 was reduced from 2.8% to 1.7%, and the forecast for the unemployment rate, on the contrary, was raised from 3.5% to 3.7%.
In general, Jerome Powell's comments on the regulator's plans turned out to be rather vague, and the market did not understand how strong quantitative tightening (QT) would be and what the prospect of raising the federal funds rate to 4.0% was. As the head of the Fed said, "a rate hike of 75 basis points is unusually large," so he does not think "such hikes will happen often."
As a result, the DXY dollar index reached its maximum (105.47), and the EUR/USD pair reached its minimum (1.0358) not following the FOMC meeting, but directly during it. The reason for the rapid strengthening of the dollar at the beginning of the week was not only the expectations of an unprecedented rate hike, but also poor macroeconomic statistics from Europe. The rate of decline in industrial production in the Eurozone accelerated from -0.5% to -2.0%, although it had been expected that they would slow down on the contrary. The main reason is still the energy crisis caused by anti-Russian sanctions due to Russia's military invasion of Ukraine.
The dollar seemed to have exhausted its upside potential on the evening of June 15, resulting in a rapid bounce on June 16, sending EUR/USD soaring to 1.0600. As for the last day of the working week, the trend changed again after the ECB promised new support to contain the cost of borrowing among the southern countries of the Eurozone. The pair placed the final chord of the five-day period in the zone of 1.0500, at the level of 1.0495.
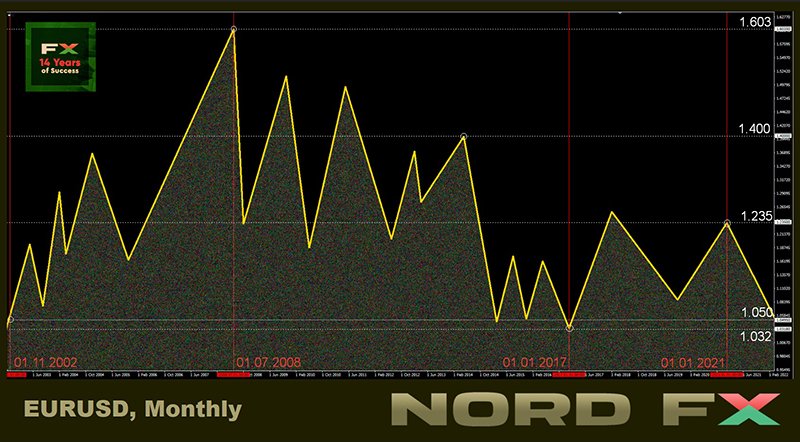
Many analysts believe that the US and European currencies will reach 1:1 parity by the end of the year (or maybe even earlier). In the meantime, the votes of experts are divided as follows on the evening of June 17: 30% side with the bulls, 20% - with the bears, and 50% cannot decide on the forecast. The indicators on D1 give quite unambiguous signals. Among oscillators, 100% are colored red, among trend indicators, 90% are red and 10% are green. Except for 1.0500, the nearest strong resistance is located in the 1.0600 zone, if successful, the bulls will try to break through the 1.0640 resistance and rise to the 1.0750-1.0760 zone, the next target is 1.0800. For the bears, task number 1 is to break through the support in the 1.0460-1.0480 area, and then update the May 13 low at 1.0350. If successful, they will move on to storm the 2017 low of 1.0340, there is only support from 20 years ago below.
As for the events of the upcoming week, Monday, June 20 is a public holiday in the US, the country celebrates Juneteenth. Data from the housing market will come on Tuesday, June 21 and Friday, June 24, and from the US labor market on Thursday. In addition, we will have two speeches by Fed Chairman Jerome Powell in Congress on June 22 and 23. Also we recommend paying attention to the publication of data on business activity in Germany and the Eurozone as a whole on June 23.
GBP/USD: A Pleasant Surprise from BoE
Ahead of the US Fed meeting, the dollar appreciated against the pound by 585 points in just 3 business days, from June 10 to 14, and the GBP/USD pair fell to 1.1932, the lowest level since March 2020. But then the regulator of the United Kingdom stepped in.
At its meeting on Thursday, June 16, the Bank of England (BoE) raised its key rate from 1.00% to 1.25%. It would seem that 25 basis points is only a third of the 75 bp that the Fed raised the rate the day before, but the pound flew up and the pair fixed a local high at 1.2405. The British currency strengthened by 365 points in just a few hours.
The reason for this rally, as often happens, is expectations. First, 3 out of 9 members of the Bank's Management Board supported an increase in the refinancing rate not by 25, but by 50 basis points at once. And secondly, the comments published after the meeting clearly indicated the possibility of accelerating the pace of tightening of monetary policy, starting from the next meeting of the regulator. That is, the rate may reach 1.75%, as early as August 4, which is significantly higher than market forecasts. In addition, the Bank of England intends not to stop there and raise interest rates further.
In contrast to the Fed's vague comments, the BoE was clear enough about its monetary policy that made a positive impression on investors. Analysts also noted that, unlike their colleagues on the other side of the Atlantic, the Bank of England leaders did not shift all the blame for rising inflation to China and Russia.
The pound retreated from the gained positions at the end of the week, and the pair ended the trading session at the level of 1.2215. At the moment, 50% of experts believe that in the near future the pair will try to test the resistance at 1.2400 again, 10%, on the contrary, are waiting for a test of support around 1.2040, the remaining 40% of analysts have taken a neutral position.
Both among trend indicators and among oscillators, 90% indicate a fall, while the remaining 10% look in the opposite direction. Supports are located at the levels 1.2155-1.2170, then 1.2075 and 1.2040. The pair's strong foothold lies at the psychologically important 1.2000 level, followed by the June 14 low at 1.1932. In case of growth, the pair will meet resistance in the zones and at the levels of 1.2255, 1.2300-1.2325, 1.2400-1.2430, 1.2460, then the targets in the area of 1.2500 and 1.2600 follow.
Among the macroeconomic events of the upcoming week concerning the United Kingdom, we can highlight the publication of the May value of the Consumer Price Index (CPI) on Wednesday, June 22, and of a whole package of PMI Indices, reflecting business activity in individual sectors and in the economy of the country generally the next day, on June 23. Retail sales in the UK for May will be announced on Friday, June 24.
USD/JPY: No Surprises from the Bank of Japan
Rising dollar pushes USD/JPY again and again to fresh 20-year highs. Last week, having reached the height of 135.58, it broke the January 01, 2002 record of 135.19. This was followed by a powerful pullback to the level of 131.48 and a no less powerful new upswing, after which the pair finished near the level of 135.00, at around 134.95.
A weak yen, especially in the face of high inflation, is a big problem not only for households, but for the entire Japanese economy, as it increases the cost of raw materials and natural energy imported into the country. However, the Bank of Japan is stubborn to maintain its ultra-soft monetary policy, in contrast to the sharp tightening by the Central banks of other countries. After the US Federal Reserve, the Swiss National Bank and the Bank of England raised interest rates last week, the Japanese Central Bank left its rate at the previous negative level - minus 0.1% at its meeting on Friday June 17, while promising to maintain the yield of 10-year government bonds at around 0%. There have been several attempts to test the 0.25% yield on government debt over the past weeks, but aggressive buybacks of these securities immediately followed in response.
Japanese officials tried to give some support to the yen on the morning of June 17. The government and the Bank of Japan issued a joint (rarely seen) statement that they were concerned about the sharp fall in the national currency. These words were supposed to indicate to investors that the possibility of adjusting monetary policy is not ruled out at some point. But there was not a word in the statement about when and how this could happen, so the market reaction to it was close to zero.
A number of specialists, such as, for example, strategists at the largest banking group in the Netherlands ING, believe that there is still "an increased risk that USD/JPY will significantly exceed 135.00 in the coming days if the Japanese authorities do not step up and carry out currency intervention".
Most analysts (55%) have long been waiting for the intervention of the authorities, or at least a revival of interest in the yen as a safe-haven currency. However, this forecast has not come true for several weeks. Although it is possible that a strong correction will be repeated, as happened on June 15-16, when the pair fell by 410 points. 35% of experts are counting on updating the high at 135.58, and 10% believe that the pair will take a breather, moving in a sideways trend. For indicators on D1, the picture is very different from the opinion of experts. For trend indicators, all 100% are colored green, for oscillators, 90% of them are, 10% of which are in the overbought zone, and another 10% vote for the red. The nearest support is located at 134.50, followed by zones and levels at 134.00, 133.50, 133.00, 132.30, 131.50, 129.70-130.30, 128.60 and 128.00. It is difficult to determine the further targets of the bulls after the new update of the January 01, 2002 high. Most often, such round levels as 136.00, 137.00, 140.00 and 150.00 appear in the forecasts. And if the pair's growth rates remain the same as in the last 3 months, it will be able to reach the 150.00 zone in late August or early September.
With the exception of the release of the Bank of Japan Monetary Policy Committee meeting report on Wednesday, June 22, no other major events are expected this week.
CRYPTOCURRENCIES: Bloodbath or the Battle for $20,000
Anthony Scaramucci, founder of $3.5 billion investment fund SkyBridge Capital, called it a "bloodbath." And it's hard to disagree with him.
In total, bitcoin lost 70% between November 11, 2021 and June 15, 2022. It has lost about a third of its value in the past week alone. According to some experts, the trigger this time was the announcement of the crypto-lending platform Celsius Network to suspend the withdrawal of funds, their exchange and transfer between accounts "due to extreme market conditions." (As of May, the platform managed $11 billion in user assets.)
However, the general negative macroeconomic background is most likely to blame. This opinion was expressed by industry participants in a survey conducted by The Block. Many experts believe that the crypto markets "would have fallen regardless of Celsius." Bloomberg notes that the market has entered "a period of selling everything except the dollar." Traders are leaving for a "safe harbor" due to more aggressive tightening of the monetary policy of the US Federal Reserve (QT), caused by rising inflation. The market is actively getting rid of risky assets, the S&P500, Dow Jones and Nasdaq stock indices are falling, and bitcoin and other cryptocurrencies along with them.
The price of BTC fell to almost $20,000 on Wednesday June 15, ethereum quotes fell to $1,000, and the capitalization of the crypto market fell to $0.86 trillion. Recall that it had reached $2.97 trillion 7 months ago, in November 2021.
The bear market upsets all investors. But the two largest institutional bitcoin holders have been particularly distinguished. They lost a total of about $1.4 billion on this asset. According to the analytical resource Bitcointreasuries.net, almost 130,000 bitcoins owned by Microstrategy and 43,200 bitcoins owned by Tesla made their owners significantly poorer (we are talking about an unrealized loss yet).
MicroStrategy CEO Michael Saylor spent almost $4 billion ($3,965,863,658) on 129,218 BTC, which is approximately 0.615% of the total issuance of the first cryptocurrency. The fall in the price of bitcoin depreciated the company's investment to $3.1 billion, thus the loss amounted to $900 million. Apart from this, Microstrategy shares also fell to their lowest levels in recent months.
The investment of Elon Mask, whose car company Tesla bought more than 40,000 bitcoins during the 2021 bull market, has also taken a big hit. He lost about $500 million on his investments.
Of course, Michael Saylor and Elon Musk aren't the only ones struggling. The fall of the crypto market hit the largest US crypto exchange as well. Coinbase Global announced the layoff of 1,100 employees (approximately 18% of the entire staff). Shares of Coinbase itself fell in price by 26% over the past week, and its capitalization decreased to $11.5 billion. Director and co-founder of the company Brian Armstrong said that "a recession can cause a new crypto winter that will last for a long time."
Stablecoins also add cold to investors' hearts. The passions for UST (Terra) have not subsided yet, as the USDD of the Tron network has faced a systemic crisis. USDD lost touch with the dollar on June 13, and TRX fell by 22%.
As of this writing, the BTC/USD bull/bear fight is for the 200-week moving average (200WMA). This WMA used to serve as strong support in all previous bear market phases. Until now, bitcoin has never managed to gain a foothold below this line, and we will find out on Monday June 20 if it managed to do so this time. (By "gaining a foothold" traders mean the closing of a candle below a certain level).
Arcane Research believes that the $20,000 level is critical for bitcoin in the context of technical analysis. "Therefore, a possible visit below this level could lead to the capitulation of many hodlers and deleverages." There is also significant open interest in bitcoin options around the $20,000 mark. This is a factor of additional pressure on the spot market if the above level does not withstand the onslaught of bears.
Renowned trader and analyst Tone Vays cites the Bitcoin Momentum Reversal Indicator (MRI), which predicts the life cycles of a trend. At the moment, MRI points to a few more days (4-5) of falling, after which a market reversal may occur.
According to Vays, most likely, the BTC rate will not fall below $19,000. But a further fall is not ruled out: "Is it possible to reach $17,180? I think so. But if the downward movement continues, the next level could be around $14,000. However, in my opinion, bitcoin will not fall so much, and the level of $19,000 will be the lowest mark," the expert said.
This forecast can be considered optimistic. For example, the president of the brokerage company Euro Pacific Capital, Peter Schiff, predicted a fall to $8,000 a month ago. And the American economist and Nobel Prize winner Paul Krugman called cryptocurrencies a fraud and a bubble that will soon burst.
As of Friday evening, June 17, the total crypto market capitalization is at $0.895 trillion ($1.192 trillion a week ago). The BTC/USD pair is trading at $20,500. Bitcoin's Crypto Fear & Greed Index is firmly entrenched in the Extreme Fear zone and was falling to 7 points out of 100 possible (13 weeks ago). This value is comparable to March 2020 values. Then the price of bitcoin bottomed out at $3,800. According to Arcane Research analysts, the index has been in the Fear zone since April 12, which is a duration record. "Market participants are undoubtedly tired of this, many capitulate. Historically, buying has been a profitable strategy in times of fear. However, it is not easy to catch a falling knife," the researchers shared their thoughts.
And finally, a bit of optimism from the founder of SkyBridge Capital, Anthony Scaramucci, with whose words we began this review. In an interview with CNBC, the former politician and White House director of communications not only called what was happening a "bloodbath," but also added that he had survived seven bear markets and he hopes that he will be able to "crawl out" of the eighth.
"All crypto assets have a long-term perspective, as long as they do not face short-term losses," the financier said. "Then investors start tearing their hair out and hitting the wall. It is better to buy a quality crypto asset without being distracted by others and maintain discipline without looking back at the bear markets that sometimes happen. If you remain calm during these periods, you will get rich," Scaramucci encouraged investors.
EUR/USD Weekly Outlook
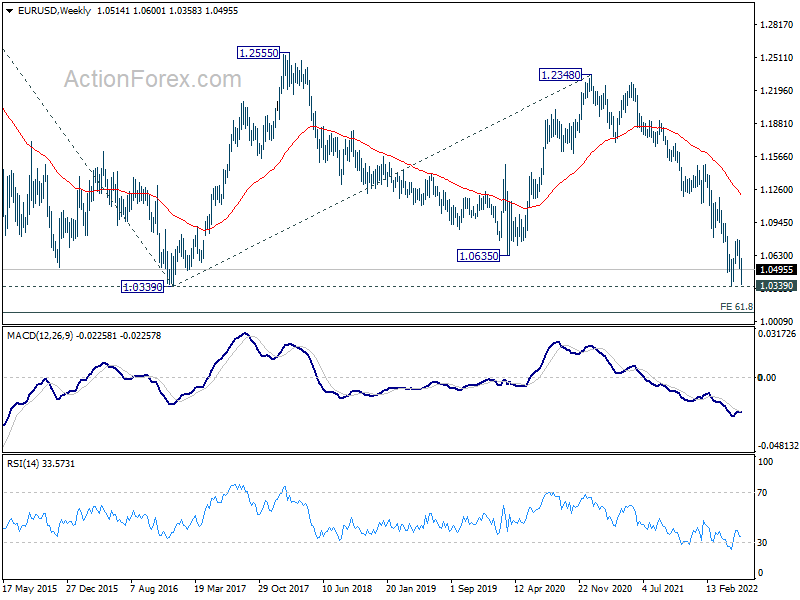
EUR/USD recovered ahead of 1.0339 lower last week but stayed well below 1.0786 resistance. Initial bias remains neutral this week first and further fall is in favor. On the downside, sustained break of 1.0339/48 will resume larger down trend. Next target is long term projection level at 1.0090.
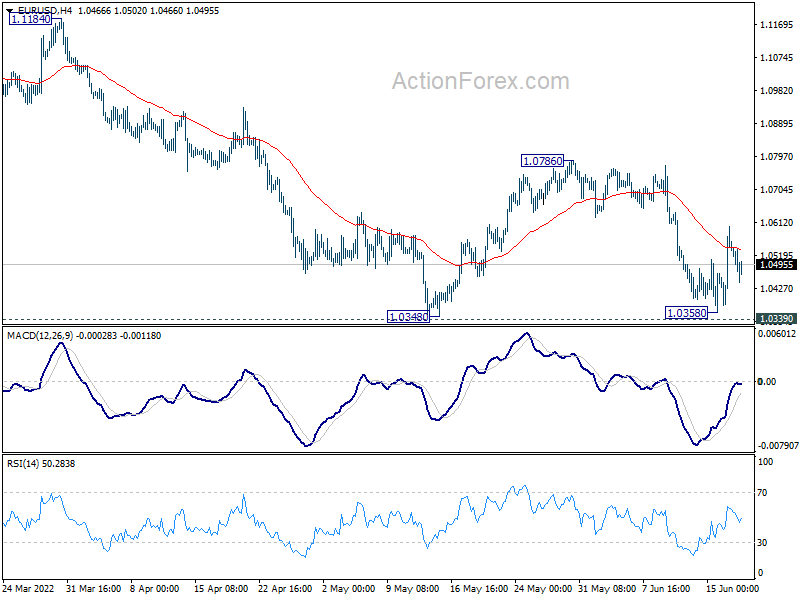
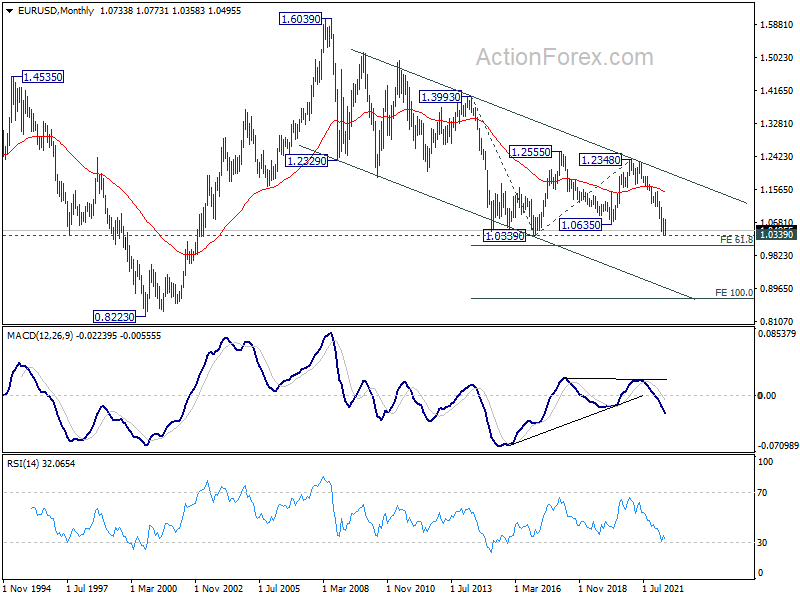
In the bigger picture, focus stays on 1.0339 long term support (2017 low). Decisive break there will resume whole down trend from 1.6039 (2008 high). Next target is 61.8% projection of 1.3993 to 1.0339 from 1.2348 at 1.0090. However, firm break of 1.0805 support turned resistance will delay this bearish case, and bring stronger rebound first.
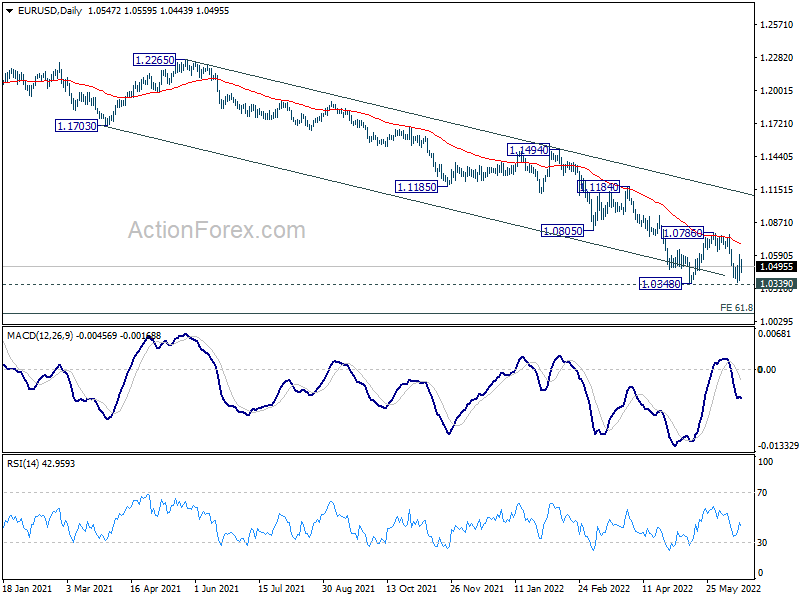
In the long term picture, current development suggests that long term down trend from 1.6039 (2008 high) is ready to resume. Break of 1.0339 will target 61.8% projection of 1.3993 to 1.0339 from 1.2348 at 1.0090. Decisive break there could bring downside acceleration towards 100% projection at 0.8694.