Sample Category Title
EURUSD Erases Last Week’s Gains, Standing Below 1.0500
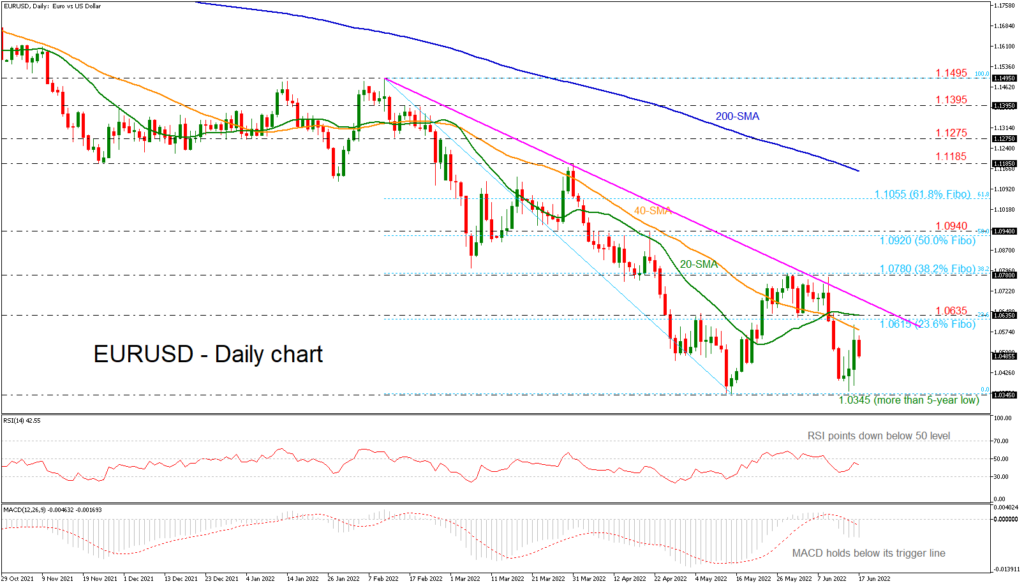
EURUSD is returning below the 1.0500 psychological level after the jump towards the 1.0600 barrier. The sideways move within the 1.0345 multi-month low and the 38.2% Fibonacci retracement level of the down leg from 1.1495 to 1.0345 at 1.0780 is continuing with the technical indicators, suggesting a negative bias.
The downside reversal in the RSI and the slowdown in the MACD oscillator justify the selling pressure, both remaining beneath their neutral thresholds keeping the short-term risk skewed to the downside.
Should selling forces strengthen, the more-than-five-year low of 1.0345 will come under the spotlight again before tumbling towards the 1.0220 support level, which is taken from the inside swing high in July 2002. Sliding lower, the next strong obstacle could come from the parity level at 1.0000, which will endorse the downside movement.
Alternatively, a close above the 40-day simple moving average (SMA) would take the currency until the immediate resistance level of the 23.6% Fibonacci of 1.0615. Marginally higher, the 20-day SMA, which overlaps with the 1.0635 resistance, may halt the bullish actions before meeting the medium-term descending trend line at 1.0700. Beyond that, the rally may gear up to the 38.2% Fibonacci of 1.0780.
In brief, EURUSD is facing a weakening bias in a narrow range in the short-term, where a drop below 1.0345 is expected to enhance selling interest in the medium-term outlook.
Daily Technical Analysis
EUR/USD
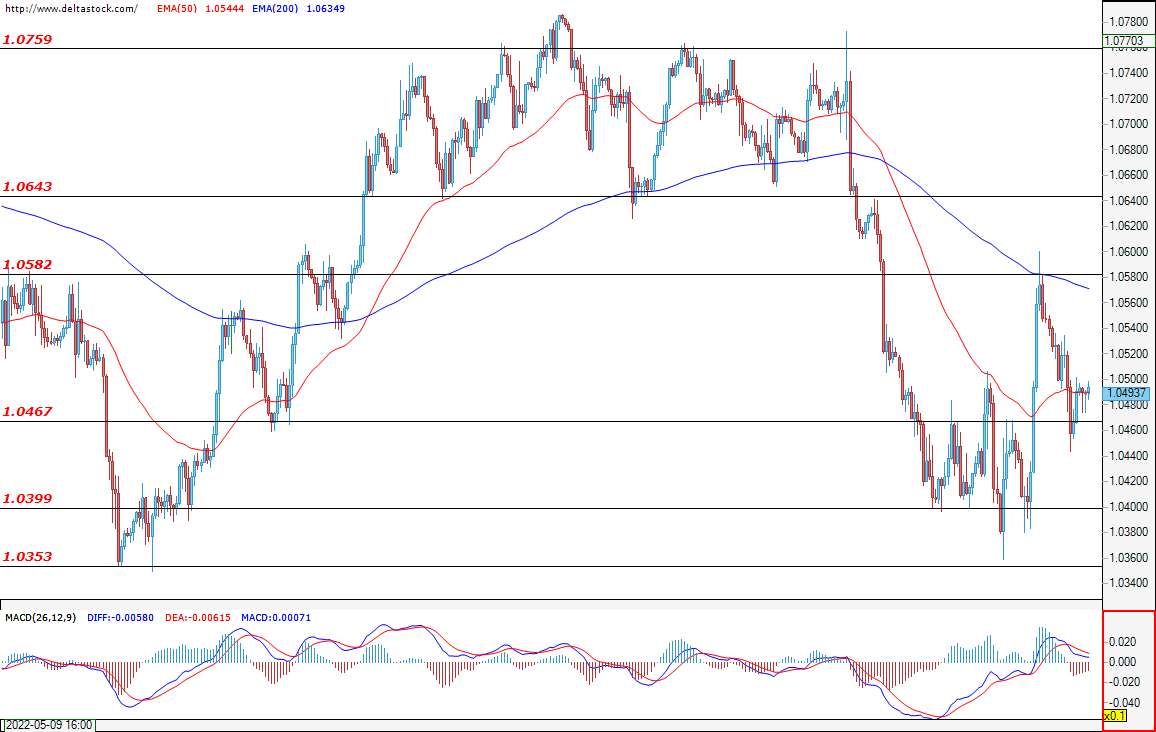
The single European currency continues to lose ground against the dollar. And while the support at 1.0460 has so far managed to hold off the bearish pressure, the overall market mood remains negative. A successful breach of this level would pave the way for the pair towards the psychological level at 1.0400. In case of positive news about the war between Russia and Ukraine, the trend could change and the bulls might return to the market. If that’s the case, then their first resistance is expected to be the level of 1.0580.
USD/JPY
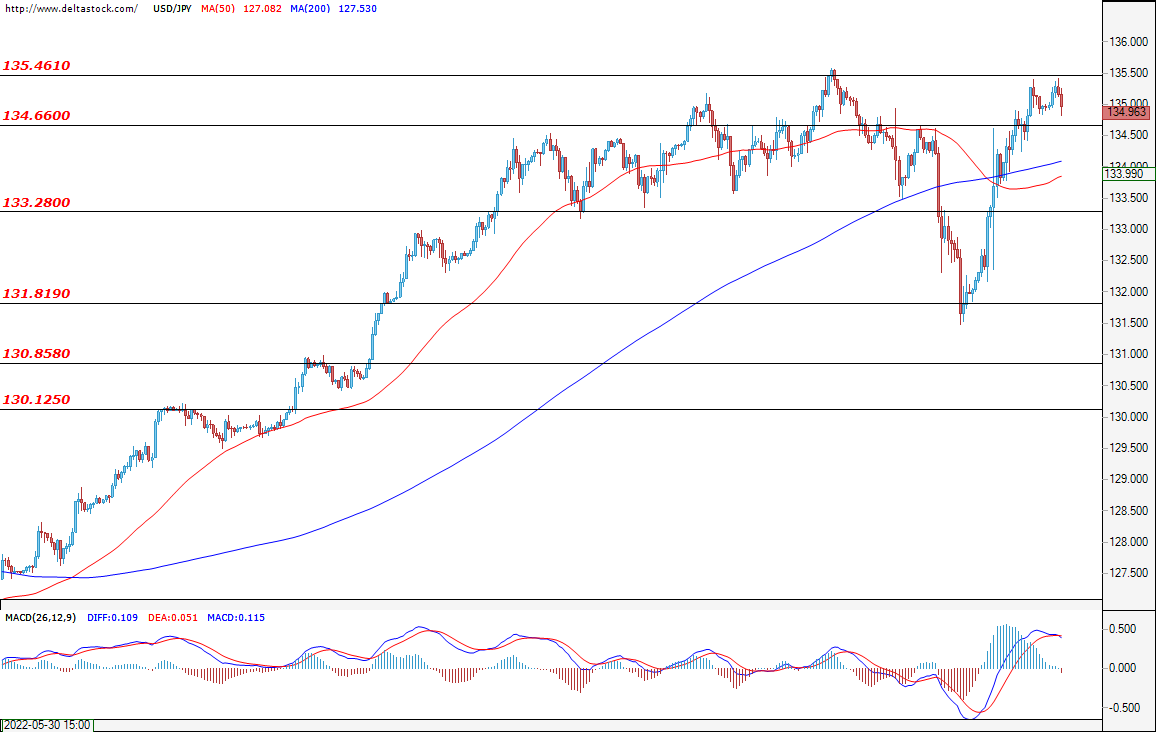
The bulls are striving to head the pair towards a test of the resistance at 135.00, where a successful breach would pave the way for the USD/JPY towards the next key resistance level at 136.00. On the other hand, the impulsive upward movement that we have witnessed during the last trading session from the previous week, would most probably be limited to around the mentioned resistance zone, and the pair may therefore enter a consolidation phase in the range of 133.00 – 135.00. Only a confirmed breach of the support at 134.60, however, would be considered as an opportunity for the bears to recover their losses and lead the the pair towards the support zone at 133.00.
GBP/USD
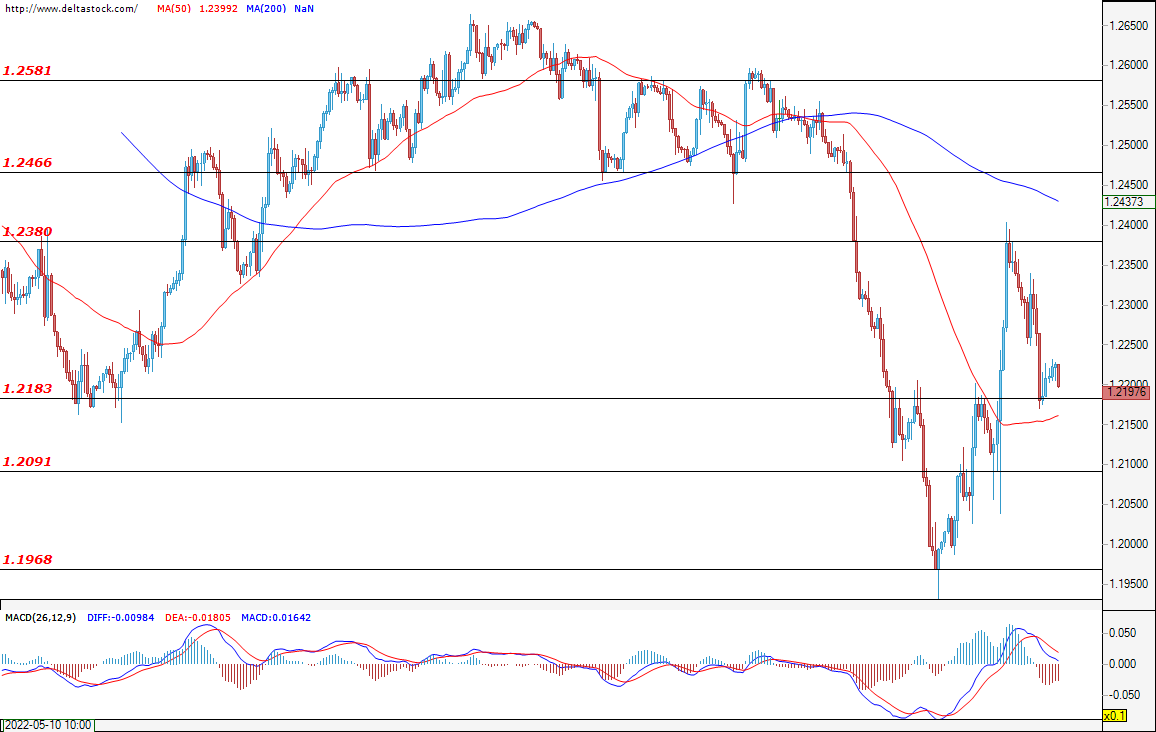
The forecasts for today’s trading session are for the pair to make another attempt at breaching the support at 1.2180, which could be considered as a confirmation signal that the negative sentiment is here to stay and thus provide sellers with the opportunity to attack the support level at 1.2100. Besides the negative market sentiment, a short consolidation in the range of 1.2180 – 1.2250 is also highly possible during today’s trading session. The resistance at 1.2380 may be considered as a better entry point for the bears, which may deepen the sell-off towards the next critical support at 1.2100.
EUGERMANY40
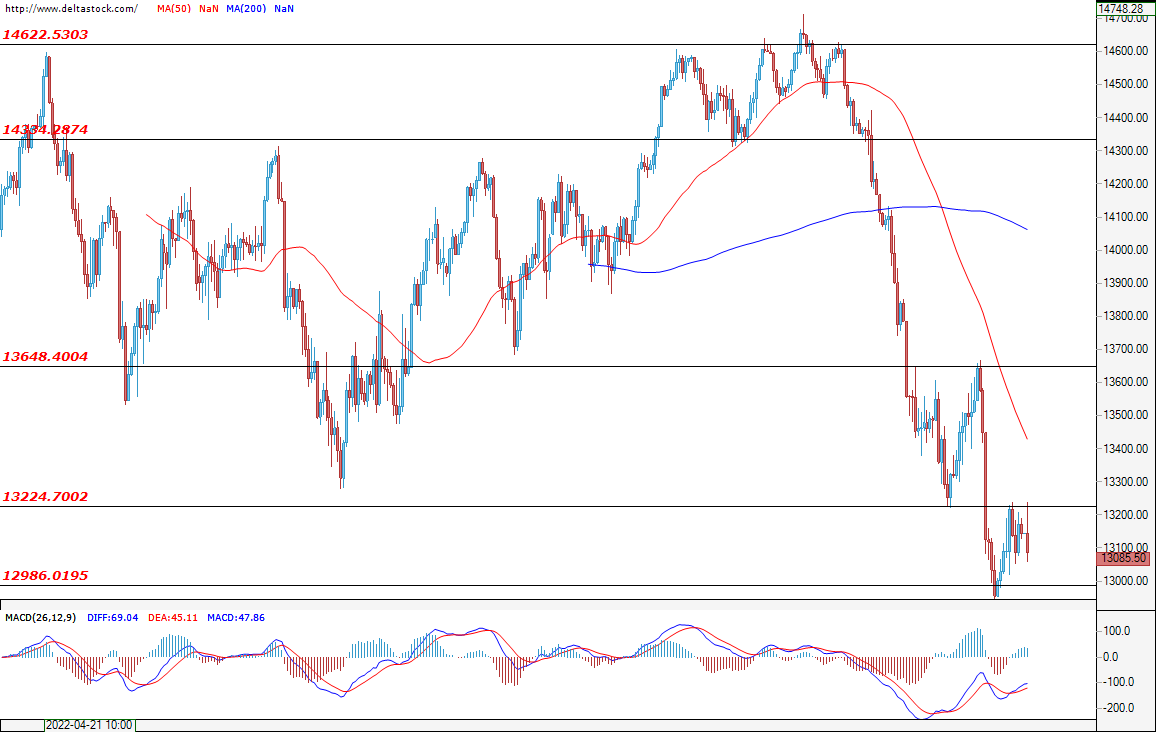
The resistance zone at 13225 is still holding under the bulls’ pressure and the downtrend would most probably continue, opening the way for the bears towards the support at 13000. However, a short consolidation above the resistance zone at 13225 is also а possible scenario for today’s trading session. In case the bulls manage to keep the price above the level at 13224, then this could lead to a deeper correction and a test of the key resistance at 13648.
US30
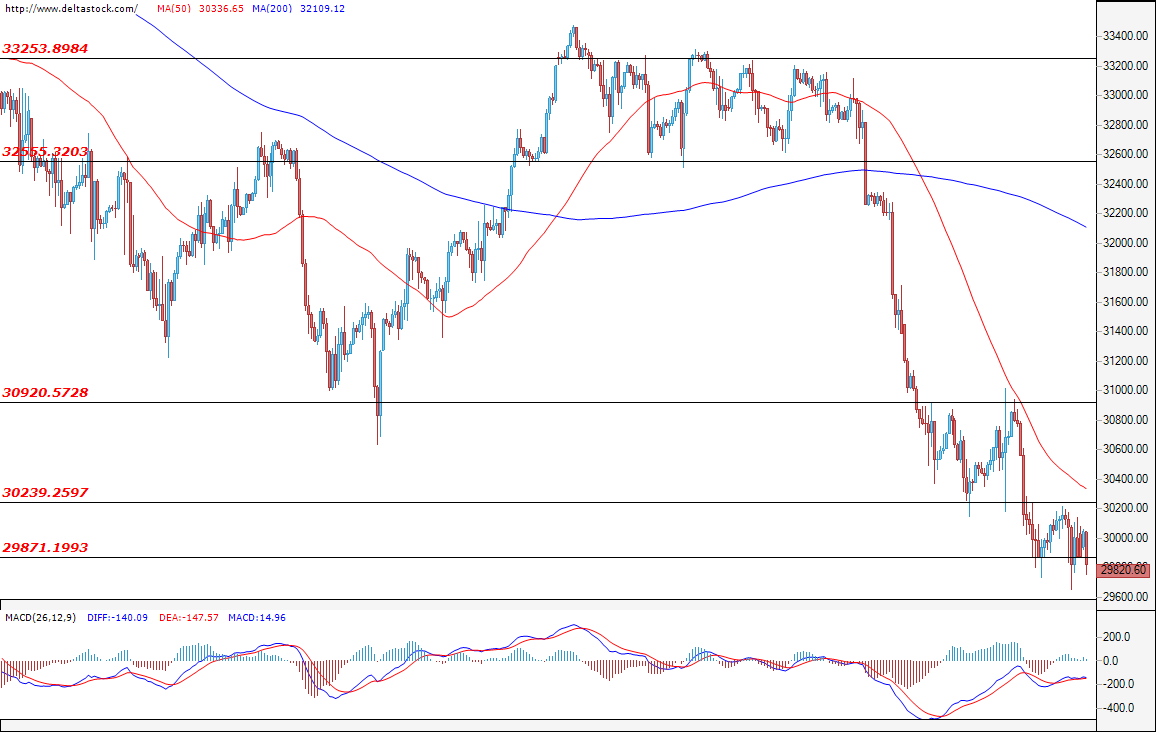
At the time of writing this analysis, the consolidation phase is confirmed and the forecasts for today’s trading session are for the price to remain locked in the range of 29870 – 30240. The overall market sentiment is still negative and the price of the index would most probably continue to decline towards the next support at 29500, provided that the lower border of the range is breached first.
GBP/USD Outlook: Action in Early Monday Lacks Direction But Overall Picture Remains Bearish
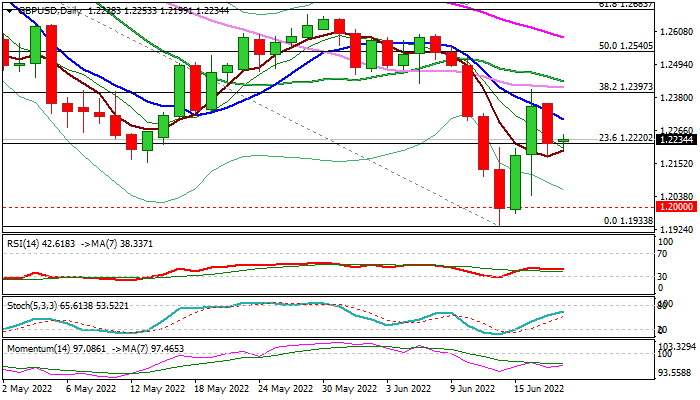
Cable is consolidation after 1.1% drop on Friday, which was contained by 5DMA, with a narrow range in early Monday suggesting a lack of direction.
Daily studies are bearishly aligned with strong negative momentum and MA’s in bearish setup that keeps the downside vulnerable.
On the other side, Friday’s hammer candle after strong rejection on probe through psychological 1.20 level, signal formation of bear-trap and generate initial signal which needs more upside action for confirmation.
Lift above 1.2397 (Fibo 38.2% of 1.3147/1.1933) would improve near-term structure and signal further recovery.
Conversely, break and close below 5DMA (1.2196) would risk retest of 1.20 pivot, loss of which would open way for fresh extension of larger downtrend.
Res: 1.2303; 1.2360; 1.2397; 1.2434.
Sup: 1.2196; 1.2155; 1.2041; 1.2000.
DAX 40 Struggles for Bids
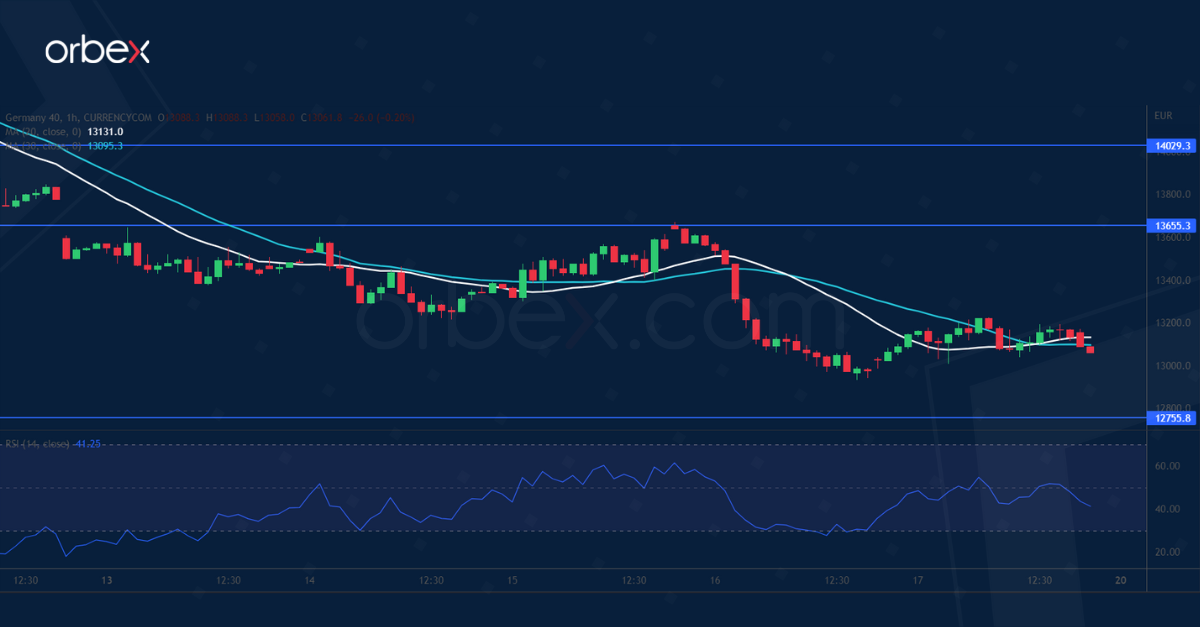
The Dax 40 struggles as investors grapple with the prospect of stagflation. A break below the daily support at 13300 invalidated the May rebound and could put the index on a bearish course in the weeks to come. Buyers’ failure to hold onto 13250 suggests that the bears have doubled down at the latest bounce. The index is heading towards 12750, though the RSI’s oversold condition attracted some buying interest. The rebound might come under pressure near 13650 as the bears could be waiting to sell into strength.
EUR/CHF to Test Critical Floor
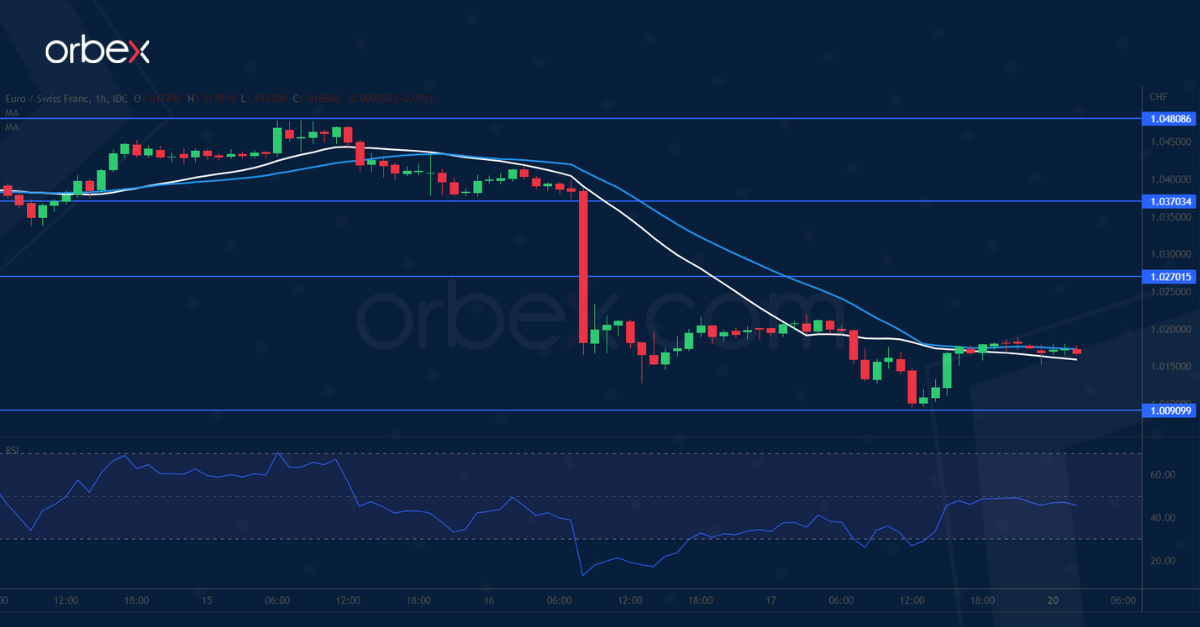
The Swiss franc edges higher as the market continues to price in the SNB’s hawkish turn. The euro’s plunge below the daily support at 1.0230 caused leveraged long positions to close out, driving up volatility. As the dust settles, an oversold RSI caused a brief rebound as short-term sellers bagged their profits. The price action is near April’s lows around 1.0090. A bearish breakout might trigger a new round of sell-off below the parity. On the upside, 1.0270 is the first resistance to clear before a recovery could materialise.
USD/JPY Recoups Losses
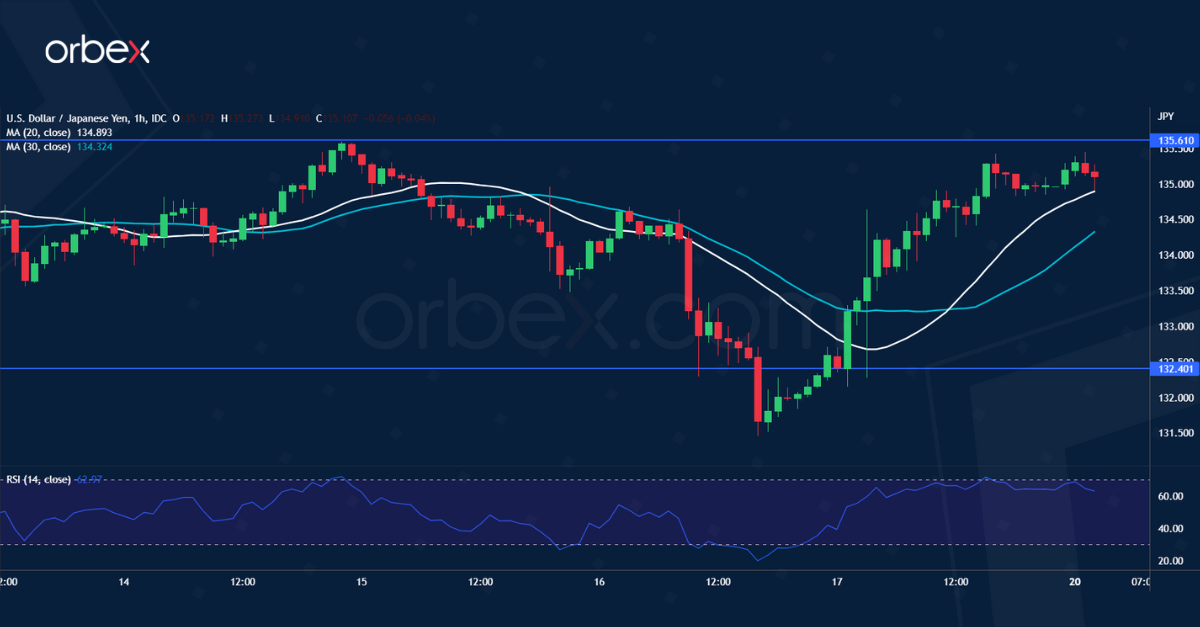
The Japanese yen fell back after the Bank of Japan vowed to keep interest rates ultra-low. A sharp U-turn above 134.50 has taken sellers by surprise and forced them to cover. A bullish MA cross suggests a possible acceleration to the upside. The recent peak at 135.60 is a key resistance and its breach could resume the rally towards 137.00. As the RSI goes into the overbought area, momentum buying could be fading as intraday traders take profit. The base of the latest surge at 132.40 would be the first support.
AUD/USD Technical Analysis 20th June 2022
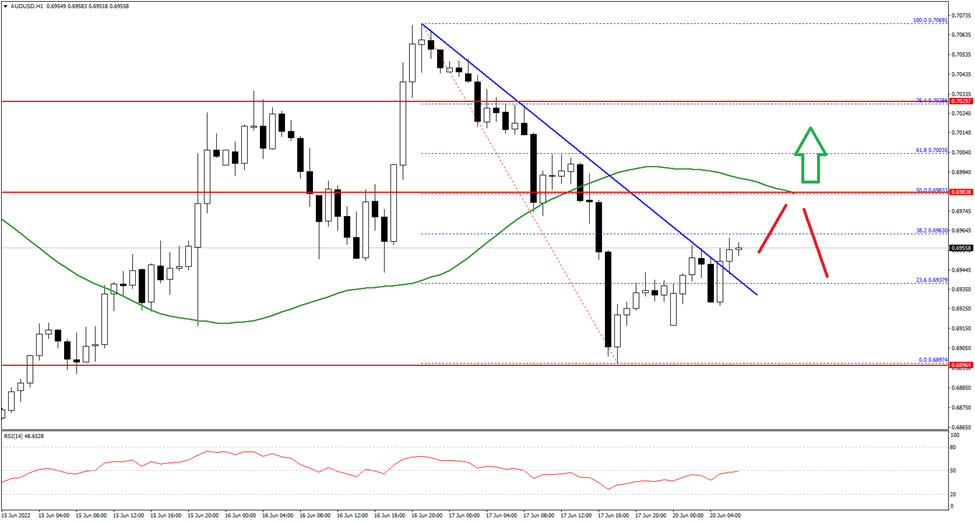
The Aussie Dollar started a fresh decline from the 0.7070 zone against the US Dollar. The AUD/USD pair traded below the 0.7000 support zone on FXOpen to enter a short-term bearish zone.
The pair gained pace for a move below the 0.6950 and settled below the 50 hourly simple moving average. The pair traded as low as 0.6897 and is currently correcting higher. It cleared a key bearish trend line with resistance near 0.6940 on the hourly chart.
The next key resistance on the upside is near the 0.6980 level and the 50 hourly simple moving average. If there is an upside break above the 0.6980 level, the pair could rise steadily towards the 0.7020 level in the near term. Any more gains could send the pair towards 0.7050.
An immediate support on the downside is near the 0.6940 level. The next key support is near the 0.6900 level. A downside break below the 0.6900 support could lead the pair towards the 0.6850 support.
GBP/JPY Daily Outlook
Daily Pivots: (S1) 163.32; (P) 164.78; (R1) 166.34; More...
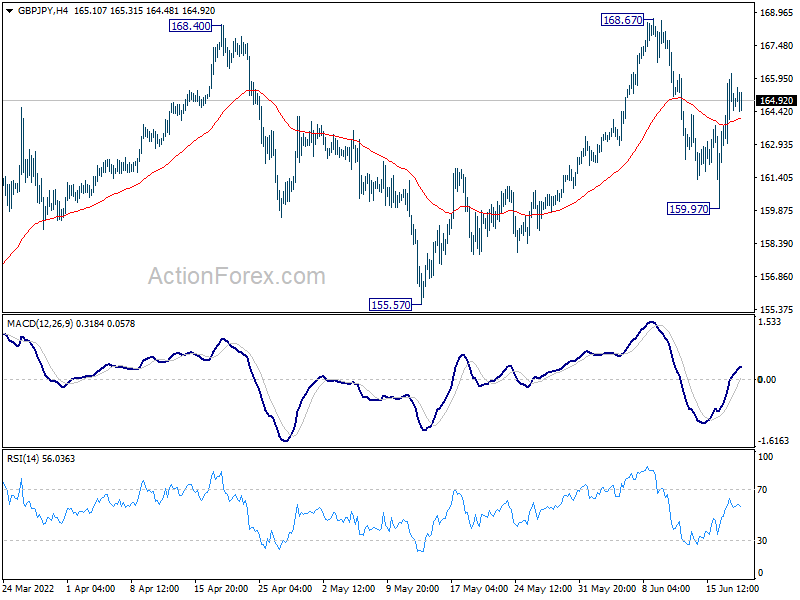
Intraday bias in GBP/JPY remains on the upside for retesting 168.67. Decisive break there will resume larger up trend. On the downside, however, break of 159.97 will bring deeper fall back towards 155.57 support instead.
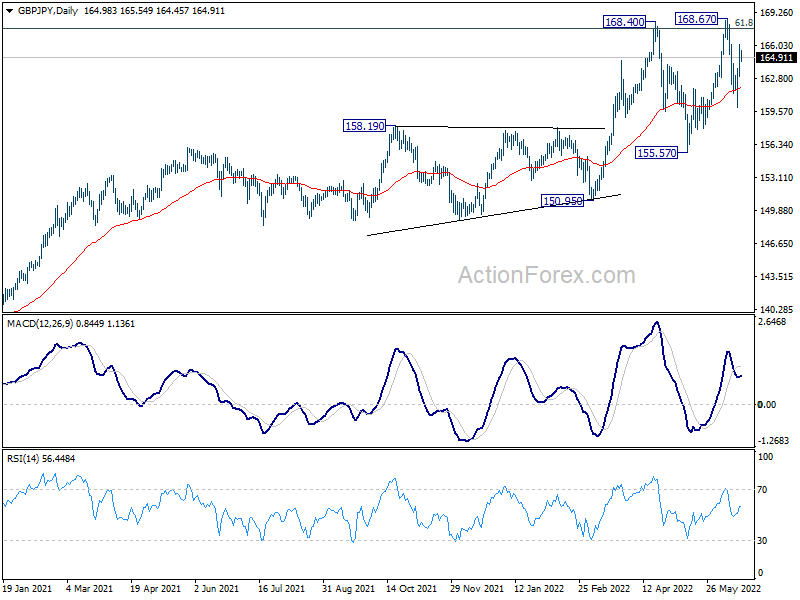
In the bigger picture, up trend from 123.94 (2020 low) is still in progress. Sustained break of 61.8% retracement of 195.86 (2015 high) to 122.75 (2016 low) at 167.93 will be a long term bullish signal, and could pave the way back to 195.86 high. This will now remain the favored case as long as 155.57 support holds, even in case of deep pull back.
EUR/JPY Daily Outlook
Daily Pivots: (S1) 140.08; (P) 141.03; (R1) 142.59; More....
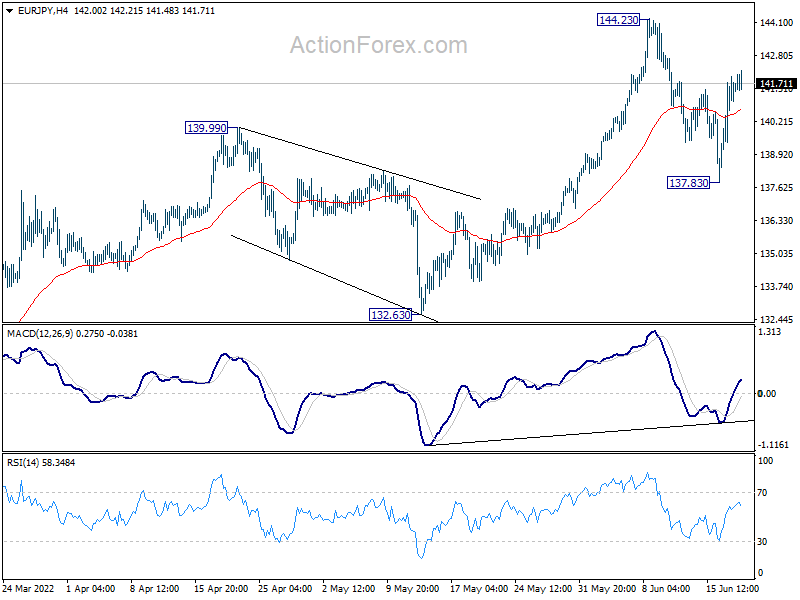
Intraday bias in EUR/JPY remains mildly on the upside for retesting 144.23 high. Firm break there will resume larger up trend. On the downside, below 137.83 will turn bias back to the downside to extend the correction from 144.23.
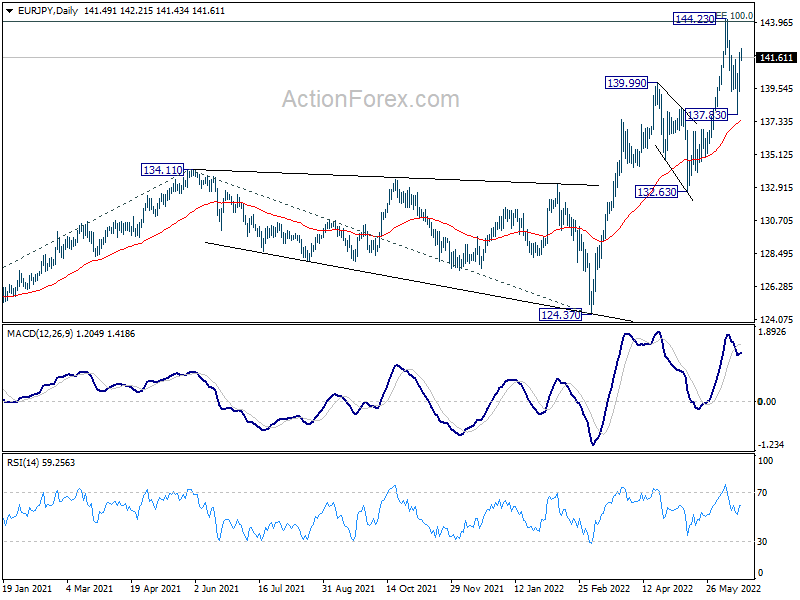
In the bigger picture, up trend from 114.42 (2020 low) is in progress. Such rise is seen as the third leg of the pattern from 109.30 (2016 low). Sustained trading above 100% projection of 114.42 to 134.11 from 124.37 at 144.06 will indicate upside acceleration and target 149.76 long term resistance (2014 high). In any case, outlook will now remain bullish as long as 132.63 support holds, in case of deep pull back.
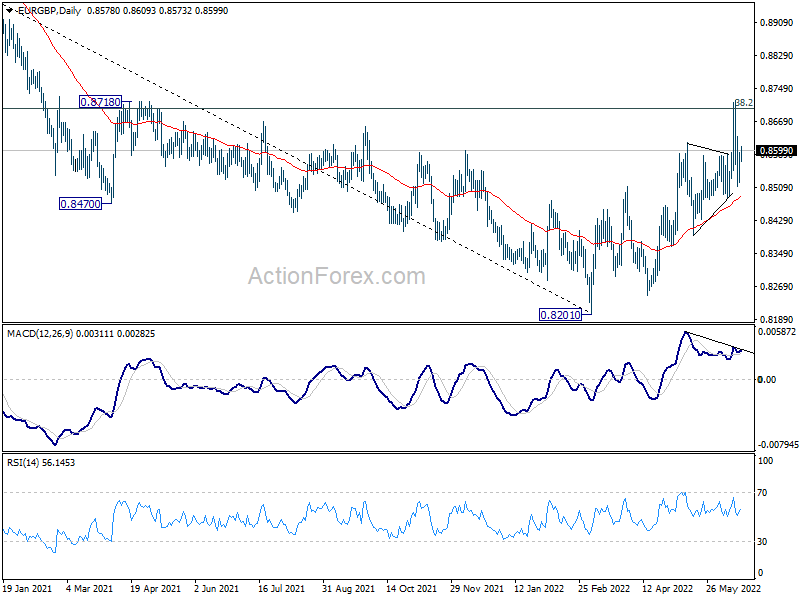
EUR/GBP Daily Outlook
Daily Pivots: (S1) 0.8544; (P) 0.8570; (R1) 0.8617; More...
Intraday bias in EUR/GBP remains neutral for the moment. Further rise is expected as long as 0.8484 support holds. Break of 0.8720 and sustained trading above 0.8697 medium term fibonacci level will carry larger bullish implication. Next target is 0.9003 fibonacci level. However, break of 0.8484 will indicate rejection by 0.8697 and turn near term outlook bearish.
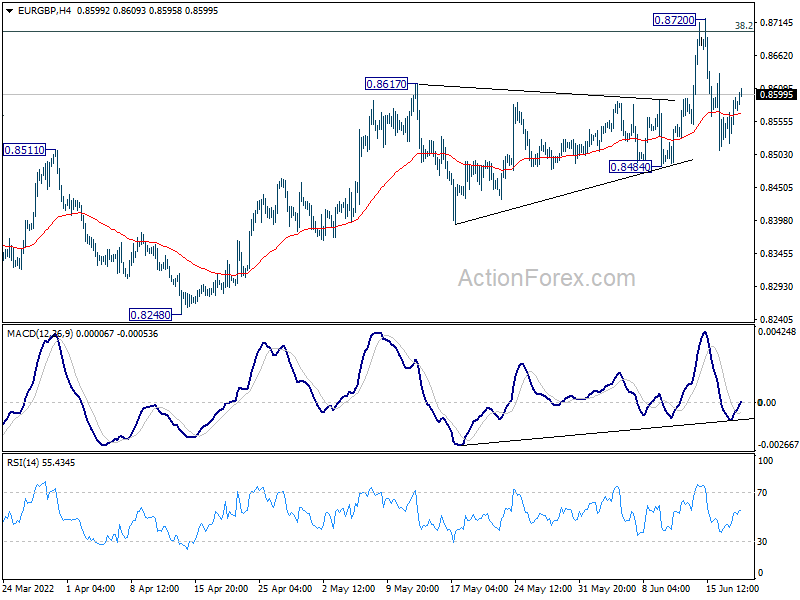
In the bigger picture, rise from 0.8201 medium term bottom could could either be a correction to the down trend from 0.9499 (2020 high), or a medium term up trend itself. Sustained break of 38.2% retracement of 0.9499 to 0.8201 at 0.8697 will affirm the latter case, and pave the way to 61.8% retracement at 0.9003. However, rejection by 0.8697 will maintain medium term bearishness.