Sample Category Title
Asia Drifts in Post-Holiday Doldrums
With US markets closed overnight, Asian markets are drifting today. Equities are mixed with currency markets are indulging in some modest US Dollar short covering as US bond futures fall. (yields up) Gold and silver remain comatose. Only oil is on the move, continuing its rally overnight as Shanghai eases more restrictions and the European Union announces a partial Russian oil ban.
Overnight, German inflation soared to 7.90%, with the HCIP for May leaping to 8.70%. Both numbers were well above forecast, sparking a sell-off in European government bonds. The ECB’s Lagarde and Lane also signalled a July lift-off for rate hikes and an end to quantitative easing. Some are already talking about the ECB hiking by 0.50% in July now, these are strange times we live in. Although the Euro got a brief lift from the inflation data and ECB comments, it stalled ahead of 1.0800 as European growth fears ratcheted higher.
The data in Asia today has been a mixed picture. South Korean Industrial and Construction Production held steady for April, but Retail Sales eased to just 0.50% YoY for April as the cost of living increased and Bank of Korea hikes start to bite. The Australian Current Account fell to AUD 7.50 billion for Q1, old news by now, but Private Sector Credit and Business Inventories for April remained steady. Japan’s Retail Sales for April YoY surged to 2.90% thanks to a reopening boom in consumption, it probably won't last. Meanwhile, Industrial Production in April MoM fell by 1.30%, with China’s covid zero restrictions making their presence felt. All-in-all, it suggested that Asia-Pacific ex-China continues to keep its head above water, but with no chance of breaking the 50-metre crawl record.
Most importantly, China's Manufacturing and Non-Manufacturing PMIs showed some signs of life after the shocking April numbers. May Manufacturing PMI rose 49.6, with Services PMI recovering to 47.8. Both numbers remain below 50.0 and are thus in contractionary territory. But are markedly less so thanks to an easing of restrictions in Beijing and Shanghai. A less worse than expected set of data has prompted a modest rally in China equities today, holding the promise of an accelerating recovery in June if the virus situation remains benign. That’s a big if.
This afternoon, it is France and Italy’s turn to release May Inflation and although neither is likely to reach German levels, both have upside risks now. Eurozone Inflation, though, is set to rise to 7.70% YoY for May with upside risks as well. With the partial EU ban on Russian oil imports now in the home straight, inflation nerves will be even tauter, especially after the ECB comments on monetary policy overnight. Expect another European bond sell-off if the inflation prints come in above forecasts. That will be a mixed blessing once again for the Euro, although I suspect growth fears will continue capping the topside.
The inflationary pressures and the accompanying noise around recessions as central bank’s hands are forced, are slowly permeating their way out of what I call the Anglo-Saxon world, and into Europe and Asia. Europe’s position is more complicated as it is effectively moving into a wartime economy for some time to come. That is going to complicate the growth picture everywhere and give the bottom fishers of the equity and bond markets pause for thought. Inflation is a new concept for anyone who started working in financial markets in the last 20 years, and this time, the world's central banks won’t be able to cut rates or open the QE tap. Some may describe the end of the artificial 15-year edifice constructed by global monetary policy to steal the wealth of our children, NPV-ing it to the present day to keep the party going, as a disaster, I call it an economic cycle. Welcome back, you have been missed.
One last word for FOMO bottom-fishers, Brent crude is above $122.00 a barrel and Europe is enacting a Russian oil ban. The Fed starts quantitative tightening this week. Just saying this on behalf of a friend.
Asian markets mixed after the US holiday
US markets were closed overnight, but European markets enjoyed a positive overnight session, grasping the baton from Asia. Equity markets have had some of the gloss removed thanks to hawkish ECB comments and higher than expected German inflation. Today in Asia, US futures are all over the place, raising a red flag on holiday-market liquidity and bored dentists in Minnesota trading from their studies to get away from the kids. S&P 500 futures are 0.15% higher, with Nasdaq futures falling by 0.60%, and Dow futures easing 0.20% lower.
In Asia, the picture is equally mixed after this morning’s data releases showed signs of an incipient recovery in China but presented a very mixed picture elsewhere. Oil’s rally continues in Asia after the announcement of the partial EU oil ban on Russian oil. A headwind for energy-hungry Asia.
Japan’s Nikkei 225 is unchanged with the retail army lost with the Nasdaq to coattail. The Kospi is just 0.10% higher. Mainland China markets are rallying after less-worse PMIs and an easing of Shanghai restrictions. The Shanghai Composite has gained 0.70%, with the CSI 300 rallying by 1.05%. Hong Kong, meanwhile, absent US markets for direction, has added just 0.35%.
Regionally, Singapore is 0.40% higher, with Taipei down 0.05%, and Kuala Lumpur easing by 0.10%. Jakarta is 0.25% higher post-GOTO’s first public quarterly result, while Bangkok is down 0.20%, and Manila has lost 0.45%. Australian markets are retracing some of yesterday's gains, the ASX 200 falling 0.65%, while the All Ordinaries have lost 0.50%.
The partial EU oil ban on Russian imports, and a mixed picture in Asia, is likely to see European markets open slightly lower this afternoon. The turkey shoot known as the US open remains just that, it really depends on what mood they come back from holiday in, although the rise in US yields in Asia may give the bulls some pause for thought, as will hawkish comments from the Fed’s Waller overnight. The meeting between President Biden, Treasury Secretary Yellen, and Fed Chairman Jerome Powell should be a non-event. President Biden will moan about his prospects in November’s mid-terms, Mr Powell will say that’s not his job, even if he hasn’t done that job very well up until now. The end.
US Dollar stages corrective recovery on a quiet day
Currency markets are quiet post the US holiday overnight, and that has allowed a modest short-covering US Dollar rally to develop after US yields ticked higher in Asia. The dollar index has added 0.26% to 101.63 this morning, mid-range between support/resistance at 101.00 and 102.50.
EUR/USD has given back most of its overnight gains, easing 0.28 to 1.0750 today. The overnight rise in oil prices, the EU Russian oil ban, and the tick higher in US yields are likely the cause of the retreat. EUR/USD is struggling to find the momentum to challenge resistance at 1.0800 and 1.0830, with support remaining at 1.0700.
GBP/USD also faded ahead of resistance at 1.2700, falling 0.36% to 1.2610 this morning. That has brought support at 1.2600 back into play, with failure potentially extending losses to 1.2500.
USD/JPY has seen an immediate reaction to firming bond yields overnight and this morning internationally. USD/JPY rose through resistance at 127.50 overnight, gaining 0.405 to 127.62. Today it has booked another 0.28% gain to 128.00. If nothing else, it highlights that the overriding driver of USD/JPY direction remains the US and to a lesser extent, European/Japan rate differentials.
AUD/USD and NZD/USD posted modest gains overnight but have given all of those back as long-covering set in today and risk sentiment dipped. AUD/USD has faded ahead of 0.7200 resistance, falling 0.22% to 0.7180 today, with interim support at 0.7150. NZD/USD has fared worse, falling 0.37% to 0.6535, with resistance at 0.6570 holding overnight. Both currencies remain at the mercy of global swings in risk sentiment.
USD/Asia is also rising today as the EU Russian oil ban and the rise in US yields have flowed through into US Dollar strength. That said, the losses today have only partially retraced the recent gains by CNY, CNH, KRW, NTD and MYR, and as such I am not reading too much into the price action given it is a quiet day. At this stage, it looks corrective, and we will have to wait until the US session for more direction.
Europe's ban on Russian oil sends black gold higher
The announcement that a partial EU ban on Russian oil imports has made it over the finish line sent oil prices higher overnight. Recovering PMI data from China today, and by default recovering energy consumption, has seen the rally continue in Asia. The price action by oil this past week has been ominous, suggesting that supplies of refined products is getting worse, and not better. The EU oil ban on Russia further complicates that picture and I am wondering how long markets can continue bottom-fishing elsewhere while ignoring oil’s price rise.
Overnight, Brent crude rose by 2.05% to $121.65 a barrel, and today, it has rallied another 1.20% to $123.10. WTI rallied by 2.20% to $177.65 overnight, gaining another 0.80% to $118.55 in Asia today. Brent crude is now a hair's breath away from resistance at $123.80, after which there is no resistance on the charts until $131.60 a barrel. Support lies at $116.00 a barrel. WTI has taken out resistance at $116.70 a barrel, which now becomes support, followed by $116.00. The $120.00 region will provide some psychological, and possibly option-related resistance, but there is now nothing on the charts until $126.80 barrel.
Markets will find no solace from this week’s OPEC+ production meeting, as outlined in yesterday's note. If China is reopening, and Europe is limiting Russian oil, there is only one obvious direction from here, for too long, ignored by markets. Only a surprise Iran deal, unlikely as they are seizing tankers at the moment, or a capitulation to Venezuela’s autocratic government, could change the supply/demand dynamic. Neither would alleviate the squeeze in refined products underpinning the rally.
Gold trades sideways
Gold seems determined to bore traders to death after another inconclusive overnight range-trading session. It probed resistance around $1860.00 an ounce overnight but retreated to finish just 0.14% higher at $1855.80 an ounce, marking another inconclusive session. Ominously, gold has fallen in Asia at the first sign of US Dollar strength, Gold has eased by 0.13% to $1853.50 an ounce. Gold’s price action continues to suggest caution, with the US Dollar sell-off not translating to any meaningful gold strength. If global risk sentiment turns lower, gold could quickly follow.
Gold has nearby support at $1840.00, followed by $1836.00 an ounce. Failure sees the possibility of a mini-capitulation by longs that could reach as far as $1780.00 an ounce. Gold has resistance here at $1862.00, then $1870.00, followed by $1886.00 an ounce, its 100-day moving average.
Technical Outlook and Review
DXY:
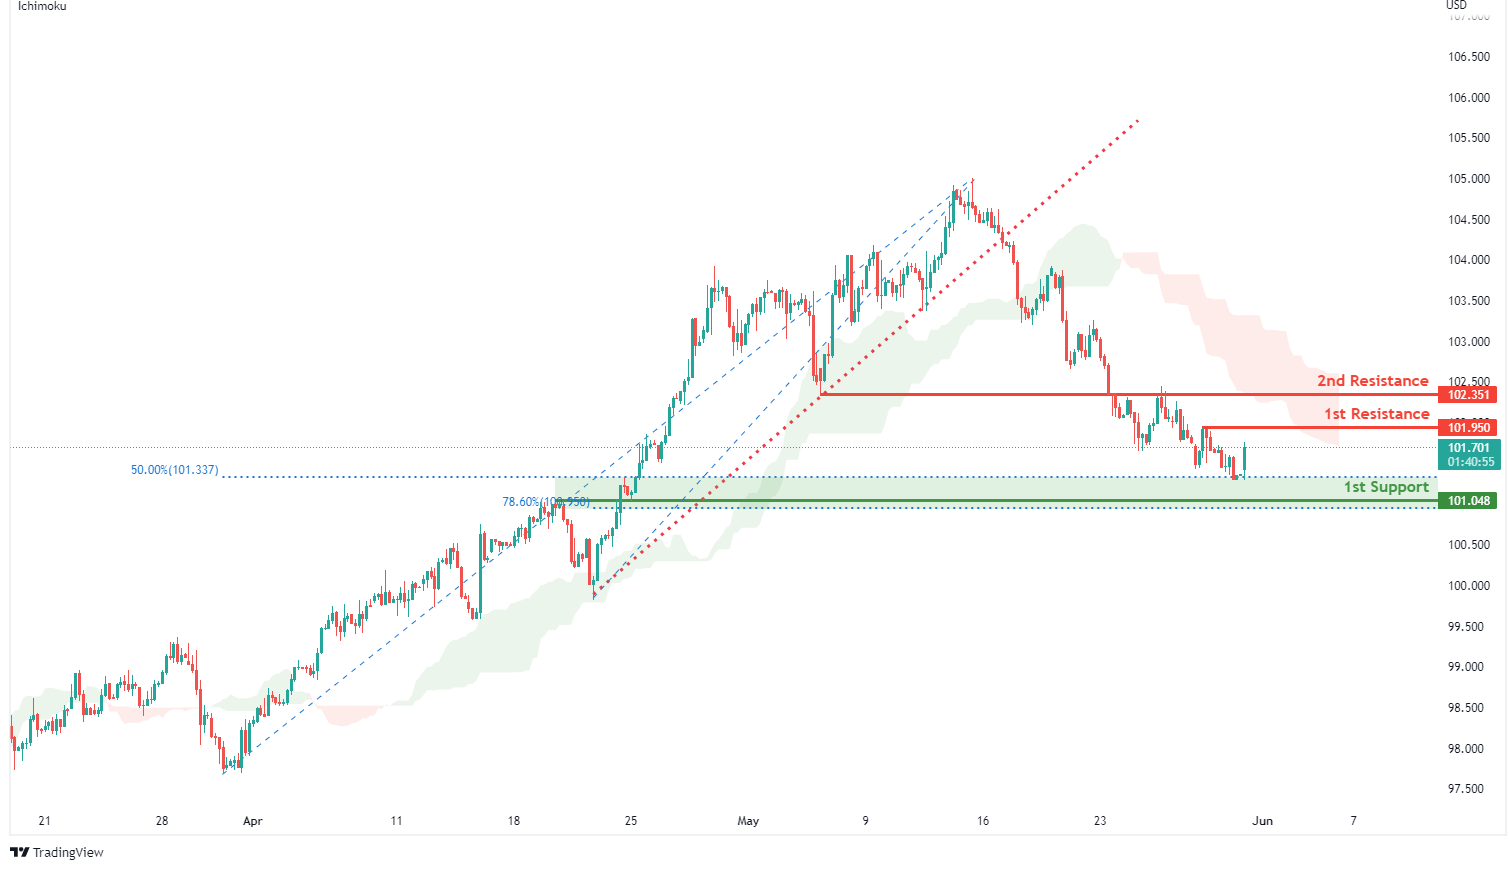
On the H4, with prices moving below the ichimoku indicator and breakout from the ascending trendline, we have a bearish bias that price will drop to our 1st support at 101.048 where the horizontal pullback support, 78.6% fibonacci retracement and 50% fibonacci retracement are from our 1st resistance at 101.950 in line with the horizontal swing high resistance. Alternatively, price may break 1st resistance structure and head for 2nd resistance at 102.351 where the horizontal overlap resistance is.
Areas of consideration:
- H4 time frame, 1st resistance at 101.950
- H4 time frame, 1st support at 101.048
XAU/USD (GOLD):
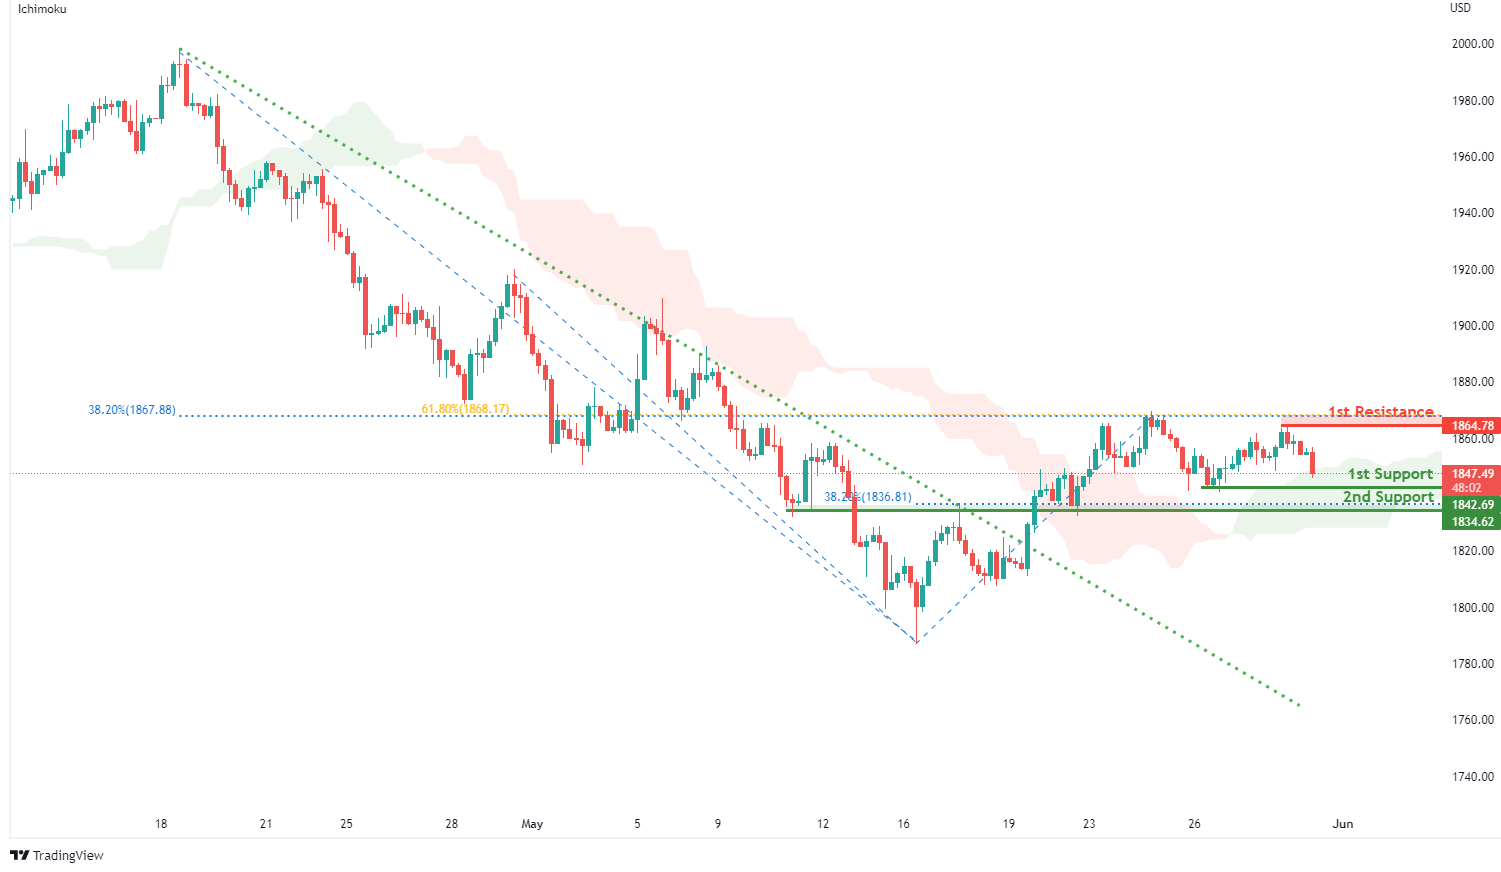
On the H4, with prices bouncing off the ichimoku cloud and breakout from descending trendline, we have a bullish bias that price will rise from our 1st support at 1842.69 where the horizontal swing low support is to our 1st resistance at 1864.78 in line with the horizontal swing high resistance,61.8% Fibonacci retracement and 38.2% Fibonacci retracement. Alternatively, price may break 1st support structure and head for 2nd support at 1834.62 where the horizontal overlap support and 38.2% fibonacci retracement are.
Areas of consideration:
- H4 time frame, 1st Resistance at 1864.78
- H4 time frame, 1st Support at 1842.69
GBP/USD:
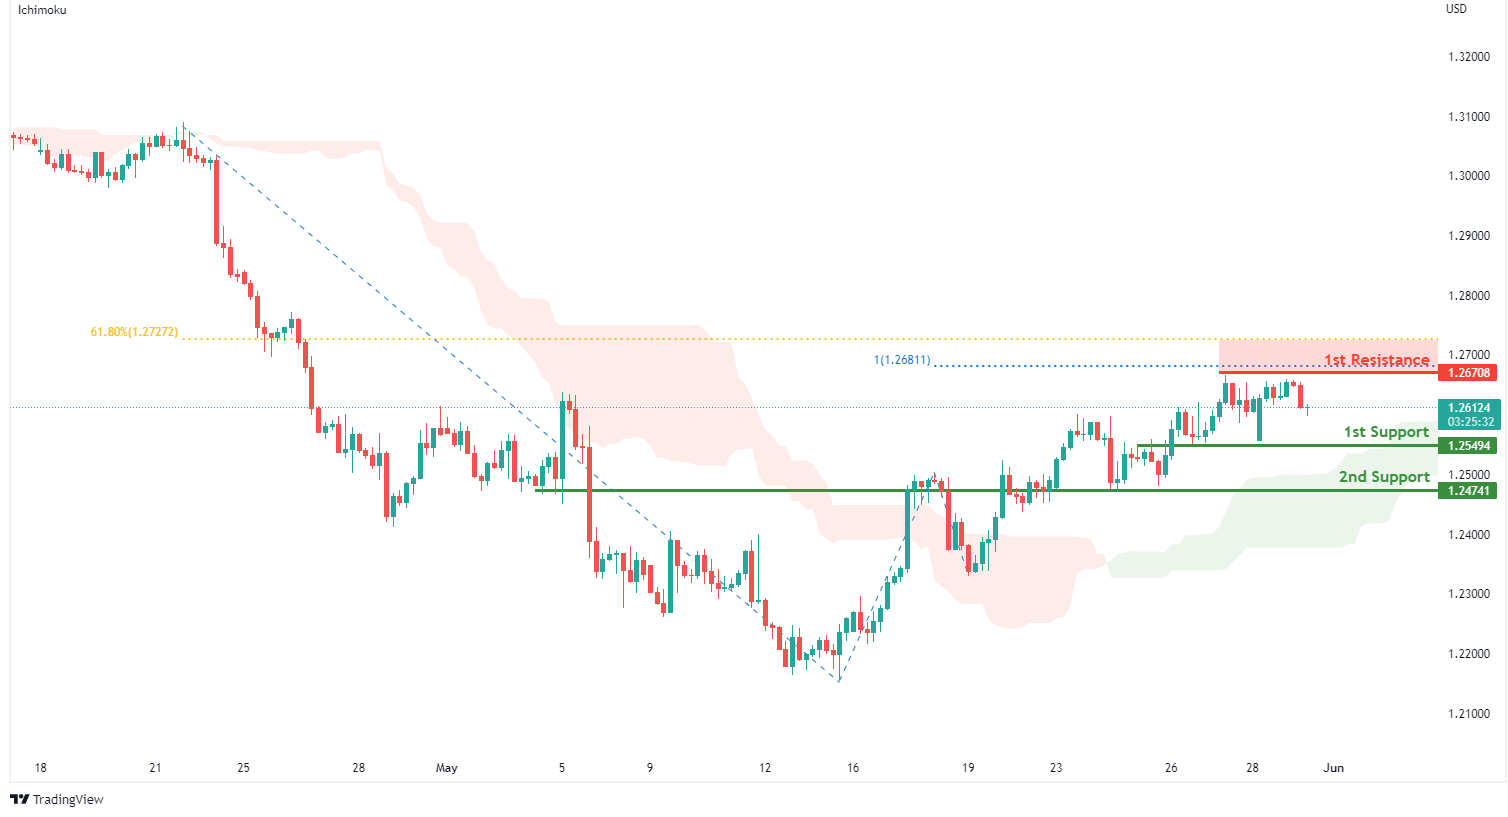
On the H4, with price moving above the ichimoku indicator, we have a bullish bias that price will rise from our 1st support at 1.25494 where the horizontal overlap support is to our 1st resistance at 1.26708 in line with the 61.8% Fibonacci retracement, 100% Fibonacci projection and swing high resistance. Alternatively, price may break 1st support structure and head for 2nd support at 1.24741 where the horizontal overlap support is.
Areas of consideration:
- H4 1st resistance at 1.26708
- H4 1st support at 1.25494
USD/CHF:
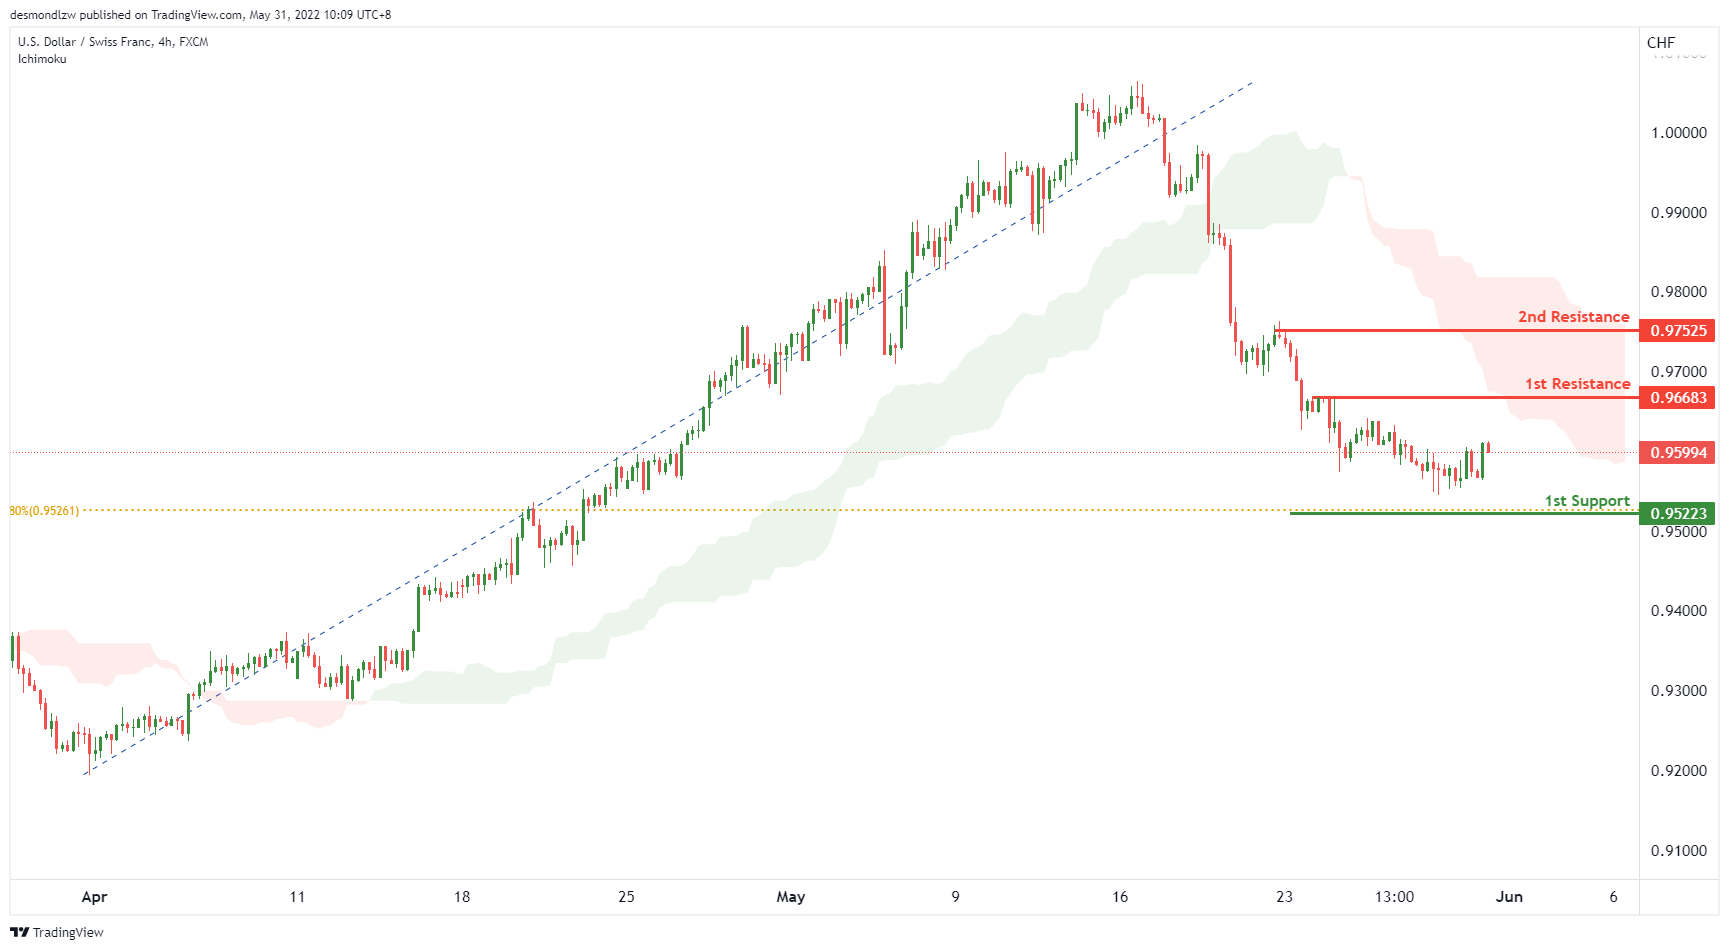
On the H4, with price moving below the ichimoku cloud, we have a bearish bias that price will drop to our 1st support at 0.95223 where the 61.8% Fibonacci retracement is from our 1st resistance at 0.96673 in line with the pullback resistance. Alternatively, price may break 1st resistance structure and head for 2nd resistance at 0.97525 where the swing high resistance is.
Areas of consideration
- 1st support level at 0.95223
- 1st resistance level at 0.96673
EUR/USD :
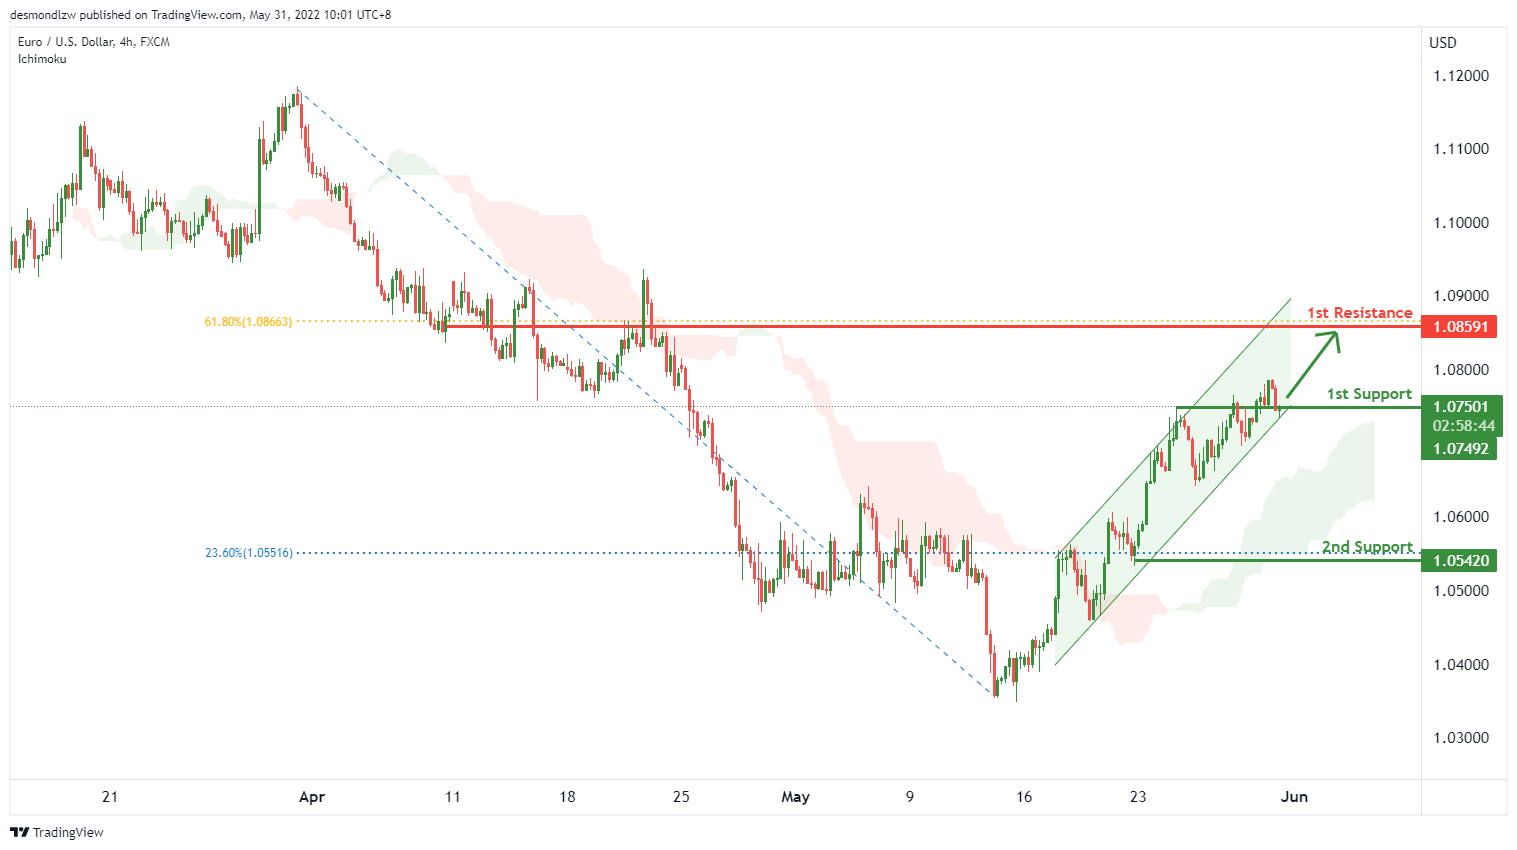
On the H4, with price moving above the ichimoku cloud and within the ascending trend channel, we have a bullish bias that price will rise to our 1st overlap resistance at 1.08591 where the 61.8% Fibonacci retracement is from our 1st support at 1.07492. Alternatively, price may break 1st support structure and head for 2nd support at 1.0542 in line with the 23.6% fibonacci retracement.
Areas of consideration :
- H4 1st resistance at 1.08591
- H4 1st support at 1.07492
USD/JPY:
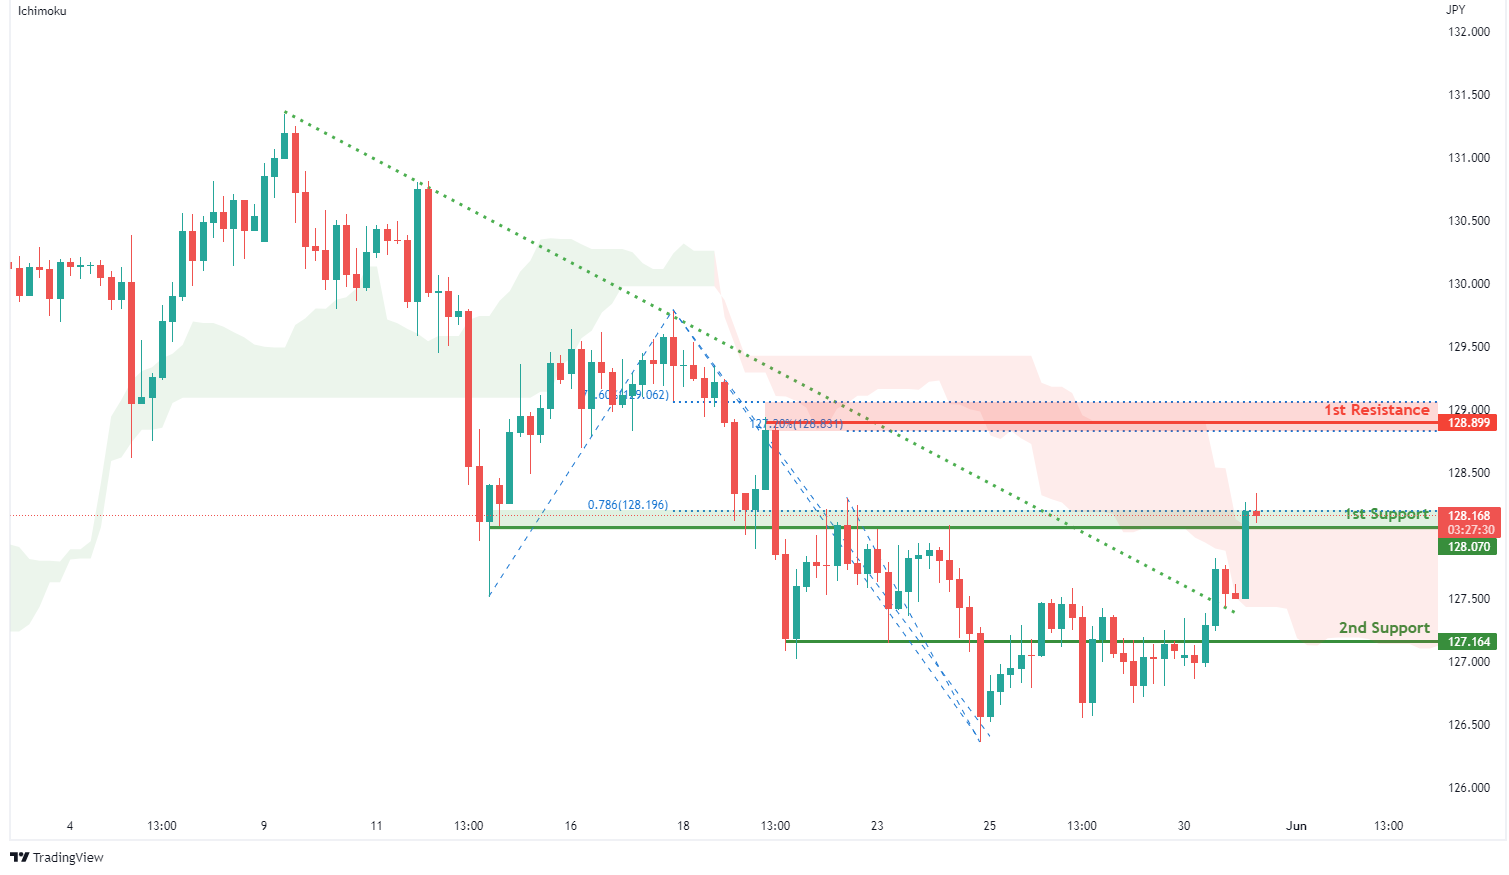
On the H4, with prices breaking above the ichimoku indicator and breakout from descending trendline, we have a bullish bias that price will rise from our 1st support at 128.070 where the horizontal overlap resistance and 78.6% fibonacci projection are to our 1st resistance at 128.899 in line with the swing high resistance, 127.2% Fibonacci extension and 78.6% fibonacci retracement. Alternatively, price may break 1st support structure and head for 2nd support at 127.164 where the horizontal overlap support is.
Areas of consideration:
- H4 time frame, 1st resistance at 128.899
- H4 time frame, 1st support at 128.070
AUD/USD:
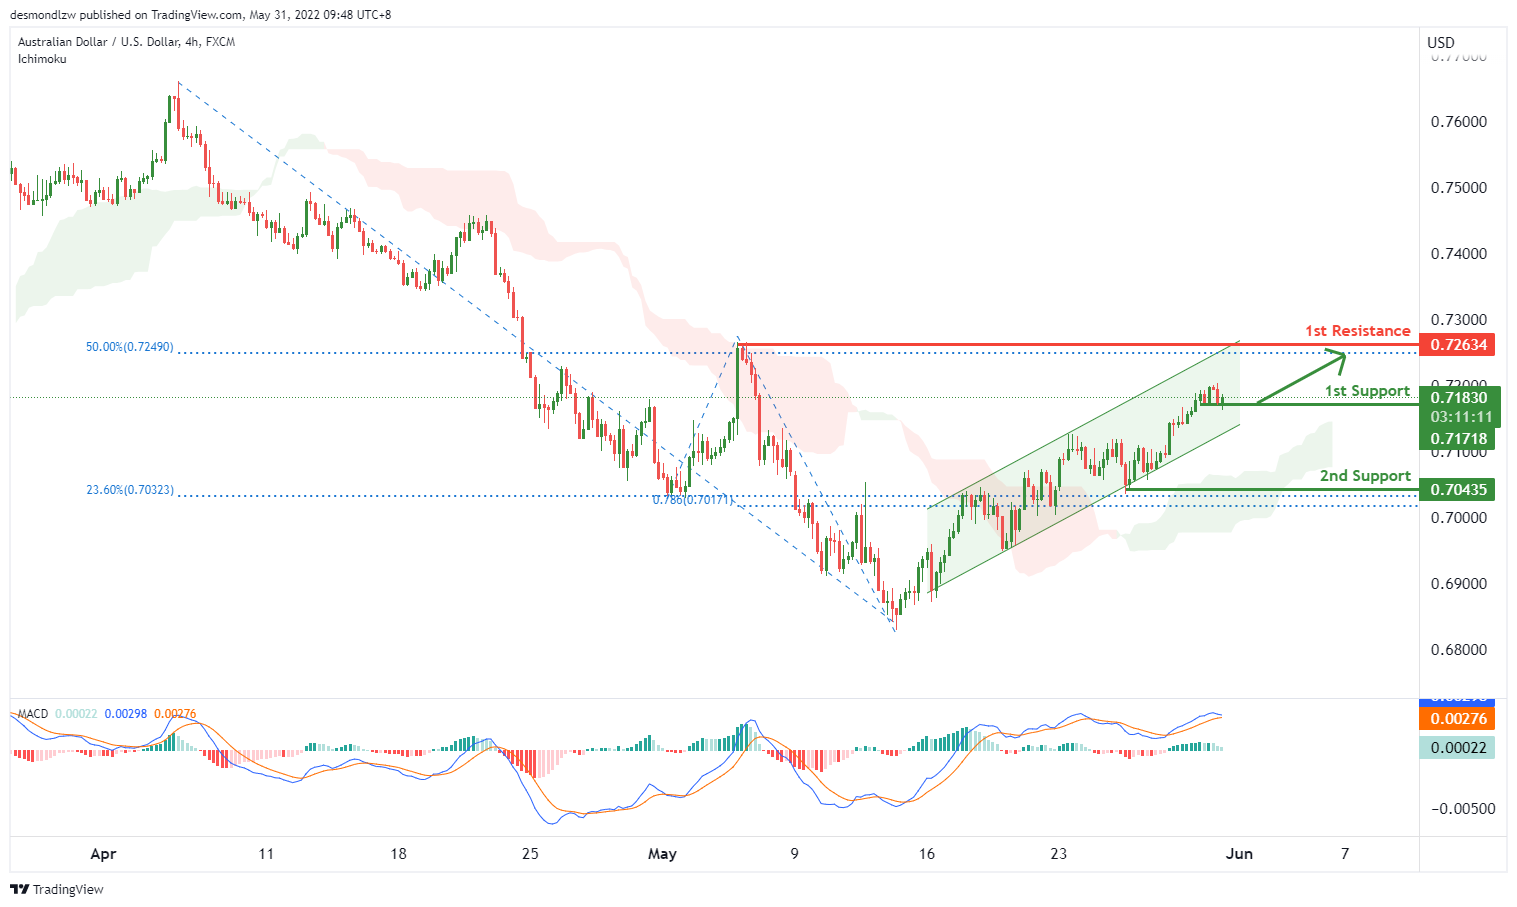
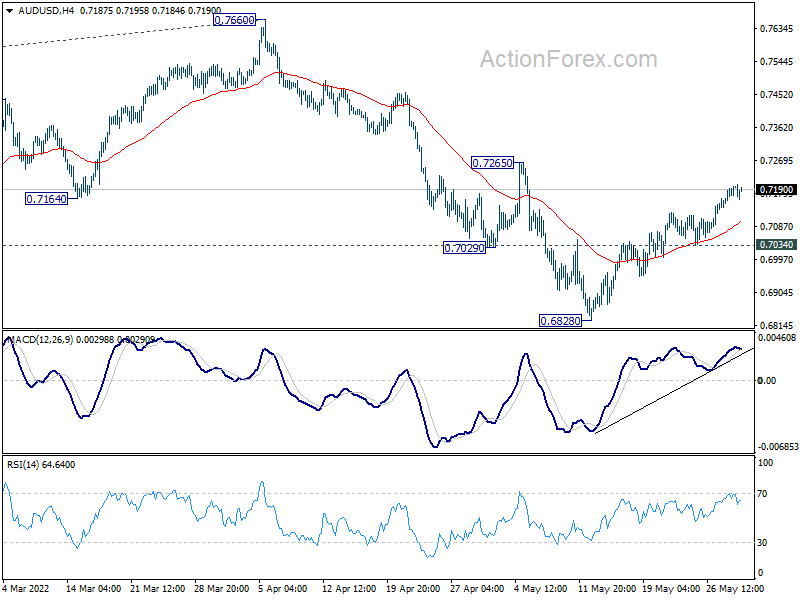
On the H4, with price moving above the ichimoku cloud and price moving within the ascending trend channel, we have a bullish bias that price will rise to our 1st resistance at 0.72634 where the swing high is in line with the 50% Fibonacci retracement from our 1st support at 0.71830. Additionally, price is moving into a bullish pressure as shown in the MACD indicator which supports our bullish bias. Alternatively, price may break 1st support and head for 2nd support at 0.70435 where the horizontal pullback support is, in line with the 78.6% fibonacci projection and 23.6% Fibonacci retracement.
Areas of consideration
- H4 1st resistance at 0.72634
- H4 1st support at 0.71830
NZD/USD:
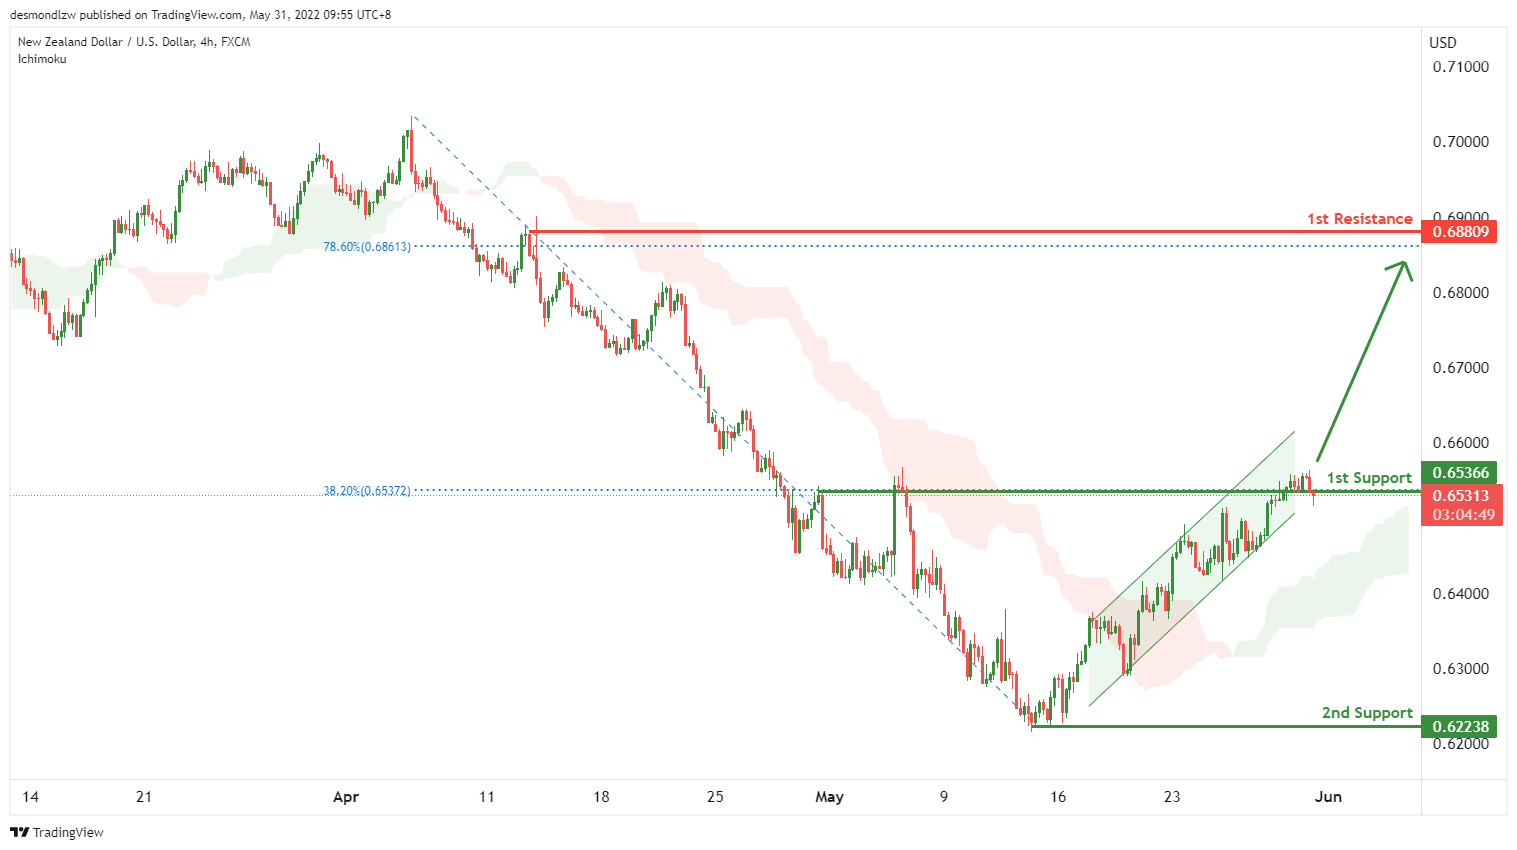
On the H4, with price moving above the ichimoku cloud, we have a bullish bias that price will rise to our 1st resistance at 0.68809 where the swing high resistance is in line with the 78.6% fibonacci retracement from our 1st support at 0.65366 in line with the overlap support and 38.2% Fibonacci retracement. Alternatively, price may reverse from the support and head for 2nd support at 0.62238 in line with the swing low.
Areas of consideration:
- H4 time frame, 1st support at 0.65366
- H4 time frame, 1st resistance at 0.68809
USD/CAD:
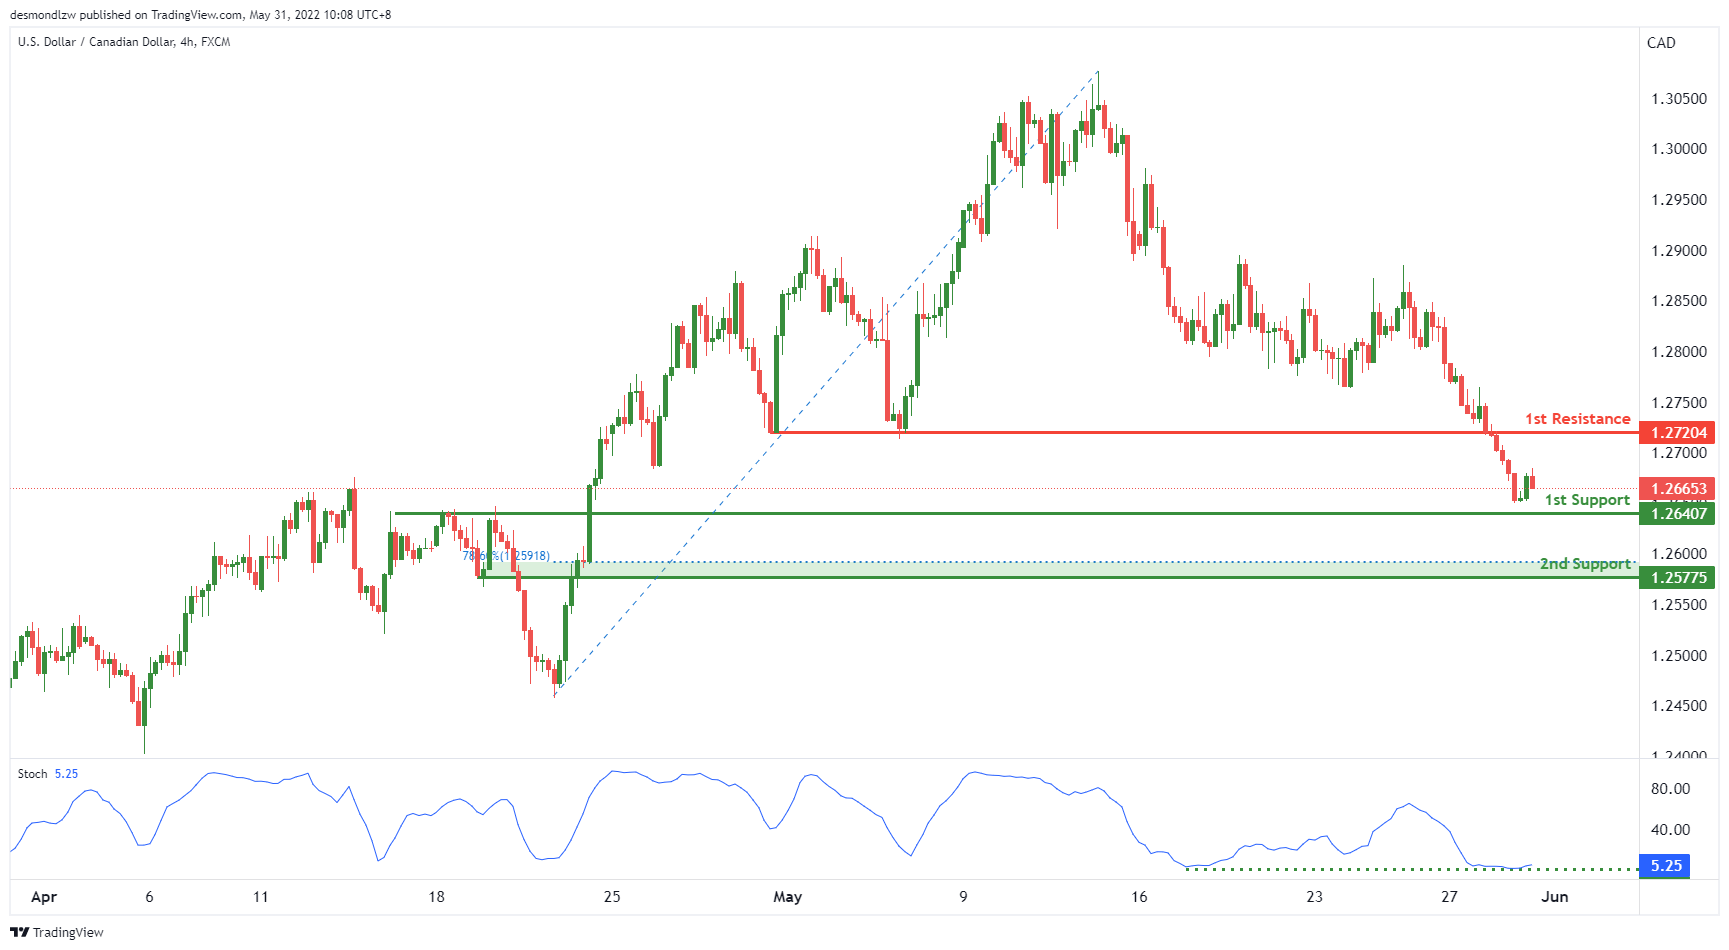
On the H4, with price expected to bounce off the stochastics, we have a bullish bias that price will rise to our 1st resistance at 1.27204 where the horizontal pullback resistance is from our 1st support at 1.27407 in line with the horizontal pullback support.
Areas of consideration:
- H4 time frame, 1st resistance at 1.27204
- H4 time frame, 1st support at 1.27407
OIL:
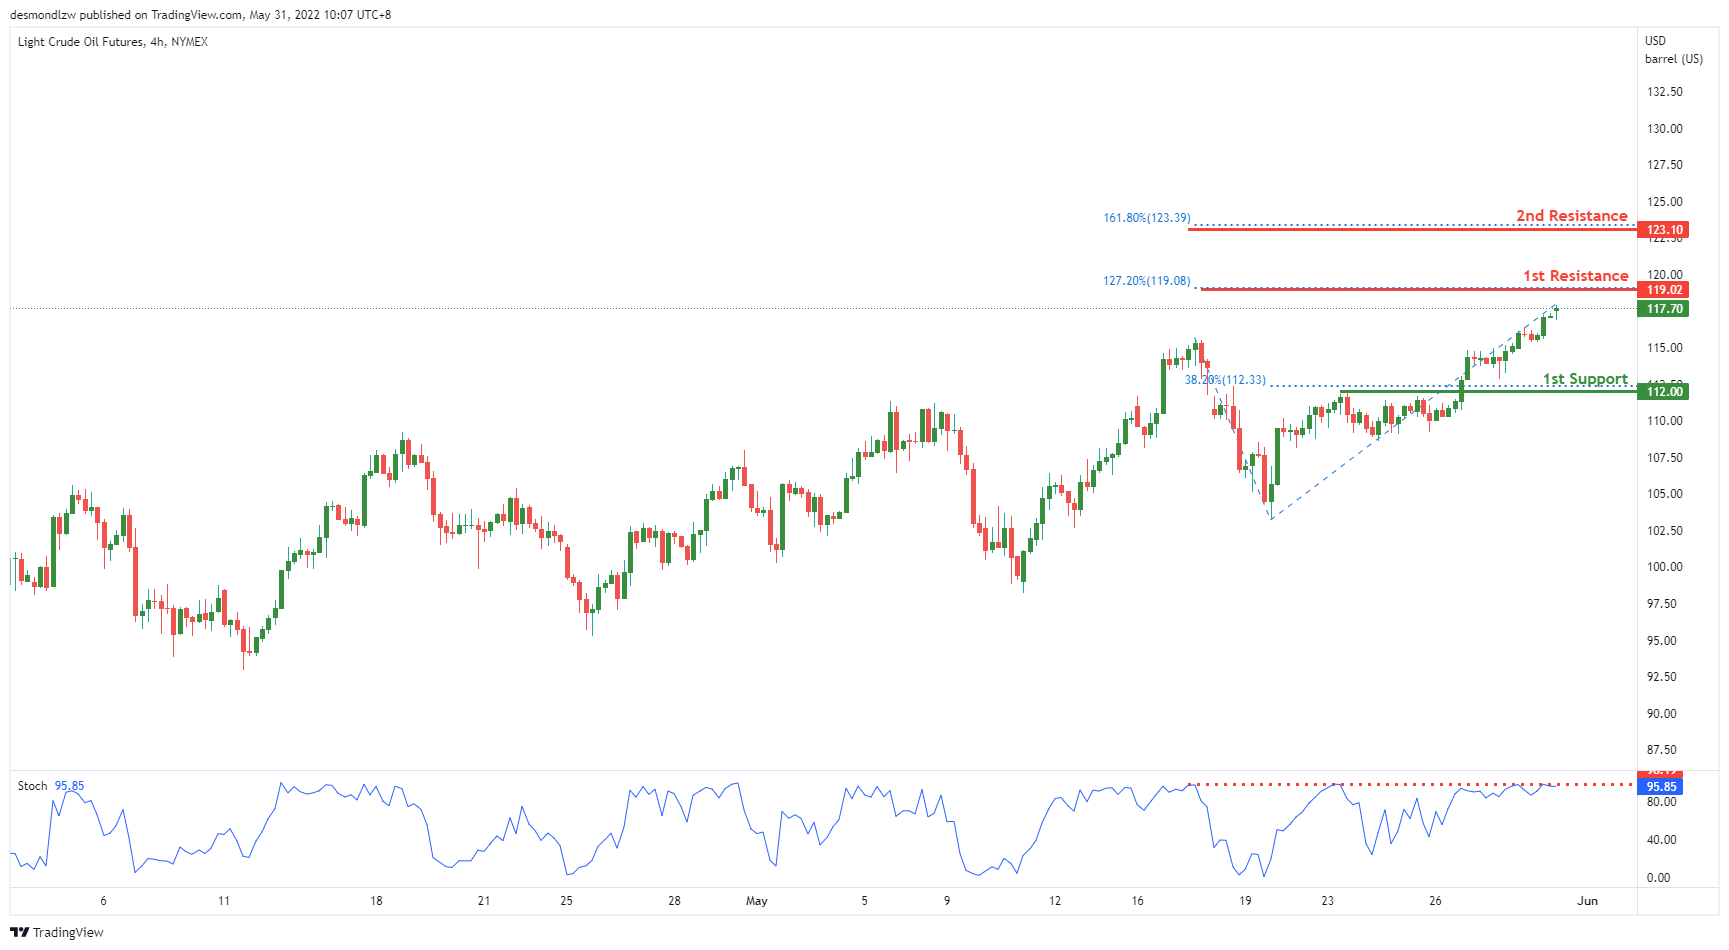
On the H4, with price expected to reverse off the stochastics indicator, we have a bearish bias that price will drop to our 1st support at 112 where the 23.6% Fibonacci retracement is from our 1st resistance at 119.02 in line with the swing high resistance. Alternatively, price may break 1st resistance structure and head for 2nd resistance at 123.10 where the 127.2% Fibonacci extension is.
Areas of consideration:
- H4 time frame, 1st resistance of 119.02
- H4 time frame, 1st support of 112
Dow Jones Industrial Average:
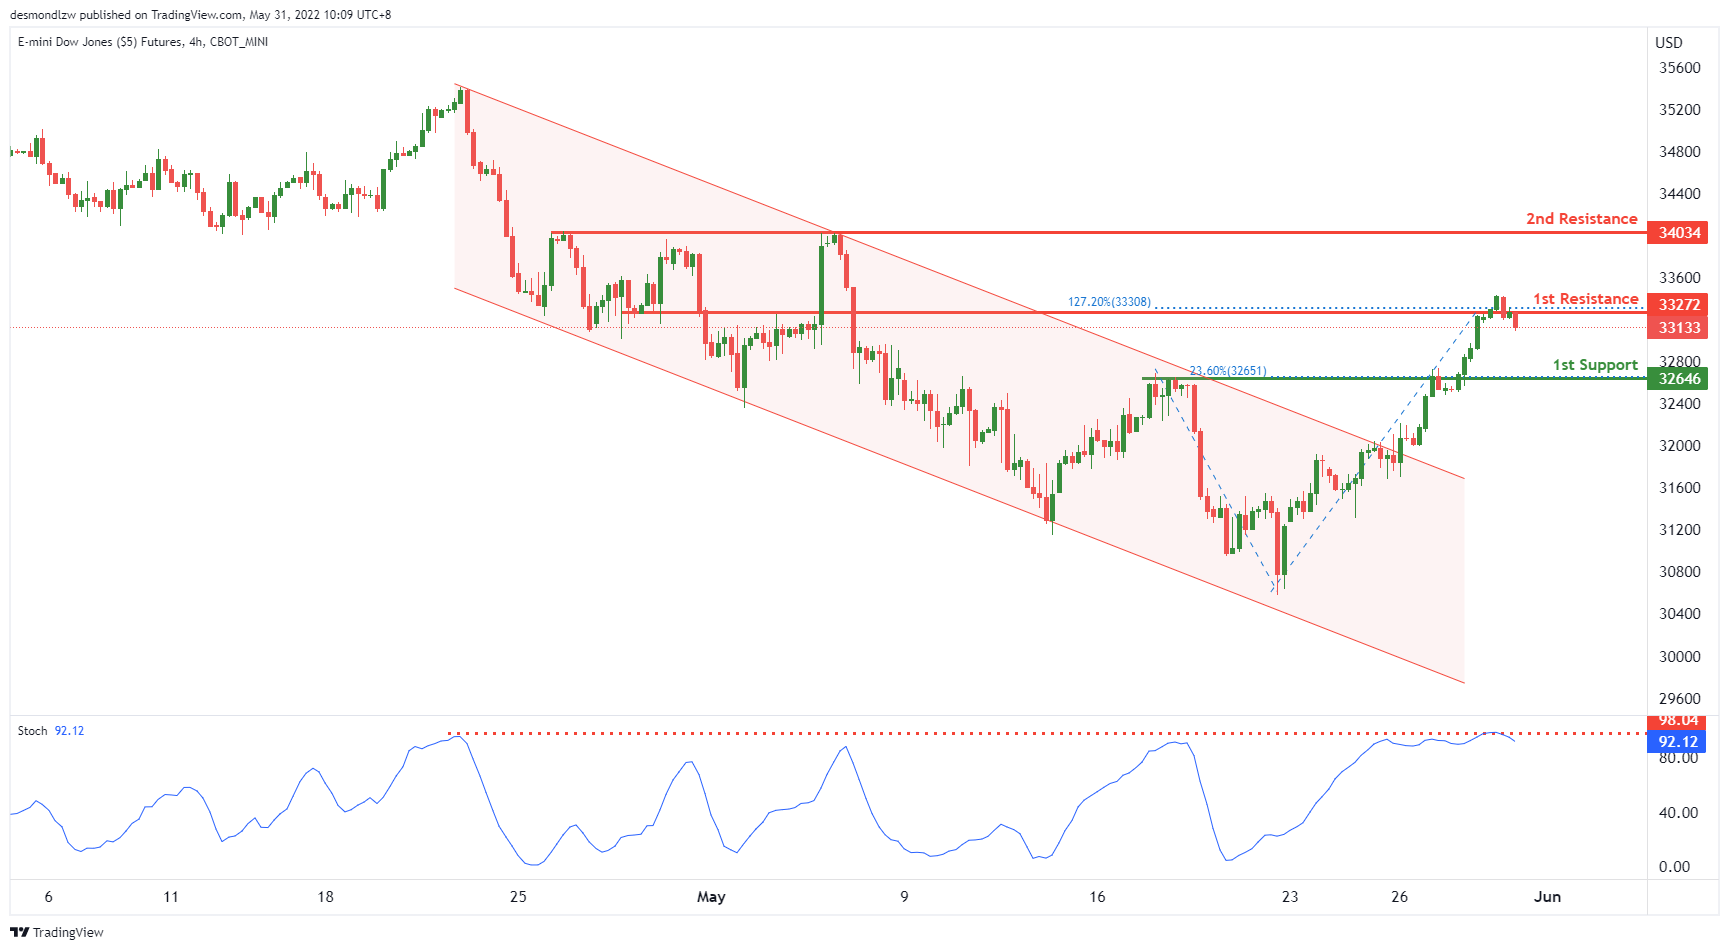
On the H4, with price expected to reverse off the stochastics indicator, we have a bearish bias that price will drop to our 1st support at 32646 where the 38.2% Fibonacci retracement is from our 1st resistance at 33133 in line with the swing high resistance. Alternatively, price may break 1st resistance structure and head for 2nd resistance where the horizontal swing high resistance is.
Areas of consideration :
- H4 time frame, 1st resistance at 33133
- H4 time frame, 1st support at 32646
EUR/USD Daily Outlook
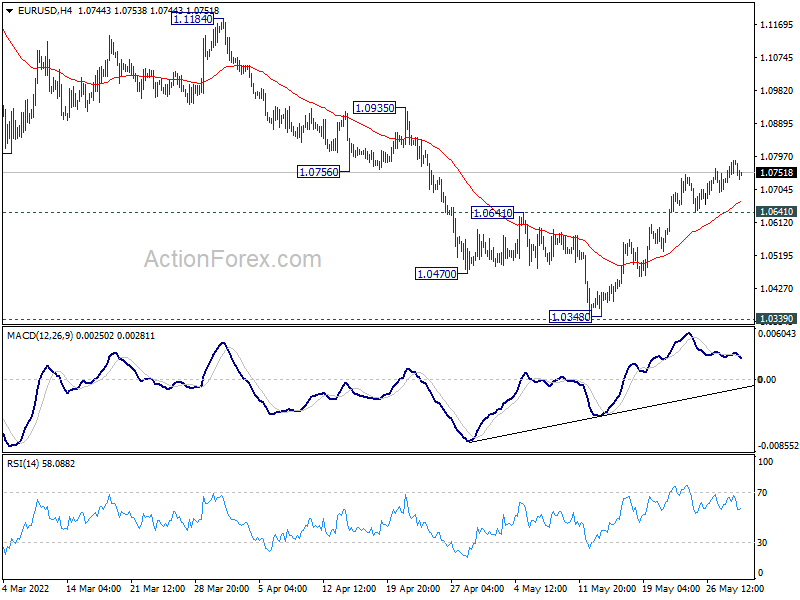
Daily Pivots: (S1) 1.0742; (P) 1.0764 (R1) 1.0803; More...
Further rise is still in favor in EUR/USD with 1.0641 minor support intact. Sustained trading above 55 day EMA (now at 1.0758) will target 1.0935 resistance next. On the downside, however, break of 1.641 minor support will turn bias back to the downside for retesting 1.0348 low instead.
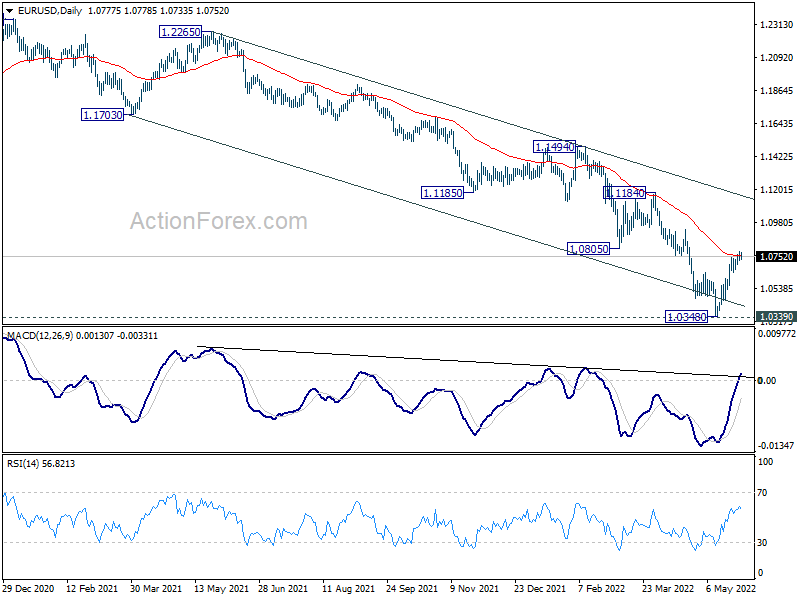
In the bigger picture, focus stays on 1.0339 long term support (2017 low). Decisive break there will resume whole down trend from 1.6039 (2008 high). Next target is 61.8% projection of 1.3993 to 1.0339 from 1.2348 at 1.0090. However, firm break of 1.0805 support turned resistance will delay this bearish case and bring medium term corrective rebound first.
USD/CHF Daily Outlook
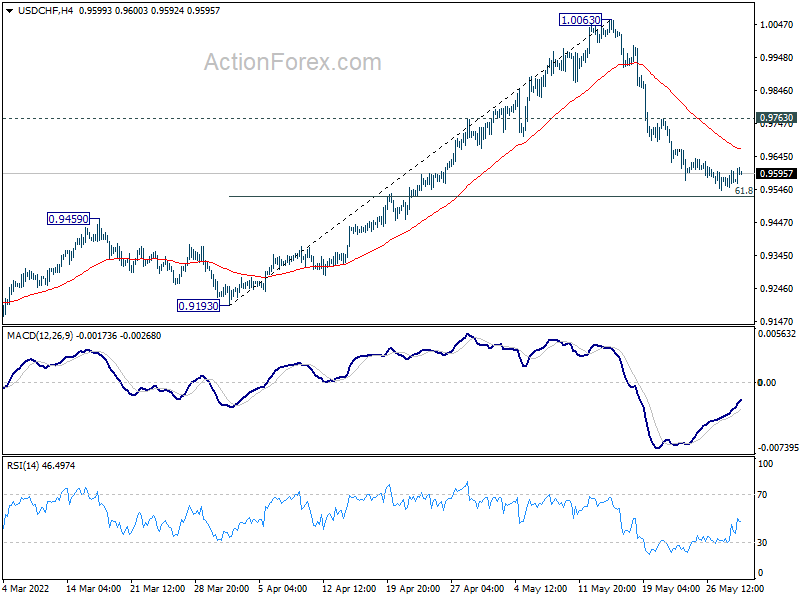
Daily Pivots: (S1) 0.9549; (P) 0.9577; (R1) 0.9601; More...
Strong support is still expected at 61.8% retracement of 0.9193 to 1.0063 at 0.9525 to complete the pull back from 1.0063. On the upside, above 0.9763 minor resistance will turn bias back to the upside for retesting 1.0063 high. However, sustained break of 0.9525 will bring deeper decline to 0.9193 support.
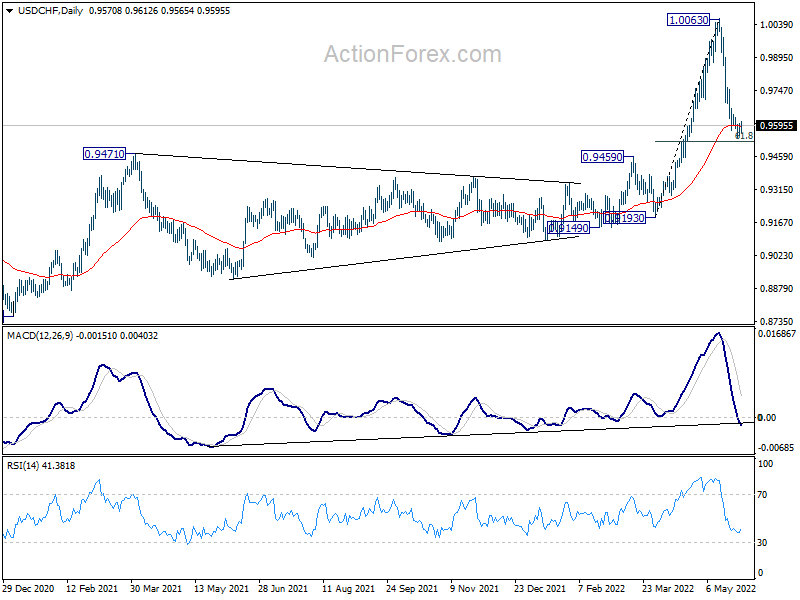
In the bigger picture, down trend from 1.0342 (2016 high) should have completed with three waves down to 0.8756 (2021 low) already. Rise from 0.8756 is likely a medium term up trend of its own. Next target is 1.0237/0342 resistance zone. This will remain the favored case as long as 0.9471 resistance turned support holds. However, sustained break of 0.9471 will extend long term range trading with another falling leg.
GBP/USD Daily Outlook
Daily Pivots: (S1) 1.2625; (P) 1.2643; (R1) 1.2670; More...
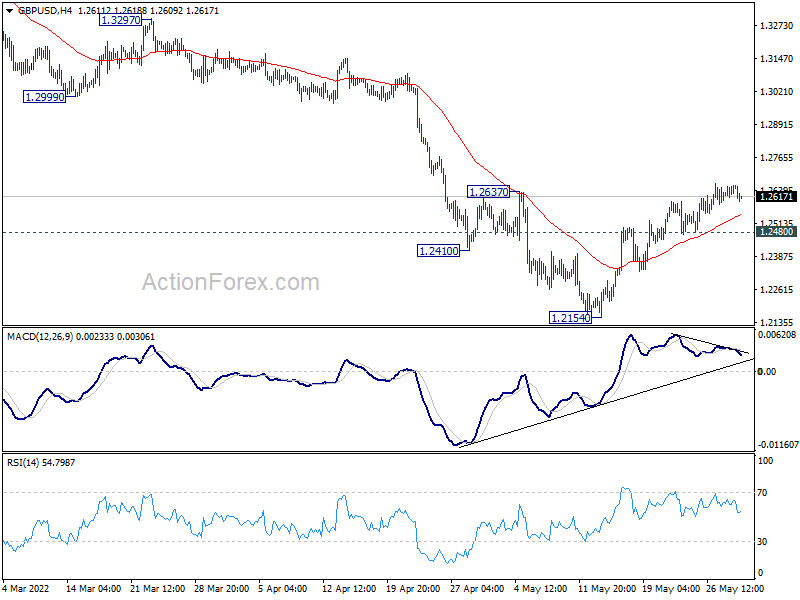
Further rise could be seen in GBP/USD with 1.2480 minor support intact. Sustained of 55 day EMA (now at 1.2752) will target 1.2999 support turned resistance. On the downside, though, break of 1.2480 minor support will turn bias back to the downside for retesting 1.2154 low instead.
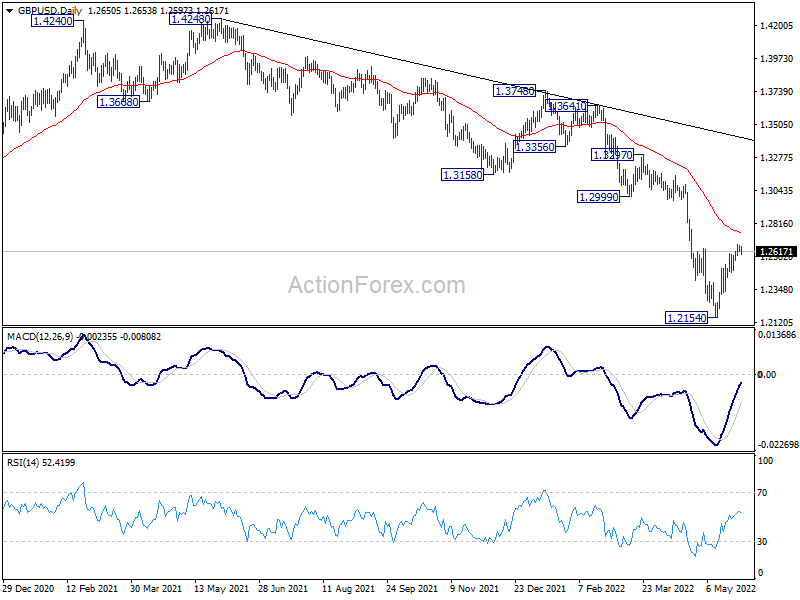
In the bigger picture, fall from 1.4248 (2018 high) could be a leg inside the pattern from 1.1409 (2020 low), or resuming the longer term down trend. Deeper decline is expected as long as 1.2999 support turned resistance holds. On resumption, next target is 1.1409 low.
USD/JPY Daily Outlook
Daily Pivots: (S1) 127.04; (P) 127.43; (R1) 128.00; More...
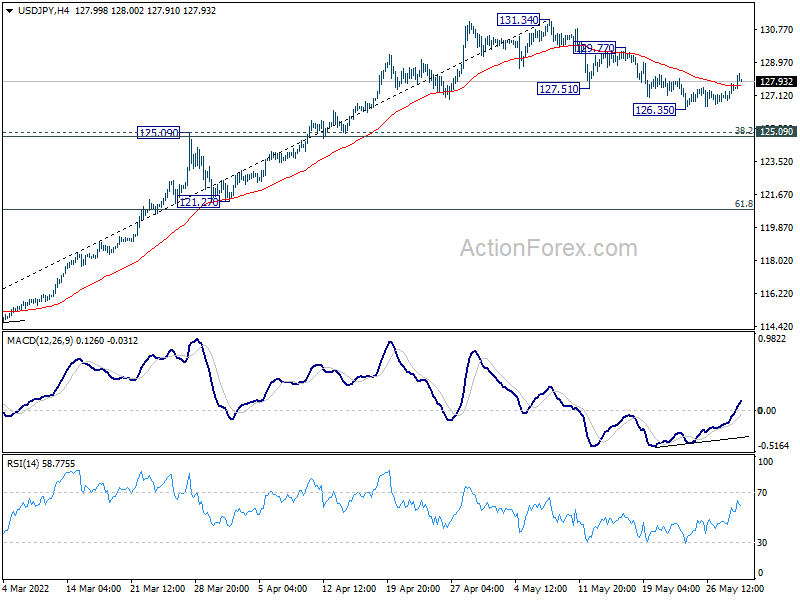
Intraday bias in USD/JPY remains neutral first. On the upside, break of 129.77 minor resistance will suggest that correction from 131.34 is finished. Intraday bias will back on the upside for retesting 131.34 high. On the downside, break of 126.35 will extend the correction. But downside should be contained by 125.09 cluster support (38.2% retracement of 114.40 to 131.34 at 124.86) to bring rebound.
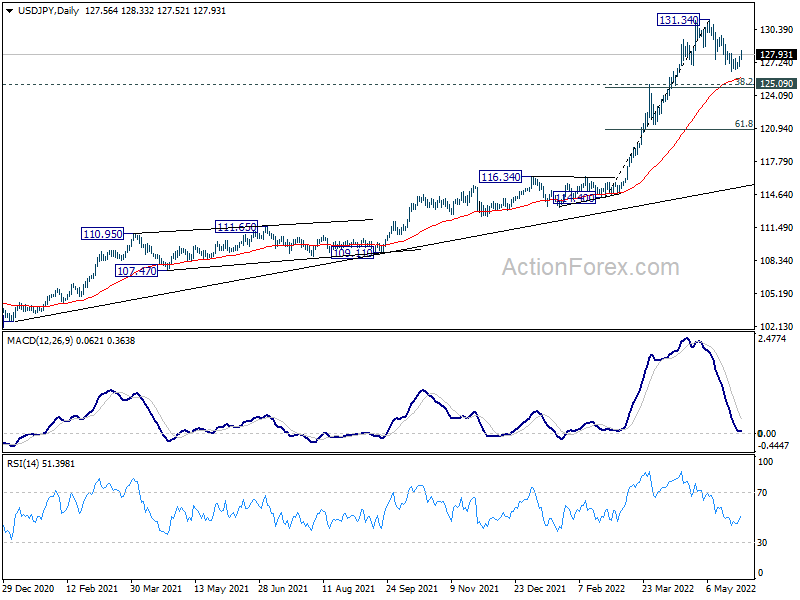
In the bigger picture, current rally is seen as part of the long term up trend form 75.56 (2011 low). Sustained trading above 61.8% projection of 75.56 (2011 low) to 125.85 (2015 high) from 98.97 at 130.04 will pave the way to 100% projection at 149.26, which is close to 147.68 (1998 high). For now, this will remain the favored case as long as 121.27 support holds.
AUD/USD Daily Report
Daily Pivots: (S1) 0.7168; (P) 0.7185; (R1) 0.7215; More...
AUD/USD's rise from 0.6828 is still in progress and intraday bias stays on the upside for 0.7265 resistance. Firm break there will raise the chance of larger trend reversal and target 0.7760 structural resistance next. On the downside, break of 0.7034 minor support will turn bias back to the downside for retesting 0.6828 low instead.
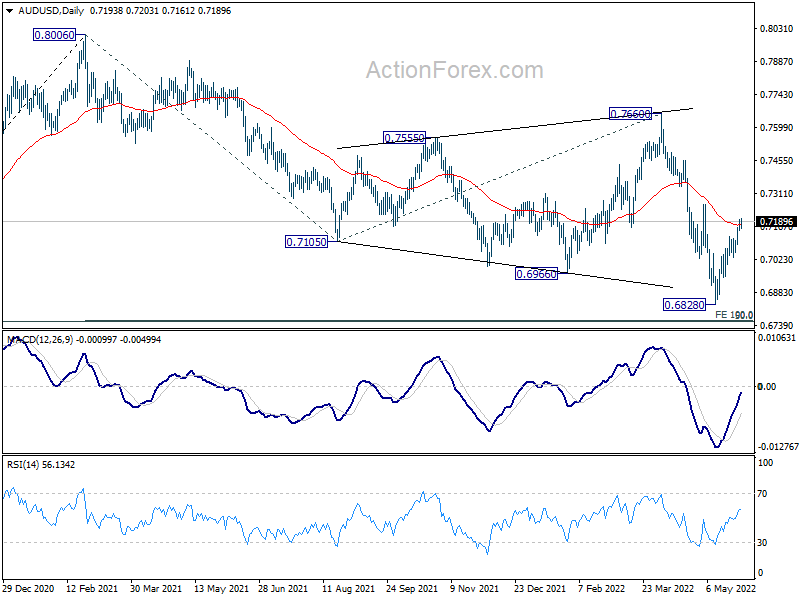
In the bigger picture, price actions from 0.8006 are seen as a corrective pattern to rise from 0.5506 (2020 low). Deeper fall could be seen to 50% retracement of 0.5506 to 0.8006 at 0.6756. This coincides with 100% projection of 0.8006 to 0.7105 from 0.7660 at 0.6760. Strong support is expected from 0.6756/60 cluster to contain downside to complete the correction. Meanwhile, firm break of 0.7660 resistance will confirm that such corrective pattern has completed, and larger up trend is ready to resume.
USD/CAD Daily Outlook
Daily Pivots: (S1) 1.2625; (P) 1.2680; (R1) 1.2710; More...
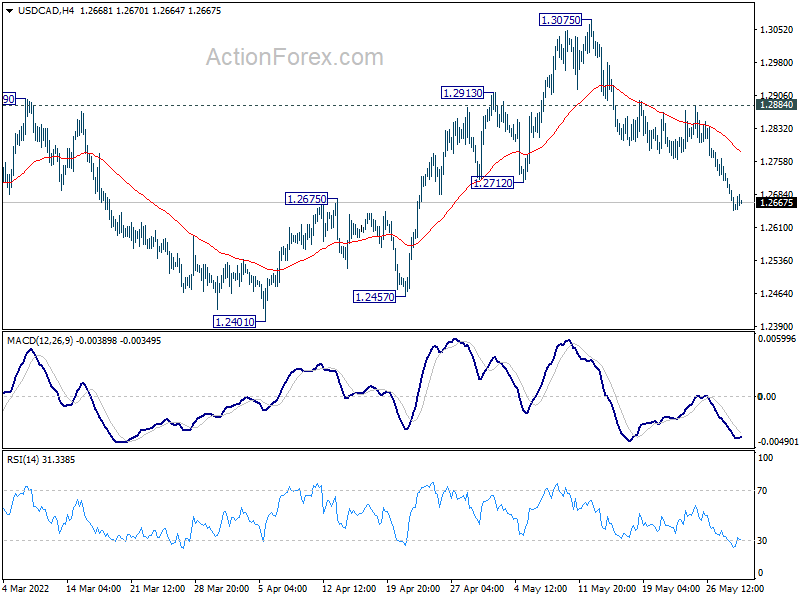
Intraday bias in USD/CAD remains on the downside for 1.2401 support. Firm break there will argue that whole rebound from 1.2005 has completed. Deeper fall would then be seen to retest this low. On the upside, though, above 1.2884 minor resistance will revive near term bullishness and turn bias back to the upside for 1.3075 high.
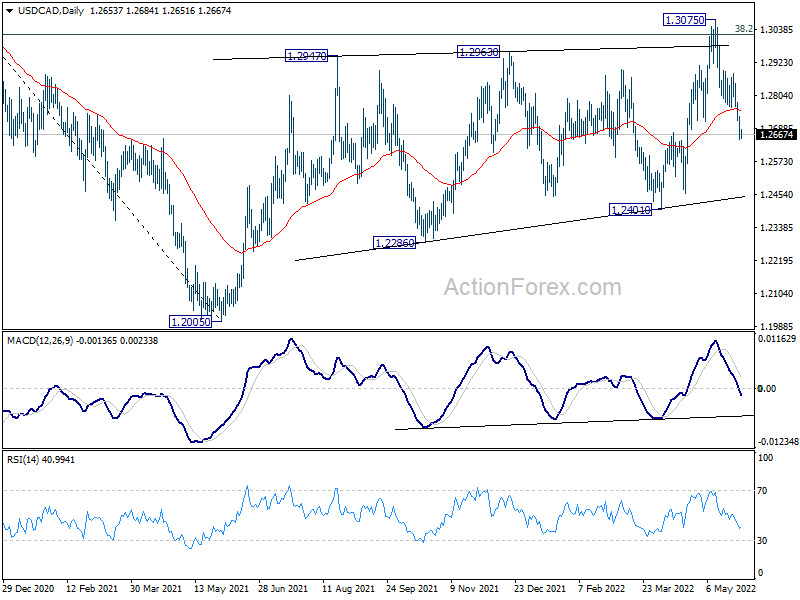
In the bigger picture, focus stays on 38.2% retracement of 1.4667 (2020 high) to 1.2005 (2021 low) at 1.3022. Sustained break there should confirm that the down trend from 1.4667 has completed after defending 1.2061 long term cluster support. Further rise would then be seen towards 61.8% retracement at 1.3650. However, rejection by 1.3022 will maintain medium term bearishness. Break of 1.2005 will resume the down trend from 1.4667 and that carries larger bearish implications too.
EUR/GBP Daily Outlook
Daily Pivots: (S1) 0.8499; (P) 0.8513; (R1) 0.8533; More...
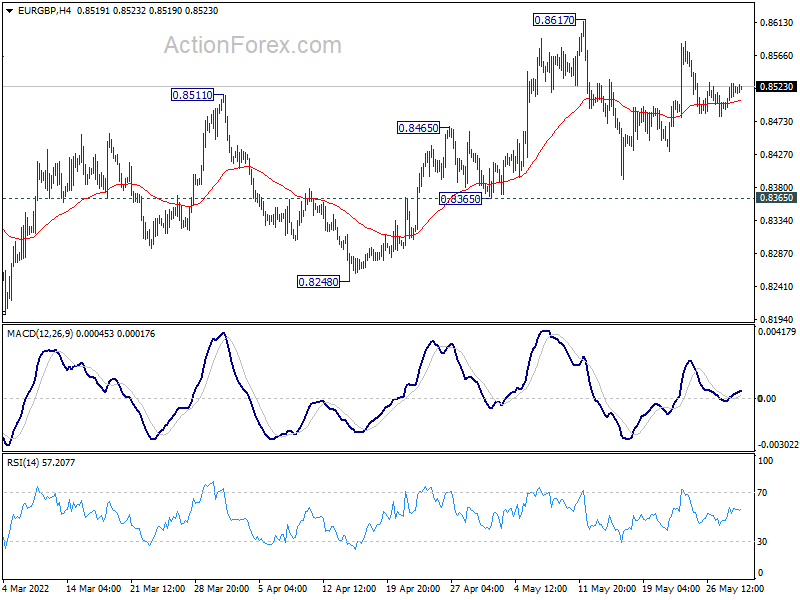
Range trading continues in EUR/GBP and intraday bias remains neutral. Further rally is in favor with 0.8365 support intact. On the upside, break of 0.8617 will resume rise from 0.8201 medium term bottom to 0.8697 medium term fibonacci level. However, break of 0.8365 will dampen this bullish view, and turn bias back to the downside instead.
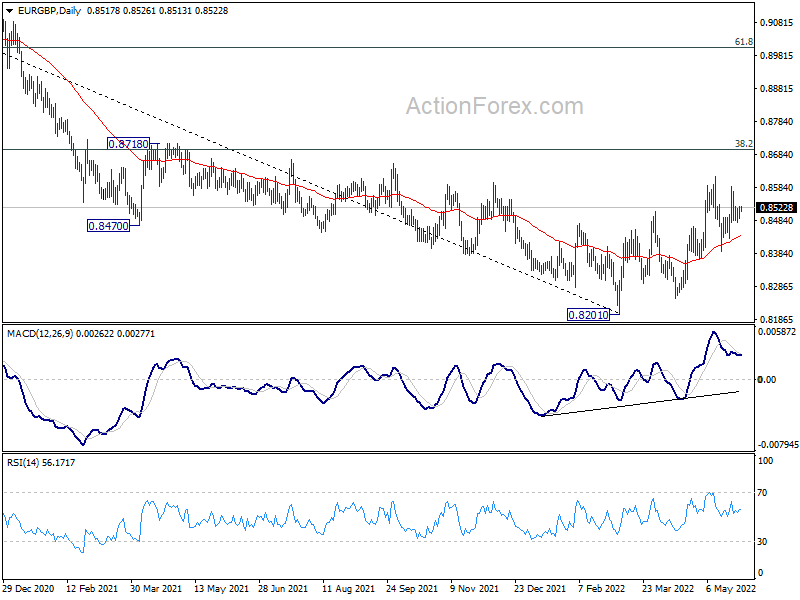
In the bigger picture, a medium term bottom could be in place at 0.8201, on bullish convergence condition in daily and weekly MACD. Rise from there could either be a correction to the down trend from 0.9499 (2020 high), or a medium term up trend itself. In either case, further rise should be seen to 38.2% retracement of 0.9499 to 0.8201 at 0.8697. Sustained break there will target 61.8% retracement at 0.9003.
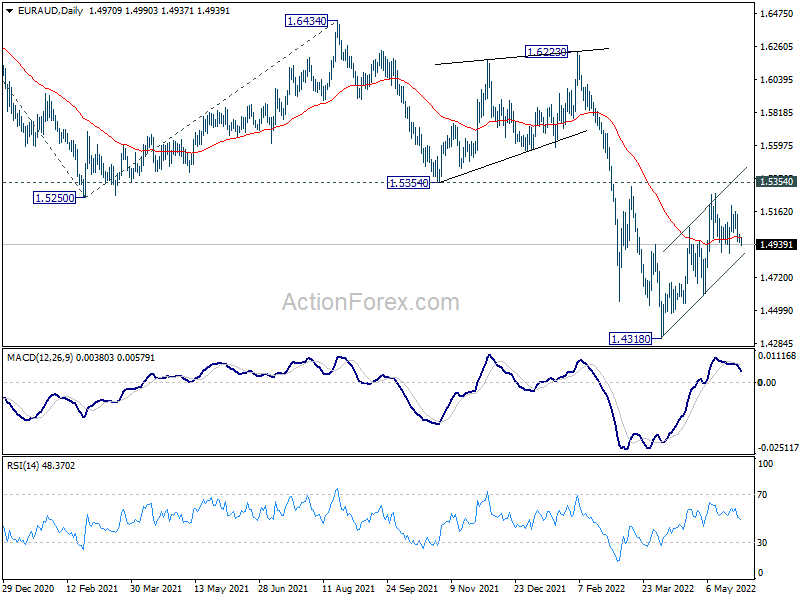
EUR/AUD Daily Outlook
Daily Pivots: (S1) 1.4955; (P) 1.4983; (R1) 1.5007; More...
Intraday bias in EUR/AUD stays neutral at this point. On the downside, break of 1.4882 support will reaffirm that case that corrective rebound from 1.4318 has completed at 1.5277, ahead of 1.5354 resistance. Deeper fall would be seen to 1.4597 support, and then 1.4318 low. Also, risk will stay on the downside as long as 1.5277 resistance holds.
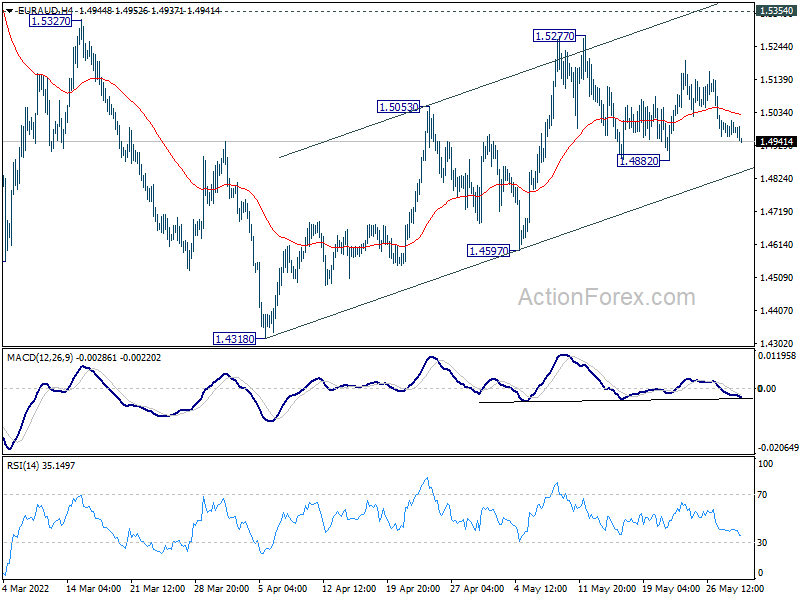
In the bigger picture, as long as 1.5354 support turned resistance holds, larger down trend from 1.9799 (2020 high) is still expected to continue. On resumption, next target is 61.8% projection of 1.9799 to 1.5250 from 1.6434 at 1.3623, which is close to 1.3624 long term support (2017 low). However, firm break of 1.5354 will indicate medium term bottoming and bring stronger rally back to 1.6434 key resistance.