Sample Category Title
Markets Tread Water ahead of US CPI, Gold and Yields Dip
The forex markets are stuck in very tight range in Asia session today, as traders are awaiting another set of consumer inflation data from the US. For now, Dollar, Euro and Yen are the stronger ones for the week, and they're range bound against each other. Commodity currencies remain the worst performers, as led by Aussie. Sterling and Swiss Franc are mixed, with the Pound having an upper hand.
Technically, main focuses remain on range breakout in EUR/USD and USD/JPY. As for EUR/USD, the levels are 1.0470 support and 1.0641 resistance. For USD/JPY, the levels are 128.61 support and 131.34 resistance. Gold extended recent decline through 1850.18 support overnight. That gives Dollar upside breakout a slight advantage. But that's countered by 10-year yield's fall below 3% level.
In Asia, at the time of writing, Nikkei is up 0.14%. Hong Kong HSI is up 1.72%. China Shanghai SSE is up 1.63%. Singapore Strait Times is down -0.58%. Japan 10-year JGB yield is up 0.0035 at 0.251. Overnight, DOW dropped -0.26%. S&P 500 rose 0.25%. NASDAQ rose 0.98%. 10-year yield dropped -0.086 to 2.993, back below 3% handle.
Fed Waller: Front-load it, get it done
Fed Governor Christopher Waller said yesterday, "It's time to raise rates now when the economy can take it. Front-load it, get it done, and then we can judge how the economy is proceeding later, and if we have to do more, we're going to do more."
"The labor market is strong. The economy is doing so well," he said. "This is the time to hit it if you think there's going to be any kind of negative reaction, because the economy can take it."
Fed Mester: Do more upfront rather than waiting
Cleveland Fed President Loretta Mester told Reuters, "I would need to see monthly numbers coming down in a compelling way before I would want to conclude we could now rest" on raising interest rates.
"The risks to inflation are skewed to the upside and the cost of allowing that inflation to continue is high," she said, an argument for the Fed "doing more upfront rather than waiting."
"I don't think it (inflation) will get back to 2% next year. But it will be well on its way, in the range of two and half percent but moving in the right direction," she said. "And given where the economy is and all the factors affecting inflation that are outside of our realm, that is acceptable to me."
Australia Westpac consumer sentiment dropped to 90.4 in May, lowest since Aug 2020
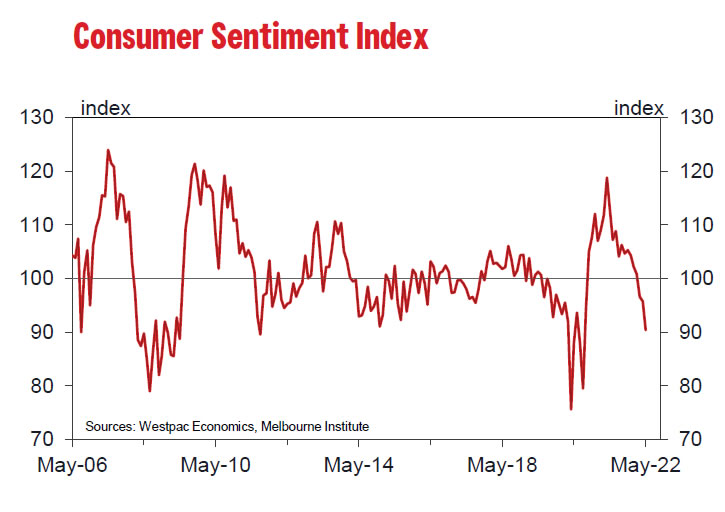
Australia Westpac-MI consumer sentiment index dropped from 95.8 to 90.4 in May. That's the lowest level since August 2020. The reading was also -8.4% below the average seen in 2019. The -5.6% decline was the largest since the -6.9% fall in June 2016.
Looking at some details, family finances for the next 12 months dropped from 105.1 to 93.3. Economic conditions for the next 12 months dropped from 95.9 to 90.4. Unemployment expectations rose from 99.2 to 109.6.
Westpac said two "stunning developments are clearly unnerving consumers". Firstly, headline inflation surged above 5% for the first time since 2007. Secondly, RBA raised interest rate for the first time since 2010.
Regarding RBA policies, Westpac said "having now begun its tightening cycle the Board is almost certain to follow up the move in May with a further move in June". It added, "the need to avoid an over-shoot later in the cycle is why, despite this disturbing tumble in Consumer Sentiment, we believe the prudent approach in June would be to lift rates by 40bps rather than the 25 bps that is currently favoured by most analysts.
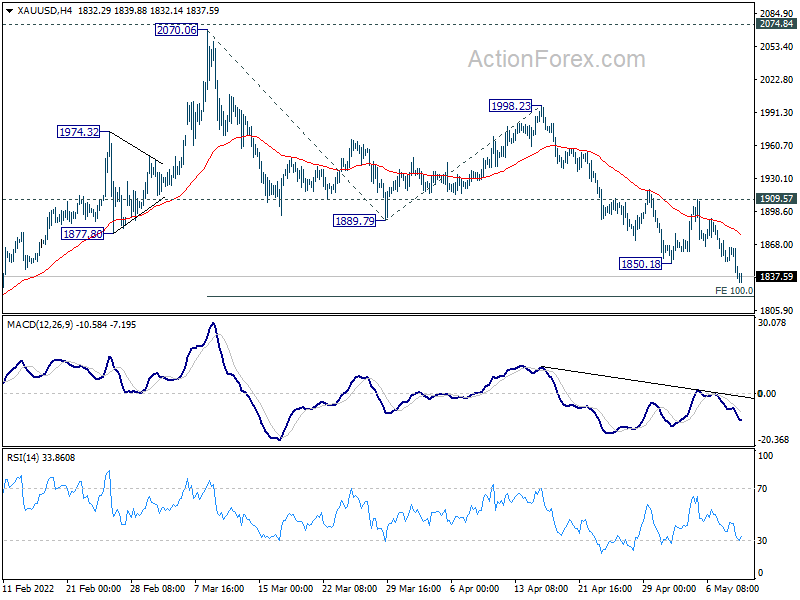
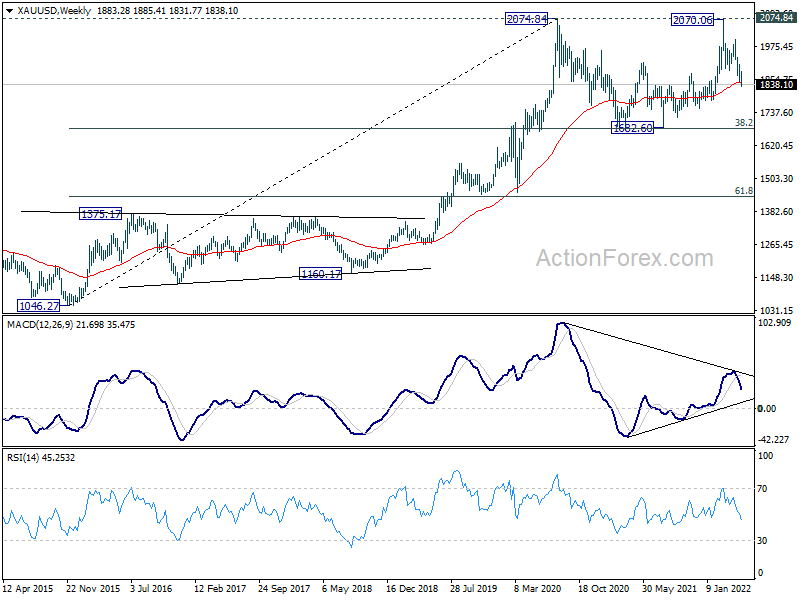
Gold extending decline towards 1817
Gold's near term decline resumed overnight and broke through 1850.18 support. Near term outlook now stays bearish as long as 1909.57 resistance holds. Next target is 100% projection of 2070.06 to 1889.79 from 1998.23 at 1817.86. The whole fall from 2070.06 is seen as the third leg of the consolidation pattern from 2074.84 (2020 high). Firm break of 1817.86 could prompt more downside acceleration towards 1682.60 to finally finish the pattern.
Looking ahead
Germany CPI final will be released in European session. But main focus will be on US April CPI.
USD/CAD Daily Outlook
Daily Pivots: (S1) 1.2976; (P) 1.3014; (R1) 1.3067; More...
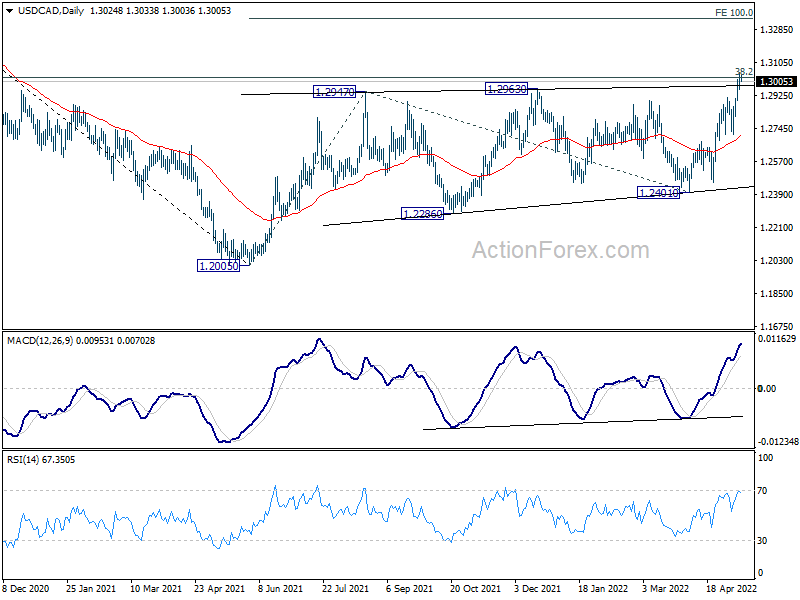
Intraday bias in USD/CAD stays on the upside for now, despite some loss in upside momentum. Current Sustained break of 1.3022 fibonacci level will carry larger bullish implications. Next target will be 100% projection of 1.2005 to 1.2947 from 1.2401 at 1.3343. On the downside, below 1.2907 minor support will turn intraday bias neutral first. But further rally will remain in favor as long as 1.2712 support holds.
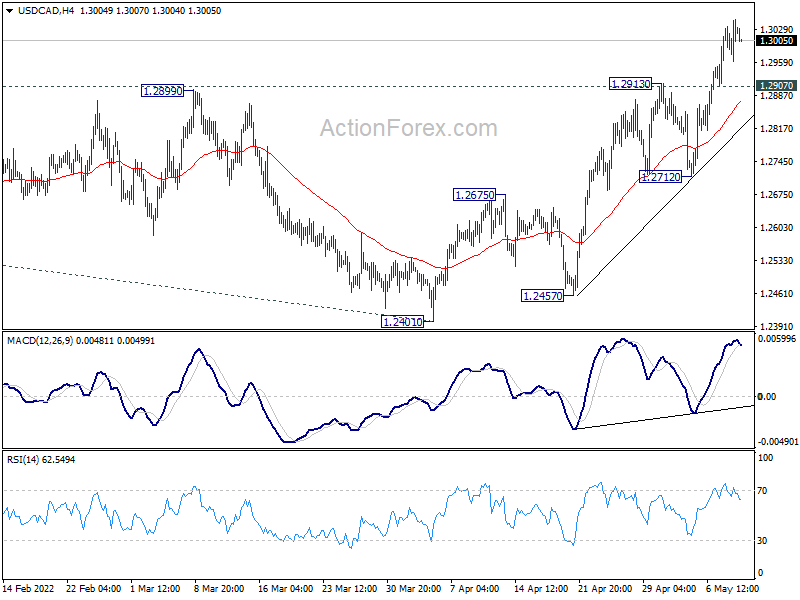
In the bigger picture, focus stays on 38.2% retracement of 1.4667 (2020 high) to 1.2005 (2021 low) at 1.3022. Sustained break there should confirm that the down trend from 1.4667 has completed after defending 1.2061 long term cluster support. Further rise would then be seen towards 61.8% retracement at 1.3650. However, rejection by 1.3022 will maintain medium term bearishness. Break of 1.2005 will resume the down trend from 1.4667 and that carries larger bearish implications too.
Economic Indicators Update
| GMT | Ccy | Events | Actual | Forecast | Previous | Revised |
|---|---|---|---|---|---|---|
| 00:30 | AUD | Westpac Consumer Confidence May | -5.60% | -0.90% | ||
| 01:30 | CNY | CPI Y/Y Apr | 2.10% | 1.90% | 1.50% | |
| 01:30 | CNY | PPI Y/Y Apr | 8.00% | 7.80% | 8.30% | |
| 05:00 | JPY | Leading Economic Index Mar P | 101.0 | 100.4 | 100 | |
| 06:00 | EUR | Germany CPI M/M Apr F | 0.80% | 0.80% | ||
| 06:00 | EUR | Germany CPI Y/Y Apr F | 7.40% | 7.40% | ||
| 12:30 | USD | CPI M/M Apr | 0.20% | 1.20% | ||
| 12:30 | USD | CPI Y/Y Apr | 8.10% | 8.50% | ||
| 12:30 | USD | CPI Core M/M Apr | 0.40% | 0.30% | ||
| 12:30 | USD | CPI Core Y/Y Apr | 6.00% | 6.50% | ||
| 14:30 | USD | Crude Oil Inventories | -1.0M | 1.3M |
Gold extending decline towards 1817
Gold's near term decline resumed overnight and broke through 1850.18 support. Near term outlook now stays bearish as long as 1909.57 resistance holds. Next target is 100% projection of 2070.06 to 1889.79 from 1998.23 at 1817.86. The whole fall from 2070.06 is seen as the third leg of the consolidation pattern from 2074.84 (2020 high). Firm break of 1817.86 could prompt more downside acceleration towards 1682.60 to finally finish the pattern.
Australia Westpac consumer sentiment dropped to 90.4 in May, lowest since Aug 2020
Australia Westpac-MI consumer sentiment index dropped from 95.8 to 90.4 in May. That's the lowest level since August 2020. The reading was also -8.4% below the average seen in 2019. The -5.6% decline was the largest since the -6.9% fall in June 2016.
Looking at some details, family finances for the next 12 months dropped from 105.1 to 93.3. Economic conditions for the next 12 months dropped from 95.9 to 90.4. Unemployment expectations rose from 99.2 to 109.6.
Westpac said two "stunning developments are clearly unnerving consumers". Firstly, headline inflation surged above 5% for the first time since 2007. Secondly, RBA raised interest rate for the first time since 2010.
Regarding RBA policies, Westpac said "having now begun its tightening cycle the Board is almost certain to follow up the move in May with a further move in June". It added, "the need to avoid an over-shoot later in the cycle is why, despite this disturbing tumble in Consumer Sentiment, we believe the prudent approach in June would be to lift rates by 40bps rather than the 25 bps that is currently favoured by most analysts.
Fed Mester: Do more upfront rather than waiting
Cleveland Fed President Loretta Mester told Reuters, "I would need to see monthly numbers coming down in a compelling way before I would want to conclude we could now rest" on raising interest rates.
"The risks to inflation are skewed to the upside and the cost of allowing that inflation to continue is high," she said, an argument for the Fed "doing more upfront rather than waiting."
"I don't think it (inflation) will get back to 2% next year. But it will be well on its way, in the range of two and half percent but moving in the right direction," she said. "And given where the economy is and all the factors affecting inflation that are outside of our realm, that is acceptable to me."
Fed Waller: Front-load it, get it done
Fed Governor Christopher Waller said yesterday, "It's time to raise rates now when the economy can take it. Front-load it, get it done, and then we can judge how the economy is proceeding later, and if we have to do more, we're going to do more."
"The labor market is strong. The economy is doing so well," he said. "This is the time to hit it if you think there's going to be any kind of negative reaction, because the economy can take it."
Technical Outlook and Review
DXY:
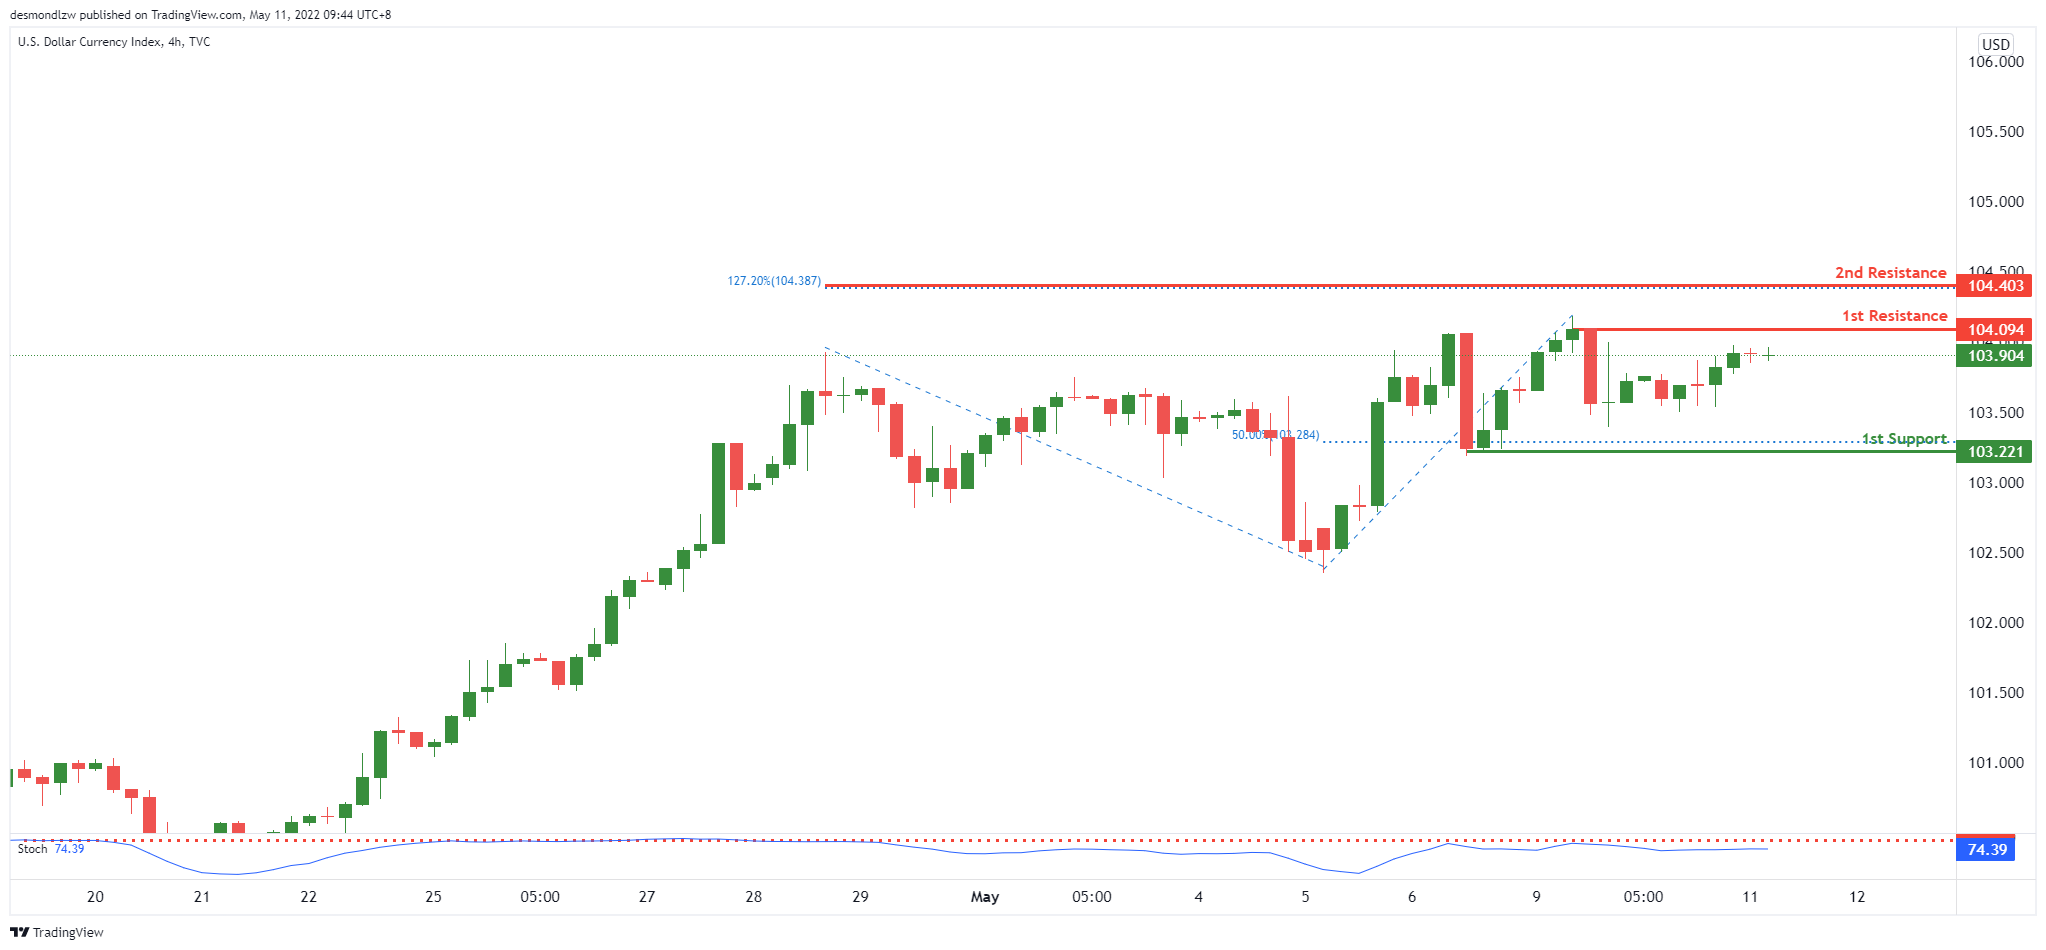
On the H4, with price expected to reverse off the stochastics indicator, we have a bearish bias that price will drop from our 1st resistance in line with the swing high resistance to our 1st support where the 50% Fibonacci retracement is. Alternatively, price may break 1st resistance structure and head for 2nd resistance where the 127.2% Fibonacci extension is.
Areas of consideration:
- H4 time frame, 1st resistance at 104.094
- H4 time frame, 1st support at 103.221
XAU/USD (GOLD):
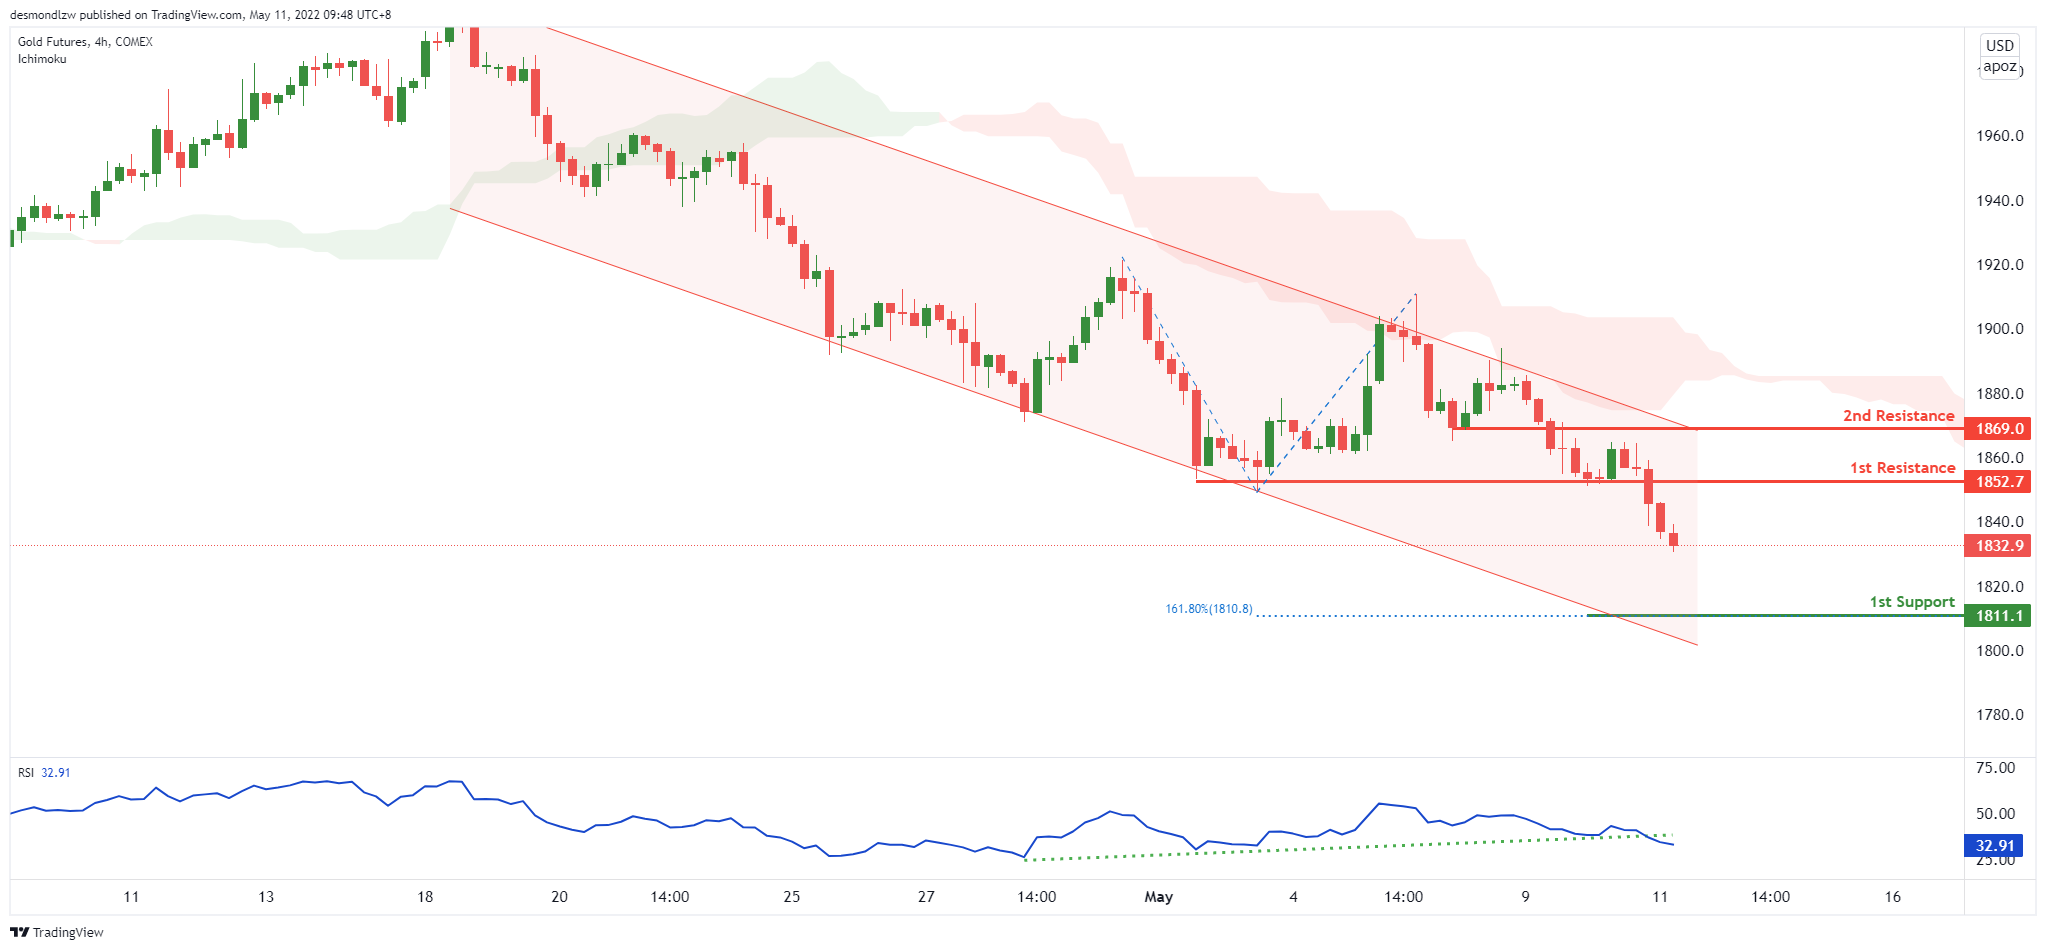
On the H4, with price moving below the ichimoku, we have a bearish bias that price will drop from our 1st resistance at 1852 where the horizontal pullback resistance is to our 1st support at 1811 in line with the 161.8% Fibonacci extension. Alternatively, price may break 1st resistance structure and head for 2nd resistance where the horizontal pullback resistance is.
Areas of consideration:
- H4 time frame, 1st Resistance at 1852
- H4 time frame, 1st Support at 1811
GBP/USD:
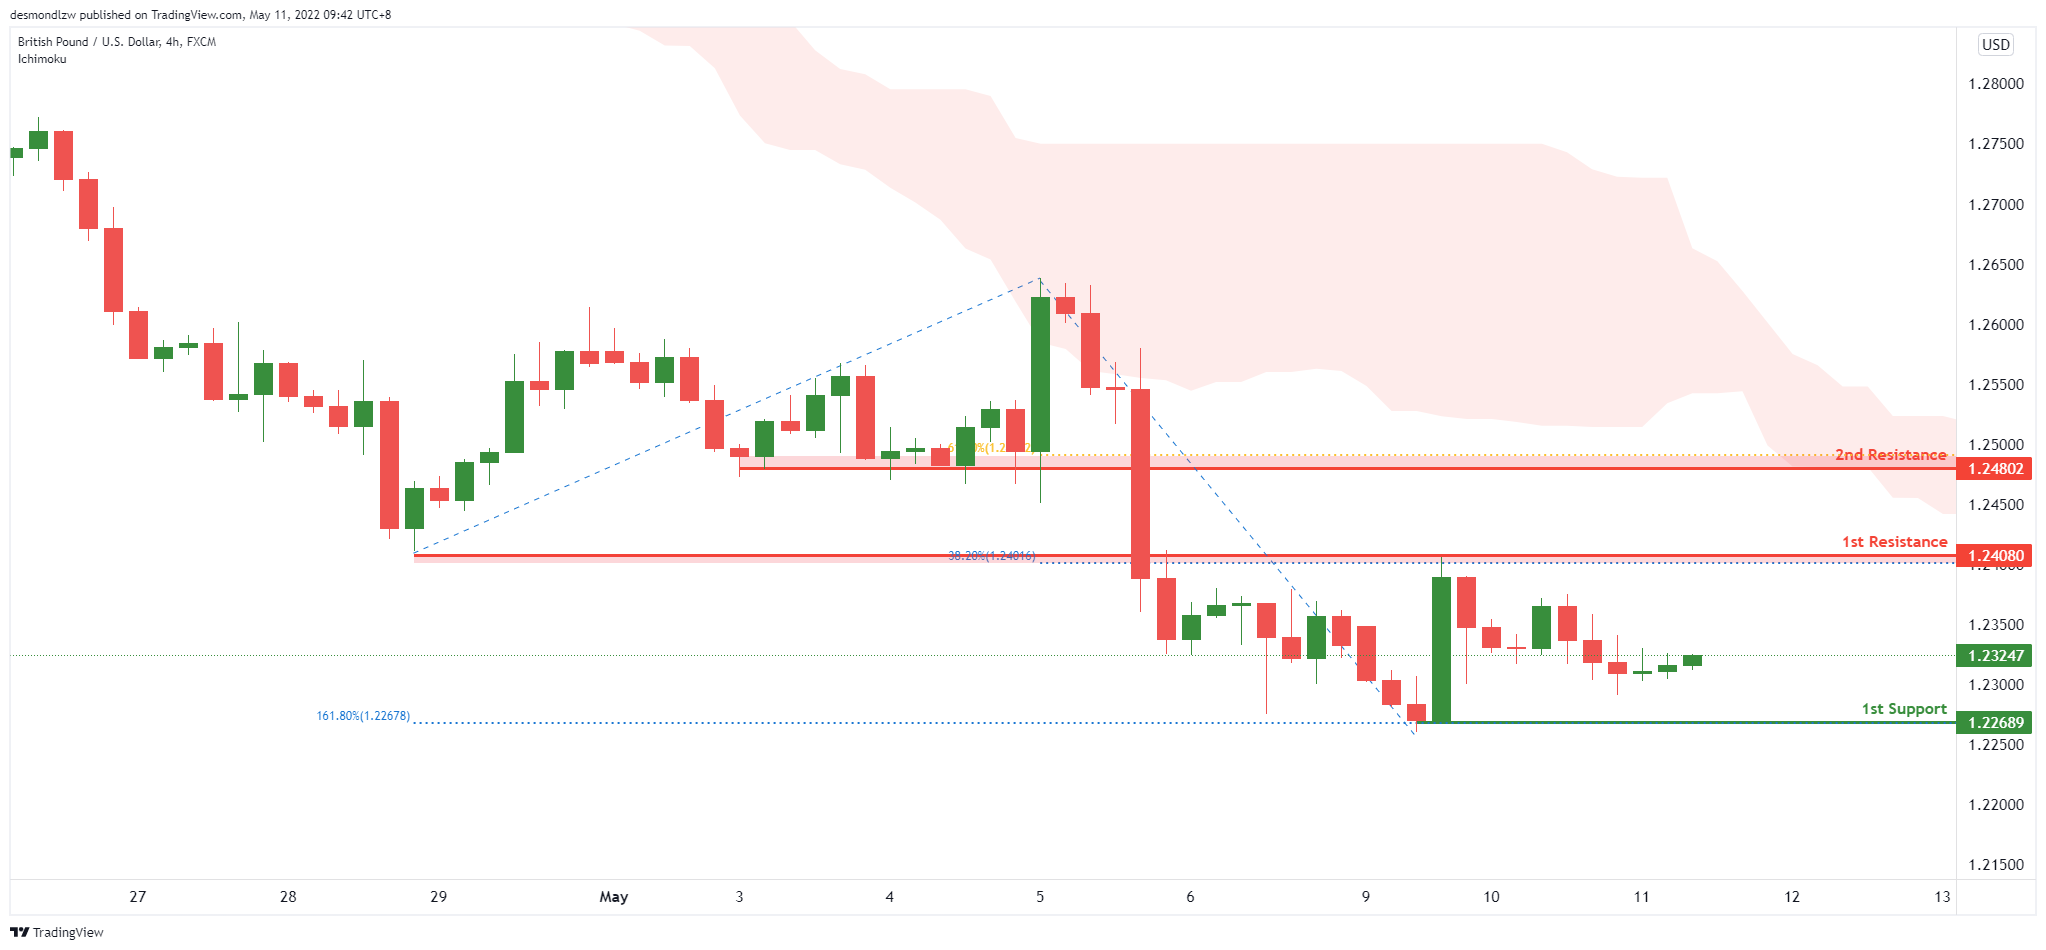
On the H4, with price moving below the ichimoku, we have a bearish bias that price will drop from our 1st resistance at 1.24080 where the 38.2% Fibonacci retracement and pullback resistance is to our 1st support at 1.22689 in line with the 161.8% Fibonacci extension. Alternatively, price may break 1st resistance structure and head for 2nd resistance where the horizontal pullback resistance is.
Areas of consideration:
- H4 1st resistance at 1.24080
- H4 1st support at 1.22689
USD/CHF:
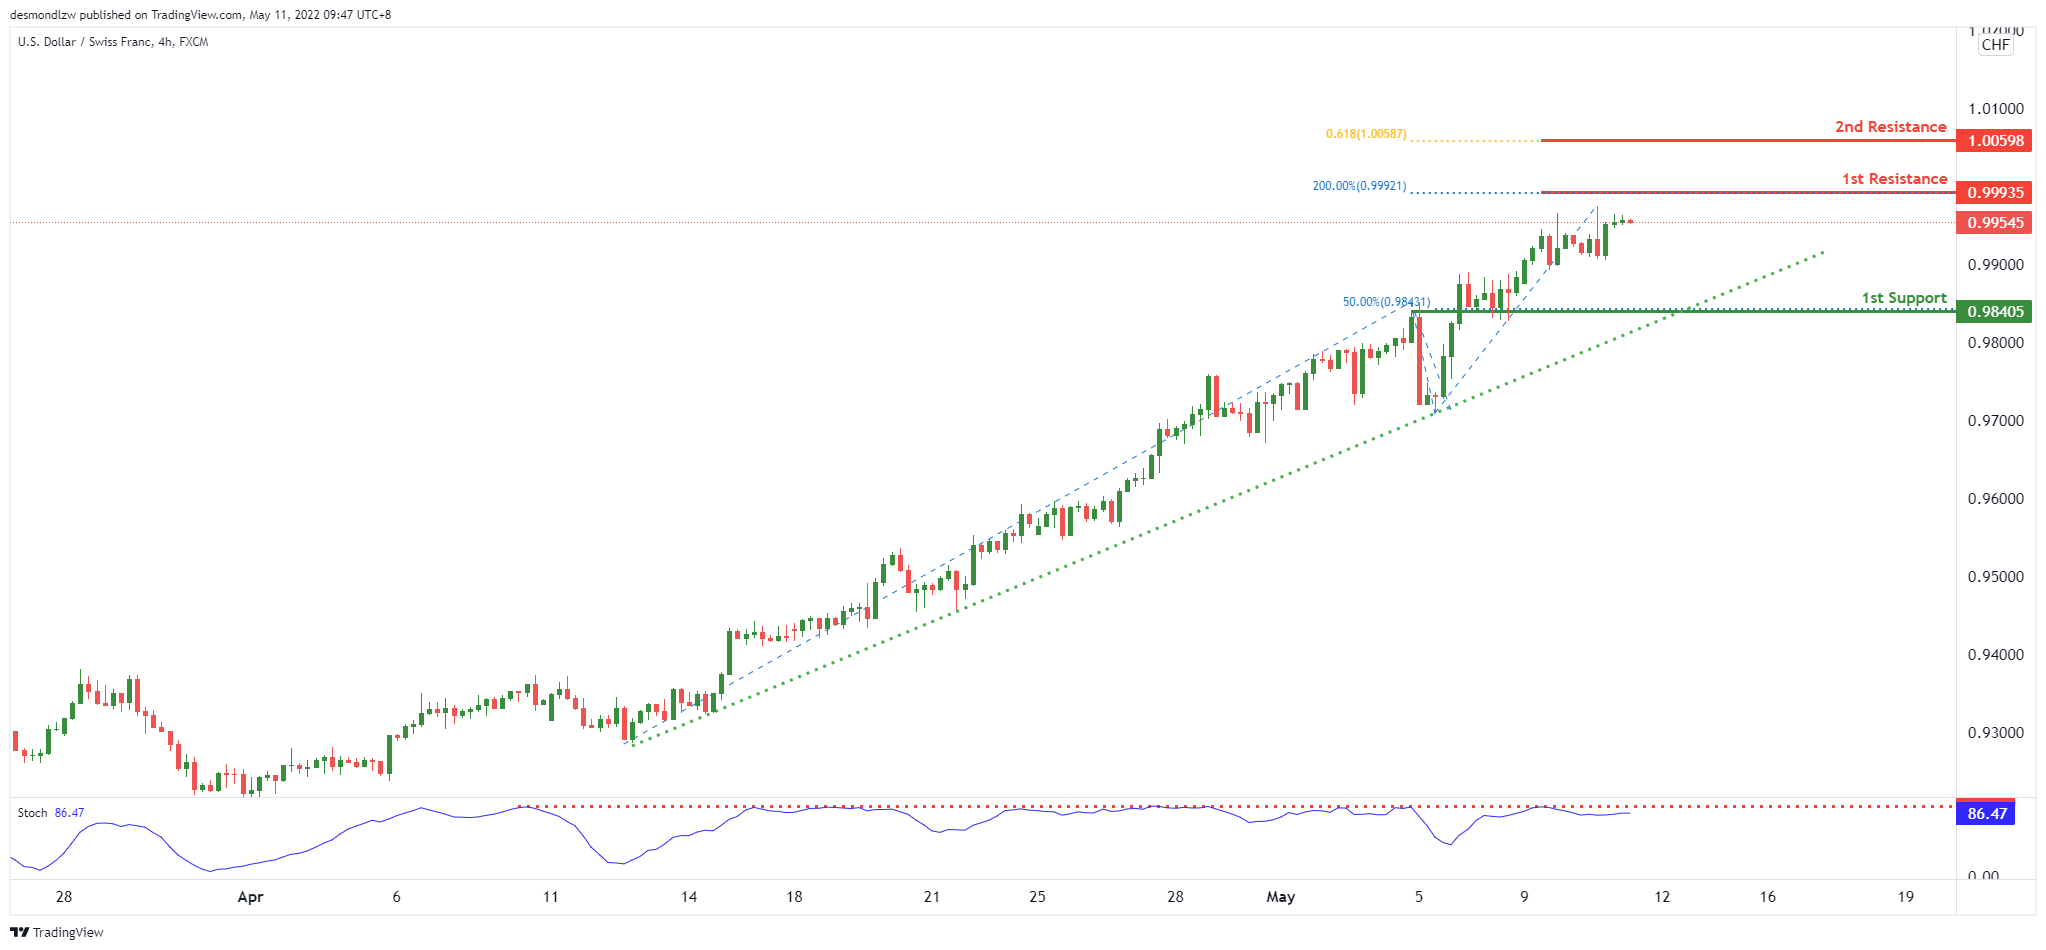
On the H4, with price expected to reverse off the stochastics indicator, we have a bearish bias that price will drop from our 1st resistance in line with the 200% Fibonacci projection to our 1st support where the 50% Fibonacci retracement is. Alternatively, price may break 1st resistance structure and head for 2nd resistance where the 61.8% Fibonacci projection is.
Areas of consideration
- 1st support level at 0.98405
- 1st resistance level at 0.99935
EUR/USD :
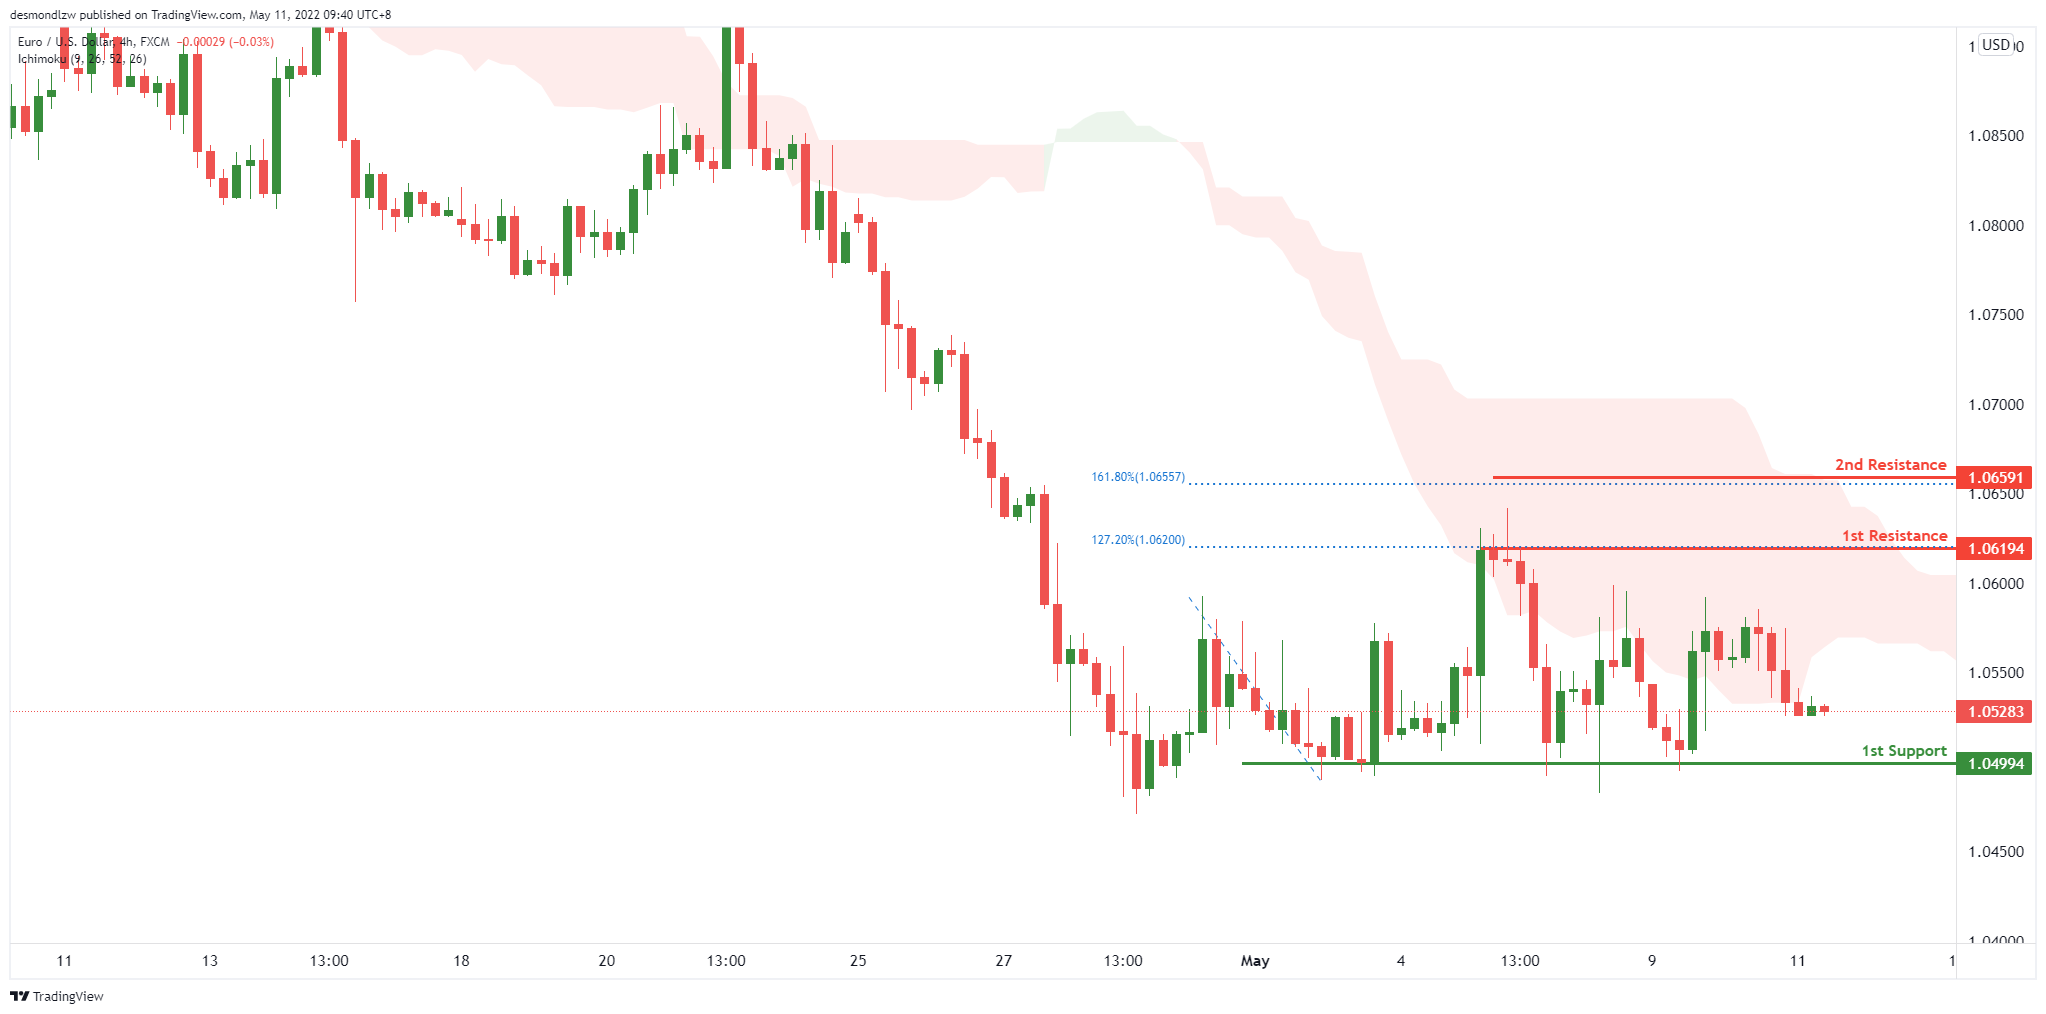
On the H4, with price moving below the ichimoku, we have a bearish bias that price will drop from our 1st resistance at 1.06194 to our 1st support at 1.04994 in line with the horizontal swing low support. Alternatively, price may break 1st resistance structure and head for 2nd resistance where the 161.8% Fibonacci extension is.
Areas of consideration :
- H4 1st resistance at 1.06194
- H4 1st support at 1.04994
USD/JPY:
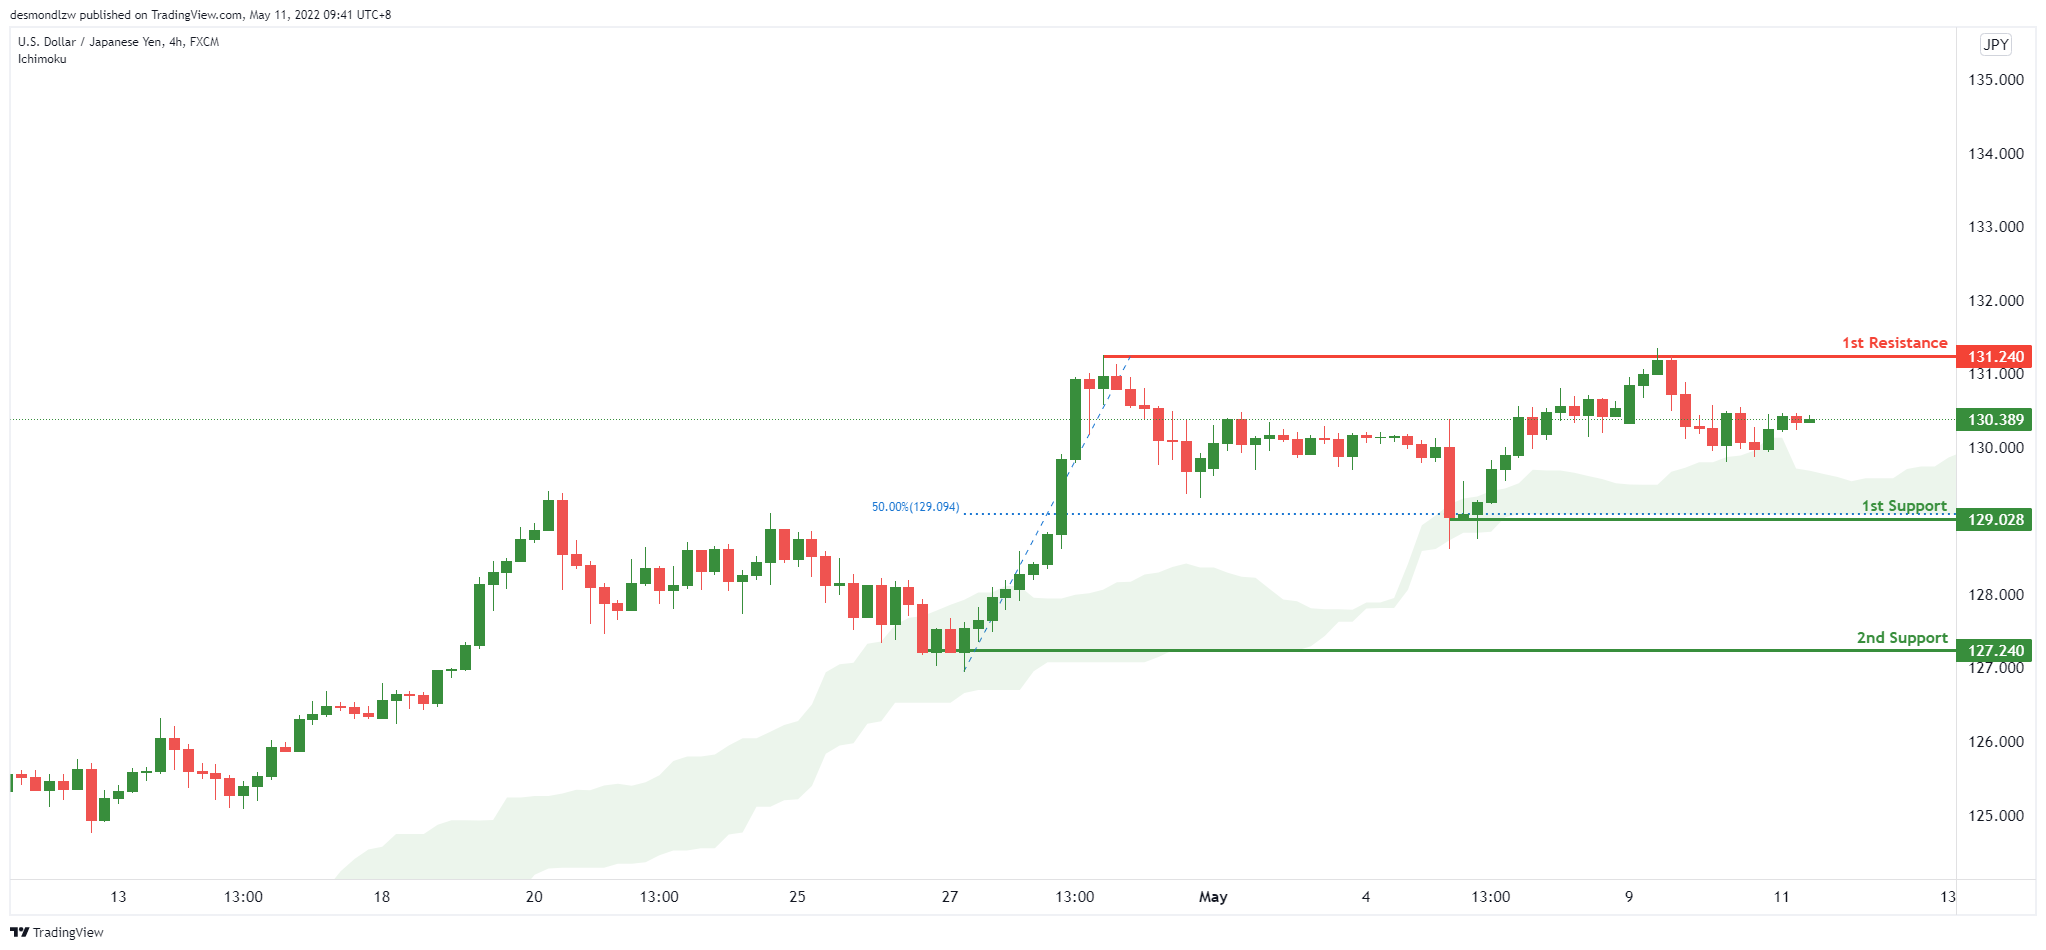
On the H4, with price moving above the ichimoku cloud, we have a bullish bias that price will rise to our 1st resistance at 131.240 where the swing high resistance is from our 1st support at 129.028 in line with the horizontal swing low support. Alternatively, price may break 1st support structure and head for 2nd support where the horizontal swing low support is.
Areas of consideration:
- H4 time frame, 1st resistance at 131.240
- H4 time frame, 1st support at 129.028
AUD/USD:
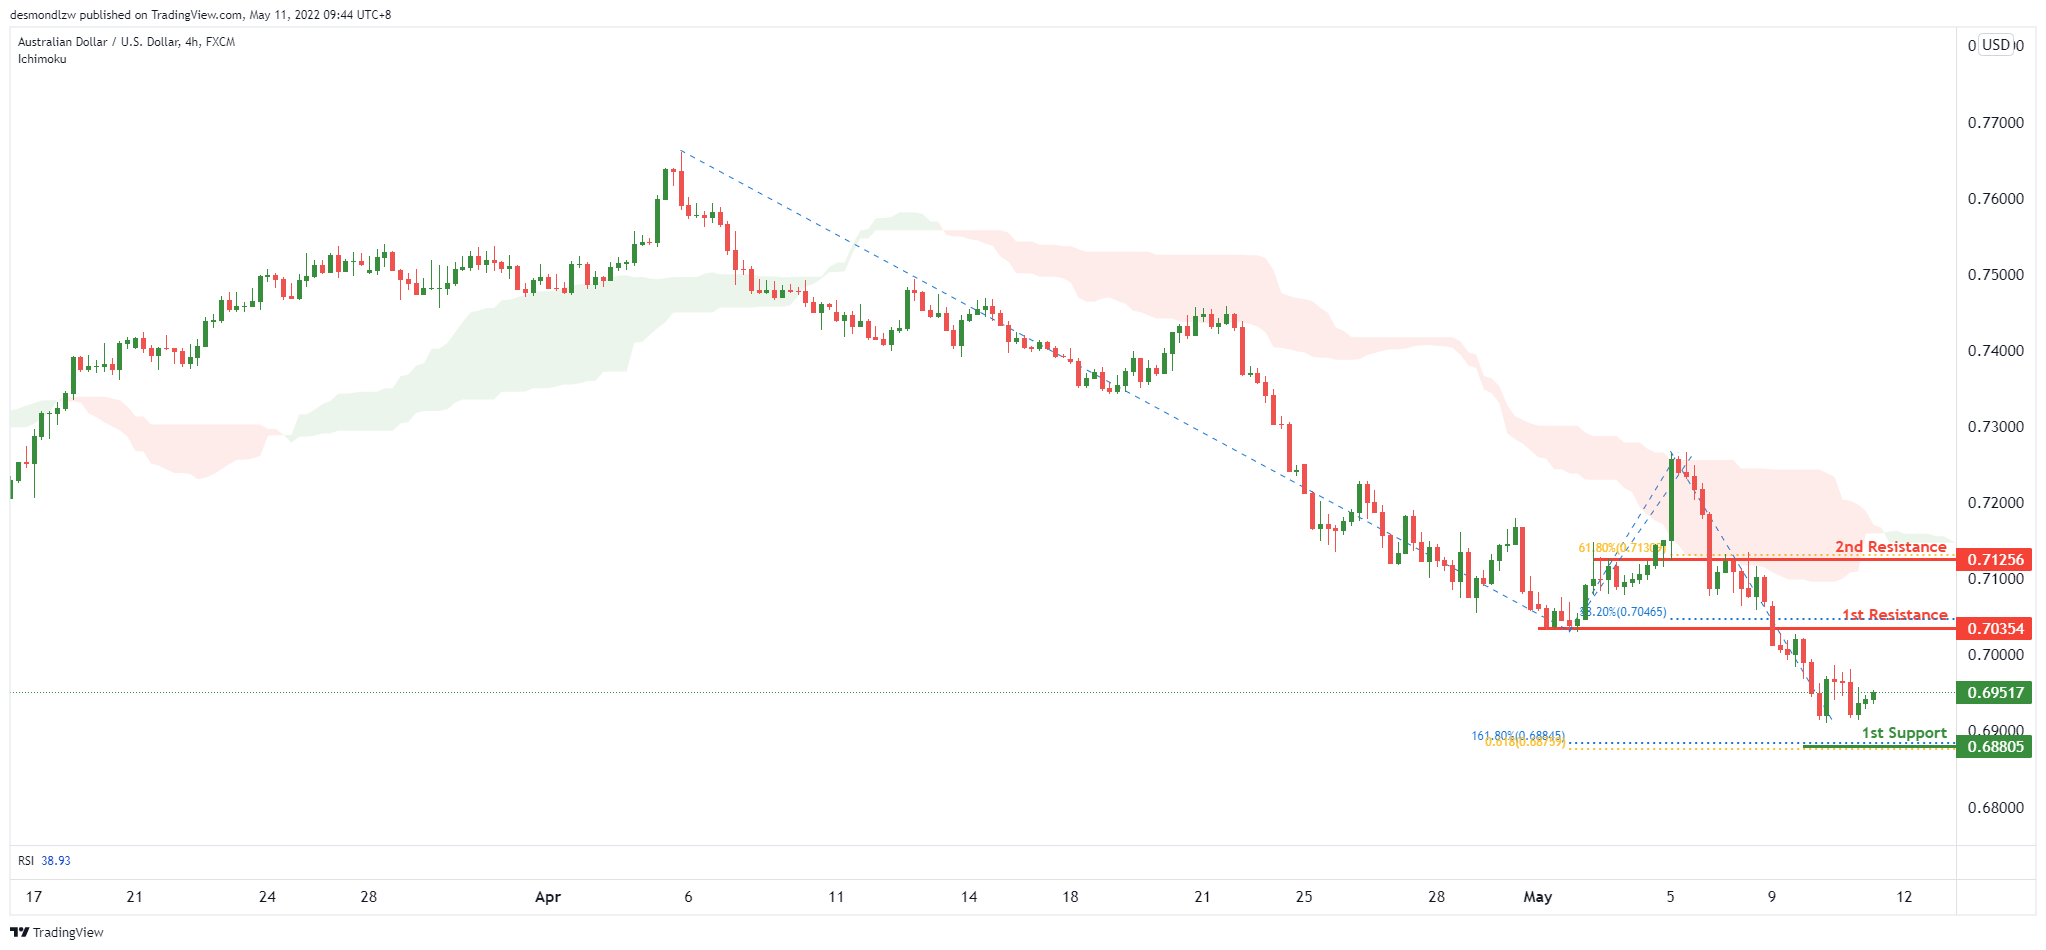
On the H4, with price moving below the ichimoku, we have a bearish bias that price will drop from our 1st resistance at 0.70354 where the pullback resistance is to our 1st support at 0.68825 in line with the 61.8% Fibonacci projection and 161.8% Fibonacci extension. Alternatively, price may break 1st resistance structure and head for 2nd resistance where the horizontal pullback resistance is.
Areas of consideration
- H4 1st resistance at 0.70354
- H4 1st support at 0.68825
NZD/USD:
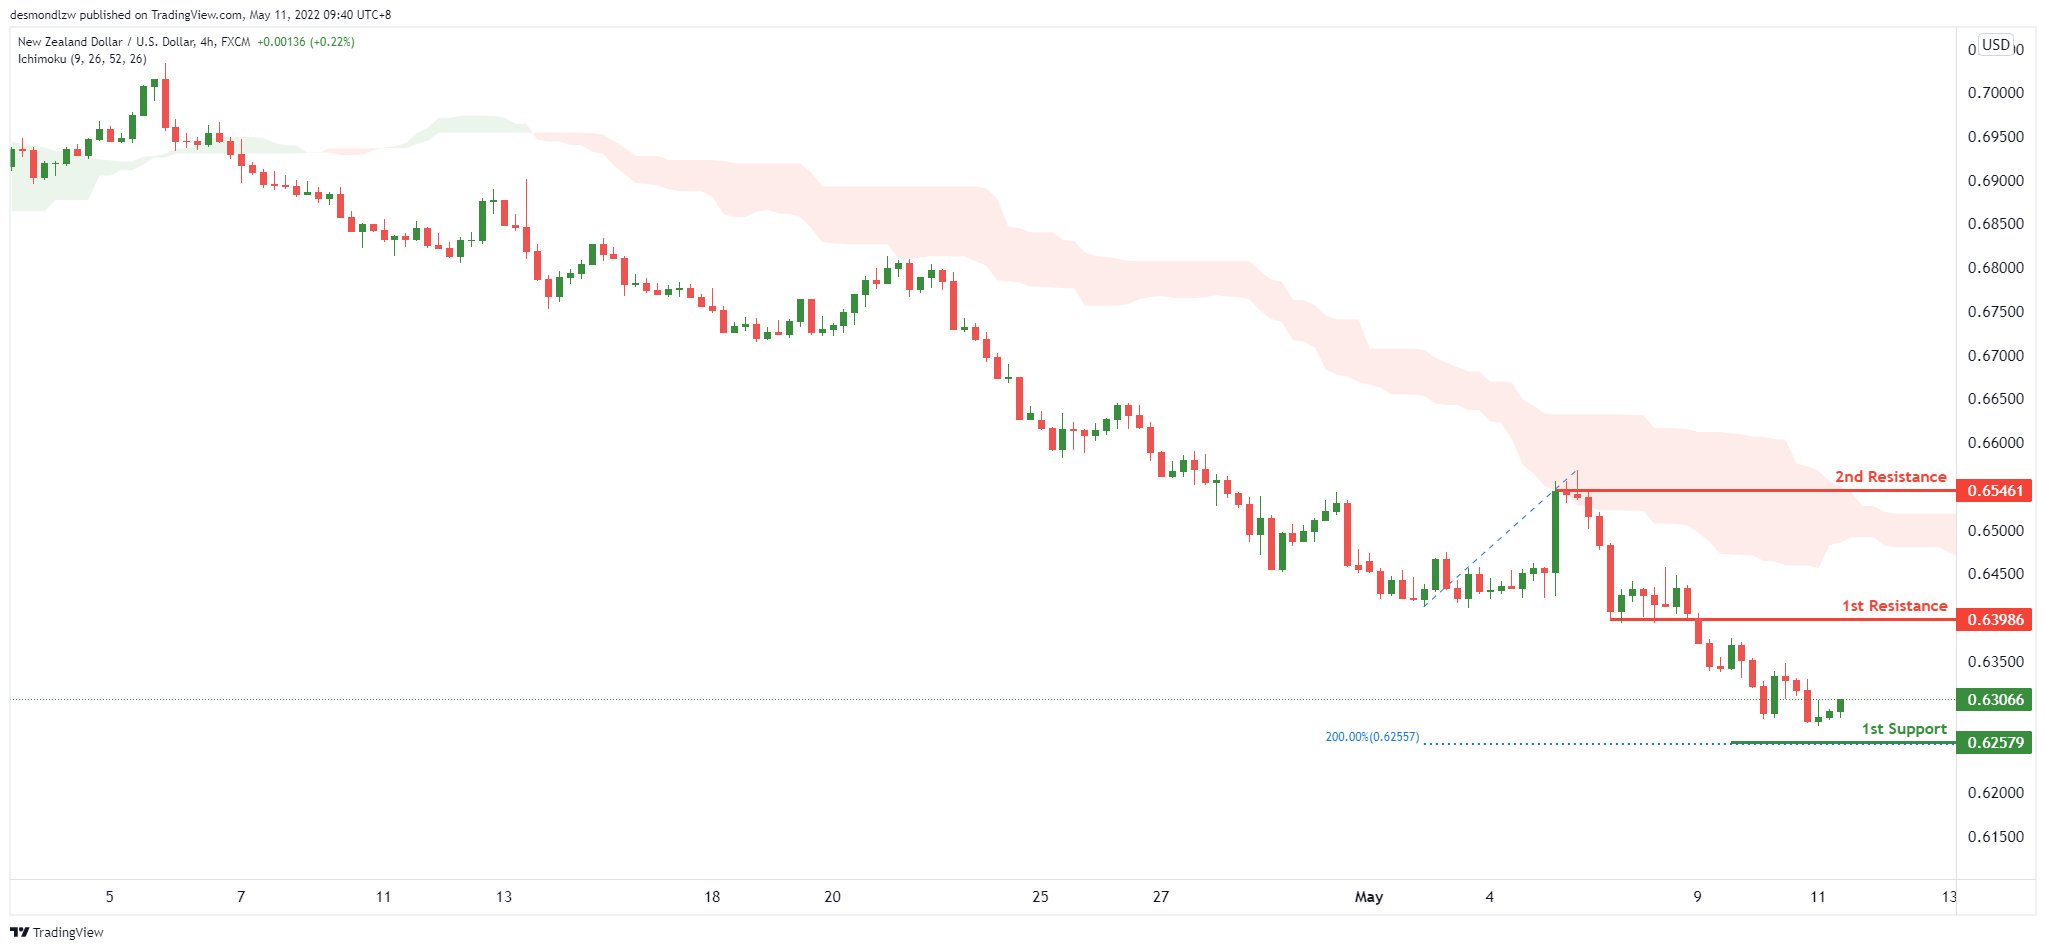
On the H4, with price moving below the ichimoku cloud, we have a bearish bias that price will drop from our 1st resistance at 0.63986 where the 23.6% Fibonacci retracement is to our 1st support at 0.62579 in line with the 200% Fibonacci projection. Alternatively, price may break 1st resistance structure and head for 2nd resistance.
Areas of consideration:
- H4 time frame, 1st support at 0.62579
- H4 time frame, 1st resistance at 0.63986
USD/CAD:
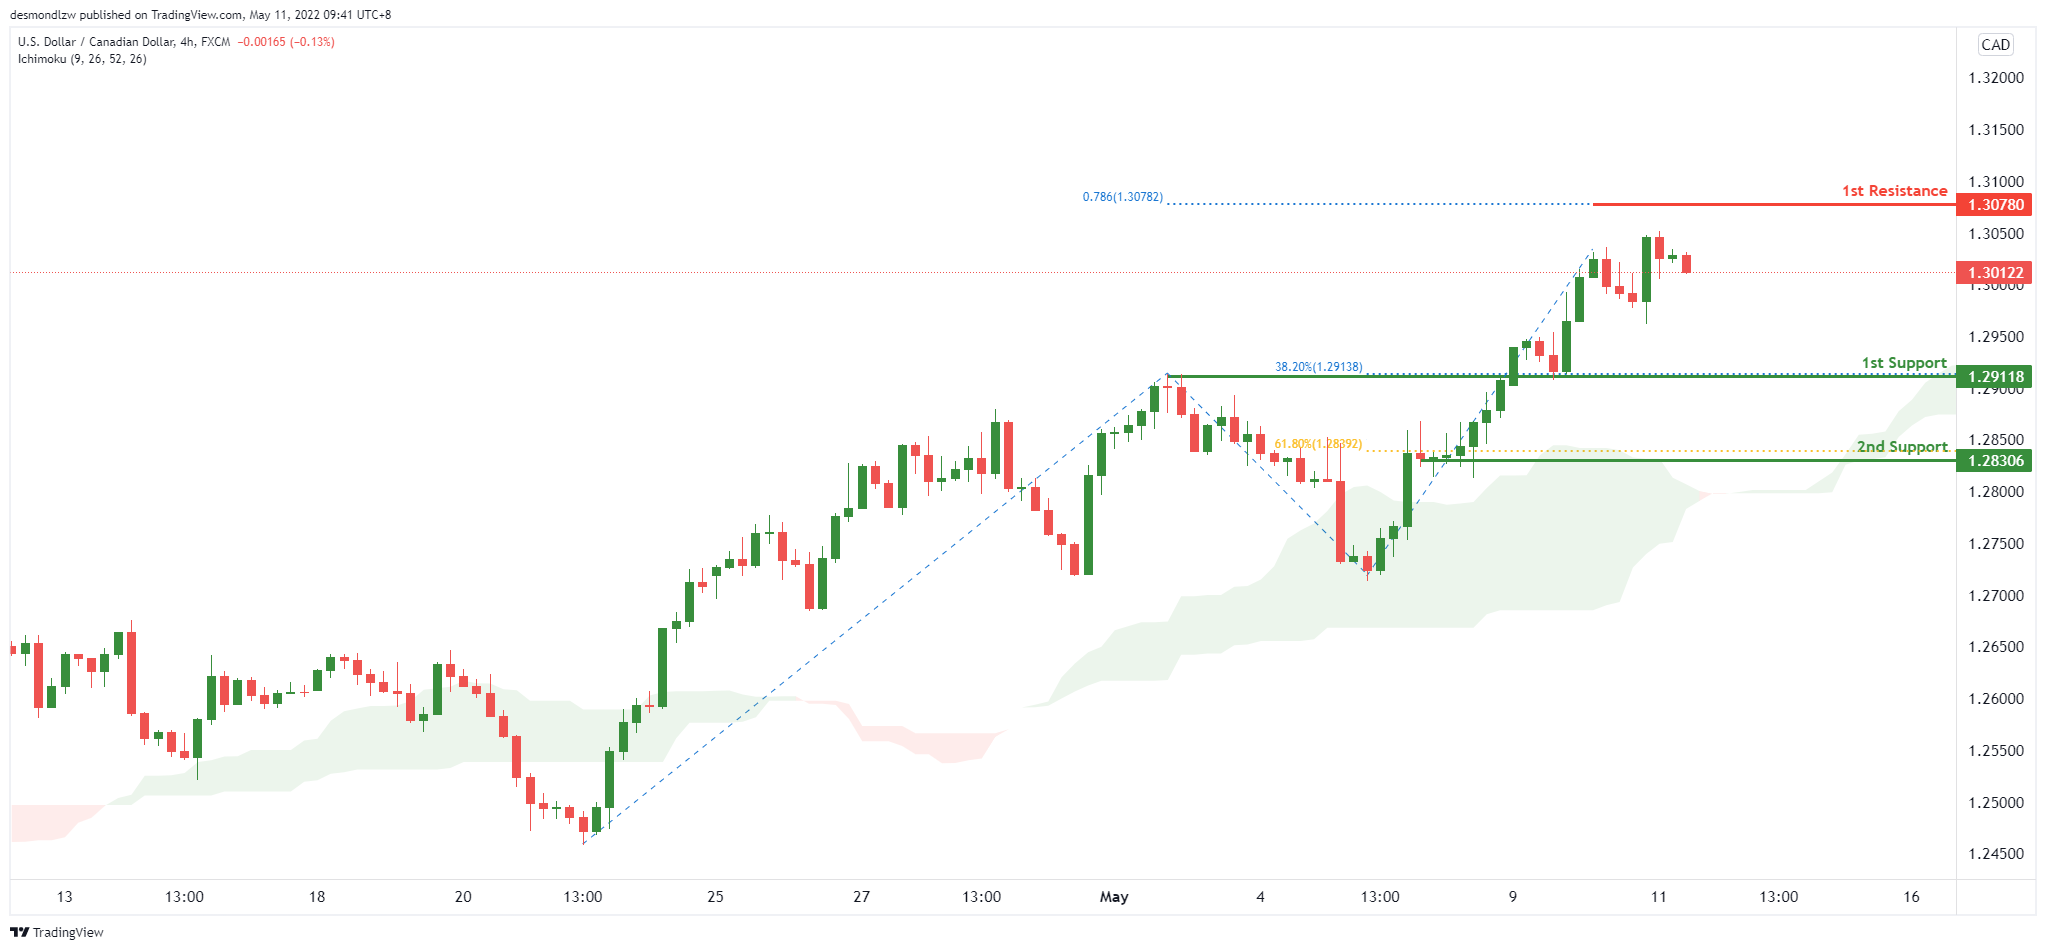
On the H4, with price moving above the ichimoku cloud, we have a bullish bias that price will rise to our 1st resistance at 1.30780 where the 78.6% Fibonacci projection is from our 1st support at 1.29118 in line with the horizontal pullback support. Alternatively, price may break 1st support structure and head for 2nd support where the horizontal pullback support is.
Areas of consideration:
- H4 time frame, 1st resistance at 1.30780
- H4 time frame, 1st support at 1.29118
OIL:
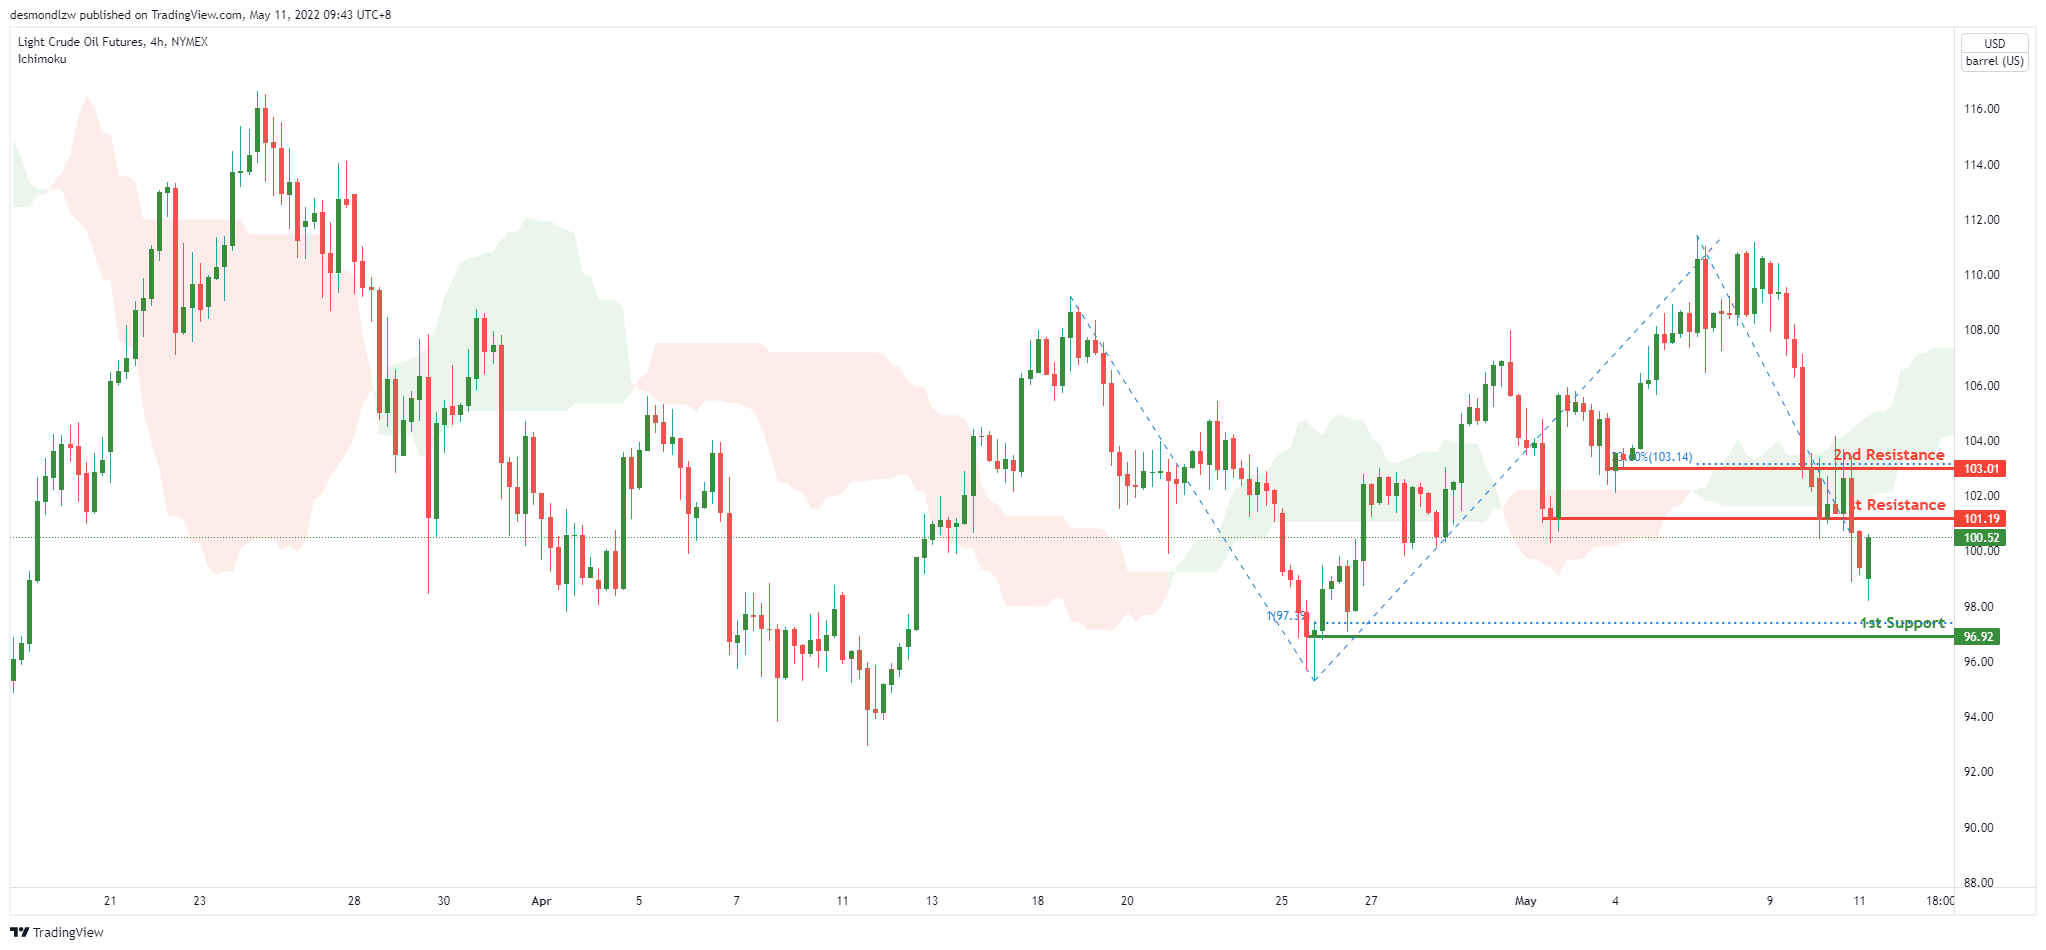
On the H4, with price moving above the ichimoku cloud, we have a bullish bias that price will rise to our 1st resistance at 101.19 where the pullback resistance is from our 1st support at 96.92 in line with the horizontal swing low support. Alternatively, price may break 1st support structure and head for 2nd support where the horizontal pullback support is.
Areas of consideration:
- H4 time frame, 1st resistance of 101.19
- H4 time frame, 1st support of 96.92
Dow Jones Industrial Average:
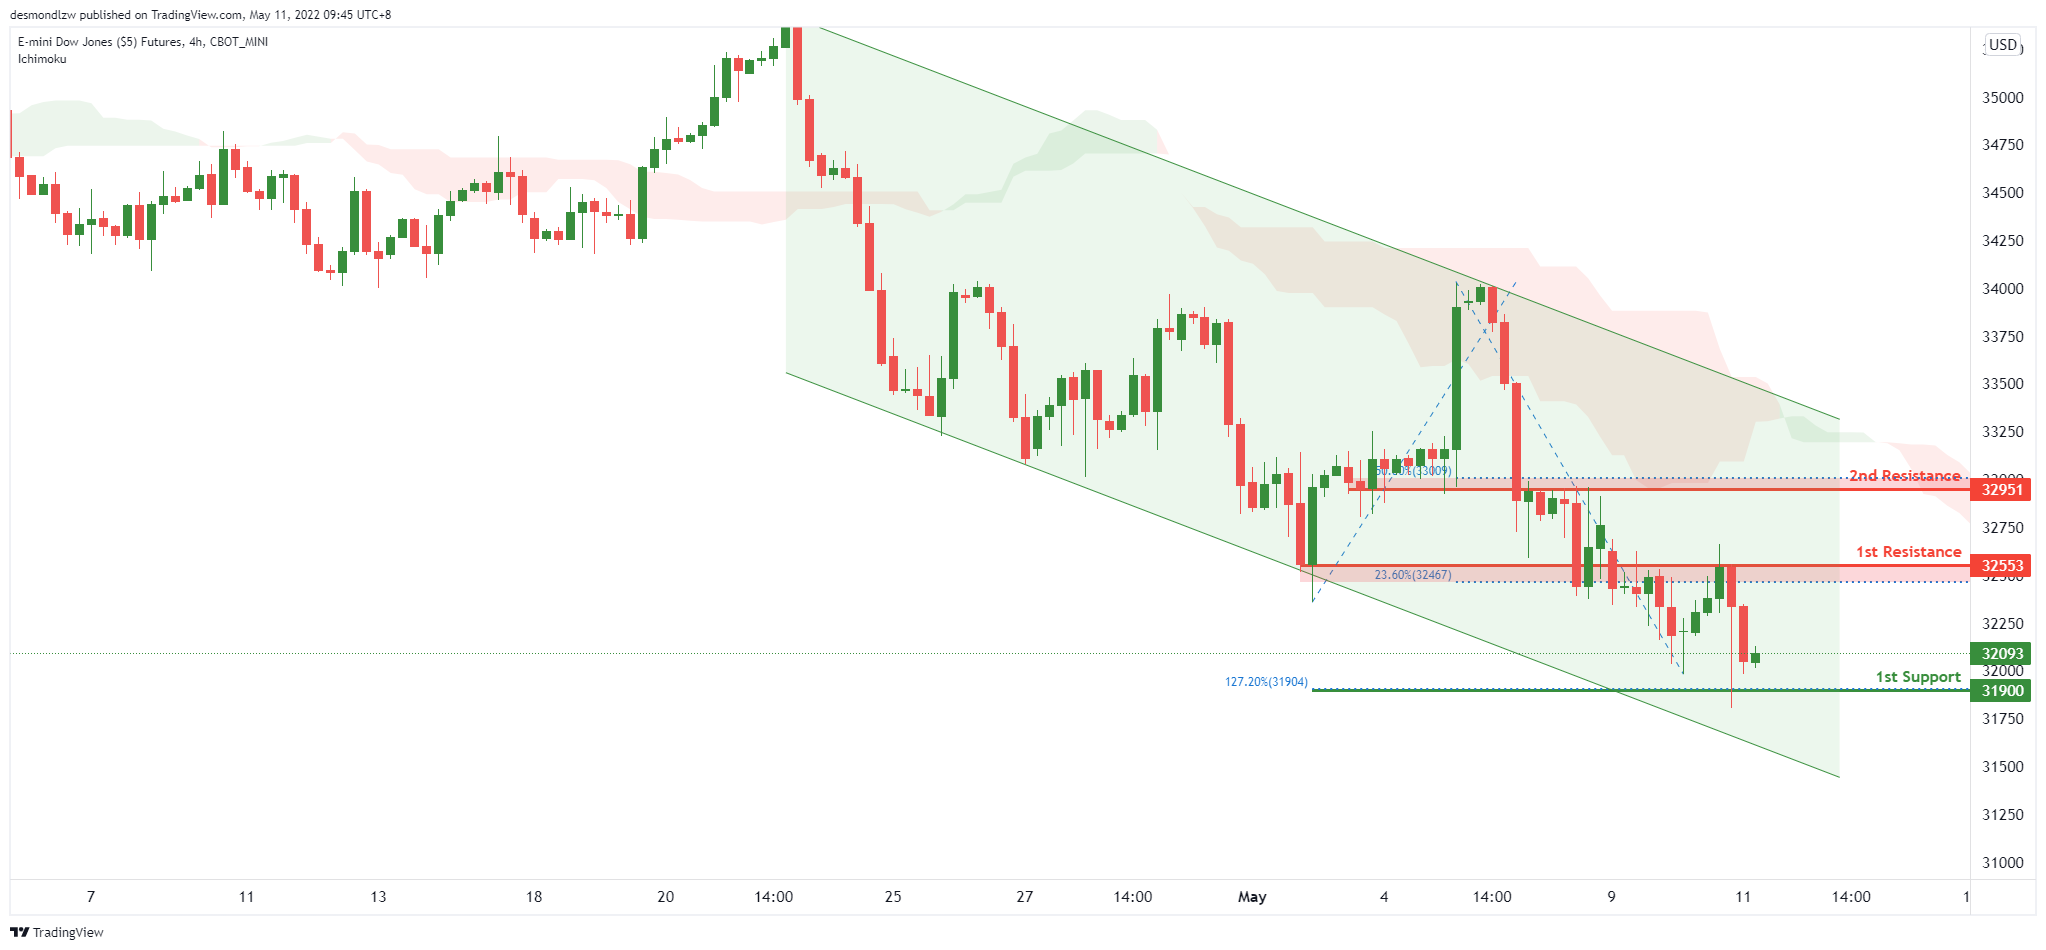
On the H4, with price expected to reverse off the ichimoku cloud, we have a bearish bias that price will drop from our 1st resistance at 32553 where the horizontal pullback resistance and 23.6% Fibonacci retracement is to our 1st support at 31900 in line with the 127.2% Fibonacci extension. Alternatively, price may break 1st resistance structure and head for 2nd resistance where the horizontal pullback resistance.
Areas of consideration :
- H4 time frame, 1st resistance at 32553
- H4 time frame, 1st support at 31900
Gold Outlook: All eyes on the US inflation data
The Gold market ended lower for the third consecutive week, while it seems to be losing ground so far in the current. Even though last week’s economic calendar was rather packed and important, it may have failed to create substantial volatility for the Gold market leaving traders disappointed. However, with a rather interesting week ahead and Gold’s highly unpredictable nature, we turn our attention to the present moment. This report can be used as a Gold trading manual as it will combine fundamental and technical analysis.
One way to trade the Gold market can be exclusively during important economic releases. The most important release from our point of view, comes on the 11th of May with the US Inflation data for April. Rising inflation has been a great headache for most economies around the world but especially in the US, with the matter being of great importance to the Federal Reserve. At the moment, the forecasts are for all, the monthly, yearly and core rates to tick down compared to the previous month, yet any surprise upon release can have a stronger impact on Gold prices. Inflation data releases have traditionally been used as a target for Gold traders and this event can produce significant volatility for Gold prices. The precious metal tends to react to the news, as bullion is seen as a hedge against higher inflation, which equals higher good prices. Higher inflationary rates tend to push Gold prices upwards and vice versa. However, traders are advised to be extremely cautious when engaging the market, as Gold prices can also be subject to wild swings before and after the release. On a separate note, on Thursday the 12th of May we get the weekly US Initial Jobless claims and on Friday the 13th we get the interesting Preliminary UoM consumer sentiment figure for May. Finally, traders should note Tuesday the 17th of May, with the Key Retail Sales and the Industrial Production rates both for April.
As Inflation in the US reached record high levels in the past months, the FOMC rushed to impose rate hikes just like the one of 50 basis points announced in the past week. Interest rate hikes are used to control the growth of the economy and to prevent it from overheating. On the day, Gold prices moved higher while the Greenback was on the backfoot, confirming the adverse relationship between them may still be in place. However, from our point of view, Gold continues to be driven by contradicting forces at the moment. The Gold market maybe caught in between Economic and Geopolitical tensions which are considered by many to remain with us for the near future. A global rate hike environment may not be so favorable to the Gold market while. Gold is trading higher compared to where it started at the beginning of the year but had peaked in March and has lost ground ever since. On the other hand, agriculture and energy commodity prices have remained higher recently, indicating investors may be gravitating towards those asset classes which are driven by the Russian war in Ukraine and supply bottleneck matters that have persisted as a result of the pandemic.
Finally, the fast-moving Gold market is highly appreciated by traders including some speculators. A gold trader should keep in mind that the market may be prone to abrupt and emotional price swings as a result of speculation. This is a reason for traders to take extra care when engaging the market in order to avoid being exposed with losses. In our opinion, trading Gold should be accompanied by swift and definite decision making while a predetermined exit point must be considered prior to entering the market.
Technical Analysis
XAUUSD Daily
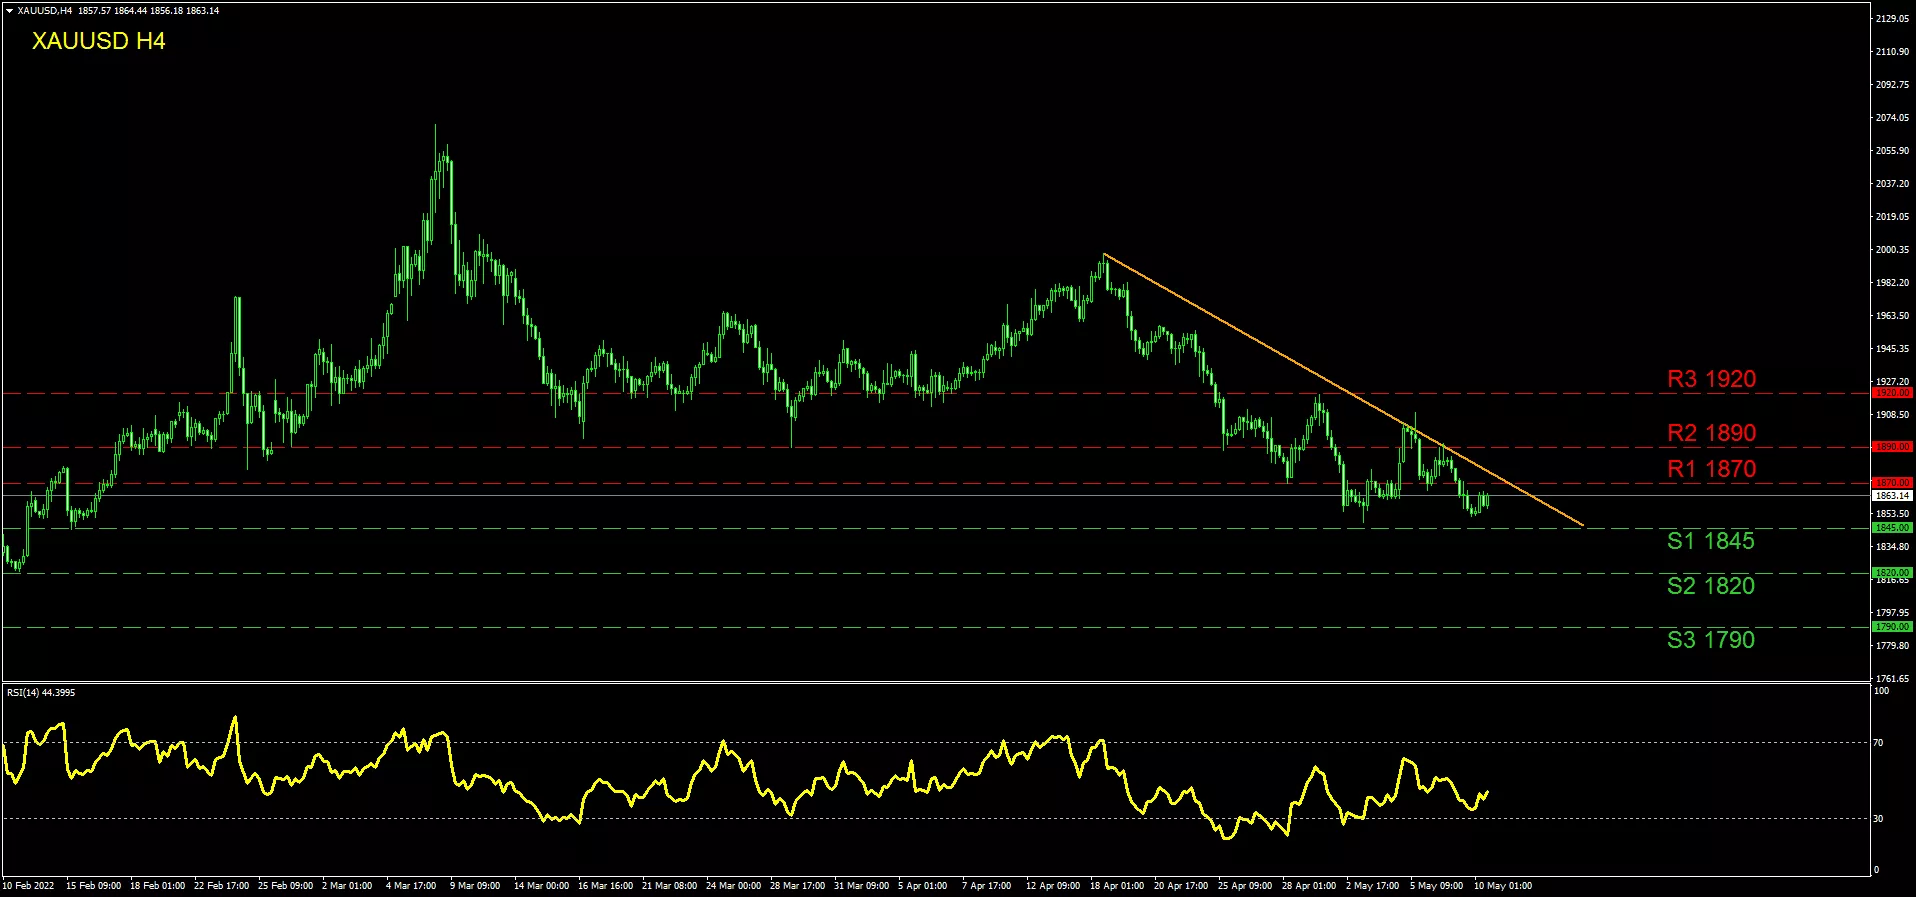
Gold is currently trading between our (R1) 1870 resistance level and our (S1) 1845 support level. In the past days, Gold traded higher breaking above the (R2) 1890 line and even surpassed the 1900 round number barrier but eventually returned to lower grounds. However, for an ultimate bullish scenario we would consider the (R3) 1920 resistance barrier as a key indicator for bullish appetite. In the opposite direction, a breach below the (S1) 1845 support could signal more bearish interest to come, making the (S2) 1820 support a probable target. In the scenario of notable selloff, we could see the (S3) 1790 being engaged. Very notably, the RSI indicator had made a move towards the 30 line but rebounded and is currently moving across the 43-level suggesting some stabilization, in the short term. Yet in our view, Gold continues to trade in a downward trendline which is highlighted with the orange descending line on our chart. A possible move above the orange line could signal a breach of the current downward trendline and that a sideways motion may be prevailing. Once again in order for the trend to turn bullish, our personal view would be for the (R3) 1920 line to be tested.
Elliott Wave View: Oil (CL) to Correct Further Downside
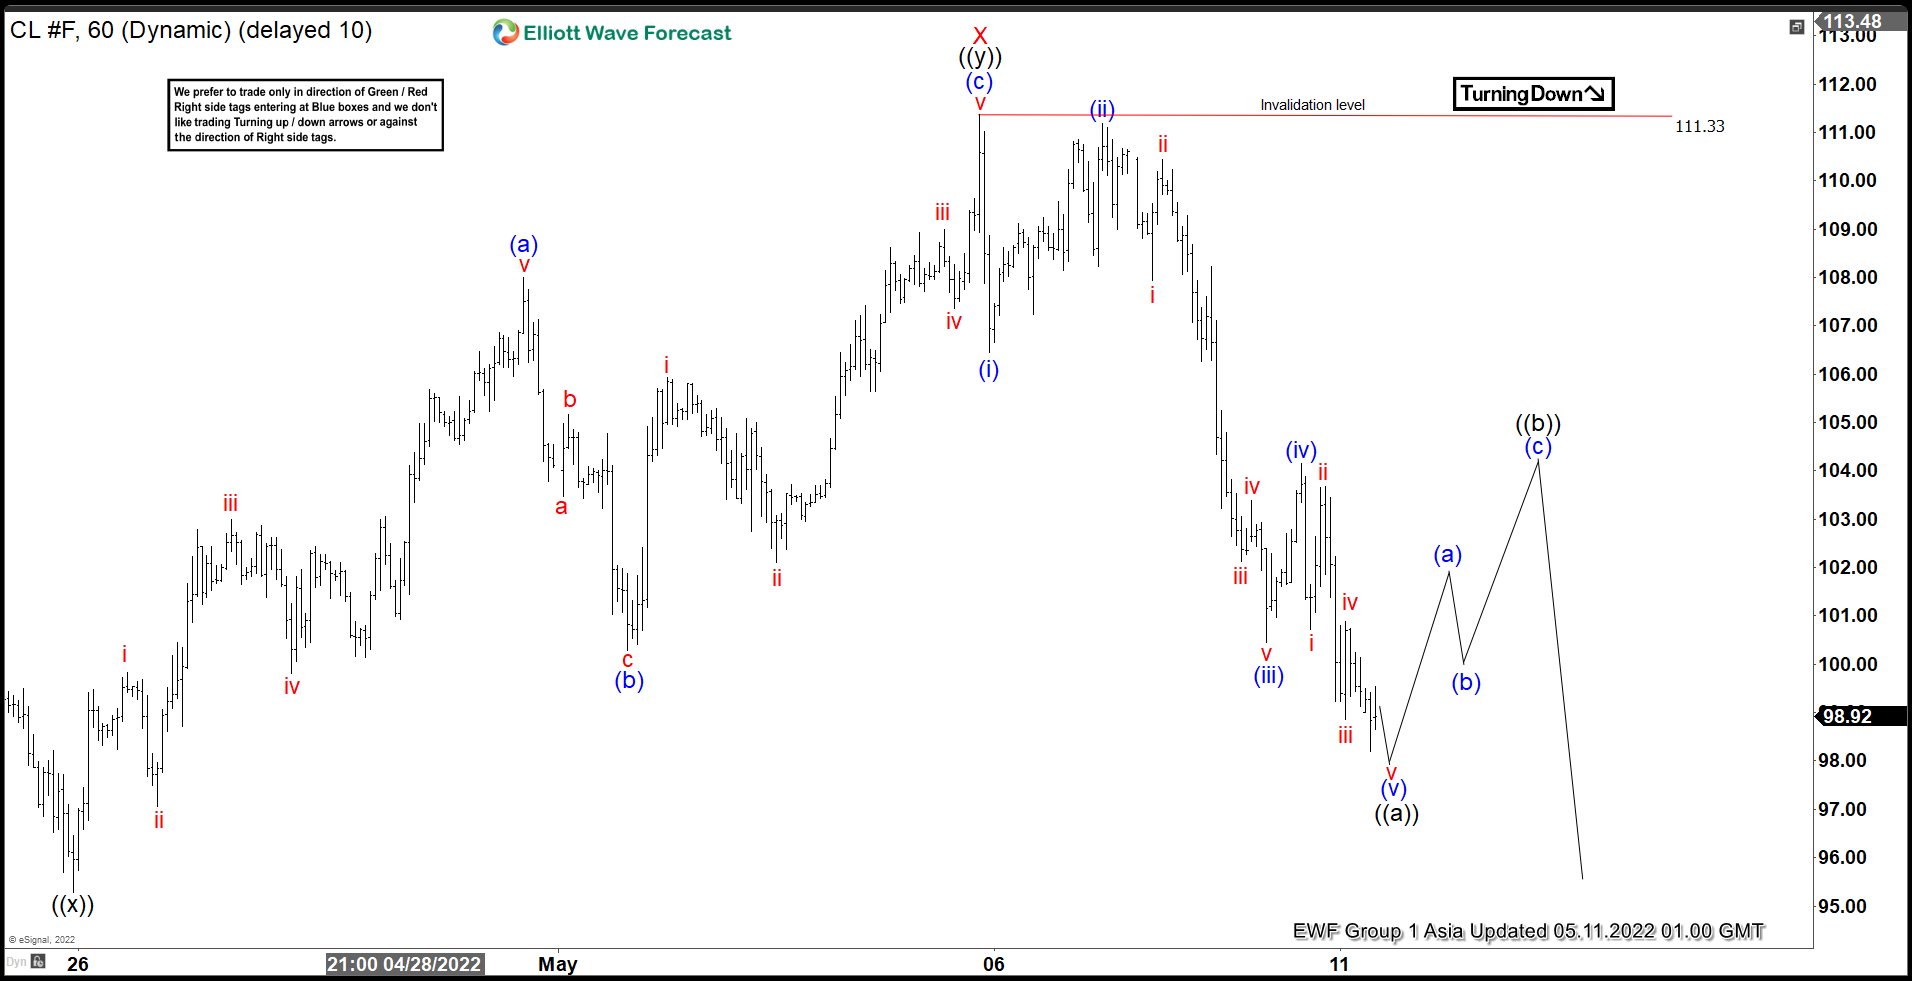
After spiking to 130.50 on March 7 at the height of the Russia-Ukraine war, Oil (CL) has started to pullback and consolidate. Oil shows an incomplete bearish sequence from the peak on March 7, 2022 favoring further downside. Short Term Elliott Wave View in Oil (CL_F) suggests the cycle from March 7, 2022 is unfolding as a double three Elliott Wave structure. Down from March 7 high, wave (W) ended at 93.53 and rally in wave (X) ended at 116.64. Wave (Y) is currently in progress as a double three in lesser degree. Down from wave (Y), wave W ended at 93.93. The 1 hour chart below shows the rally to 111.31 ended wave X.
Down from wave X, wave (i) ended at 106.45 and rally in wave (ii) ended at 111.18. Oil then extends lower in wave (iii) towards 100.44, and rally in wave (iv) ended at 104.16. Expect wave (v) of ((a)) to end soon, then Oil should rally in wave ((b)) to correct the decline from May 5, 2022 high before it resumes lower. Potential target lower is 100% – 123.6% Fibonacci extension from March 24, 2022 peak at 82.3 – 87.8 area.
Oil (CL) 60 Minutes Elliott Wave Chart
Silver Wave Analysis
- Silver under strong bearish pressure
- Likely to fall to support level 21.00
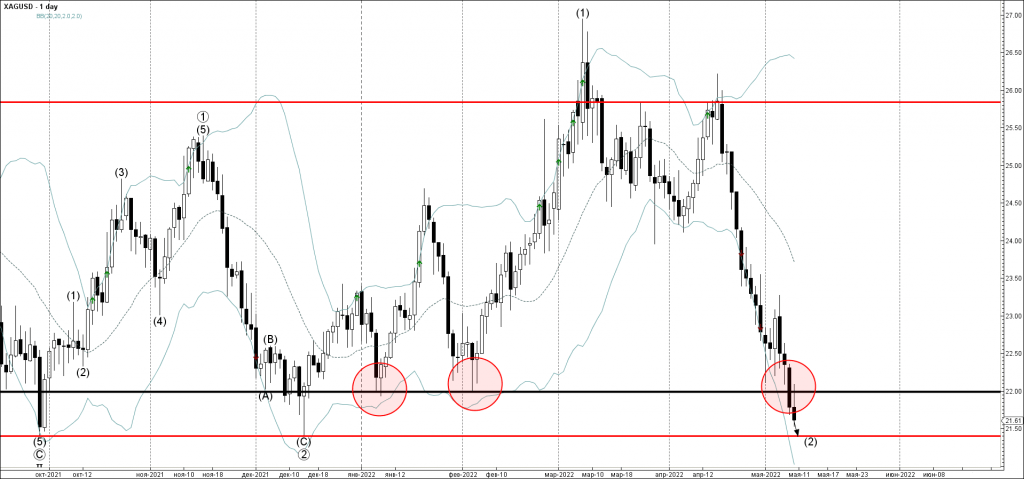
Silver under the strong bearish pressure after the price broke below the long-term support level 22.00 (the previous monthly low from January and February).
The breakout of support level 22.00 accelerated the active intermediate ABC correction (2) from the start of March.
Silver can be expected to fall further toward the next support level 21.00 (earlier multi-month low from December, target for the completion of the active wave (2)).
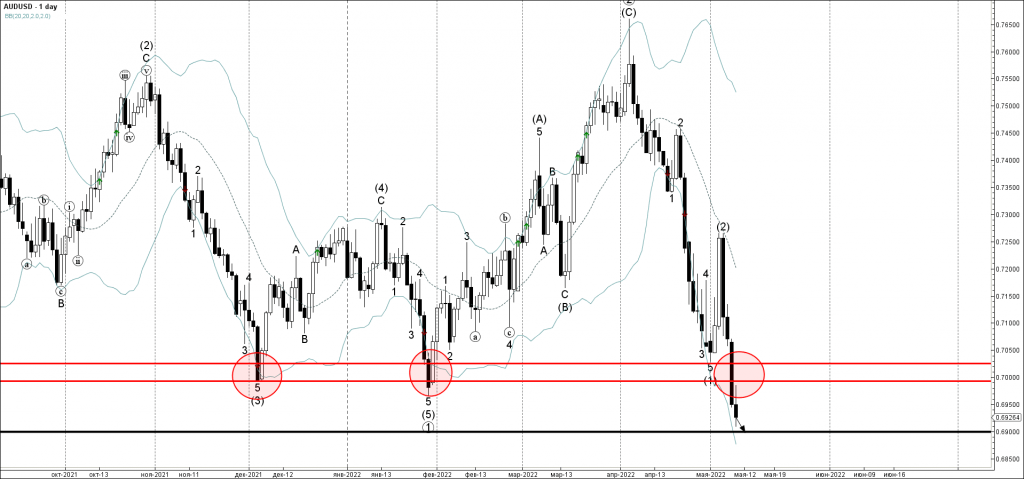
AUDUSD Wave Analysis
- AUDUSD broke support zone
- Likely to fall to support level 0.6900
AUDUSD currency pair recently broke the support zone lying between support levels 0.7025 (low of the previous wave (1)) and 0.7000.
The breakout of this support zone accelerated the active impulse wave 3 of the medium-term impulse wave (3) from the start of May.
Given the strong AUD bearishness – AUDUSD can be expected to fall further toward the next support level 0.6900.