
Sample Category Title
Cliff Notes: Challenging Circumstances
Key insights from the week that was.
In Australia, all eyes were on the Q4 CPI print ahead of next week’s RBA decision. In the event, inflation printed above our expectations on both a headline and trimmed mean basis, rising 0.6%qtr / 3.6%yr and 0.9%qtr / 3.4%yr respectively. There were a number of subplots in the detail: strong seasonal demand for domestic holiday travel (9.6%yr), rising gold and silver prices boosting accessories (11.4%yr), and rebate-driven volatility in electricity prices (21.5%yr). Policy changes and administered price increases also buoyed inflation across childcare, education, water rates and property charges. There was some evidence of disinflation too, mainly in home-building costs and rents where inflation looks to have peaked. Overall though, it appears services inflation remains ‘sticky’ well above target (4.1%yr) and that goods inflation is no longer providing a disinflationary offset (3.4%yr).
Following the CPI report, Chief Economist Luci Ellis issued a change of rate call, with Westpac now anticipating the RBA to lift the cash rate by 25bps to 3.85% at next week’s meeting. The RBA laid the groundwork for such a move in their communications over recent months in case of an upside surprise; and with two disappointing quarterly prints now received, there is little reason wait. How the policy outlook will evolve beyond February is set to depend on the response to the change in policy expectations and the economy’s capacity, particularly labour market participation. The RBA’s updated forecasts will shed more light on their baseline expectations and view of key risks; they are likely to continue to hold a relatively conservative view on supply and a cautious approach to communicating on the policy outlook.
The latest NAB business survey meanwhile reported a solid finish to 2025, the conditions and confidence indexes edging higher in December, consistent with other evidence of strengthening consumer demand. That said, the future path for inflation and interest rates is a clear threat to confidence in early-2026. Worthy of note too, perspectives differ across industries. In our latest Quarterly Agriculture Report, we discuss prospects for farm GDP following a bumper 2025.
In the US, the FOMC maintained its monetary policy stance at the January meeting as expected in a 10-2 vote, with Miran and Waller preferring to cut the fed funds rate by 25bps. The Committee’s assessment of the economy was positive for growth (characterising it as "solid") notwithstanding weakness in housing; sanguine on the labour market ("the unemployment rate has shown some signs of stabilization") despite job gains having “remained low”; and cautious on inflation ("remains somewhat elevated").
The characterisation of risks was balanced, the statement simply noting that “Uncertainty about the economic outlook remains elevated”, the “Committee is attentive to the risks to both sides of its dual mandate” and "prepared to adjust the stance of monetary policy as appropriate". In the press conference, Chair Powell made it clear that policy will be determined on a meeting-by-meeting basis on incoming data and did not show material concern over the potential evolution of conditions. Instead, risks were judged to have diminished.
Recent weakness in the US dollar was a key topic during the Q&A. Chair Powell made clear market movements do not dictate monetary policy, nor does the FOMC seek to manage the currency, with full employment and inflation-at-target their mandated focus. Chair Powell did not comment on recent tensions between the Administration and the Federal Reserve but took the opportunity to affirm the long-standing success of central bank independence and monetary / fiscal collaboration globally.
We expect one further cut from the FOMC in March to mitigate the lingering downside risks the labour market faces. But if activity growth proves stronger than expected at the beginning of 2026, the FOMC may skew their focus towards inflation risks, holding off on a further reduction in the fed funds rate.
Further north, the Bank of Canada also kept rates steady at 2.25%, maintaining an accommodative stance to support the economy as it navigates excess capacity and trade uncertainty. Governor Macklem noted that the “current policy rate remains appropriate, conditional on the economy evolving broadly in line with the [forecast] outlook …The Canadian economy is adjusting to the structural headwinds of US protectionism…[and] uncertainty makes it difficult to predict the timing or direction of the next change in the policy rate.” We anticipate the Council will keep policy accommodative while headwinds persist.
Elliott Wave Analysis: USDCHF Downtrend Set to Extend While Rally Stalls
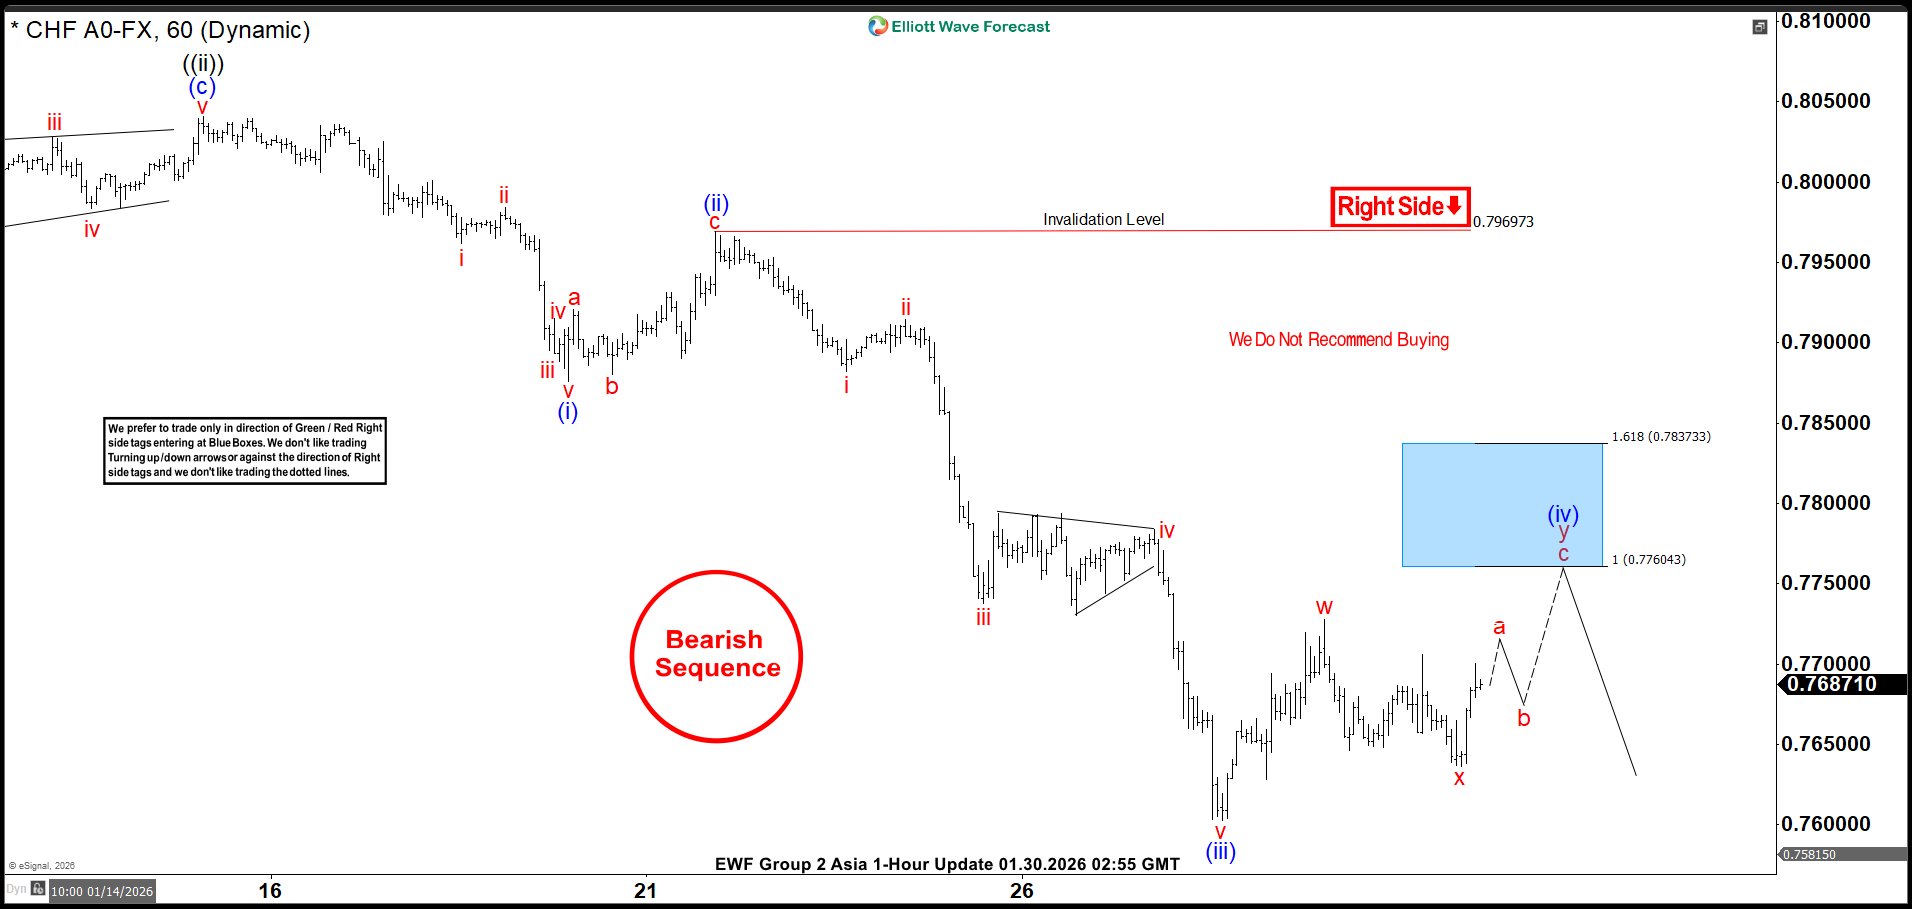
USDCHF continues to extend lower, reinforcing the prevailing bearish trend. The short-term Elliott Wave outlook suggests that the cycle from the November 25, 2025 high remains in progress as a five-wave impulse. This structure highlights persistent weakness and confirms that rallies are corrective rather than the start of a new bullish phase.
From the November 25 high, wave ((i)) concluded at 0.785. A corrective rally in wave ((ii)) then ended at 0.80408. The pair resumed its decline in wave ((iii)), which subdivides into another five-wave impulse of lesser degree. Within this sequence, wave (i) finished at 0.7876, while the rally in wave (ii) terminated at 0.7968. The market then accelerated lower in wave (iii), reaching 0.7602 before pausing.
Currently, wave (iv) is unfolding as a corrective rally. This move retraces the cycle from the January 22, 2025 high and is expected to develop in either three or seven swings. The projected target lies within the 0.776–0.783 zone, which represents the 100%–161.8% Fibonacci extension of wave w. This area is identified as the blue box, a region where corrections often terminate.
From this zone, USDCHF faces two potential paths. The pair may resume its decline, continuing the larger bearish impulse. Alternatively, it may produce a three-wave pullback before turning higher again in larger correction In either case, the Elliott Wave structure favors the downside, reinforcing the view that rallies remain corrective and that the broader bearish cycle is not yet complete.
USDCHF 60 minute chart
USDCHF Elliott Wave video:
https://www.youtube.com/watch?v=EPSEtXZxVEY
USD/JPY Recovery Looks Fragile With Resistance Waiting Above
Key Highlights
- USD/JPY nosedived below 156.50 and 155.00.
- It tested 152.00, and any recovery above 154.00 could face hurdles.
- EUR/USD surged above 1.2000 before trimming some gains.
- GBP/USD started a consolidation phase above 1.3760.
USD/JPY Technical Analysis
The US Dollar started a major decline below 158.00 against the Japanese Yen. USD/JPY settled below 157.00 to enter a bearish zone.
Looking at the 4-hour chart, the pair traded below a key bullish trend line with support at 158.00 to start the recent downtrend. It settled below 156.50, the 200 simple moving average (green, 4-hour), and the 100 simple moving average (red, 4-hour).
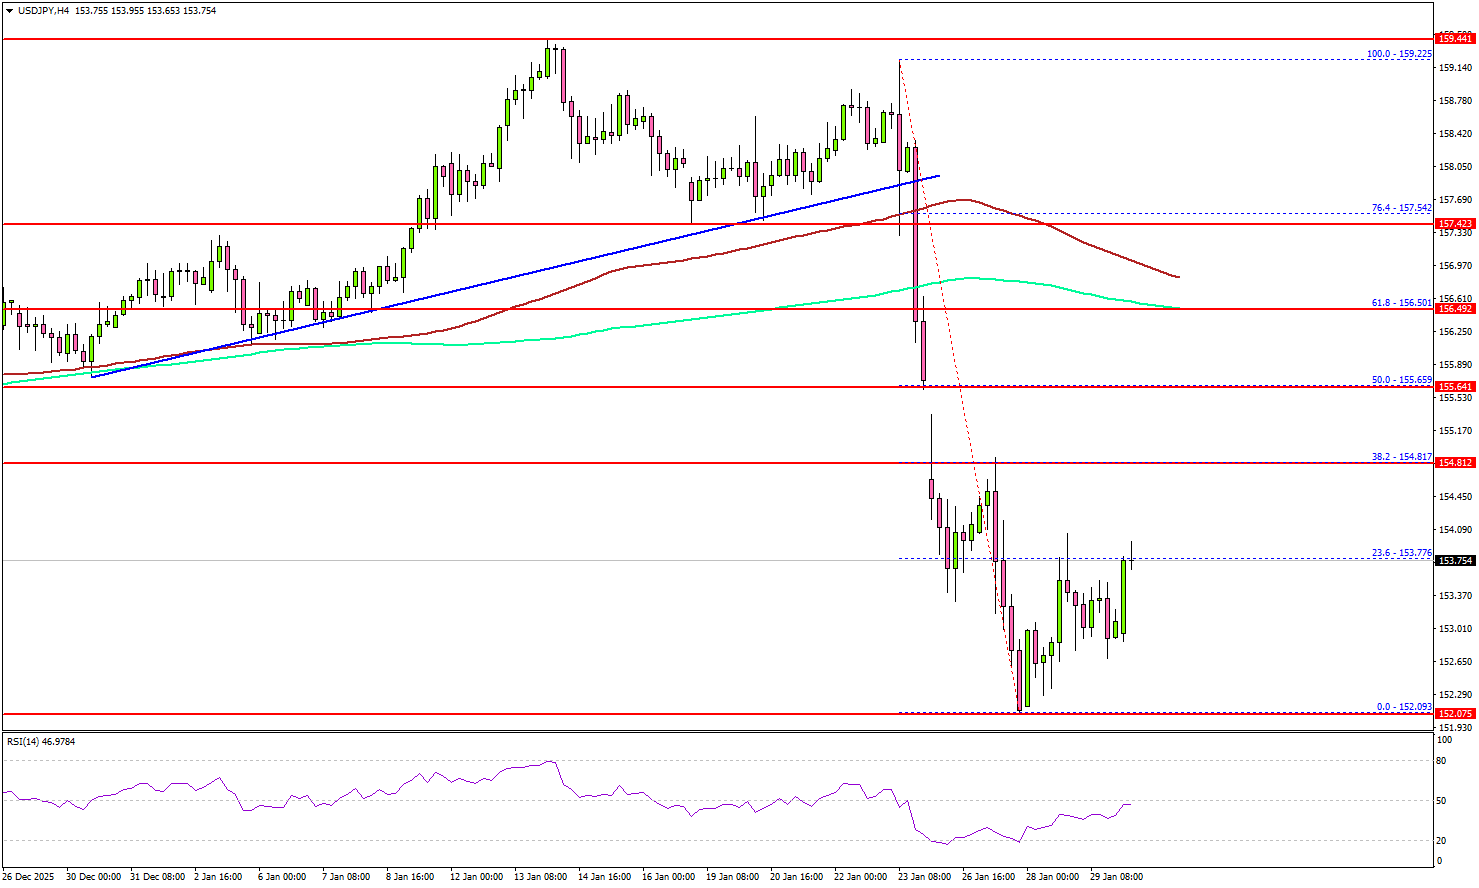
Finally, the pair dived below 153.50 and tested 152.00. A low was formed at 152.09, and the pair is now consolidating losses. Immediate resistance sits near 153.75.
The first key hurdle could be 154.00. The next stop for the bulls might be 154.80, where they could face hurdles. A close above 154.80 could open the doors for more gains. In the stated case, the bulls could aim for a move toward 156.50 and the 200 simple moving average (green, 4-hour).
If there is a fresh decline, the pair might find support near 152.40. The first major area for the bulls might be near 152.00. The main support sits at 150.00, below which the pair could accelerate lower. The next support could be 146.50.
Looking at EUR/USD, the pair extended gains and traded above 1.2000 before the bears appeared and pushed the pair to 1.1950.
Upcoming Key Economic Events:
- US Producer Price Index for Dec 2025 (MoM) – Forecast +0.2%, versus +0.2% previous.
- US Producer Price Index for Dec 2025 (YoY) – Forecast +2.7%, versus +3.0% previous.
- Chicago Purchasing Manager’s Index for Jan 2026 – Forecast 44.0, versus 43.5 previous.
AUDUSD Pulls Back from New Three-Year High
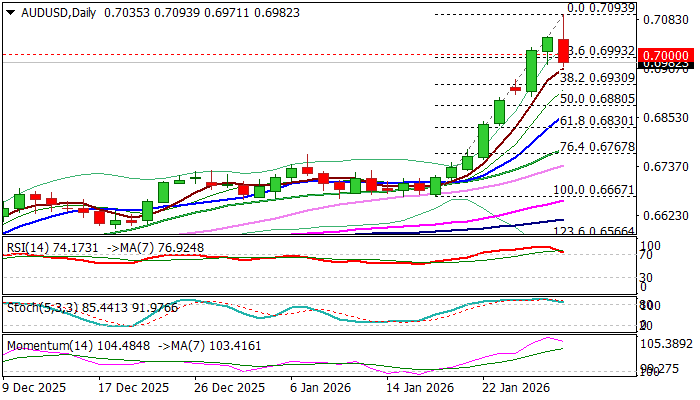
AUDUSD extended rally for nearly two weeks and hit three-year high on Thursday (0.7093), before easing.
Weakening US dollar and Aussie tracking strong rise in precious metals, were mainly behind the latest rally (up over 6% since the move started on Jan 19).
Bulls broke and established above psychological 0.70 level, but faced strong headwinds on approach to 0.7100 resistance, as daily studies are overbought and overstretched 14-d momentum turned south.
Thursday’s red daily candle with long upper shadow adds to signals of upside rejection and warning of pullback, as the US dollar jumps after steep fall in past four days.
Loss of initial supports at 0.70 zone (psychological / near Fibo 23.6% of 0.6667/0.7093) unmasks 0.6930 (Fibo 38.2%), with stronger acceleration lower to find solid ground at 0.6900/0.6880 zone (round-figure / 50% retracement) and mark a healthy correction before larger bulls regain control.
Caution on potential loss of 0.6880 handle, which may trigger deeper pullback and sideline bulls.
Res: 0.7015; 0.7093; 0.7157; 0.7207
Sup: 0.6968; 0.6930; 0.6880; 0.6830
Metals Flashing Red After Record Runs – Silver (XAG/USD), Gold (XAU/USD) and Copper (XCU/USD) Outlook
- Silver, Gold were reaching new highs every day but saw a sudden top in today's action
- Post-FOMC rally gets tested, we observe if the trend can continue
- High timeframe analysis for XAG/USD, XAU/USD and XCU/USD (Copper)
If 2025 was volatile for metals, 2026 is starting with even greater intensity.
The global order is fracturing as historic allies clash and new conflicts appear imminent.
For metal maximalists, this confirms a long-held thesis. Decades of high deficits create predictable capital flows and supply shortages, which are now driving prices to daily records.
As geopolitical tensions rise, investors are rushing to commodities to hedge against supply shortages and inflation, a classic play.
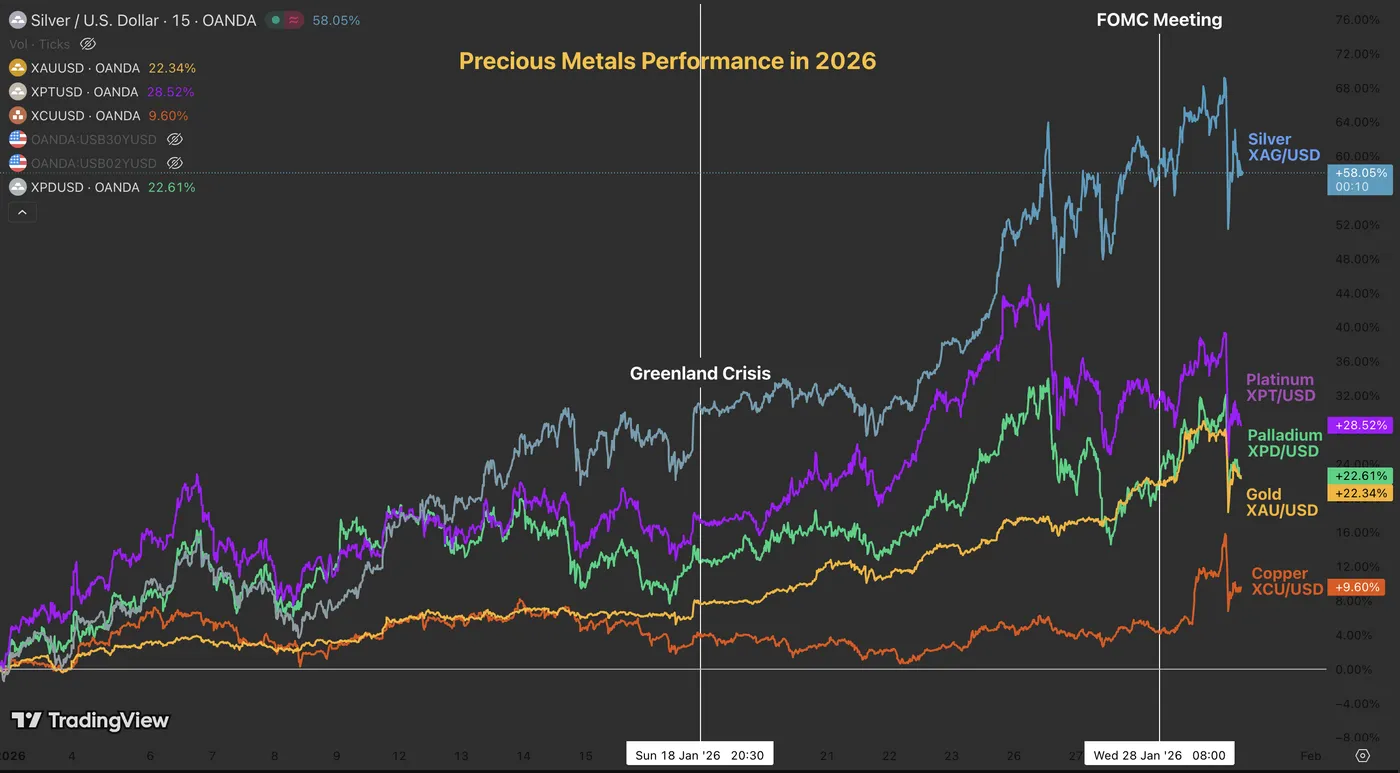
Metals performance in 2026 – Source: TradingView
But today's flows feel different.
It is almost impossible to predict tops in such extreme, unidirectional trends. Some periods can be more favorable for squeezes. Some others are more favorable for rangebound conditions and selloffs.
And such periods tend to change at the beginning of the New Year, at the start of Quarters, Months, or even after FOMC meetings.
As the US President announced he will officially announce his decision on the Fed Chair next week, Markets are looking back at yesterday's Federal Reserve decision.
Higher rates for longer will be the way to go for the Fed until anything cracks, as the US Labor Market bounced back and the US economy is shining – Can't justify many cuts with that.
Today marked a brutal stalling in rallies throughout the Metals asset class.
Gold was trading 6% higher than the day before the FOMC, only to give up those gains in a 10% flash crash.
Similar flows occurred in Copper, Silver, Palladium, and Platinum, all dropping by 9% to 11%.
By the way, Copper spiked to new record highs in yesterday's evening session, reaching $6.52 per lb, but still lacking a more fundamental foundation to persistently elevated prices.
In the meantime, let's dive right into intraday timeframe analysis for Gold (XAU/USD), Silver (XAG/USD) and Copper (XCU/USD) to spot where the session dynamic takes the price action. Is the trend challenged?
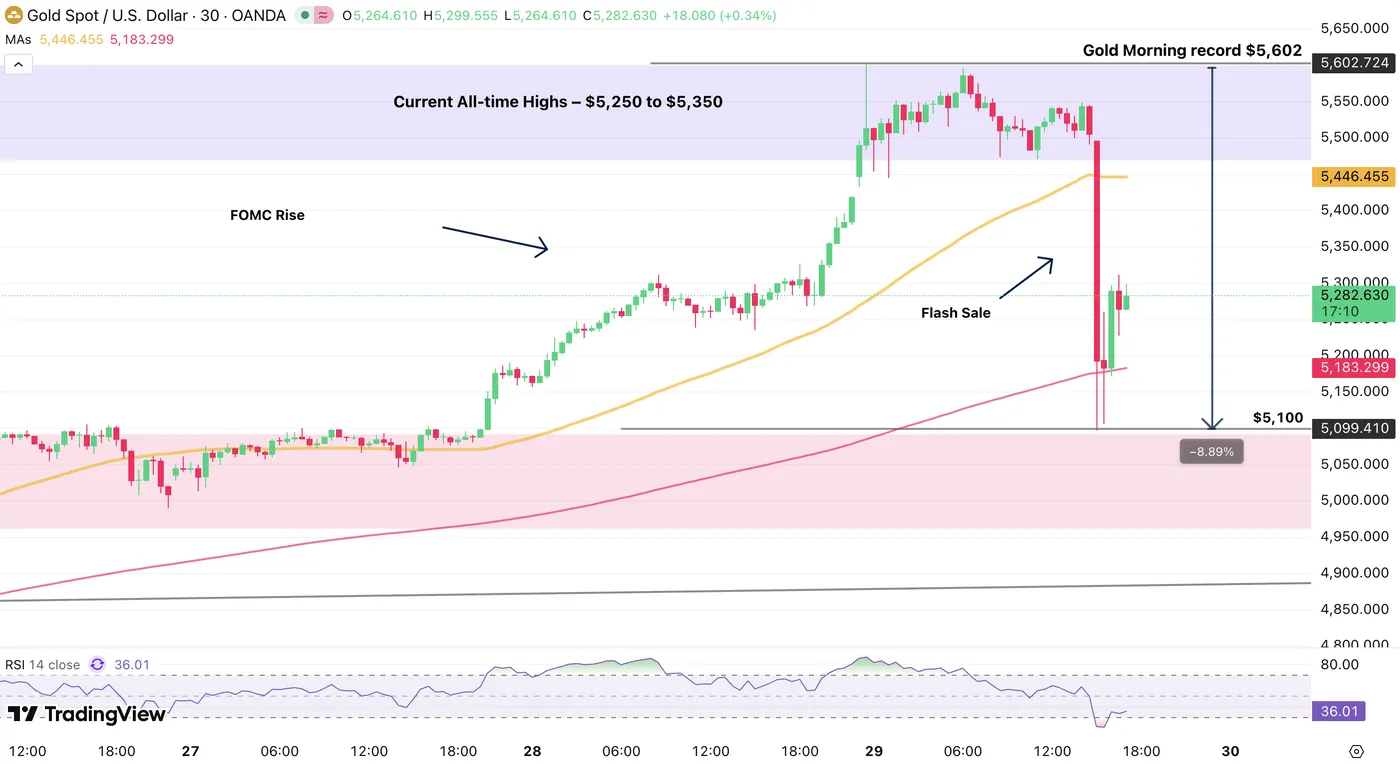
Gold (XAU/USD) 2H Chart and levels
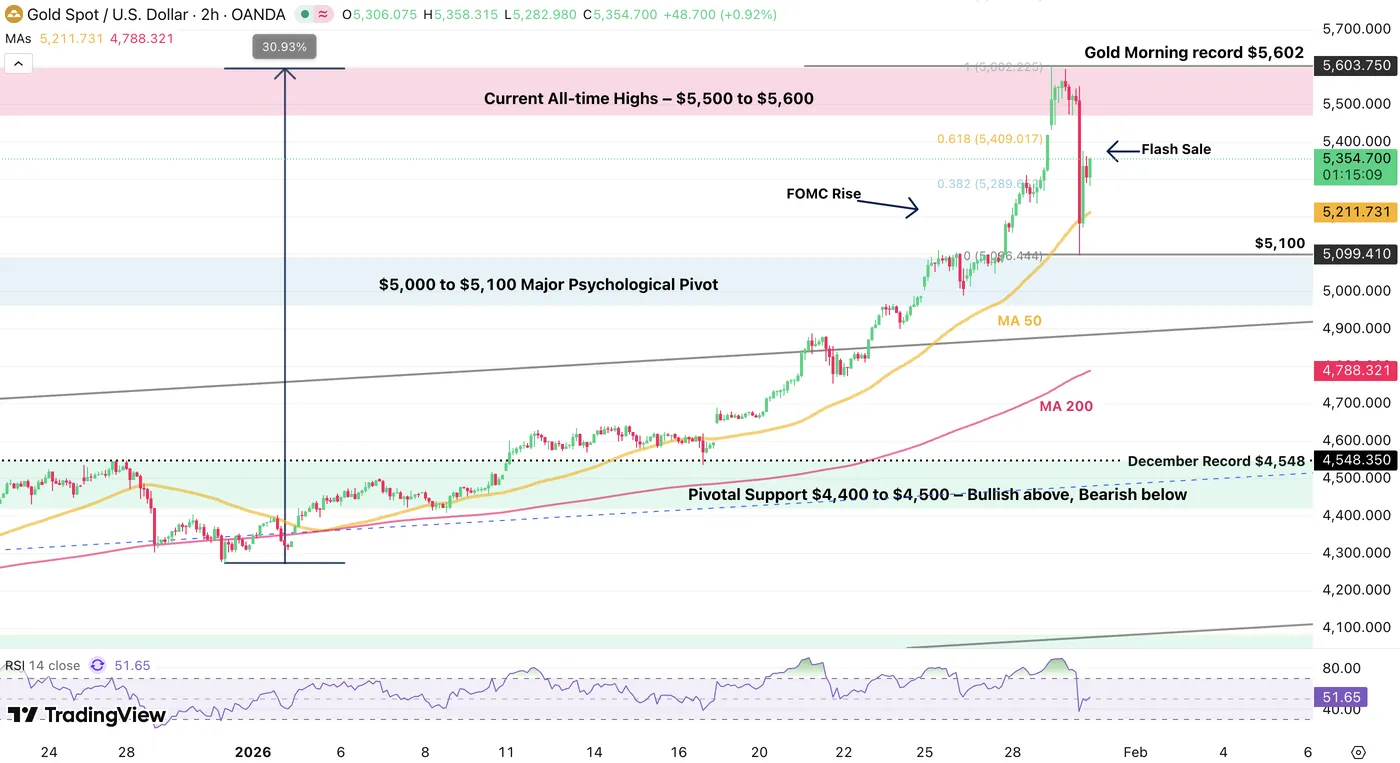
Gold (XAU/USD) 2H Chart, January 29, 2026 – Source: TradingView
This morning's action could pose a significant test to the 30% yearly run in the Bullion.
The current fundamentals are heavily backing the recent rise, particularly as it is far less extreme than the one seen in Silver for example.
Still, when profit-taking occurs so suddenly, traders can look around, question the current state of the Market and reassess if the trend can still hold.
Since the flash, prices have rebounded – Hence look at these two levels:
- Any retest of the all-time high ($5,600) should be followed with further upside. Particularly after a 4H candle close. Next areas of interest could be between $5,800 and $5,900.
- Any break and close below $5,100 can put the entire 2026 gains in challenge.
- The 4H 50-period MA can act as a very interesting indicator for short-term momentum
Higher Timeframe Levels to watch for Gold (XAU/USD):
Resistance Levels:
- Current All-time Highs – $5,500 to $5,600
- Key Fibonacci Projection $5,800 to $5,900
- $5,400 mini-resistance
Support Levels:
- $5,000 to $5,100 Major Psychological Pivot (Morning lows $5,100)
- $4,788 4H MA 200
- Pivotal Support $4,400 to $4,500 – Bullish above, Bearish below
- Minor Support $3,880 to $4,050
- $3,200 to $3,500 Major Support
- $2,600 to $2,800 November 2024 Support
- $1,800 to $2,000 2022 to 2024 Range Support
Silver (XAG/USD) 2H Chart and levels
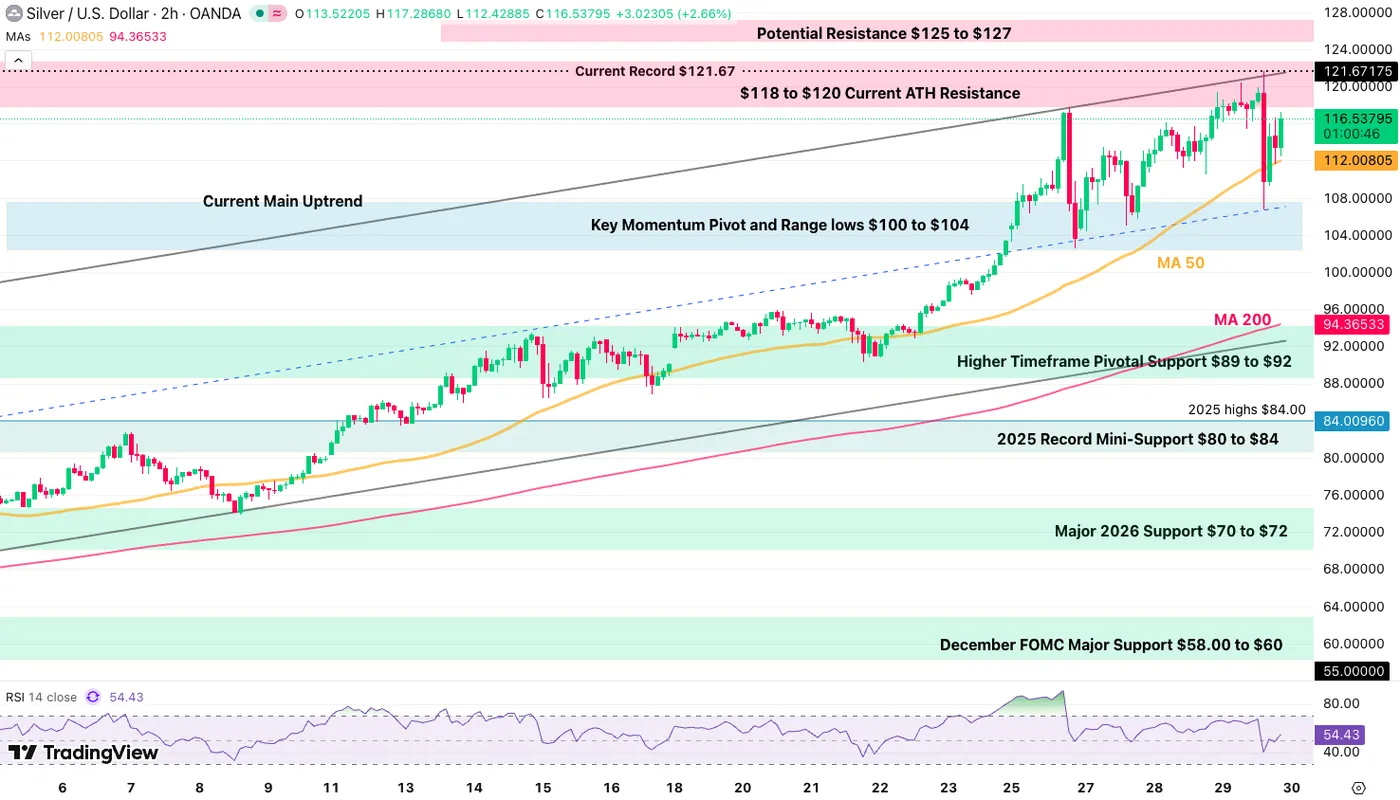
Silver (XAG/USD) Weekly Chart, January 29, 2026 – Source: TradingView
Evolving in a steep upward channel, Silver is testing its upper bound in high volatility consolidation.
Prices have maintained within a $107 to $120 range since Monday, hence trades will look for breakouts either to the upside or downside for future action.
Similarly as in Gold, look for a candle close above or below with high volumes to get confirmation.
A break lower could go test the Upward channel lower bounds, currently around $92.
Higher Timeframe Levels to watch for Silver (XAG/USD):
Resistance Levels:
- $118 to $120 Current ATH Resistance
- Current Record $121.67
- Potential Resistance $125 to $127
Support Levels:
- Key Momentum Pivot and Range lows $100 to $104
- Higher Timeframe Pivotal Support $89 to $92
- 2025 HighsMini-Support $80 to $84
- Major 2026 Support $70 to $72
- December FOMC Major Support $58.00 to $60
Copper (XCU/USD) 2H Chart and levels
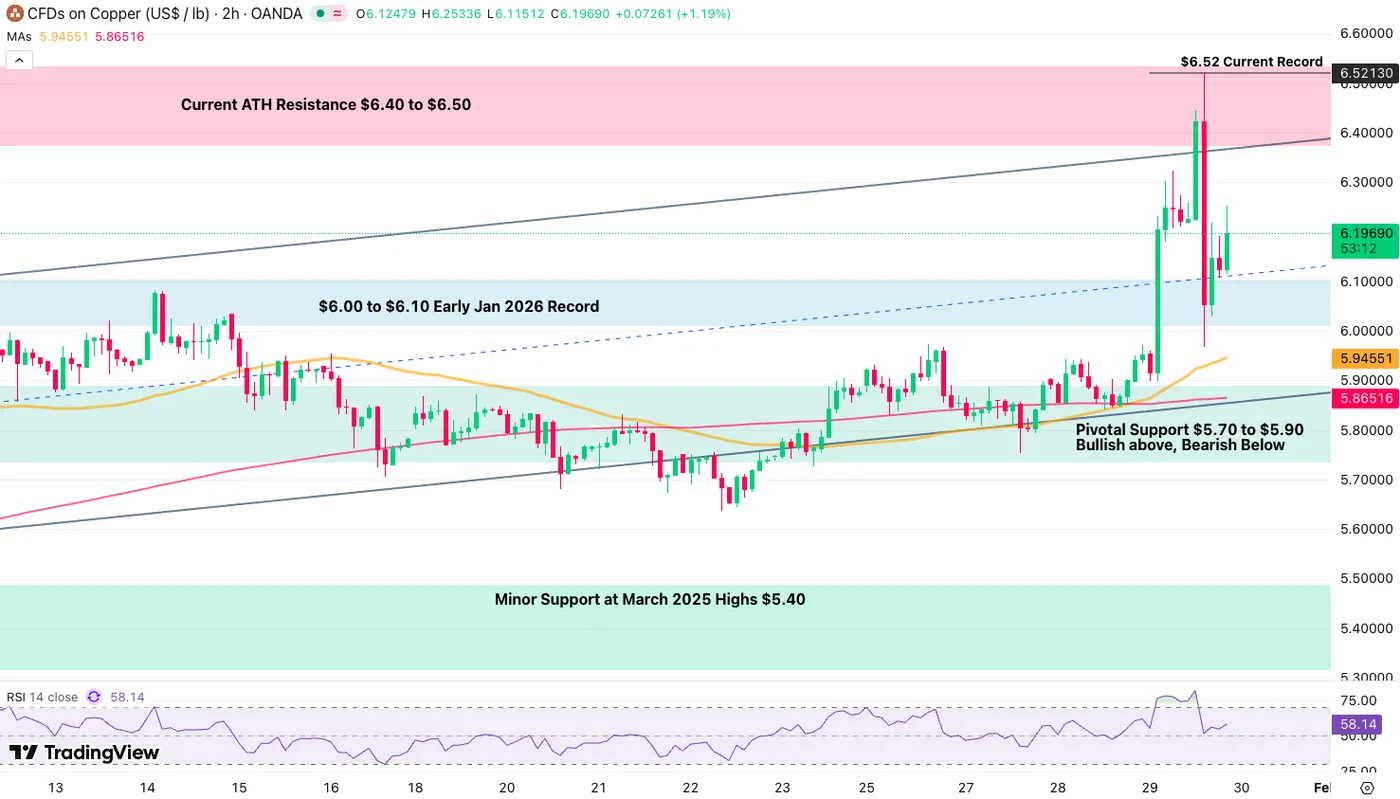
Copper (XCU/USD) 2H Chart, January 29, 2026 – Source: TradingView
The recent moves are not particularly indicative of a trend-end but recent up and down action may precede doubts to the sustainability of the recent moves.
Copper spiked by 10% during overnight trading, corrects by a similar amount and is now holding tight at its January 14 record range ($6.00 to $6.10 Major Pivot).
- Holding above the Pivot keeps the trend intact and could lead to further highs with the next step between $6.90 to $7.00.
- Closing below the pivot would hint at a test of the $5.70 to $5.90 pivotal support.
Any close below the Pivotal support would compromise the uptrend.
Current ATH Resistance $6.40 to $6.50
Higher Timeframe Levels to watch for Copper (XCU/USD):
Resistance Levels:
- Current ATH Resistance $6.40 to $6.50
- $6.52 Current Record
- Potential Resistance $6.90 to $7.00
Support Levels:
- $6.00 to $6.10 Early Jan 2026 Record
- Pivotal Support $5.70 to $5.90 – Bullish above, Bearish Below
- Minor Support at March 2025 Highs $5.40
- Major Monthly Support between $4.90 to $5.00 (50-Week MA)
Watch out for positioning and fast-paced moves!
January is already coming to an end and it has historically been the best month for Gold, Silver and Platinum. Keep a close eye to see if the rally holds the colder February ahead.
Safe Trades!
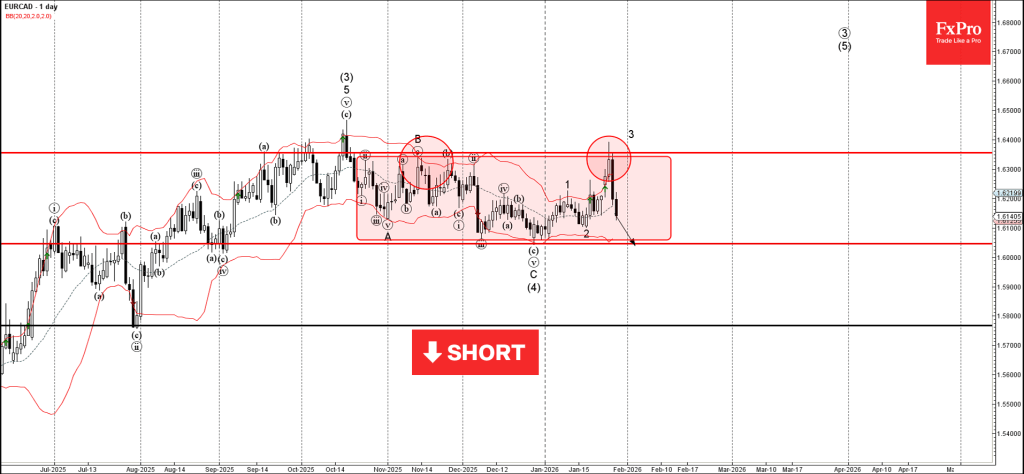
EURCAD Wave Analysis
EURCAD: ⬇️ Sell
- EURCAD reversed from resistance area
- Likely to fall to support level 1.6045
EURCAD currency pair recently reversed from the resistance area between the strong resistance level 1.63549 (upper border of the sideways price range inside which the price has been trading from October), and the upper daily Bollinger Band.
The downward reversal from this resistance area created the daily Japanese candlesticks reversal pattern Bearish Engulfing.
EURCAD currency pair can be expected to fall to the next support level 1.6045 (which stopped the previous intermediate correction (4)).
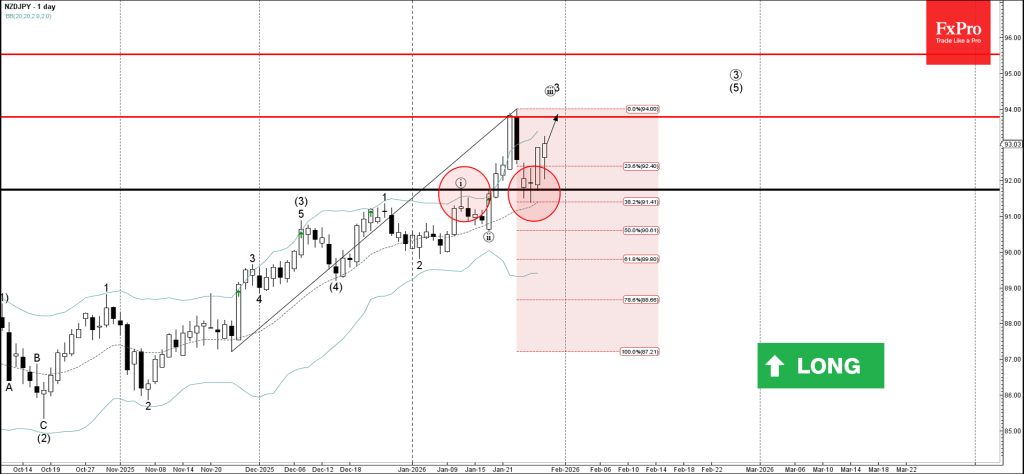
NZDJPY Wave Analysis
NZDJPY: ⬆️ Buy
- NZDJPY reversed from support area
- Likely to rise to resistance level 93.80
NZDJPY currency pair recently reversed from the support area between the key support level 91.75 (former top of wave i from the start of January), 20-day moving average and the 38.2% Fibonacci correction of the upward impulse from November.
The upward reversal from this support area continues the active impulse waves iii, 3 and (5).
Given the strong daily uptrend and continuation of the widespread yen sales, NZDJPY currency pair can be expected to rise further to the next resistance level 93.80 (which reversed the price earlier this month).
Eco Data 1/30/26
| GMT | Ccy | Events | Act | Cons | Prev | Rev |
|---|---|---|---|---|---|---|
| 23:30 | JPY | Tokyo CPI Y/Y Jan | 1.50% | 2% | ||
| 23:30 | JPY | Tokyo CPI Core Y/Y Jan | 2.00% | 2.20% | 2.30% | |
| 23:30 | JPY | Tokyo CPI Core-Core Y/Y Jan | 2.00% | 2.30% | ||
| 23:30 | JPY | Unemployment Rate Dec | 2.60% | 2.60% | 2.60% | |
| 23:50 | JPY | Industrial Production M/M Dec P | -0.10% | -0.40% | -2.70% | |
| 23:50 | JPY | Retail Trade Y/Y Dec | -0.90% | 0.70% | 1.00% | 1.10% |
| 00:30 | AUD | Private Sector Credit M/M Dec | 0.80% | 0.60% | 0.60% | |
| 00:30 | AUD | PPI Q/Q Q4 | 0.80% | 1.00% | 1.00% | |
| 00:30 | AUD | PPI Y/Y Q4 | 3.50% | 3.50% | ||
| 05:00 | JPY | Housing Starts Y/Y Dec | -1.30% | -4.10% | -8.50% | |
| 06:30 | EUR | France GDP Q/Q Q4 P | 0.20% | 0.20% | 0.50% | |
| 07:00 | EUR | Germany Import Price M/M Dec | -0.10% | -0.40% | 0.50% | |
| 08:00 | CHF | KOF Economic Barometer Jan | 102.5 | 103.2 | 103.4 | 103.6 |
| 08:55 | EUR | Germany Unemployment Rate Dec | 6.30% | 6.30% | 6.30% | |
| 08:55 | EUR | Germany Unemployment Change Dec | 0K | 5K | 3K | |
| 09:00 | EUR | Germany GDP Q/Q Q4 P | 0.30% | 0.20% | 0.00% | |
| 09:30 | GBP | Mortgage Approvals Dec | 61K | 65K | 65K | |
| 09:30 | GBP | M4 Money Supply M/M Dec | 0.30% | 0.30% | 0.80% | |
| 10:00 | EUR | Eurozone GDP Q/Q Q4 P | 0.30% | 0.20% | 0.30% | |
| 10:00 | EUR | Eurozone Unemployment Rate Dec | 6.20% | 6.30% | 6.30% | |
| 13:00 | EUR | Germany CPI M/M Jan P | 0.10% | 0.00% | 0.00% | |
| 13:00 | EUR | Germany CPI Y/Y Jan P | 2.10% | 2.20% | 1.80% | |
| 13:30 | CAD | GDP M/M Nov | 0.00% | 0.10% | -0.30% | |
| 13:30 | USD | PPI M/M Dec | 0.50% | 0.20% | 0.20% | |
| 13:30 | USD | PPI Y/Y Dec | 3.00% | 2.70% | 3.00% | |
| 14:45 | USD | Chicago PMI Jan | 54 | 43 | 43.5 |
| 23:30 | JPY |
| Tokyo CPI Y/Y Jan | |
| Actual | 1.50% |
| Consensus | |
| Previous | 2% |
| 23:30 | JPY |
| Tokyo CPI Core Y/Y Jan | |
| Actual | 2.00% |
| Consensus | 2.20% |
| Previous | 2.30% |
| 23:30 | JPY |
| Tokyo CPI Core-Core Y/Y Jan | |
| Actual | 2.00% |
| Consensus | |
| Previous | 2.30% |
| 23:30 | JPY |
| Unemployment Rate Dec | |
| Actual | 2.60% |
| Consensus | 2.60% |
| Previous | 2.60% |
| 23:50 | JPY |
| Industrial Production M/M Dec P | |
| Actual | -0.10% |
| Consensus | -0.40% |
| Previous | -2.70% |
| 23:50 | JPY |
| Retail Trade Y/Y Dec | |
| Actual | -0.90% |
| Consensus | 0.70% |
| Previous | 1.00% |
| Revised | 1.10% |
| 00:30 | AUD |
| Private Sector Credit M/M Dec | |
| Actual | 0.80% |
| Consensus | 0.60% |
| Previous | 0.60% |
| 00:30 | AUD |
| PPI Q/Q Q4 | |
| Actual | 0.80% |
| Consensus | 1.00% |
| Previous | 1.00% |
| 00:30 | AUD |
| PPI Y/Y Q4 | |
| Actual | 3.50% |
| Consensus | |
| Previous | 3.50% |
| 05:00 | JPY |
| Housing Starts Y/Y Dec | |
| Actual | -1.30% |
| Consensus | -4.10% |
| Previous | -8.50% |
| 06:30 | EUR |
| France GDP Q/Q Q4 P | |
| Actual | 0.20% |
| Consensus | 0.20% |
| Previous | 0.50% |
| 07:00 | EUR |
| Germany Import Price M/M Dec | |
| Actual | -0.10% |
| Consensus | -0.40% |
| Previous | 0.50% |
| 08:00 | CHF |
| KOF Economic Barometer Jan | |
| Actual | 102.5 |
| Consensus | 103.2 |
| Previous | 103.4 |
| Revised | 103.6 |
| 08:55 | EUR |
| Germany Unemployment Rate Dec | |
| Actual | 6.30% |
| Consensus | 6.30% |
| Previous | 6.30% |
| 08:55 | EUR |
| Germany Unemployment Change Dec | |
| Actual | 0K |
| Consensus | 5K |
| Previous | 3K |
| 09:00 | EUR |
| Germany GDP Q/Q Q4 P | |
| Actual | 0.30% |
| Consensus | 0.20% |
| Previous | 0.00% |
| 09:30 | GBP |
| Mortgage Approvals Dec | |
| Actual | 61K |
| Consensus | 65K |
| Previous | 65K |
| 09:30 | GBP |
| M4 Money Supply M/M Dec | |
| Actual | 0.30% |
| Consensus | 0.30% |
| Previous | 0.80% |
| 10:00 | EUR |
| Eurozone GDP Q/Q Q4 P | |
| Actual | 0.30% |
| Consensus | 0.20% |
| Previous | 0.30% |
| 10:00 | EUR |
| Eurozone Unemployment Rate Dec | |
| Actual | 6.20% |
| Consensus | 6.30% |
| Previous | 6.30% |
| 13:00 | EUR |
| Germany CPI M/M Jan P | |
| Actual | 0.10% |
| Consensus | 0.00% |
| Previous | 0.00% |
| 13:00 | EUR |
| Germany CPI Y/Y Jan P | |
| Actual | 2.10% |
| Consensus | 2.20% |
| Previous | 1.80% |
| 13:30 | CAD |
| GDP M/M Nov | |
| Actual | 0.00% |
| Consensus | 0.10% |
| Previous | -0.30% |
| 13:30 | USD |
| PPI M/M Dec | |
| Actual | 0.50% |
| Consensus | 0.20% |
| Previous | 0.20% |
| 13:30 | USD |
| PPI Y/Y Dec | |
| Actual | 3.00% |
| Consensus | 2.70% |
| Previous | 3.00% |
| 14:45 | USD |
| Chicago PMI Jan | |
| Actual | 54 |
| Consensus | 43 |
| Previous | 43.5 |
Gold Falls by 10%! Markets are going ablaze amid US-Iran War fears and post-FOMC flows
It was surprising to see such straightforward flows during a volatile period.
While black swans are unpredictable, the market's capacity to ignore risk until something breaks can be surprising.
So what changed in the past hour?
Metals rallied to new highs following Powell's press conference yesterday. The reaction was aggressive given the context. Powell highlighted US economic strength and defended Federal Reserve independence, factors that typically support the Dollar.
Explaining the post-FOMC surge was difficult as the rate pause was not dovish.
Yet, Gold rose 5% to $5,602, suggesting the debasement trade was spiraling. Recent volatility indicates otherwise.
Gold (CFD) 30m Chart – January 29, 2026 – Source: TradingView
Gold corrected by 10% from its highs, dragging Silver and Platinum lower. Copper remains the outlier, reaching new highs in today's session.
Is the uptrend over? Tough to say for now, but what's for sure is that up-and-down spikes have been getting more common as of late, indicating unstable Market conditions and potential changes in recent dynamics.
Seeing rangebound conditions here would make sense – On the bigger picture, watch for breakouts to today's session up and down levels to get an idea of where flows are heading.
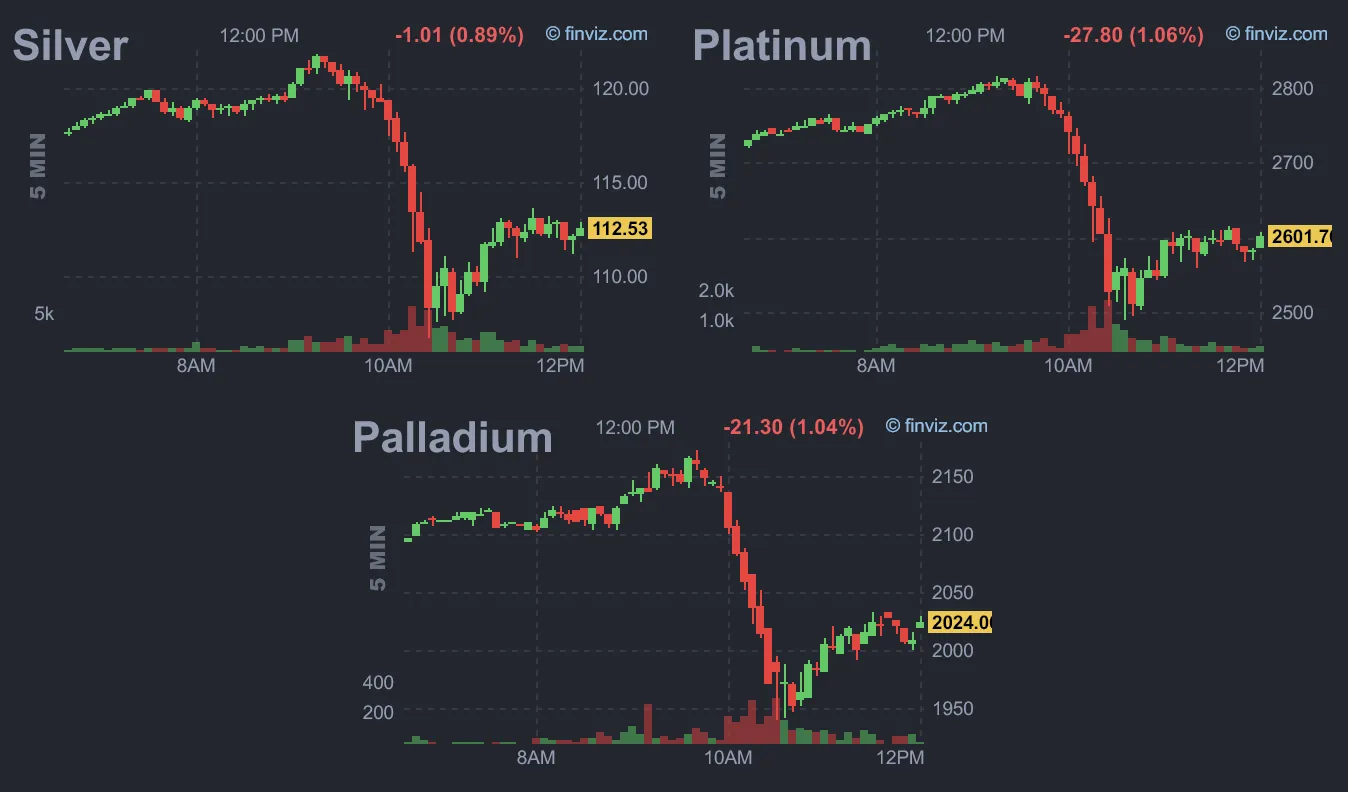
Morning Session moves in Metal Futures – Courtesy of Finviz
Stocks are also diving lower, particularly recent AI performers.
Disappointing Microsoft earnings dampened equity sentiment, sending the Nasdaq down 2.51% at its trough.
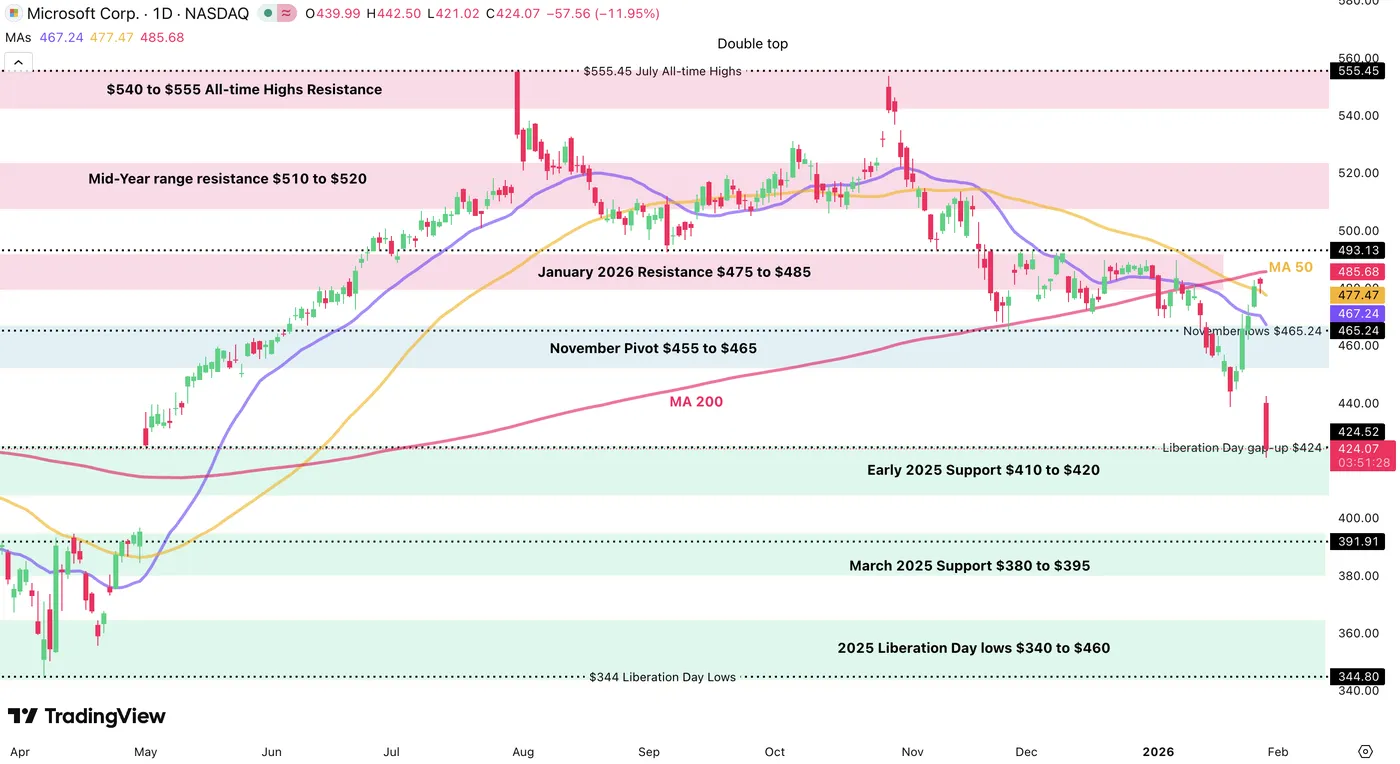 Microsoft (MSFT) Stock Daily Chart – Source: TradingView
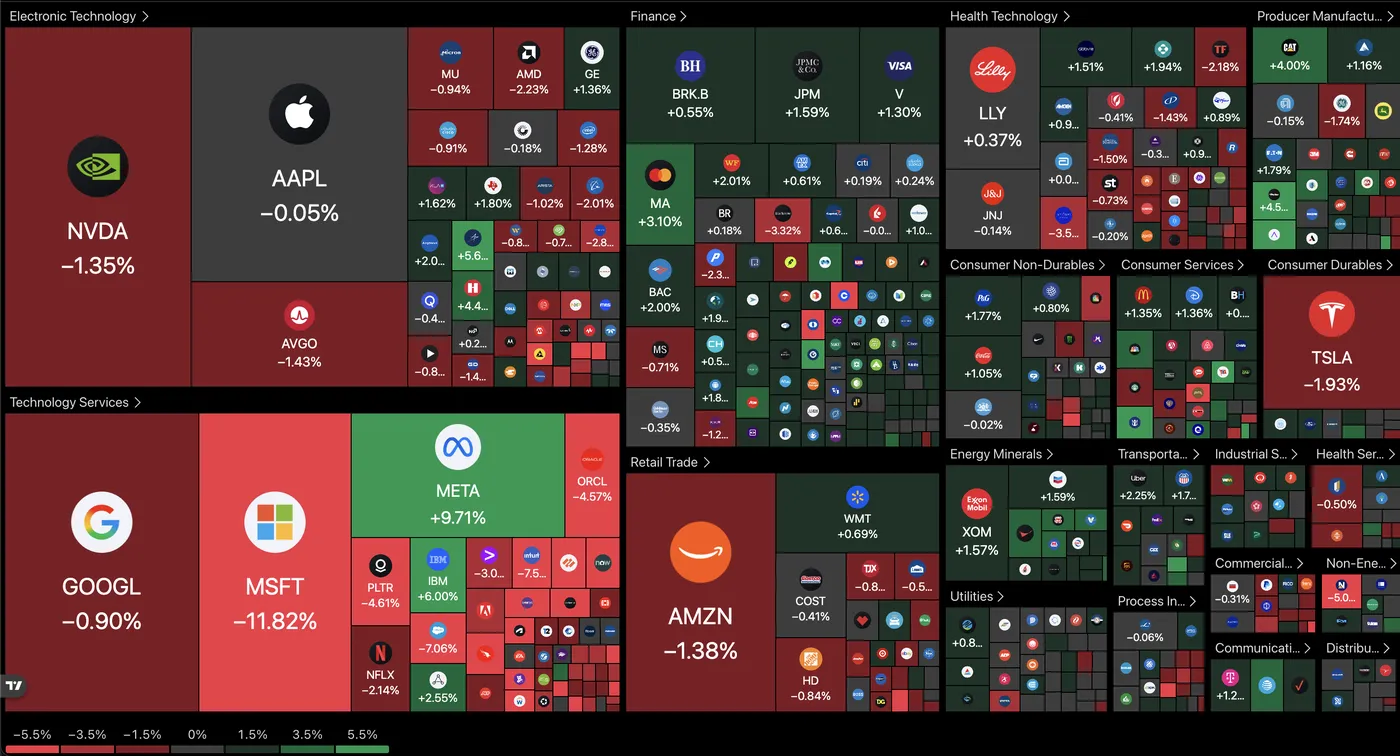
Current picture for the Stock Market (12:17 P.M. ET) – Source: TradingView – January 29, 2026
Nasdaq sold off harshly, rebounding slightly in the mid-session
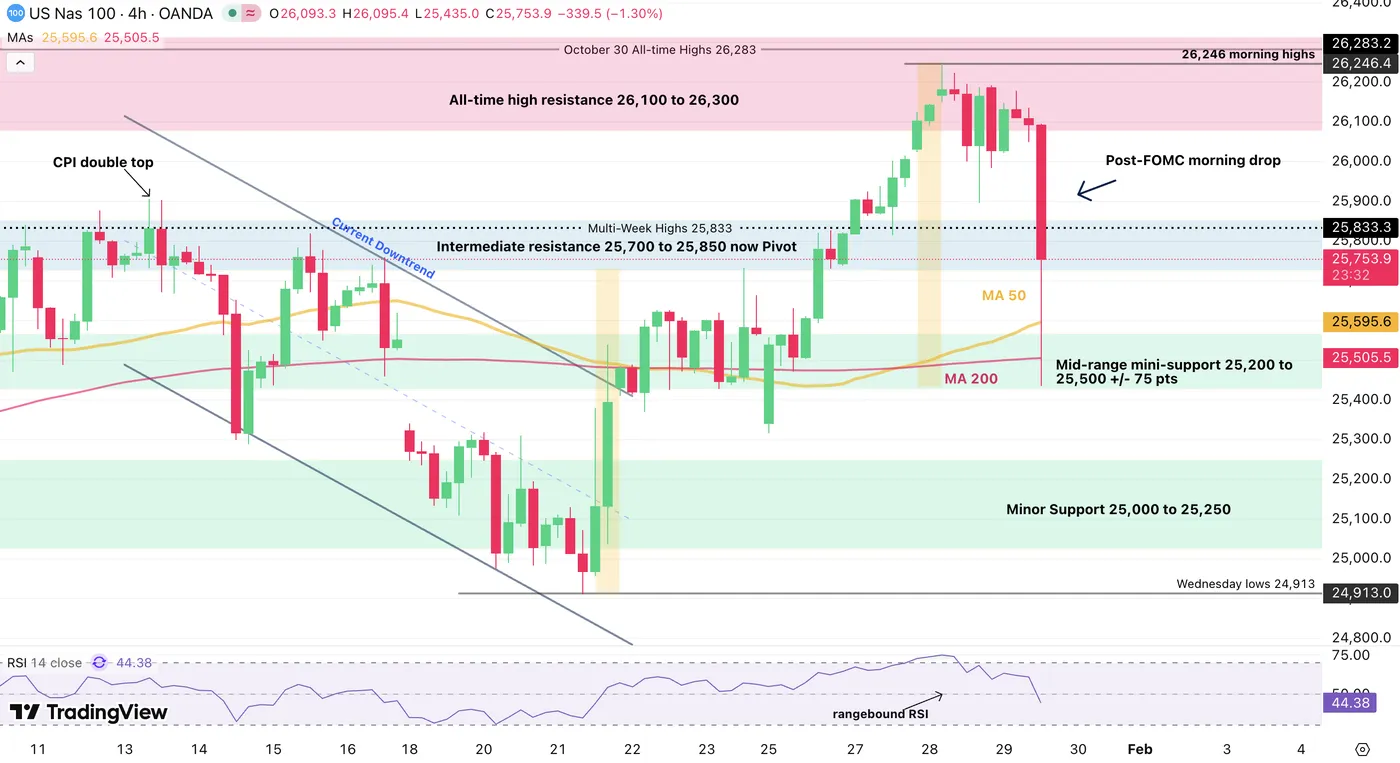
Nasdaq (CFD) 4H Chart – January 29, 2026 – Source: TradingView
The picture in equities isn't looking very bullish across different Benchmarks – Watch out for volatility in upcoming sessions ahead of Weekend risk.
The US Dollar doesn't know where to go
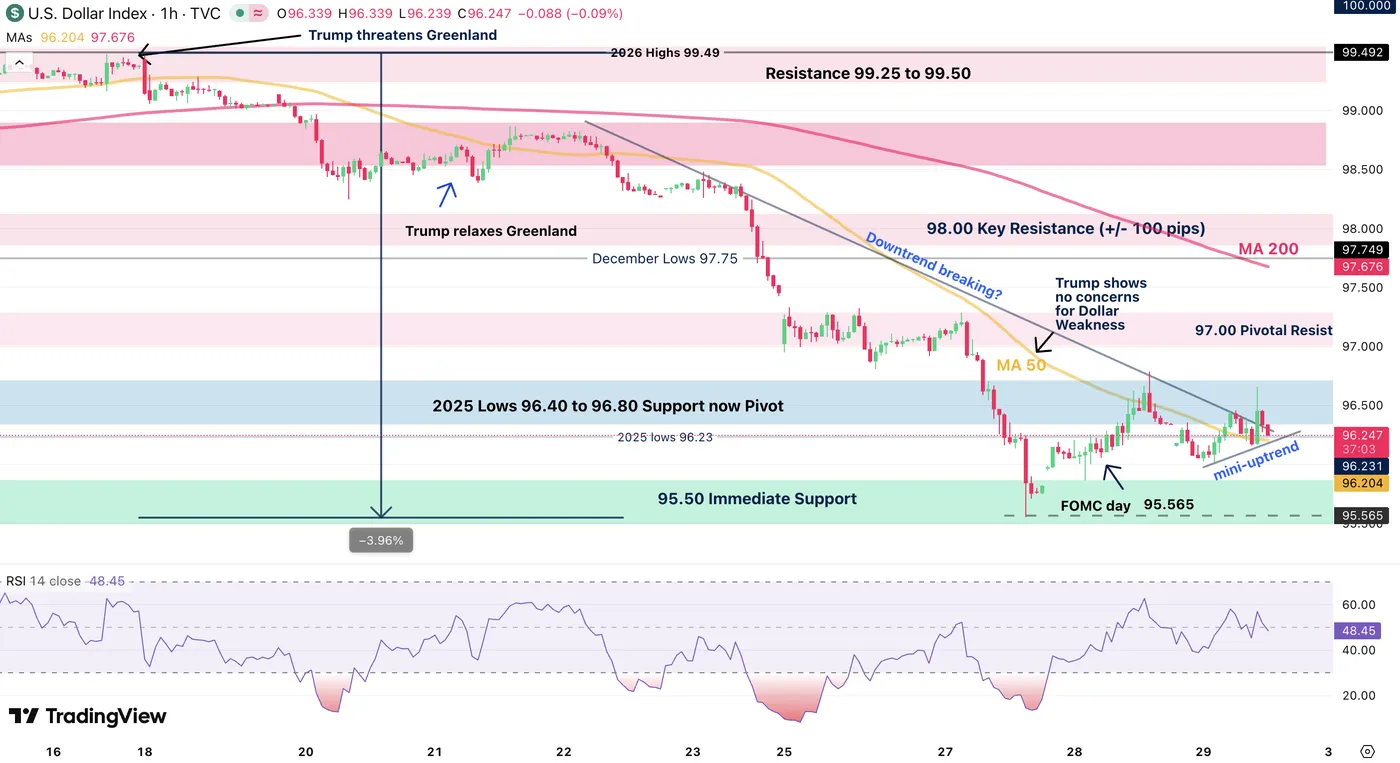
US Dollar (DXY) 1H Chart – Source: TradingView – January 29, 2026
While Oil flows might appear linked to Iran, a purely geopolitical driver would typically boost precious metals as safe havens.
The current correction appears driven by a confluence of risks: post-FOMC repositioning, Iran tensions, weak earnings, and anxiety regarding the next Fed Chair nomination.
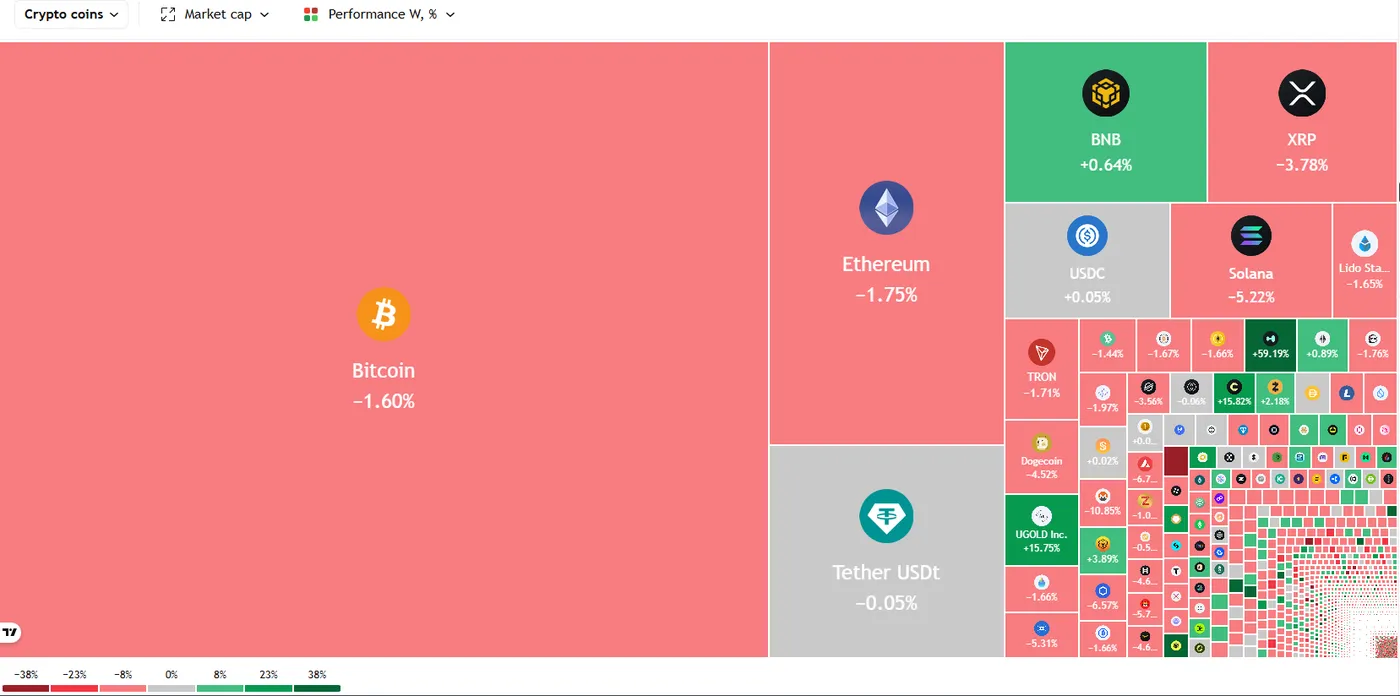
Cryptos are getting rejected harshly
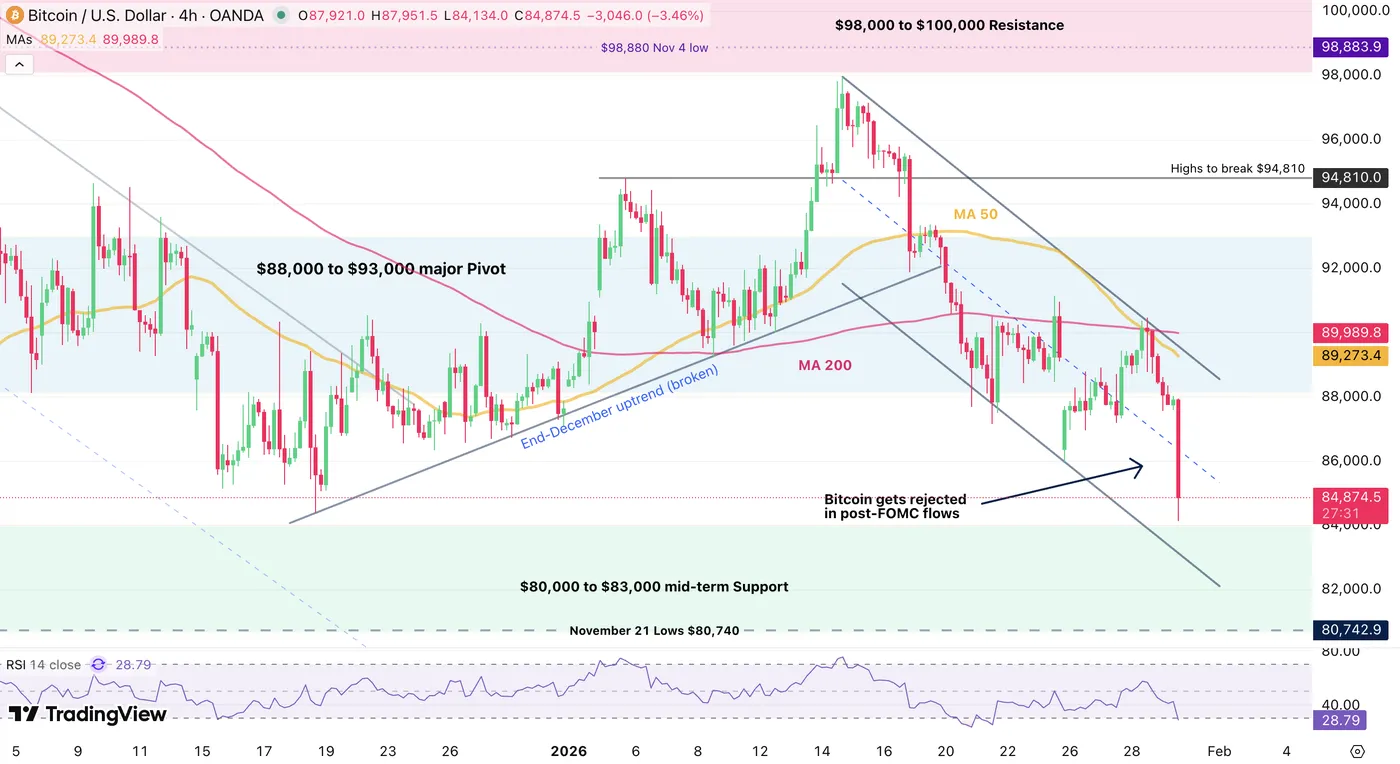
Bitcoin 4H Chart – January 29, 2026 – Source: Tradingview
Current bloodbath session in Crypto – Courtesy of Finviz
A detailed Crypto piece will be releasing soon.
Keep a very close eye on the headlines to monitor Market developments.
Safe Trades!
Bitcoin Under Price Pressure: (BTC/USD) Fails to Hold $88000 Level. Is a Recovery on the Way?
- Bitcoin (BTC/USD) is struggling below the $88,000 level and recently dipped under $85,000.
- The slump is attributed to institutional selloffs (>$160M in ETF outflows this week), the US Federal Reserve maintaining higher interest rates, and the strong performance of Gold as the preferred safe-haven asset.
- Key resistance is at $90,000, while a sustained drop below $85,000 opens the door to $80,000 and potentially $75,000.
Bitcoin is having a difficult start to the end of January. The world's most famous cryptocurrency is currently struggling to stay above $88,000.
For many market participants, this is a worrying sign, as the price has dropped from higher levels earlier in the week at a time when the US Dollar has reached four-year lows.
Looking at the week thus far and Bitcoin is only down around 1.6% at the time of writing. Given the volatility we are seeing across the board, this is surprising to say the least.
Why is Bitcoin struggling?
There are several main reasons why Bitcoin is feeling the pressure right now and perhaps one of the more surprising ones is Gold prices.
While Bitcoin is struggling, gold has been doing very well, reaching record highs over $5,500 an ounce. Investors looking for a "safe" place to hide from economic trouble are currently choosing gold over Bitcoin.
The precious metal is up over $1000 for the month of January alone.
For much of the past decade, Bitcoin proponents have championed the asset as "Digital Gold," arguing that its fixed supply and decentralized nature make it the ultimate hedge against geopolitical risk and inflation.
However, events in late January 2026 have proven that this isn't necessarily true. While gold prices have jumped to record highs, Bitcoin has been stuck in a slump, losing about 30% of its value since its peak in October. This suggests that Bitcoin isn't behaving like gold when things get rocky in the real world.
The question is will this dent the appetite of Bitcoin for a while longer as a hedge, particularly from the institutional side?
Bitcoin ETFs have seen a lot of money leaving lately. This week alone, about $160 million has been pulled out of these funds. When these big players sell, it puts downward pressure on the price.
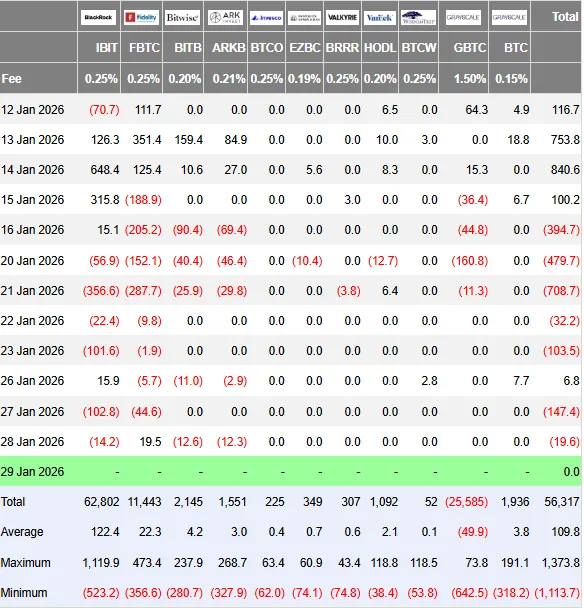
Source: Farside Investors
Whether this selloff leads to a more prolonged one remains to be seen and this could have a bearing on where Bitcoin prices head to next.
Another factor behind the recent malaise could be down to Wednesday's US Federal Reserve meeting. The Fed decided to keep interest rates the same (between 3.50% and 3.75%). While they didn't raise rates, they also didn't lower them.
The higher rate environment makes safety more appealing while also leaving the retail side of market participants with less disposable income to invest in the higher risk higher reward assets like Bitcoin.
What is the Outlook for the Future? The next few days will be very important for Bitcoin.
The Risk of a Bigger Drop: Some analysts warn that if the US government shutdown lasts a long time, Bitcoin could fall much further. If people continue to panic, the price might even slide toward $60,000. This would be a 30% drop from where it is now.
Looking at the technical picture and Bitcoin’s position as of January 29, 2026, is precarious. The asset has failed to consolidate above the $89,000 mark.
Earlier in the day we saw a broader market selloff with Bitcoin dropping below the $85000 mark, before recovering to trade at $85460 at the time of writing.
The drop also means that Bitcoin is now around $3000 below the 50-day MA which rests at $88678.
The period-14 RSI on the four-hour chart also dipped into oversold territory but is attempting to move back above the key 30-level. A move back above may be seen as a sign that bullish momentum may be returning.
If that is the case it will be interesting to see if bulls have the power to push beyond the $90000 which has held price back since Tuesday January 20, 2026.
A clean and sustained break above the $90000 level is needed and even then there is a host of resistance beyond that which has proven difficult to navigate for Bitcoin in recent months.
The $95000-$97000 range in particular has been tough and will likely be so once again if bulls are able to take charge.
However, a four-hour candle close below the $85000 handle does open up a potential run toward $80000 and then the $75000 and $60000 mark.
Bitcoin (BTC/USD) Four-Hour Chart, January 29, 2026
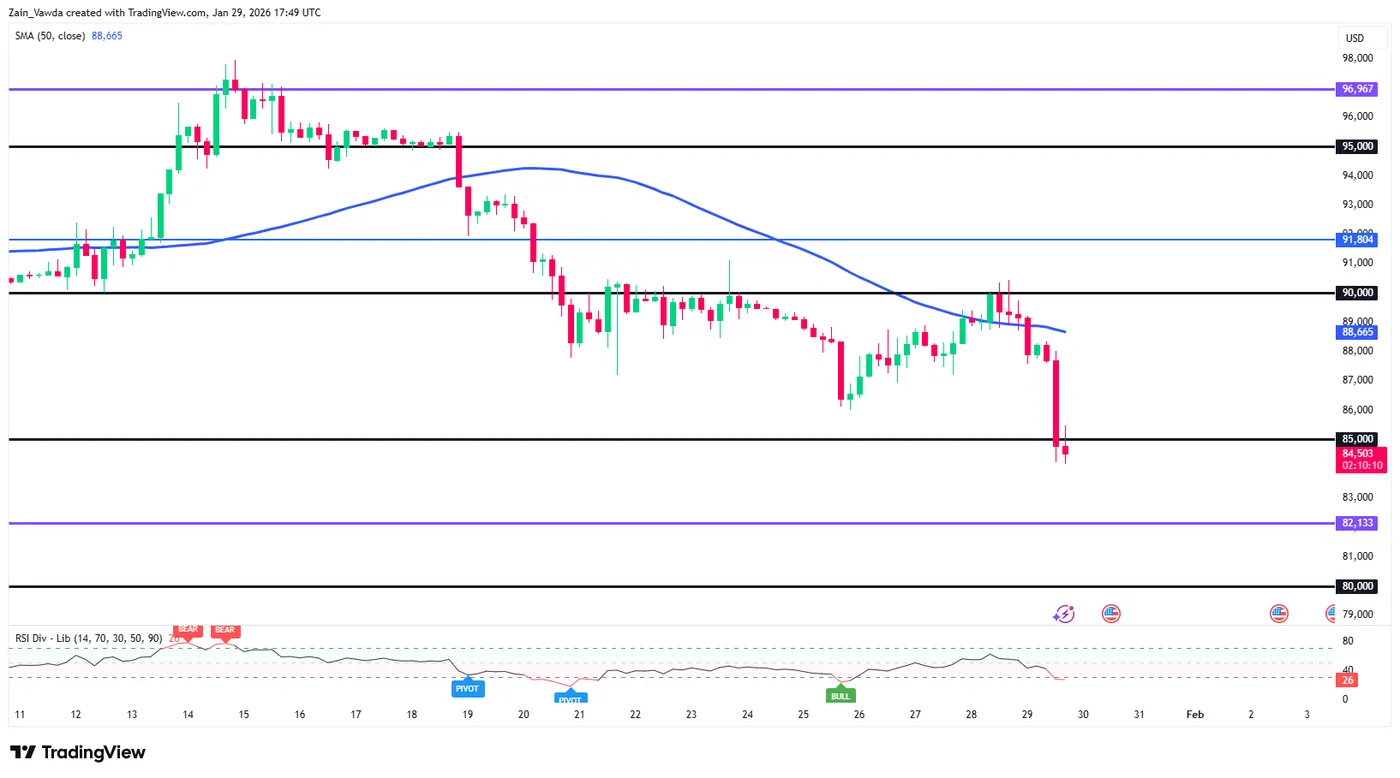
Source: TradingView.com (click to enlarge)